Embed Size (px)
Citation preview
Medicaid Integrated Care Medicaid Integrated Care Management and ROIManagement and ROI
AcademyHealth Research MeetingAcademyHealth Research MeetingJune 4, 2007
Peter J. Fagan PhDPeter J. Fagan PhDSupported by a grant from the Center for Health Care Strategies
through a Grant from the Robert Wood Johnson Foundation
(c) Johns Hopkins HealthCare LLC
CoCo--investigatorsinvestigatorsLinda Dunbar, PhDMartha Sylvia, RN, MSN, MBAMichelle Hawkins, RN,MSN,MBA,CCM– Johns Hopkins HealthCare LLC
Care Management Department
Kenneth Stoller, M.D.– Johns Hopkins School of Medicine
Department of Psychiatry and Behavioral Sciences
Michael Griswold, PhD– Johns Hopkins Bloomberg School of Public Health
Department of Biostatistics
(c) Johns Hopkins HealthCare LLC
Thanks to our CHCS TeamThanks to our CHCS TeamRoxanne BatterdenWondella BrooksPeggy Buresh Donald ClaxtonSherrie Cohen Liz FerrugiaHoward GarberSheree GordonAlan Grant Erica JonesMicki Jones
Suzanne KerpetenogluJanet KoelschValerie KirklandCristina LawrenceMarlana NeumannSarah Newsome Paula NormanSallie PaigeMartin RaffelJoanne ReaseLaurie RussellDave Wagner
(c) Johns Hopkins HealthCare LLC
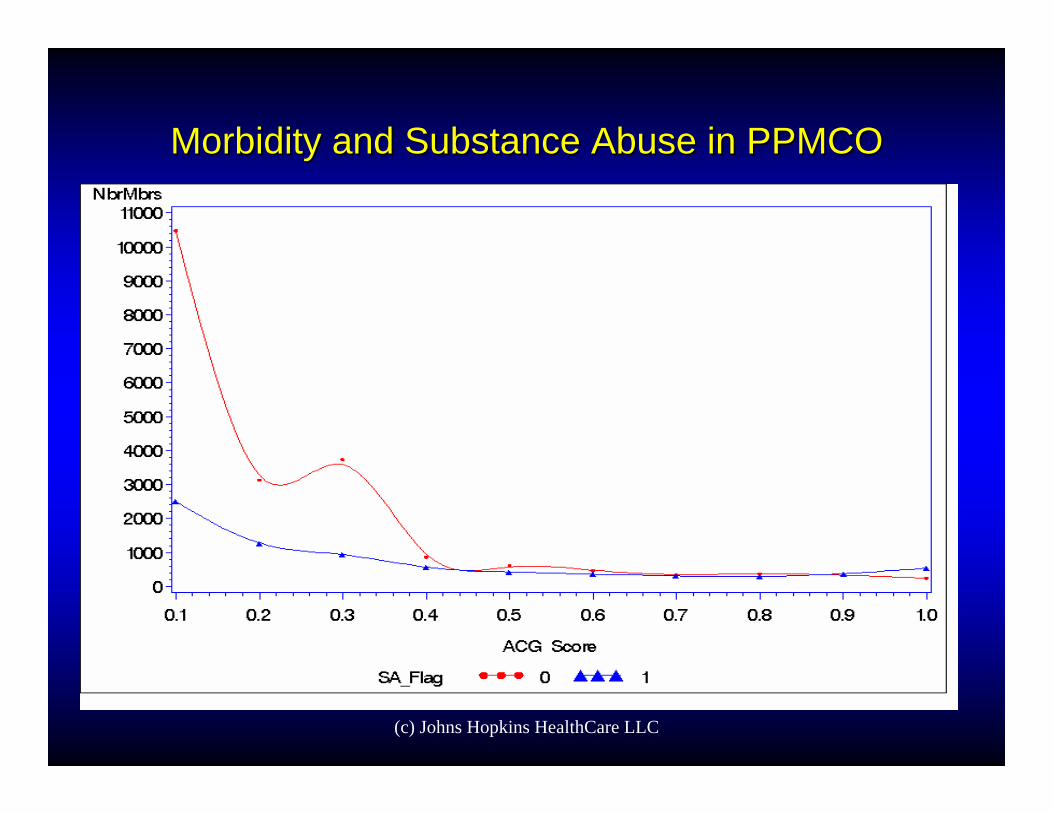
Morbidity and Substance Abuse in PPMCOMorbidity and Substance Abuse in PPMCO
(c) Johns Hopkins HealthCare LLC
Project goals for Medicaid PlanProject goals for Medicaid Plan
Facilitate access of enrollees with high risk medical and history of substance abuse into SA treatment and promote retention in program
Enroll the participants in appropriate Disease Management (DM) or Case Management (CM) program
Track start-up and operational expenses of care management initiative
(c) Johns Hopkins HealthCare LLC
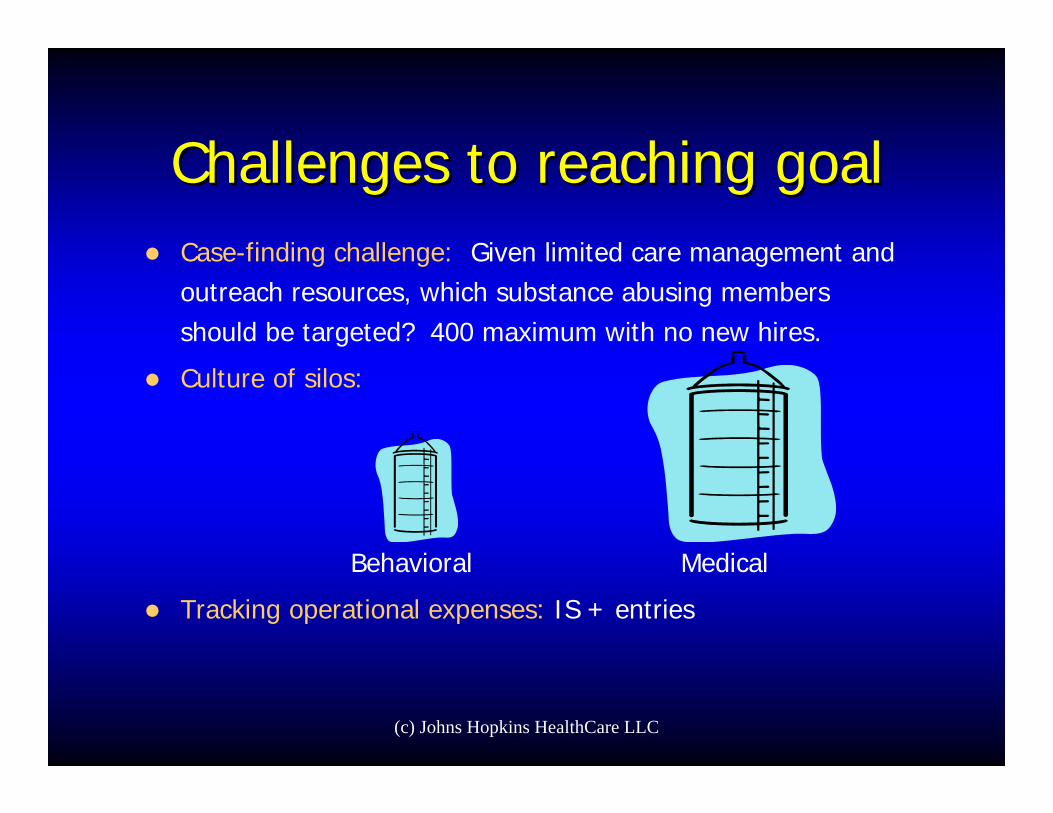
Challenges to reaching goalChallenges to reaching goalCase-finding challenge: Given limited care management and outreach resources, which substance abusing members should be targeted? 400 maximum with no new hires.
Culture of silos:
Behavioral Medical
Tracking operational expenses: IS + entries
(c) Johns Hopkins HealthCare LLC
Intervention GroupIntervention GroupN = 400, => 21yrs, living in Baltimore City, Baltimore Co. or Prince Georges Co.
Substance abuse disorder history
ACG-PM score => 0.39. Selected highest 16% of possible 2,485.
Excluded: HIV/AIDS, Pregnancy, End Stage Renal Disease, End of Life because already in specialized DM program and did not want to disrupt current program.
(c) Johns Hopkins HealthCare LLC
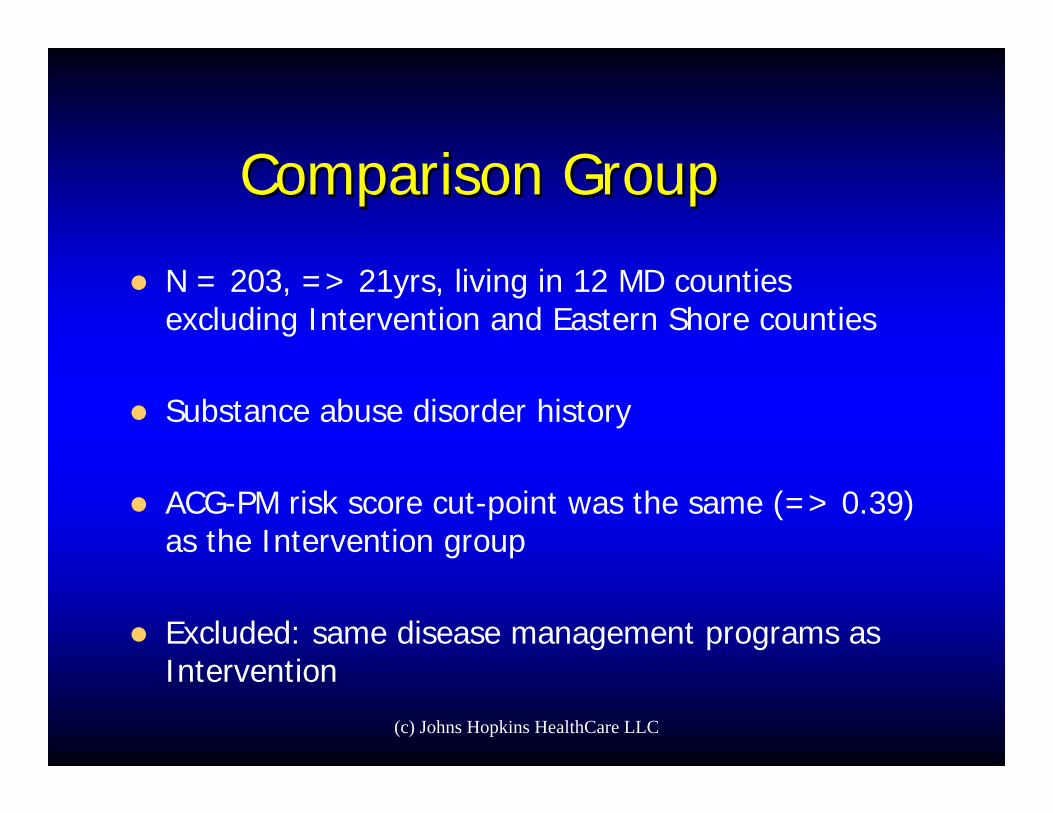
Comparison GroupComparison Group
N = 203, => 21yrs, living in 12 MD counties excluding Intervention and Eastern Shore counties
Substance abuse disorder history
ACG-PM risk score cut-point was the same (=> 0.39) as the Intervention group
Excluded: same disease management programs as Intervention
(c) Johns Hopkins HealthCare LLC
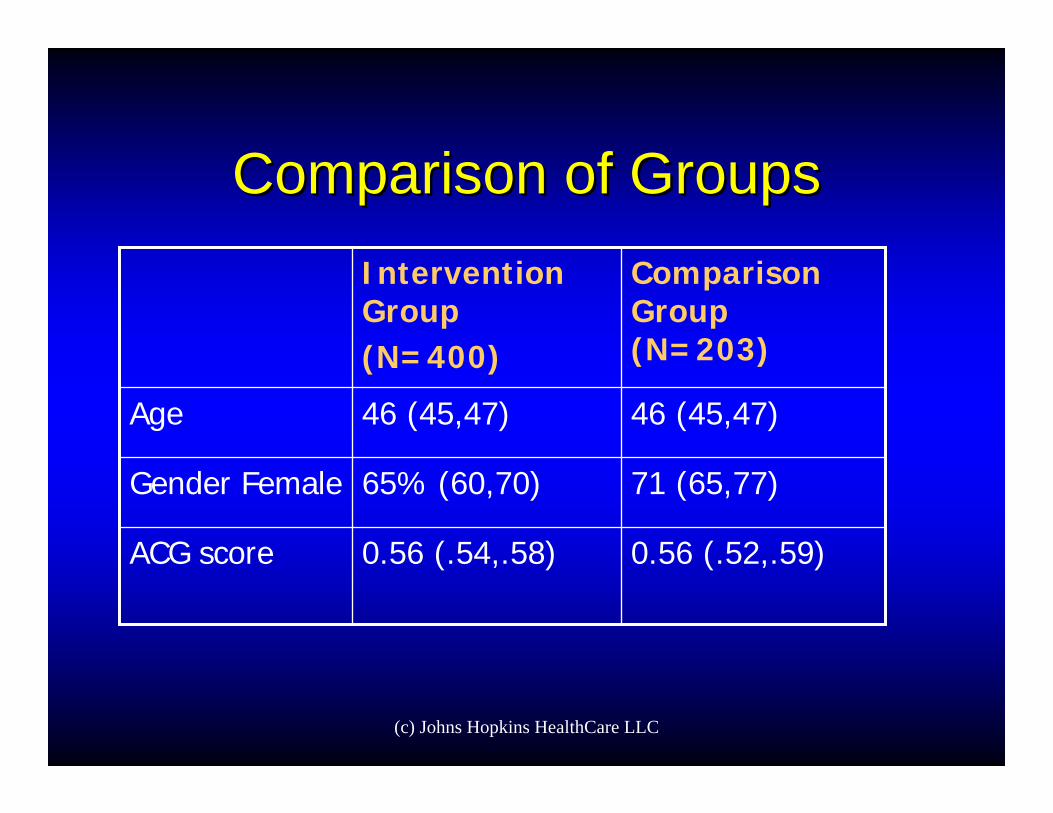
0.56 (.52,.59)0.56 (.54,.58)ACG score
71 (65,77)65% (60,70)Gender Female
46 (45,47)46 (45,47)Age
Comparison Group (N=203)
Intervention Group (N=400)
Comparison of GroupsComparison of Groups
(c) Johns Hopkins HealthCare LLC
Targeted population, now Targeted population, now whatwhat……??
(c) Johns Hopkins HealthCare LLC
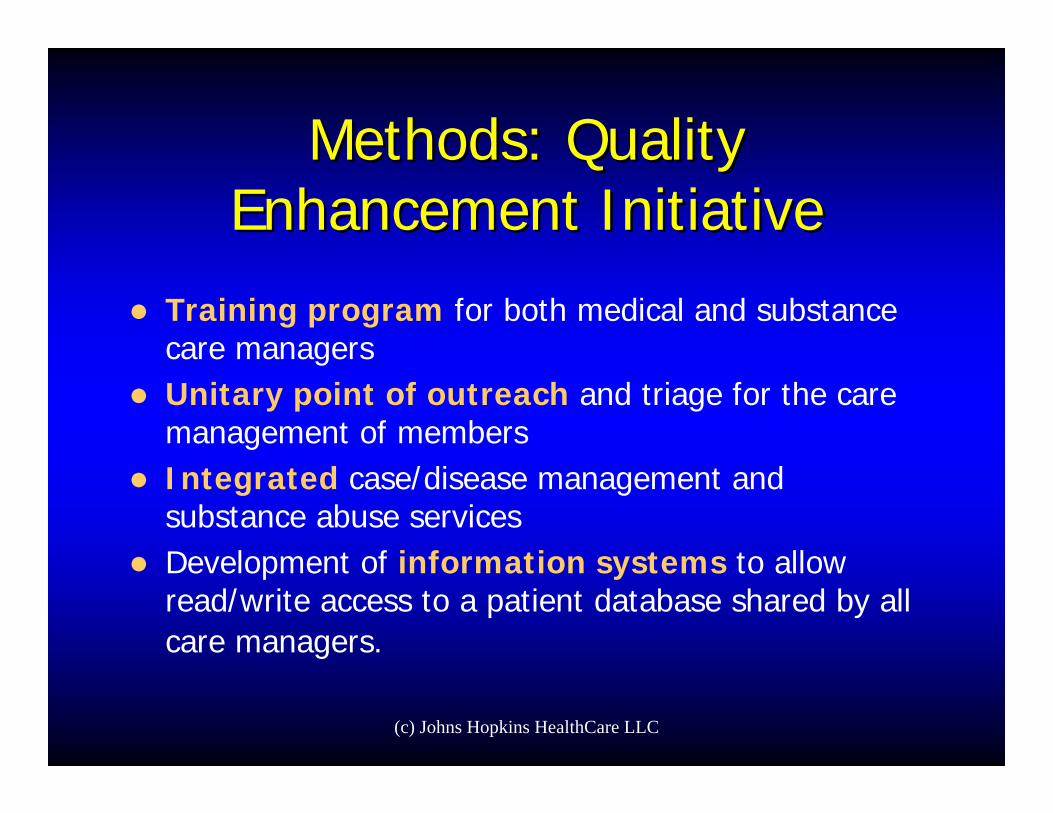
Methods: Quality Methods: Quality Enhancement InitiativeEnhancement Initiative
Training program for both medical and substance care managersUnitary point of outreach and triage for the care management of membersIntegrated case/disease management and substance abuse servicesDevelopment of information systems to allow read/write access to a patient database shared by all care managers.
(c) Johns Hopkins HealthCare LLC
Results?Results?
(c) Johns Hopkins HealthCare LLC
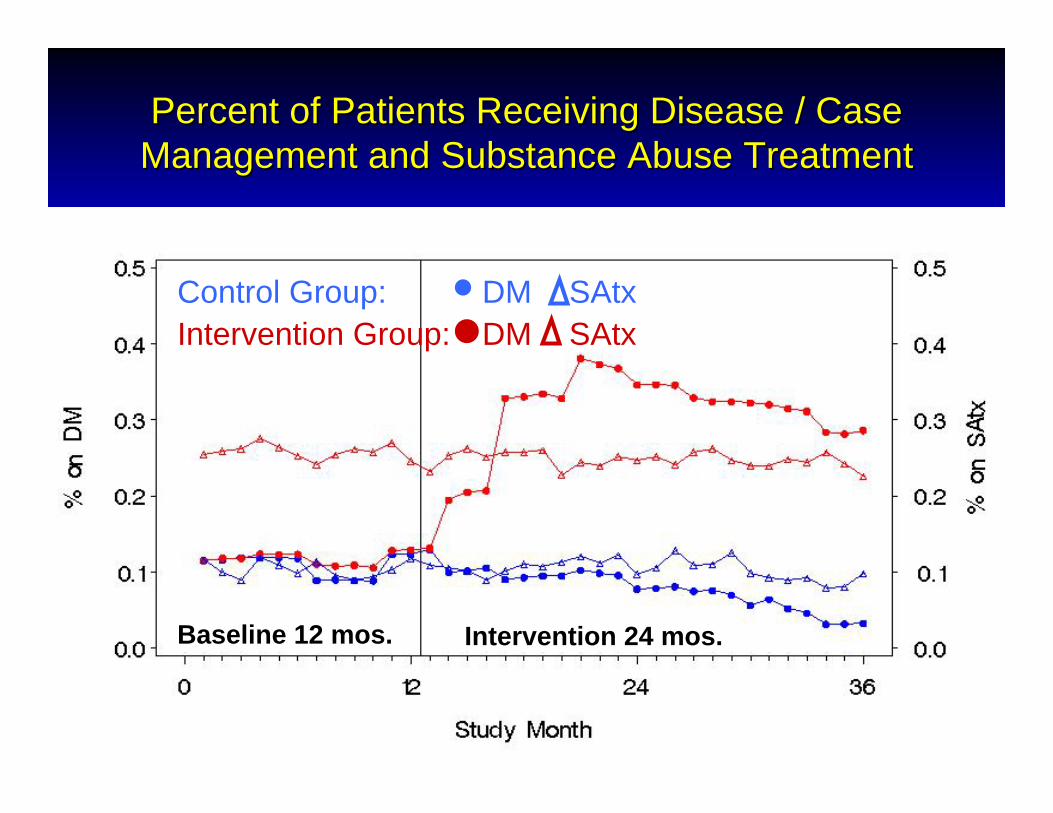
Percent of Patients Receiving Disease / Case Percent of Patients Receiving Disease / Case Management and Substance Abuse TreatmentManagement and Substance Abuse Treatment
Control Group: DM SAtxIntervention Group: DM SAtx
Baseline 12 mos. Intervention 24 mos.
(c) Johns Hopkins HealthCare LLC
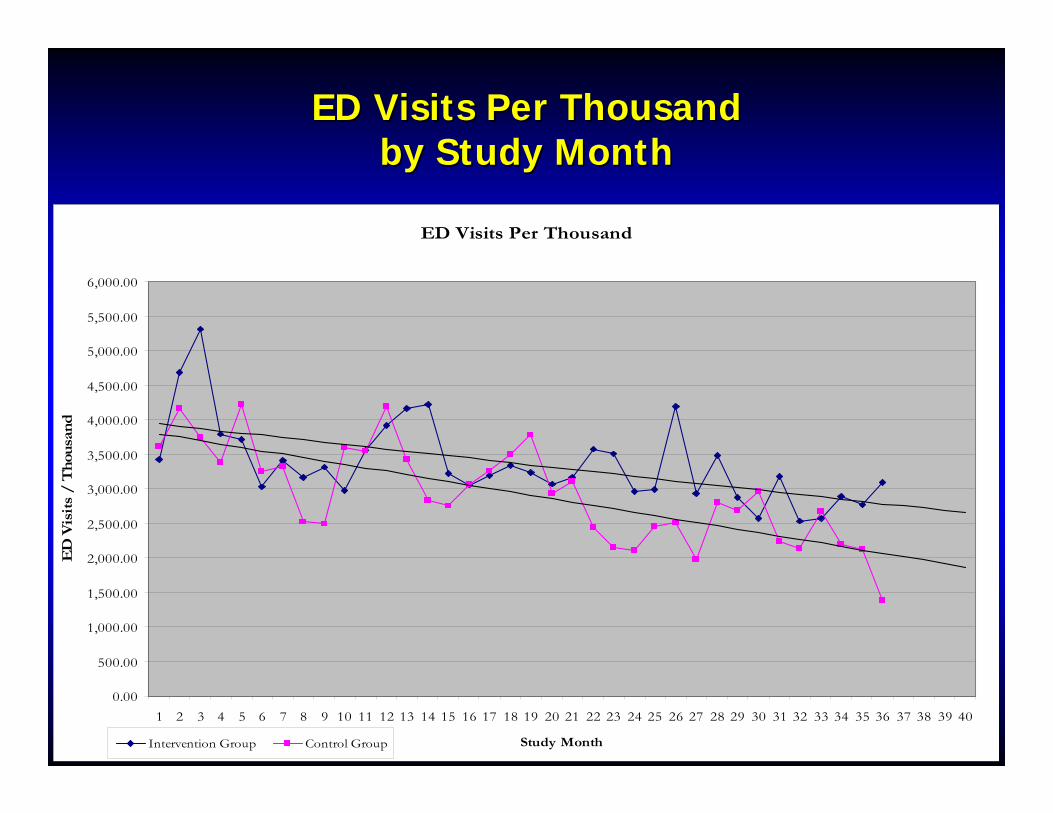
ED Visits Per ThousandED Visits Per Thousandby Study Monthby Study Month
ED Visits Per Thousand
0.00
500.00
1,000.00
1,500.00
2,000.00
2,500.00
3,000.00
3,500.00
4,000.00
4,500.00
5,000.00
5,500.00
6,000.00
1 2 3 4 5 6 7 8 9 10 11 12 13 14 15 16 17 18 19 20 21 22 23 24 25 26 27 28 29 30 31 32 33 34 35 36 37 38 39 40
Study Month
ED
Vis
its
/ T
hou
sand
Intervention Group Control Group
(c) Johns Hopkins HealthCare LLC
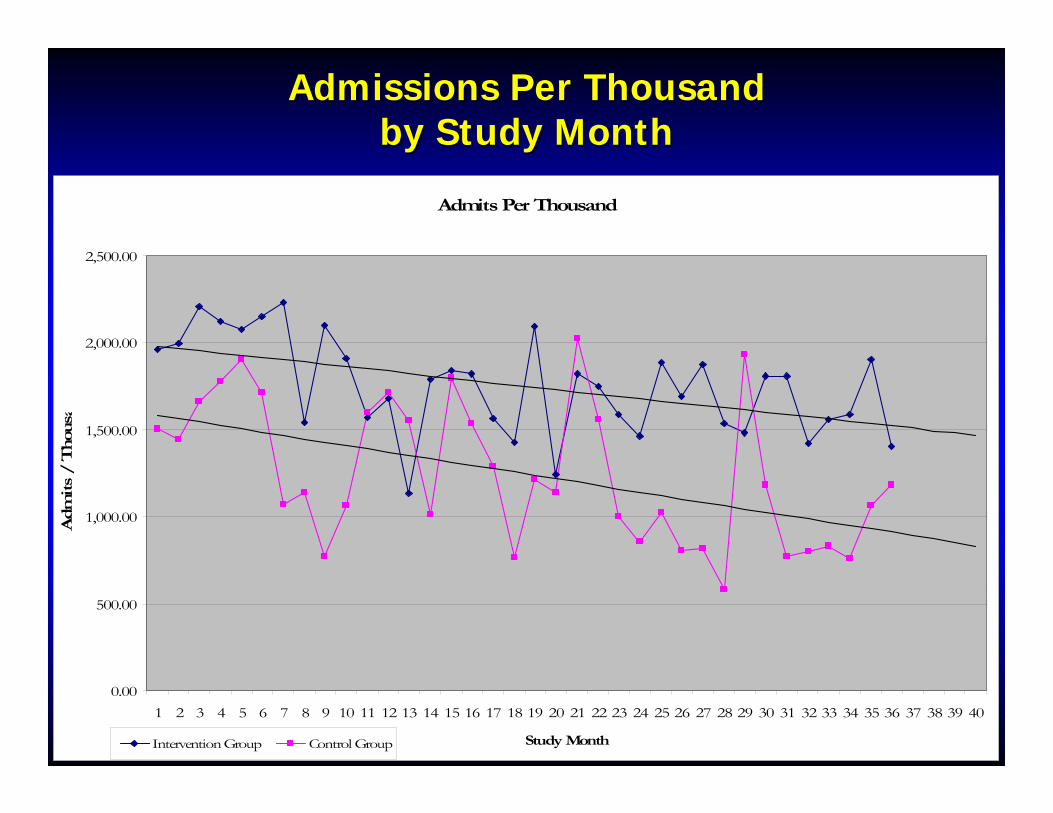
Admissions Per ThousandAdmissions Per Thousandby Study Monthby Study Month
Admits Per Thousand
0.00
500.00
1,000.00
1,500.00
2,000.00
2,500.00
1 2 3 4 5 6 7 8 9 10 11 12 13 14 15 16 17 18 19 20 21 22 23 24 25 26 27 28 29 30 31 32 33 34 35 36 37 38 39 40
Study Month
Adm
its
/ T
hou
sa
Intervention Group Control Group
(c) Johns Hopkins HealthCare LLC
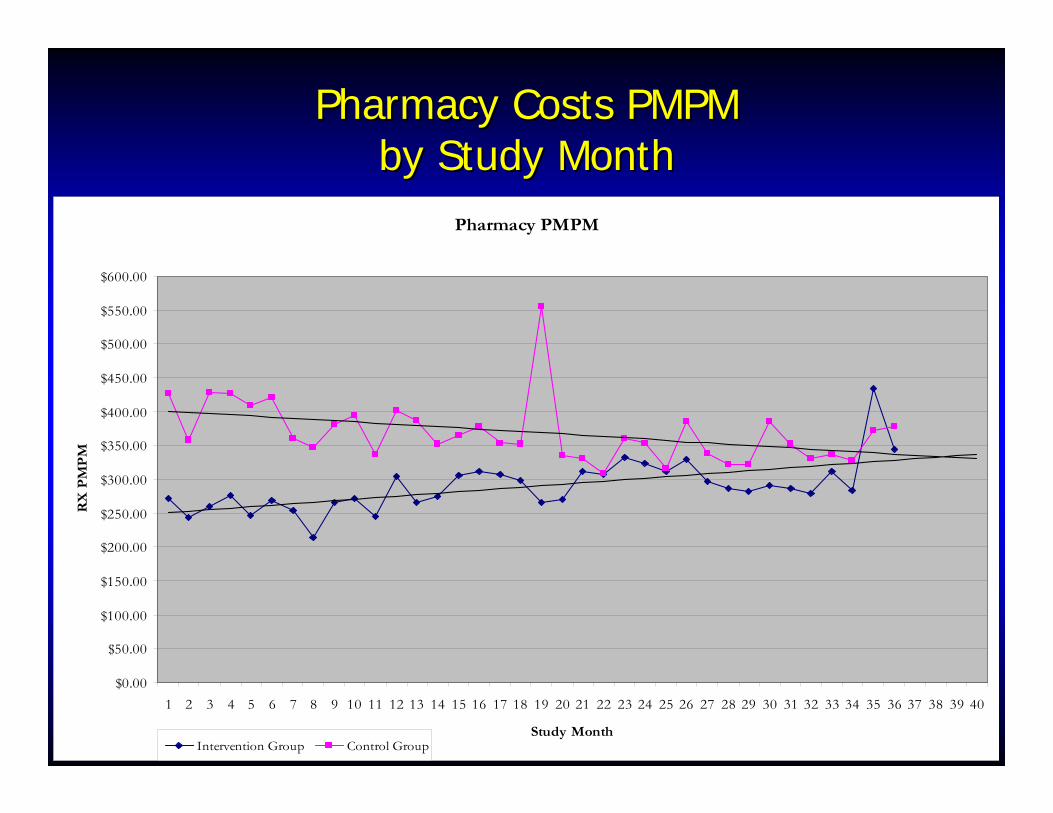
Pharmacy Costs PMPMPharmacy Costs PMPMby Study Monthby Study Month
Pharmacy PMPM
$0.00
$50.00
$100.00
$150.00
$200.00
$250.00
$300.00
$350.00
$400.00
$450.00
$500.00
$550.00
$600.00
1 2 3 4 5 6 7 8 9 10 11 12 13 14 15 16 17 18 19 20 21 22 23 24 25 26 27 28 29 30 31 32 33 34 35 36 37 38 39 40
Study Month
RX
PM
PM
Intervention Group Control Group
(c) Johns Hopkins HealthCare LLC
Is there a return on Is there a return on investment?investment?
(c) Johns Hopkins HealthCare LLC
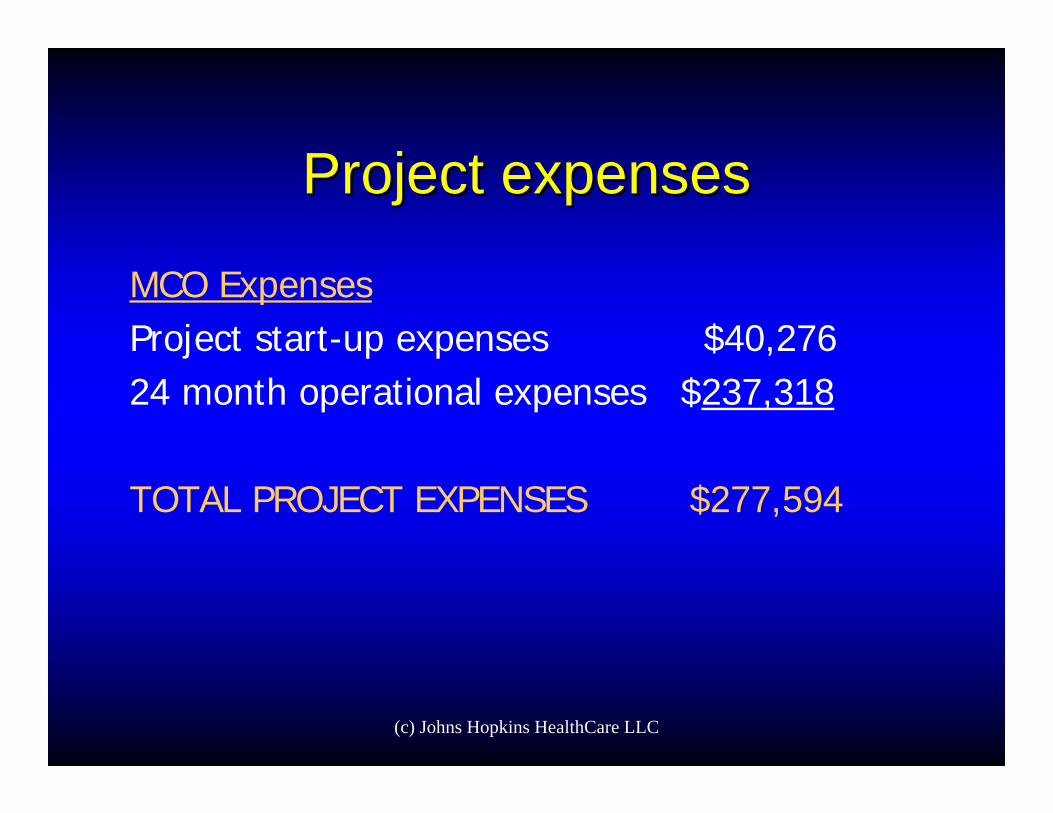
Project expensesProject expenses
MCO ExpensesProject start-up expenses $40,27624 month operational expenses $237,318
TOTAL PROJECT EXPENSES $277,594
(c) Johns Hopkins HealthCare LLC
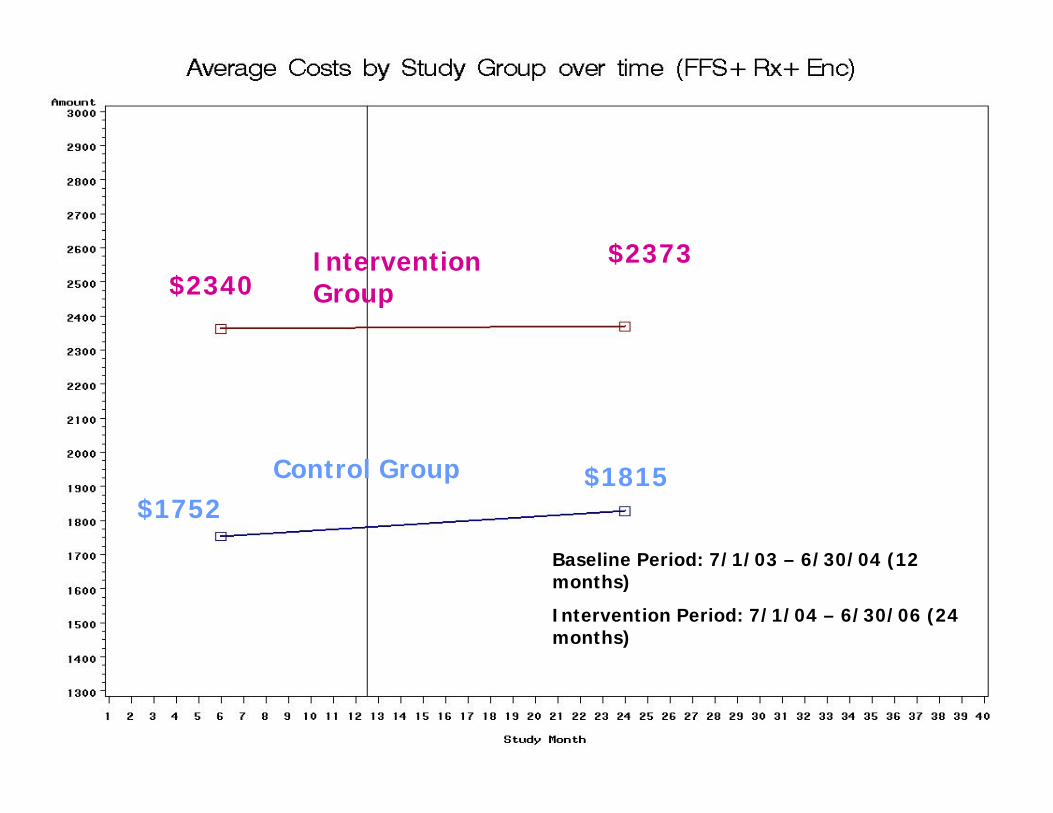
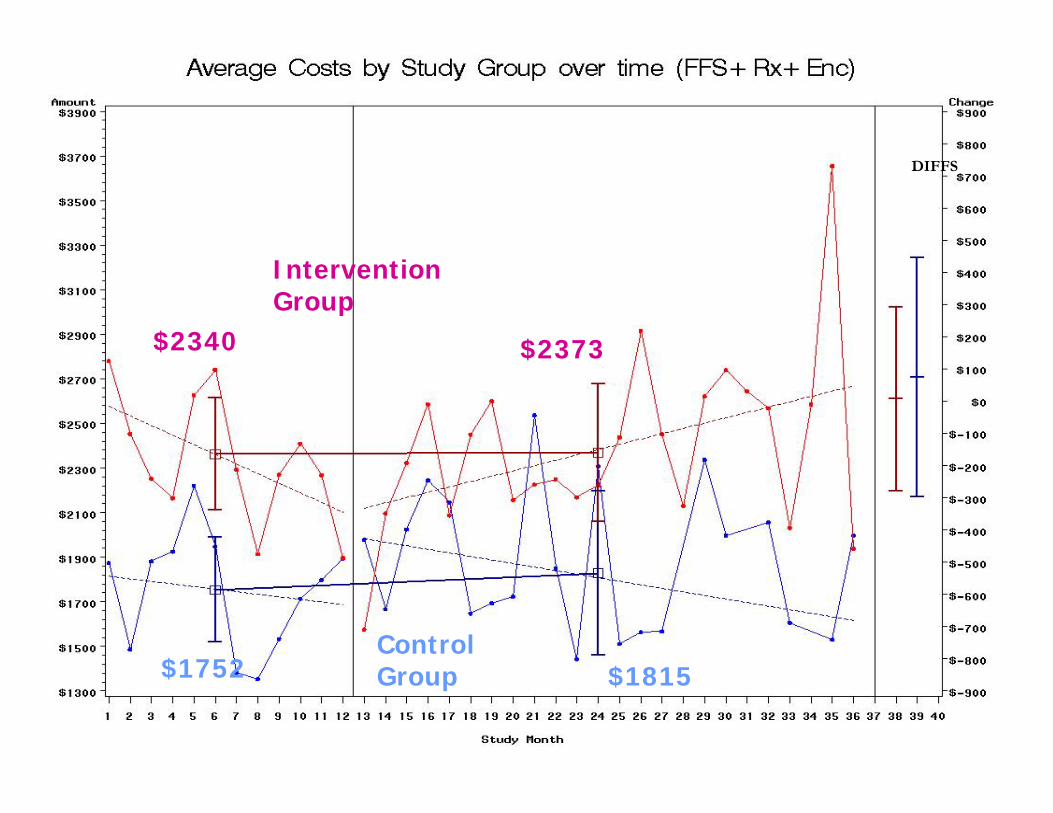
Intervention Group
Control Group
$2340
$1752
$2373
$1815
Baseline Period: 7/1/03 – 6/30/04 (12 months)
Intervention Period: 7/1/04 – 6/30/06 (24 months)
(c) Johns Hopkins HealthCare LLC
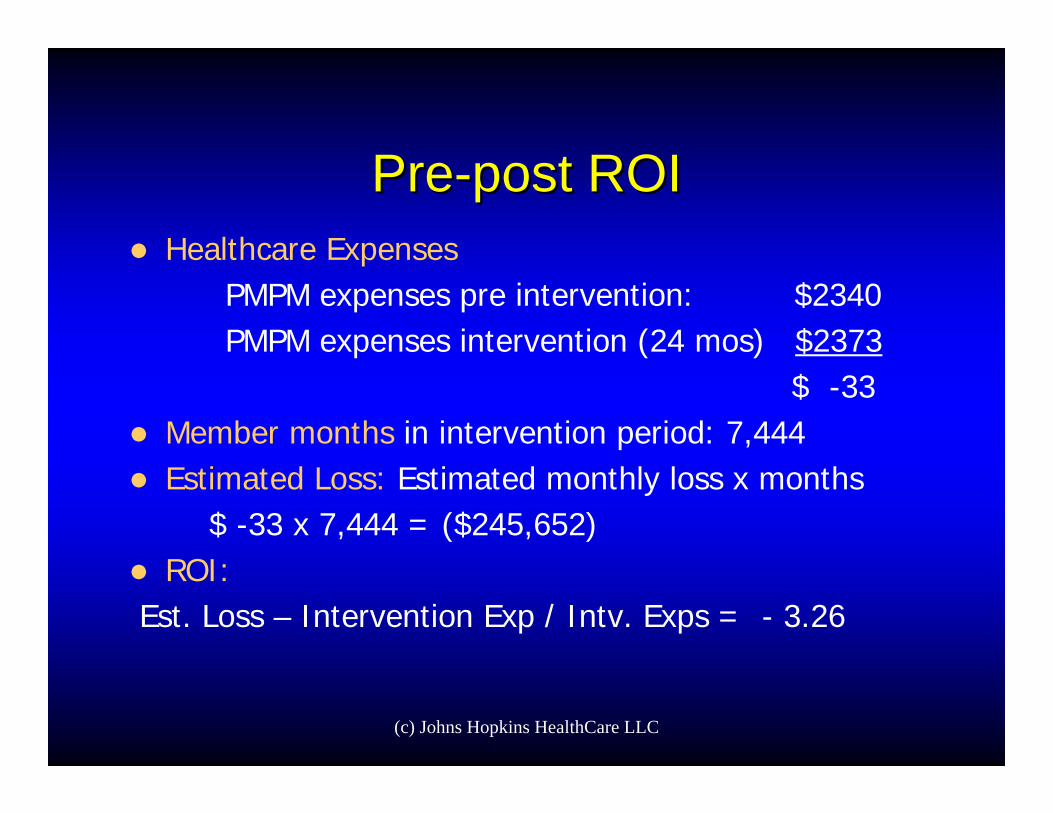
PrePre--post ROIpost ROIHealthcare Expenses
PMPM expenses pre intervention: $2340PMPM expenses intervention (24 mos) $2373
$ -33Member months in intervention period: 7,444Estimated Loss: Estimated monthly loss x months
$ -33 x 7,444 = ($245,652)ROI:
Est. Loss – Intervention Exp / Intv. Exps = - 3.26
(c) Johns Hopkins HealthCare LLC
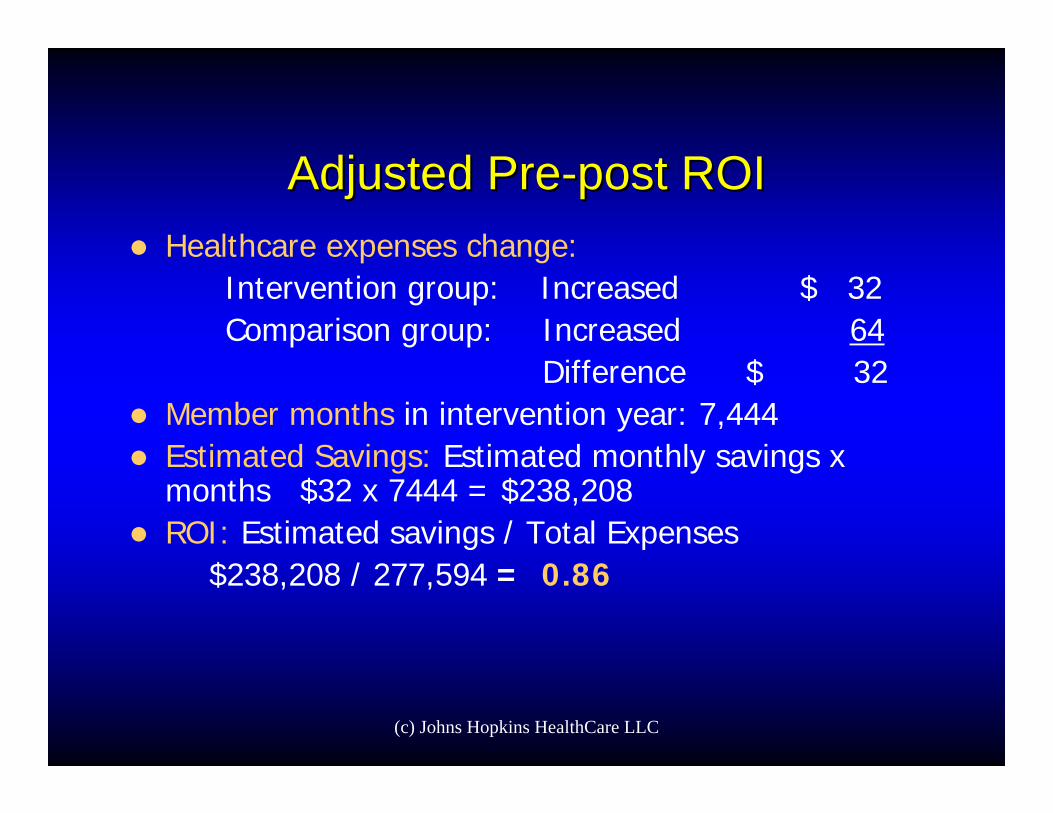
Adjusted PreAdjusted Pre--post ROIpost ROIHealthcare expenses change:
Intervention group: Increased $ 32Comparison group: Increased 64
Difference $ 32Member months in intervention year: 7,444Estimated Savings: Estimated monthly savings x months $32 x 7444 = $238,208 ROI: Estimated savings / Total Expenses
$238,208 / 277,594 = 0.86
(c) Johns Hopkins HealthCare LLC
Marginal ROI, really?Marginal ROI, really?
Let’s ask the statistician….
(c) Johns Hopkins HealthCare LLC
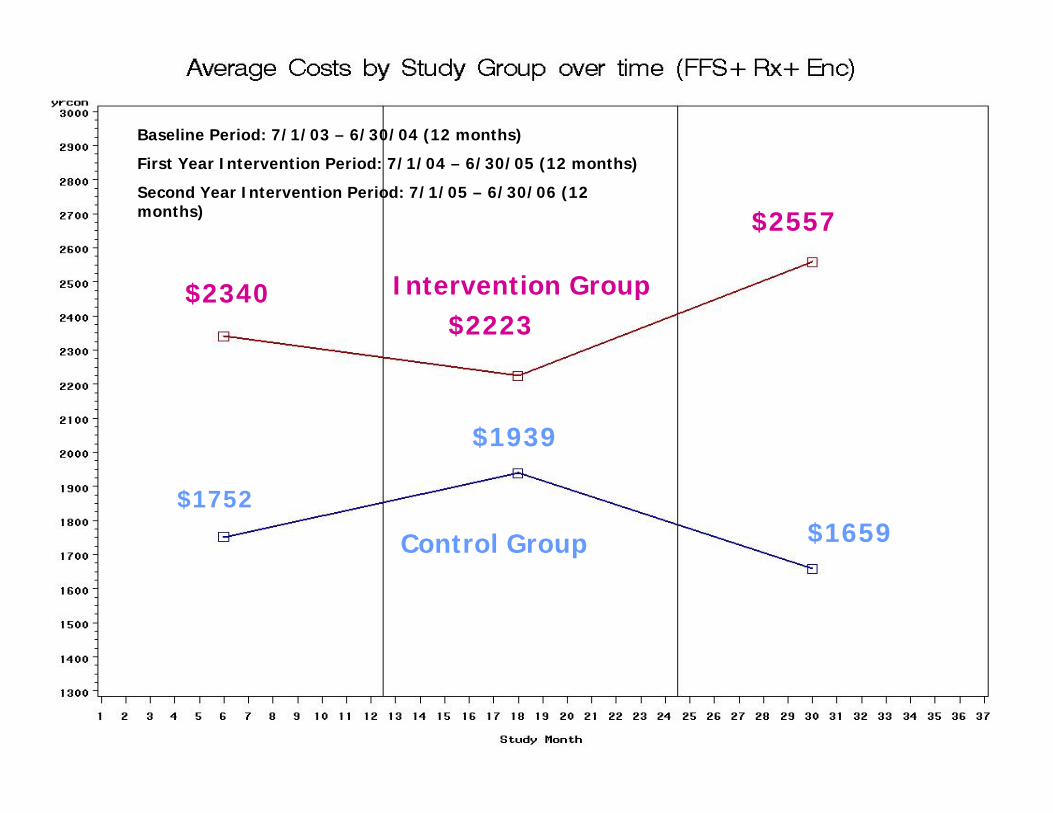
Intervention Group$2340
$2557
Control Group
$1752$1659
$2223
$1939
Baseline Period: 7/1/03 – 6/30/04 (12 months)
First Year Intervention Period: 7/1/04 – 6/30/05 (12 months)
Second Year Intervention Period: 7/1/05 – 6/30/06 (12 months)
(c) Johns Hopkins HealthCare LLC
Intervention Group
Control Group
$2340 $2373
$1752 $1815
DIFFS
(c) Johns Hopkins HealthCare LLC
ConclusionsConclusions
Similar QEIs can be undertaken with expectation of minimal cost risk Trend analysis should complement ROI reportCase management can engage similar population in DM/CM; SA Tx remains a challengeFurther research need of identifying and implementing care management team core competencies in serving this population
(c) Johns Hopkins HealthCare LLC
Contact informationContact information
Peter J. Fagan, PhDDirector of ResearchJohns Hopkins HealthCare LLC6704 Curtis DriveGlen Burnie, MD 21060410 424-4958