Embed Size (px)
Citation preview

Release Date: August 13, 2021 THIRD QUARTER 2021 Lower Current-Quarter Growth, Followed by Stronger Growth over Subsequent Quarters The U.S. economy for the current quarter looks weaker now than it did three months ago, according to 36 forecasters surveyed by the Federal Reserve Bank of Philadelphia. The panel predicts real GDP will grow at an annual rate of 6.8 percent this quarter, down 0.7 percentage point from the prediction in the last survey. Over the next three quarters, however, the panelists see stronger output growth than they predicted previously. Using the annual-average over annual-average computation, the forecasters expect real GDP to grow at an annual rate of 6.1 percent in 2021 and 4.4 percent in 2022. The projections for unemployment are little changed from those of the previous survey. On an annual-average basis, the forecasters predict the unemployment rate will decline from 5.6 percent in 2021 to 3.6 percent in 2024. The employment outlook mirrors the outlook for output growth. The forecasters revised downward their estimate for job growth for the current quarter and revised upward their estimates for the next three quarters. The projections for the annual-average level of nonfarm payroll employment suggest job gains at a monthly rate of 309,400 in 2021 and 456,300 in 2022. (These annual-average projections are computed as the year-to-year change in the annual-average level of nonfarm payroll employment, converted to a monthly rate.)
Median Forecasts for Selected Variables in the Current and Previous Surveys
Real GDP (%) Unemployment Rate (%) Payrolls (000s/month) Previous New Previous New Previous New Quarterly data: 2021:Q3 7.5 6.8 5.3 5.3 753.0 695.1 2021:Q4 5.0 5.2 4.9 4.9 482.4 508.8 2022:Q1 4.0 4.5 4.7 4.6 372.3 468.9 2022:Q2 2.6 3.4 4.5 4.4 287.0 404.8 2022:Q3 N.A. 2.7 N.A. 4.2 N.A. 265.0 Annual data (projections are based on annual-average levels): 2021 6.3 6.1 5.5 5.6 331.6 309.4 2022 4.3 4.4 4.4 4.3 405.1 456.3 2023 2.6 2.5 3.9 3.8 N.A. N.A. 2024 2.3 2.0 3.8 3.6 N.A. N.A.

2
The charts below provide some insight into the degree of uncertainty the forecasters have about their projections for the rate of growth in the annual-average level of real GDP. Each chart presents the forecasters’ previous and current estimates of the probability that growth will fall into each of 11 ranges. Notably, for 2021, the forecasters have significantly revised upward their estimate of the probability that real GDP will grow at a rate of 4.0 percent to 6.9 percent.

3
The forecasters’ density projections for unemployment, shown below, shed light on uncertainty about the labor market over the next four years. Each chart presents the forecasters’ current and previous estimates of the probability that unemployment will fall into each of 10 ranges. The panelists are raising their probability estimates for an unemployment rate between 5.0 percent and 5.9 percent in 2021. The unemployment density projections for the following three years are little changed, compared with their previous estimates.

4
Forecasters Raise Their Projections for Inflation The forecasters expect current-quarter headline CPI inflation to average 5.2 percent, up from 2.6 percent in the last survey. Headline PCE inflation over the current quarter will be 4.0 percent, up 1.6 percentage points from the previous estimate. Projections for headline and core CPI and PCE inflation at most other forecast horizons have been revised upward, compared with those from the survey of three months ago. Over the next 10 years, 2021 to 2030, the forecasters predict headline CPI inflation will average 2.44 percent at an annual rate. The corresponding estimate for 10-year annual-average PCE inflation is 2.20 percent. These 10-year projections are higher than those of the previous survey. Median Short-Run and Long-Run Projections for Inflation (Annualized Percentage Points)
Headline CPI Core CPI Headline PCE Core PCE Previous Current Previous Current Previous Current Previous Current Quarterly 2021:Q3 2.6 5.2 2.5 5.1 2.4 4.0 2.2 3.7 2021:Q4 2.4 2.6 2.3 2.5 2.2 2.6 2.0 2.2 2022:Q1 2.3 2.2 2.1 2.3 2.1 2.3 2.0 2.1 2022:Q2 2.2 2.3 2.2 2.3 2.1 2.2 2.0 2.1 2022:Q3 N.A. 2.4 N.A. 2.4 N.A. 2.2 N.A. 2.2 Q4/Q4 Annual Averages 2021 3.0 4.9 2.1 4.2 2.8 4.1 2.3 3.7 2022 2.3 2.4 2.2 2.4 2.2 2.2 2.0 2.2 2023 2.3 2.3 2.3 2.4 2.2 2.3 2.1 2.1 Long-Term Annual Averages 2021-2025 2.40 2.75 N.A. N.A. 2.20 2.40 N.A. N.A. 2021-2030 2.30 2.44 N.A. N.A. 2.10 2.20 N.A. N.A.

5
The charts below show the median projections (the red line) and the associated interquartile ranges (gray areas around the red line) for 10-year annual-average CPI and PCE inflation. The charts highlight the rising projections for the long-term inflation rate in recent surveys.

6
The figures below show the probabilities that the forecasters are assigning to each of 10 possible ranges for fourth-quarter over fourth-quarter core PCE inflation in 2021 and 2022. For both years, the forecasters have raised their estimates for the probability that core PCE inflation will be 3.0 percent or more, compared with their estimates from three months ago.
Lower Risk of a Negative Quarter The forecasters expect only a small likelihood of a contraction in real GDP in any of the next five quarters, and these new estimates are slightly below those of the previous survey. The forecasters have cut their estimate of the risk of a downturn this quarter to 5.7 percent, compared with 7.3 percent in the survey of three months ago. The panelists have also reduced their probability estimates for the following three quarters, compared with their previous estimates. Risk of a Negative Quarter (%) Survey Means
Quarterly data: Previous New 2021:Q3 7.3 5.7 2021:Q4 10.1 9.5 2022:Q1 12.1 12.0 2022:Q2 13.3 12.3 2022:Q3 N.A. 12.9

7
Natural Rate of Unemployment Estimated at 3.78 Percent In third-quarter surveys, we ask the forecasters to provide their estimates of the natural rate of unemployment — the rate of unemployment that occurs when the economy reaches equilibrium. The forecasters peg this rate at 3.78 percent. The table below shows, for each third-quarter survey since 1996, the percentage of respondents who use the natural rate in their forecasts and, for those who use it, the median estimate and the lowest and highest estimates. Thirty-seven percent of the 27 forecasters who answered the question report that they use the natural rate in their forecasts. The lowest estimate is 3.00 percent, and the highest estimate is 4.25 percent. Median Estimates of the Natural Rate of Unemployment Survey Date Percentage Who Use Median Estimate (%) Low (%) High (%) the Natural Rate 1996:Q3 62 5.65 5.00 6.00 1997:Q3 59 5.25 4.50 5.88 1998:Q3 45 5.30 4.50 5.80 1999:Q3 43 5.00 4.13 5.60 2000:Q3 48 4.50 4.00 5.00 2001:Q3 34 4.88 3.50 5.50 2002:Q3 50 5.10 3.80 5.50 2003:Q3 41 5.00 4.31 5.40 2004:Q3 46 5.00 4.00 5.50 2005:Q3 50 5.00 4.25 5.50 2006:Q3 53 4.95 4.00 5.50 2007:Q3 52 4.65 4.20 5.50 2008:Q3 48 5.00 4.00 5.50 2009:Q3 45 5.00 4.00 6.00 2010:Q3 50 5.78 4.50 6.80 2011:Q3 42 6.00 4.75 7.00 2012:Q3 49 6.00 4.75 7.00 2013:Q3 63 6.00 4.75 7.00 2014:Q3 65 5.50 4.50 6.70 2015:Q3 62 5.00 4.25 5.80 2016:Q3 56 4.80 4.50 5.50 2017:Q3 44 4.50 3.50 5.00 2018:Q3 34 4.30 3.80 4.60 2019:Q3 33 4.10 3.88 4.60 2020:Q3 48 4.10 3.50 6.00 2021:Q3 37 3.78 3.00 4.25

8
The Federal Reserve Bank of Philadelphia thanks the following forecasters for their participation in recent surveys: Scott Anderson, Bank of the West (BNP Paribas Group); Robert J. Barbera, Johns Hopkins University Center for Financial Economics; Peter Bernstein, RCF Economic and Financial Consulting, Inc.; Wayne Best and Michael Brown, Visa, Inc.; Jay Bryson, Wells Fargo; Christine Chmura, Ph.D., and Xiaobing Shuai, Ph.D., Chmura Economics & Analytics; Gary Ciminero, CFA, GLC Financial Economics; Gregory Daco, Oxford Economics USA, Inc.; Rajeev Dhawan, Georgia State University; Bill Diviney, ABN AMRO Bank NV; G. Ehrlich, D. Manaenkov, T. Ranosova, and A. Thapar, RSQE, University of Michigan; Michael R. Englund, Action Economics, LLC; Sacha Gelfer, Bentley University; James Glassman, JPMorgan Chase & Co.; Jan Hatzius, Goldman Sachs; Fred Joutz, Benchmark Forecasts; Sam Kahan, Kahan Consulting Ltd. (ACT Research LLC); N. Karp, BBVA Research USA; Walter Kemmsies and Ryan Severino, Jones Lang LaSalle; Jack Kleinhenz, Kleinhenz & Associates, Inc.; Yaniv Konchitchki, University of California, Berkeley; Rohan Kumar and Allen Sinai, Decision Economics, Inc.; Thomas Lam, Sim Kee Boon Institute, Singapore Management University; John Lonski, Moody’s Capital Markets Group; Matthew Luzzetti, Deutsche Bank Securities; IHS Markit; Robert McNab, Old Dominion University; R. Anthony Metz, Pareto Optimal Economics; R. M. Monaco, TitanRM; Michael Moran, Daiwa Capital Markets America; Joel L. Naroff, Naroff Economic Advisors; Nomura Securities International; Brendon Ogmundson, BC Real Estate Association; Perc Pineda, Ph.D., Plastics Industry Association; Jason Prole, Capital Risk Management; Philip Rothman, East Carolina University; Chris Rupkey, MUFG Union Bank; Sean M. Snaith, Ph.D., University of Central Florida; Constantine G. Soras, Ph.D., CGS Economic Consulting, Inc.; Stephen Stanley, Amherst Pierpont Securities; Charles Steindel, Editor, NABE Business Economics; Susan M. Sterne, Economic Analysis Associates, Inc.; James Sweeney, Credit Suisse; Thomas Kevin Swift, American Chemistry Council; Maira Trimble, Eaton Corporation; Mark Zandi, Moody’s Analytics; Ellen Zentner, Morgan Stanley. This is a partial list of participants. We also thank those who wish to remain anonymous.
Technical Notes Moody's Aaa and Baa Historical Rates The historical values of Moody's Aaa and Baa rates are proprietary and, therefore, not available in the data files on the Bank’s website or on the tables that accompany the survey’s complete write-up in the PDF.

9
SUMMARY TABLE SURVEY OF PROFESSIONAL FORECASTERS MAJOR MACROECONOMIC INDICATORS ___________________________________ ___________________________ 2021 2021 2022 2022 2022 2021 2022 2023 2024 Q3 Q4 Q1 Q2 Q3 (YEAR-OVER-YEAR) ___________________________________ ___________________________ PERCENT GROWTH AT ANNUAL RATES 1. REAL GDP 6.8 5.2 4.5 3.4 2.7 6.1 4.4 2.5 2.0 (BILLIONS, CHAIN WEIGHTED) 2. GDP PRICE INDEX 3.8 2.4 2.1 2.2 2.3 3.6 2.7 N.A. N.A. (PERCENT CHANGE) 3. NOMINAL GDP 10.4 8.4 6.5 5.4 5.2 9.8 7.1 N.A. N.A. ($ BILLIONS) 4. NONFARM PAYROLL EMPLOYMENT (PERCENT CHANGE) 5.9 4.2 3.8 3.3 2.1 2.6 3.8 N.A. N.A. (AVG MONTHLY CHANGE) 695.1 508.8 468.9 404.8 265.0 309.4 456.3 N.A. N.A. VARIABLES IN LEVELS 5. UNEMPLOYMENT RATE 5.3 4.9 4.6 4.4 4.2 5.6 4.3 3.8 3.6 (PERCENT) 6. 3-MONTH TREASURY BILL 0.1 0.1 0.1 0.1 0.1 0.1 0.1 0.5 0.8 (PERCENT) 7. 10-YEAR TREASURY BOND 1.4 1.6 1.6 1.7 1.9 1.5 1.8 2.2 2.5 (PERCENT) ___________________________________ ____________________ 2021 2021 2022 2022 2022 2021 2022 2023 Q3 Q4 Q1 Q2 Q3 (Q4-OVER-Q4) ___________________________________ ____________________ INFLATION INDICATORS 8. CPI 5.2 2.6 2.2 2.3 2.4 4.9 2.4 2.3 (ANNUAL RATE) 9. CORE CPI 5.1 2.5 2.3 2.3 2.4 4.2 2.4 2.4 (ANNUAL RATE) 10. PCE 4.0 2.6 2.3 2.2 2.2 4.1 2.2 2.3 (ANNUAL RATE) 11. CORE PCE 3.7 2.2 2.1 2.1 2.2 3.7 2.2 2.1 (ANNUAL RATE) Note: The figures on each line are medians of 36 forecasters. Source: Research Department, Federal Reserve Bank of Philadelphia. Survey of Professional Forecasters, Third Quarter 2021.

10
SURVEY OF PROFESSIONAL FORECASTERS
Third Quarter 2021
Tables Note: Data in these tables listed as "actual" are the data that were available to the forecasters when they were sent the survey questionnaire on July 29, 2021; the tables do not reflect subsequent revisions to the data. All forecasts were received on or before August 10, 2021.
11
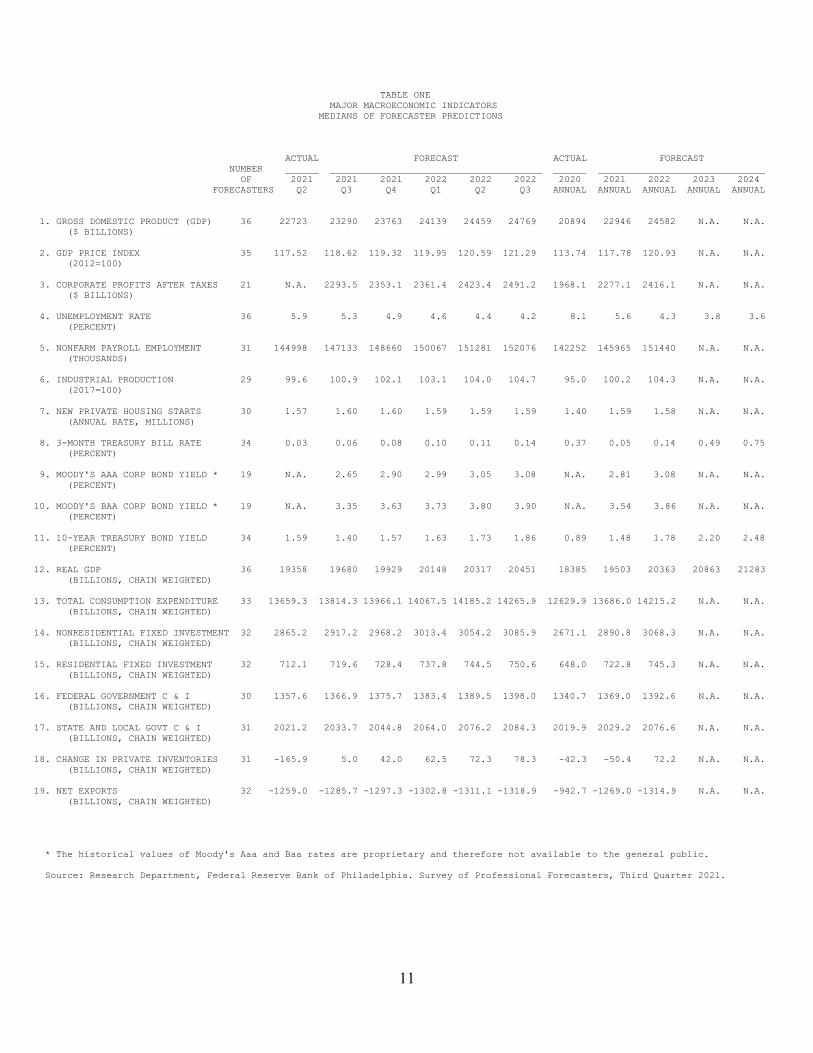
TABLE ONE MAJOR MACROECONOMIC INDICATORS MEDIANS OF FORECASTER PREDICTIONS ACTUAL FORECAST ACTUAL FORECAST NUMBER ______ ______________________________________ ______ ______________________________ OF 2021 2021 2021 2022 2022 2022 2020 2021 2022 2023 2024 FORECASTERS Q2 Q3 Q4 Q1 Q2 Q3 ANNUAL ANNUAL ANNUAL ANNUAL ANNUAL ____________________________________________________________________________________________________________________________________ 1. GROSS DOMESTIC PRODUCT (GDP) 36 22723 23290 23763 24139 24459 24769 20894 22946 24582 N.A. N.A. ($ BILLIONS) 2. GDP PRICE INDEX 35 117.52 118.62 119.32 119.95 120.59 121.29 113.74 117.78 120.93 N.A. N.A. (2012=100) 3. CORPORATE PROFITS AFTER TAXES 21 N.A. 2293.5 2353.1 2361.4 2423.4 2491.2 1968.1 2277.1 2416.1 N.A. N.A. ($ BILLIONS) 4. UNEMPLOYMENT RATE 36 5.9 5.3 4.9 4.6 4.4 4.2 8.1 5.6 4.3 3.8 3.6 (PERCENT) 5. NONFARM PAYROLL EMPLOYMENT 31 144998 147133 148660 150067 151281 152076 142252 145965 151440 N.A. N.A. (THOUSANDS) 6. INDUSTRIAL PRODUCTION 29 99.6 100.9 102.1 103.1 104.0 104.7 95.0 100.2 104.3 N.A. N.A. (2017=100) 7. NEW PRIVATE HOUSING STARTS 30 1.57 1.60 1.60 1.59 1.59 1.59 1.40 1.59 1.58 N.A. N.A. (ANNUAL RATE, MILLIONS) 8. 3-MONTH TREASURY BILL RATE 34 0.03 0.06 0.08 0.10 0.11 0.14 0.37 0.05 0.14 0.49 0.75 (PERCENT) 9. MOODY'S AAA CORP BOND YIELD * 19 N.A. 2.65 2.90 2.99 3.05 3.08 N.A. 2.81 3.08 N.A. N.A. (PERCENT) 10. MOODY'S BAA CORP BOND YIELD * 19 N.A. 3.35 3.63 3.73 3.80 3.90 N.A. 3.54 3.86 N.A. N.A. (PERCENT) 11. 10-YEAR TREASURY BOND YIELD 34 1.59 1.40 1.57 1.63 1.73 1.86 0.89 1.48 1.78 2.20 2.48 (PERCENT) 12. REAL GDP 36 19358 19680 19929 20148 20317 20451 18385 19503 20363 20863 21283 (BILLIONS, CHAIN WEIGHTED) 13. TOTAL CONSUMPTION EXPENDITURE 33 13659.3 13814.3 13966.1 14067.5 14185.2 14265.9 12629.9 13686.0 14215.2 N.A. N.A. (BILLIONS, CHAIN WEIGHTED) 14. NONRESIDENTIAL FIXED INVESTMENT 32 2865.2 2917.2 2968.2 3013.4 3054.2 3085.9 2671.1 2890.8 3068.3 N.A. N.A. (BILLIONS, CHAIN WEIGHTED) 15. RESIDENTIAL FIXED INVESTMENT 32 712.1 719.6 728.4 737.8 744.5 750.6 648.0 722.8 745.3 N.A. N.A. (BILLIONS, CHAIN WEIGHTED) 16. FEDERAL GOVERNMENT C & I 30 1357.6 1366.9 1375.7 1383.4 1389.5 1398.0 1340.7 1369.0 1392.6 N.A. N.A. (BILLIONS, CHAIN WEIGHTED) 17. STATE AND LOCAL GOVT C & I 31 2021.2 2033.7 2044.8 2064.0 2076.2 2084.3 2019.9 2029.2 2076.6 N.A. N.A. (BILLIONS, CHAIN WEIGHTED) 18. CHANGE IN PRIVATE INVENTORIES 31 -165.9 5.0 42.0 62.5 72.3 78.3 -42.3 -50.4 72.2 N.A. N.A. (BILLIONS, CHAIN WEIGHTED) 19. NET EXPORTS 32 -1259.0 -1285.7 -1297.3 -1302.8 -1311.1 -1318.9 -942.7 -1269.0 -1314.9 N.A. N.A. (BILLIONS, CHAIN WEIGHTED) * The historical values of Moody's Aaa and Baa rates are proprietary and therefore not available to the general public. Source: Research Department, Federal Reserve Bank of Philadelphia. Survey of Professional Forecasters, Third Quarter 2021.

12
TABLE TWO MAJOR MACROECONOMIC INDICATORS PERCENTAGE CHANGES AT ANNUAL RATES NUMBER Q2 2021 Q3 2021 Q4 2021 Q1 2022 Q2 2022 2020 2021 2022 2023 OF TO TO TO TO TO TO TO TO TO FORECASTERS Q3 2021 Q4 2021 Q1 2022 Q2 2022 Q3 2022 2021 2022 2023 2024 ____________________________________________________________________________________________________________________________ 1. GROSS DOMESTIC PRODUCT (GDP) 36 10.4 8.4 6.5 5.4 5.2 9.8 7.1 N.A. N.A. ($ BILLIONS) 2. GDP PRICE INDEX 35 3.8 2.4 2.1 2.2 2.3 3.6 2.7 N.A. N.A. (2012=100) 3. CORPORATE PROFITS AFTER TAXES 21 7.2 10.8 1.4 10.9 11.7 15.7 6.1 N.A. N.A. ($ BILLIONS) 4. UNEMPLOYMENT RATE 36 -0.6 -0.4 -0.3 -0.2 -0.2 -2.5 -1.3 -0.5 -0.2 (PERCENT) 5. NONFARM PAYROLL EMPLOYMENT (PERCENT CHANGE) 31 5.9 4.2 3.8 3.3 2.1 2.6 3.8 N.A. N.A. (AVG MONTHLY CHANGE) 31 695.1 508.8 468.9 404.8 265.0 309.4 456.3 N.A. N.A. 6. INDUSTRIAL PRODUCTION 29 5.5 4.6 4.0 3.6 2.8 5.5 4.1 N.A. N.A. (2017=100) 7. NEW PRIVATE HOUSING STARTS 30 7.1 1.3 -1.3 -1.9 1.3 13.6 -0.3 N.A. N.A. (ANNUAL RATE, MILLIONS) 8. 3-MONTH TREASURY BILL RATE 34 0.03 0.03 0.02 0.01 0.04 -0.32 0.08 0.35 0.27 (PERCENT) 9. MOODY'S AAA CORP BOND YIELD * 19 N.A. 0.25 0.09 0.06 0.03 N.A. 0.27 N.A. N.A. (PERCENT) 10. MOODY'S BAA CORP BOND YIELD * 19 N.A. 0.28 0.10 0.07 0.10 N.A. 0.32 N.A. N.A. (PERCENT) 11. 10-YEAR TREASURY BOND YIELD 34 -0.19 0.17 0.07 0.10 0.13 0.59 0.30 0.42 0.28 (PERCENT) 12. REAL GDP 36 6.8 5.2 4.5 3.4 2.7 6.1 4.4 2.5 2.0 (BILLIONS, CHAIN WEIGHTED) 13. TOTAL CONSUMPTION EXPENDITURE 33 4.6 4.5 2.9 3.4 2.3 8.4 3.9 N.A. N.A. (BILLIONS, CHAIN WEIGHTED) 14. NONRESIDENTIAL FIXED INVESTMENT 32 7.5 7.2 6.2 5.5 4.2 8.2 6.1 N.A. N.A. (BILLIONS, CHAIN WEIGHTED) 15. RESIDENTIAL FIXED INVESTMENT 32 4.3 5.0 5.2 3.7 3.3 11.5 3.1 N.A. N.A. (BILLIONS, CHAIN WEIGHTED) 16. FEDERAL GOVERNMENT C & I 30 2.8 2.6 2.3 1.8 2.5 2.1 1.7 N.A. N.A. (BILLIONS, CHAIN WEIGHTED) 17. STATE AND LOCAL GOVT C & I 31 2.5 2.2 3.8 2.4 1.6 0.5 2.3 N.A. N.A. (BILLIONS, CHAIN WEIGHTED) 18. CHANGE IN PRIVATE INVENTORIES 31 170.9 37.0 20.5 9.8 6.0 -8.1 122.6 N.A. N.A. (BILLIONS, CHAIN WEIGHTED) 19. NET EXPORTS 32 -26.7 -11.6 -5.6 -8.3 -7.8 -326.3 -45.9 N.A. N.A. (BILLIONS, CHAIN WEIGHTED) * The historical values of Moody's Aaa and Baa rates are proprietary and therefore not available to the general public. Note: Figures for unemployment rate, 3-month Treasury bill rate, Moody's Aaa corporate bond yield, Moody's Baa corporate bond yield, and 10-year Treasury bond yield are changes in these rates, in percentage points. Figures for change in private inventories and net exports are changes in billions of chain-weighted dollars. All others are percentage changes at annual rates. Source: Research Department, Federal Reserve Bank of Philadelphia. Survey of Professional Forecasters, Third Quarter 2021.

13
TABLE THREE MAJOR PRICE INDICATORS MEDIANS OF FORECASTER PREDICTIONS ACTUAL FORECAST(Q/Q) ACTUAL FORECAST(Q4/Q4) NUMBER ______ ___________________________________________ ______ __________________________ OF 2021 2021 2021 2022 2022 2022 2020 2021 2022 2023 FORECASTERS Q2 Q3 Q4 Q1 Q2 Q3 ANNUAL ANNUAL ANNUAL ANNUAL ___________________________________________________________________________________________________________________________________ 1. CONSUMER PRICE INDEX 36 8.4 5.2 2.6 2.2 2.3 2.4 1.2 4.9 2.4 2.3 (ANNUAL RATE) 2. CORE CONSUMER PRICE INDEX 34 8.1 5.1 2.5 2.3 2.3 2.4 1.6 4.2 2.4 2.4 (ANNUAL RATE) 3. PCE PRICE INDEX 35 6.4 4.0 2.6 2.3 2.2 2.2 1.2 4.1 2.2 2.3 (ANNUAL RATE) 4. CORE PCE PRICE INDEX 34 6.1 3.7 2.2 2.1 2.1 2.2 1.4 3.7 2.2 2.1 (ANNUAL RATE) Source: Research Department, Federal Reserve Bank of Philadelphia. Survey of Professional Forecasters, Third Quarter 2021.

14
TABLE FOUR YIELD SPREADS MEDIANS OF FORECASTER PREDICTIONS ACTUAL FORECAST ACTUAL FORECAST NUMBER ______ ______________________________________ ______ ______________________________ OF 2021 2021 2021 2022 2022 2022 2020 2021 2022 2023 2024 FORECASTERS Q2 Q3 Q4 Q1 Q2 Q3 ANNUAL ANNUAL ANNUAL ANNUAL ANNUAL ____________________________________________________________________________________________________________________________________ 1. TBOND MINUS TBILL 33 1.57 1.34 1.48 1.55 1.66 1.70 0.53 1.42 1.68 1.80 1.66 (PERCENTAGE POINTS) 2. AAA MINUS TBOND 19 N.A. 1.26 1.29 1.30 1.26 1.26 N.A. 1.33 1.26 N.A. N.A. (PERCENTAGE POINTS) 3. BAA MINUS TBOND 19 N.A. 1.99 2.00 2.05 2.05 2.06 N.A. 2.03 2.05 N.A. N.A. (PERCENTAGE POINTS) 4. BAA MINUS AAA 19 N.A. 0.70 0.70 0.73 0.76 0.81 N.A. 0.71 0.79 N.A. N.A. (PERCENTAGE POINTS) Notes: TBOND is the rate on 10-year Treasury bonds. TBILL is the rate on 3-month Treasury bills. AAA is the rate on Moody's Aaa corporate bonds. BAA is the rate on Moody's Baa corporate bonds. The historical values for interest rate spreads for Moody's Aaa and Baa rates are proprietary and therefore not available to the general public. Each interest rate spread is computed as the median value of the forecasters' spreads. These median values may differ from those computed as the difference between the median values of each interest rate in the spread. Source: Research Department, Federal Reserve Bank of Philadelphia. Survey of Professional Forecasters, Third Quarter 2021.

15
TABLE FIVE ESTIMATED PROBABILITY OF DECLINE IN REAL GDP ESTIMATED Q2 2021 Q3 2021 Q4 2021 Q1 2022 Q2 2022 PROBABILITY TO TO TO TO TO (CHANCES IN 100) Q3 2021 Q4 2021 Q1 2022 Q2 2022 Q3 2022 NUMBER OF FORECASTERS 10 OR LESS 27 22 18 15 13 11 TO 20 3 7 10 14 15 21 TO 30 0 1 2 1 1 31 TO 40 0 0 0 0 0 41 TO 50 0 0 0 0 0 51 TO 60 0 0 0 0 0 61 TO 70 0 0 0 0 0 71 TO 80 0 0 0 0 0 81 TO 90 0 0 0 0 0 91 AND OVER 0 0 0 0 0 NOT REPORTING 6 6 6 6 7 MEAN AND MEDIAN MEDIAN PROBABILITY 5.00 8.50 10.00 10.65 12.00 MEAN PROBABILITY 5.65 9.50 12.00 12.28 12.88 Note: Total number of forecasters reporting is 30. Source: Research Department, Federal Reserve Bank of Philadelphia. Survey of Professional Forecasters, Third Quarter 2021.

16
TABLE SIX MEAN PROBABILITIES MEAN PROBABILITY ATTACHED TO POSSIBLE CIVILIAN UNEMPLOYMENT RATES: (ANNUAL AVERAGE) 2021 2022 2023 2024 _________ _________ _________ _________ 15.0 PERCENT OR MORE 0.00 0.00 0.00 0.00 12.0 TO 14.9 PERCENT 0.00 0.00 0.04 0.05 10.0 TO 11.9 PERCENT 0.03 0.07 0.12 0.15 8.0 TO 9.9 PERCENT 1.92 0.63 0.42 0.55 7.0 TO 7.9 PERCENT 3.09 2.00 2.55 3.63 6.0 TO 6.9 PERCENT 12.40 6.24 4.83 6.90 5.0 TO 5.9 PERCENT 66.39 21.82 12.11 15.99 4.0 TO 4.9 PERCENT 14.98 40.97 36.32 32.62 3.0 TO 3.9 PERCENT 0.92 25.24 36.64 32.42 LESS THAN 3.0 PERCENT 0.27 3.03 6.97 7.71 MEAN PROBABILITY ATTACHED TO POSSIBLE PERCENT CHANGES IN REAL GDP: (ANNUAL-AVERAGE OVER ANNUAL-AVERAGE) 2020-2021 2021-2022 2022-2023 2023-2024 _________ _________ _________ _________ 16.0 PERCENT OR MORE 0.17 0.10 0.00 0.00 10.0 TO 15.9 PERCENT 1.04 0.84 0.46 0.30 7.0 TO 9.9 PERCENT 18.44 7.63 2.73 1.36 4.0 TO 6.9 PERCENT 64.93 39.20 13.90 6.93 2.5 TO 3.9 PERCENT 11.59 32.08 32.38 27.81 1.5 TO 2.4 PERCENT 2.77 13.91 33.40 39.72 0.0 TO 1.4 PERCENT 0.74 3.90 13.32 17.50 -3.0 TO -0.1 PERCENT 0.27 1.84 3.02 5.28 -6.0 TO -3.1 PERCENT 0.03 0.37 0.59 0.81 -12.0 TO -6.1 PERCENT 0.03 0.11 0.17 0.25 LESS THAN -12.0 PERCENT 0.00 0.03 0.04 0.05 MEAN PROBABILITY ATTACHED TO POSSIBLE PERCENT CHANGES IN GDP PRICE INDEX: (ANNUAL-AVERAGE OVER ANNUAL-AVERAGE) 2020-2021 2021-2022 _________ _________ 4.0 PERCENT OR MORE 19.25 8.96 3.5 TO 3.9 PERCENT 34.36 12.00 3.0 TO 3.4 PERCENT 25.70 18.28 2.5 TO 2.9 PERCENT 9.58 23.95 2.0 TO 2.4 PERCENT 8.14 23.84 1.5 TO 1.9 PERCENT 2.59 9.05 1.0 TO 1.4 PERCENT 0.31 2.74 0.5 TO 0.9 PERCENT 0.03 0.74 0.0 TO 0.4 PERCENT 0.03 0.21 LESS THAN 0.0 PERCENT 0.00 0.22 Source: Research Department, Federal Reserve Bank of Philadelphia. Survey of Professional Forecasters, Third Quarter 2021.

17
TABLE SEVEN MEAN PROBABILITY OF CORE CPI AND CORE PCE INFLATION (Q4/Q4) MEAN PROBABILITY ATTACHED TO CORE CPI INFLATION: 20Q4 TO 21Q4 21Q4 TO 22Q4 ____________ ____________ 4.0 PERCENT OR MORE 40.89 2.81 3.5 TO 3.9 PERCENT 26.67 7.17 3.0 TO 3.4 PERCENT 18.12 17.62 2.5 TO 2.9 PERCENT 9.27 32.00 2.0 TO 2.4 PERCENT 3.97 26.08 1.5 TO 1.9 PERCENT 0.72 9.80 1.0 TO 1.4 PERCENT 0.18 3.00 0.5 TO 0.9 PERCENT 0.11 1.05 0.0 TO 0.4 PERCENT 0.04 0.27 LESS THAN 0.0 PERCENT 0.04 0.21 MEAN PROBABILITY ATTACHED TO CORE PCE INFLATION: 20Q4 TO 21Q4 21Q4 TO 22Q4 ____________ ____________ 4.0 PERCENT OR MORE 20.62 1.39 3.5 TO 3.9 PERCENT 29.08 3.88 3.0 TO 3.4 PERCENT 22.76 10.43 2.5 TO 2.9 PERCENT 16.40 22.55 2.0 TO 2.4 PERCENT 7.47 33.37 1.5 TO 1.9 PERCENT 2.50 20.62 1.0 TO 1.4 PERCENT 0.93 5.95 0.5 TO 0.9 PERCENT 0.14 1.58 0.0 TO 0.4 PERCENT 0.07 0.14 LESS THAN 0.0 PERCENT 0.04 0.08 Source: Research Department, Federal Reserve Bank of Philadelphia. Survey of Professional Forecasters, Third Quarter 2021.

18
TABLE EIGHT LONG-TERM (5-YEAR AND 10-YEAR) INFLATION FORECASTS ANNUAL AVERAGE OVER THE NEXT 5 YEARS: 2021-2025 =============================================== CPI INFLATION RATE PCE INFLATION RATE ------------------------- ------------------------- MINIMUM 2.10 MINIMUM 1.90 LOWER QUARTILE 2.50 LOWER QUARTILE 2.20 MEDIAN 2.75 MEDIAN 2.40 UPPER QUARTILE 2.97 UPPER QUARTILE 2.80 MAXIMUM 3.75 MAXIMUM 3.13 MEAN 2.76 MEAN 2.48 STD. DEVIATION 0.40 STD. DEVIATION 0.35 N 28 N 28 MISSING 8 MISSING 8 ANNUAL AVERAGE OVER THE FOLLOWING 5 YEARS: 2026-2030 ========================================================== CPI INFLATION RATE PCE INFLATION RATE ------------------------- ------------------------- MINIMUM 1.80 MINIMUM 1.60 LOWER QUARTILE 2.00 LOWER QUARTILE 1.85 MEDIAN 2.10 MEDIAN 2.00 UPPER QUARTILE 2.35 UPPER QUARTILE 2.20 MAXIMUM 2.60 MAXIMUM 2.40 MEAN 2.17 MEAN 2.01 STD. DEVIATION 0.22 STD. DEVIATION 0.24 N 28 N 28 MISSING 8 MISSING 8 ANNUAL AVERAGE OVER THE NEXT 10 YEARS: 2021-2030 ================================================ CPI INFLATION RATE PCE INFLATION RATE ------------------------- ------------------------- MINIMUM 2.00 MINIMUM 1.80 LOWER QUARTILE 2.25 LOWER QUARTILE 2.10 MEDIAN 2.44 MEDIAN 2.20 UPPER QUARTILE 2.60 UPPER QUARTILE 2.47 MAXIMUM 3.00 MAXIMUM 2.70 MEAN 2.46 MEAN 2.24 STD. DEVIATION 0.26 STD. DEVIATION 0.24 N 28 N 28 MISSING 8 MISSING 8 Note: The summary statistics for each forecast horizon are computed on a sample of panelists that may differ from one horizon to the next. The usual identity linking the 10-year horizon to the two underlying five-year horizons may not hold in the results. Source: Research Department, Federal Reserve Bank of Philadelphia. Survey of Professional Forecasters, Third Quarter 2021.