Embed Size (px)
Citation preview
Independent sector providers caring for NHS patientsComparative performance indicators
February 2015
Edition 13
New in this edition
New this month Monthly acute volume data by specialty (pp 44 – 49). This shows how acute volumes and proportion of NHS patients treated by independent providers by specialty
have changed since Apr 11, the point at which the Government began to publish publicly comparable data for independent providers.
Updated data this month Inpatient Friends and Family Test data PROMs data for 2013-14 has been updated using data published in Feb 2015 (replacing data from Aug 14). Because more data is now available, disproportionately
more independent providers are now visible as more sites exceed minimum thresholds for inclusion. In turn, a larger number of independent providers appear in the ‘top providers’ as measured by adjusted health gain.
VTE risk assessments RTT waiting times Diagnostic waiting time data
NB this version replaces an earlier version which contained a mistyped date relating to the PROMs period covered on pp. 19 to 27
For more information about the data underlying the visualisations in this presentation, please contact [email protected]
Page 2 of 49
ContentsIndependent sector providers caring for NHS patients......................................................................................................................................................................................... 1
Comparative performance indicators................................................................................................................................................................................................................ 1
January 2015..................................................................................................................................................................................................................................................... 1
Edition 12.......................................................................................................................................................................................................................................................... 1
New in this edition................................................................................................................................................................................................................................................. 2
Independent sector performance.......................................................................................................................................................................................................................... 6
Patient experience................................................................................................................................................................................................................................................. 7
Friends and family test performance..................................................................................................................................................................................................................... 8
Friends and family test – performance of all providers.........................................................................................................................................................................................9
Friends and family test – the top performers...................................................................................................................................................................................................... 10
Friends and family test response rates................................................................................................................................................................................................................ 11
Clinical quality..................................................................................................................................................................................................................................................... 12
CQC standards 2013–14...................................................................................................................................................................................................................................... 13
CQC compliance rates – hospital care standards................................................................................................................................................................................................. 14
CQC compliance rates – community healthcare standards.................................................................................................................................................................................15
CQC compliance rates – independent ambulances............................................................................................................................................................................................. 16
Patient outcomes and safety............................................................................................................................................................................................................................... 17
Patient outcomes and safety............................................................................................................................................................................................................................... 18
Page 3 of 49
Patient Reported Outcome Measures (PROMs).................................................................................................................................................................................................. 19
Rate of assessment for VTE (blood clots)............................................................................................................................................................................................................ 28
Infection control data.......................................................................................................................................................................................................................................... 29
Efficiency indicators............................................................................................................................................................................................................................................. 30
Referral to treatment times................................................................................................................................................................................................................................. 31
Percentage of patients treated within 18 weeks................................................................................................................................................................................................. 32
Typical waiting times........................................................................................................................................................................................................................................... 33
Average waiting times by specialty...................................................................................................................................................................................................................... 34
Waiting times for 95% of patients....................................................................................................................................................................................................................... 35
Diagnostic waiting times...................................................................................................................................................................................................................................... 36
Numbers of patients treated............................................................................................................................................................................................................................... 38
Numbers of patients treated by independent providers.....................................................................................................................................................................................39
Elective admissions and GP referrals (1).............................................................................................................................................................................................................. 41
Elective admissions and GP referrals (2).............................................................................................................................................................................................................. 42
Elective admissions and GP referrals (3).............................................................................................................................................................................................................. 43
Acute elective patients treated by independent sector and NHS organisations..................................................................................................................................................44
Monthly number of acute elective patients treated by the independent sector................................................................................................................................................45
Number of inpatients treated by the independent sector by specialty...............................................................................................................................................................46
Number of outpatients treated by the independent sector by specialty............................................................................................................................................................47
Share of inpatients treated by the independent sector by specialty...................................................................................................................................................................48
Page 4 of 49
Number of outpatients treated by the independent sector by specialty............................................................................................................................................................49
Diagnostic tests carried out by independent sector by modality........................................................................................................................................................................50
Page 5 of 49
Independent sector performance
The NHS Partners Network is the trade association representing the widest range of independent sector providers of NHS clinical services ranging through acute, diagnostic, primary and community care, as well as dental services. Our members are drawn from both the “for profit” and “not for profit” sectors and include large international hospital groups and small specialist providers. All are committed to working in partnership with the NHS and to the values set out in the NHS Constitution.
This document gives an overview of the performance of independent sector providers of care to NHS patients. It focuses on care sectors represented by NHSPN members and the indicators available cover five broad domains of quality:
Patient experience Clinical quality Patient outcomes and safety Efficiency indicators The contribution of the sector shown by numbers of patients treated
All the visualisations shown in this document are based on publicly available data published by organisations such as NHS England, Public Health England, the Health and Social Care Information Centre and the Care Quality Commission.
Not all data collected for traditional NHS organisations and independent sector providers can be compared easily. Historic differences in the way NHS and independent sector providers have been regulated have often required independent providers to collect different information from their NHS counterparts. As the range of information is increasingly harmonised, we hope to be able to produce more comparative information published by third parties such as the organisations listed above.
Page 6 of 49
Patient experience
Page 7 of 49
Friends and family test performanceThe Government’s preferred measure of patient satisfaction, the Friends and Family Test (FFT), applies equally to traditional NHS and the independent sector. Collected monthly since April 2013, around 99% of patients would be ‘extremely likely’ or ‘likely’ to recommend independent providers compared with just under 94% for NHS organisations. At present, acute inpatient care is the only area where the FFT is collected by both independent and NHS providers however NHS England is in the process of rolling out the FFT across all NHS care by April 2015.
Jan-14 Feb-14 Mar-14 Apr-14 May-14 Jun-14 Jul-14 Aug-14 Sep-14 Oct-14 Nov-14 Dec-14 Average0.0%
10.0%
20.0%
30.0%
40.0%
50.0%
60.0%
70.0%
80.0%
90.0%
100.0%
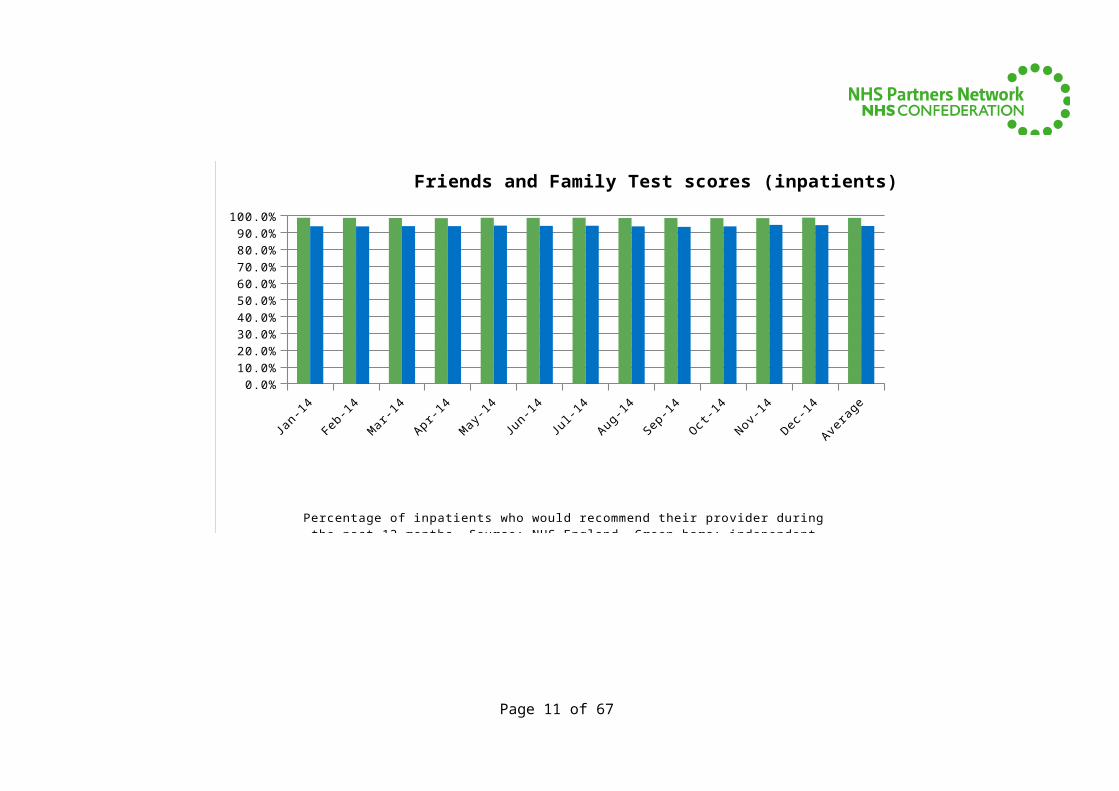
Friends and Family Test scores (inpatients)
Percentage of inpatients who would recommend their provider during the past 12 months. Source: NHS England. Green bars: independent providers and blue bars: NHS orgs.
Page 8 of 49
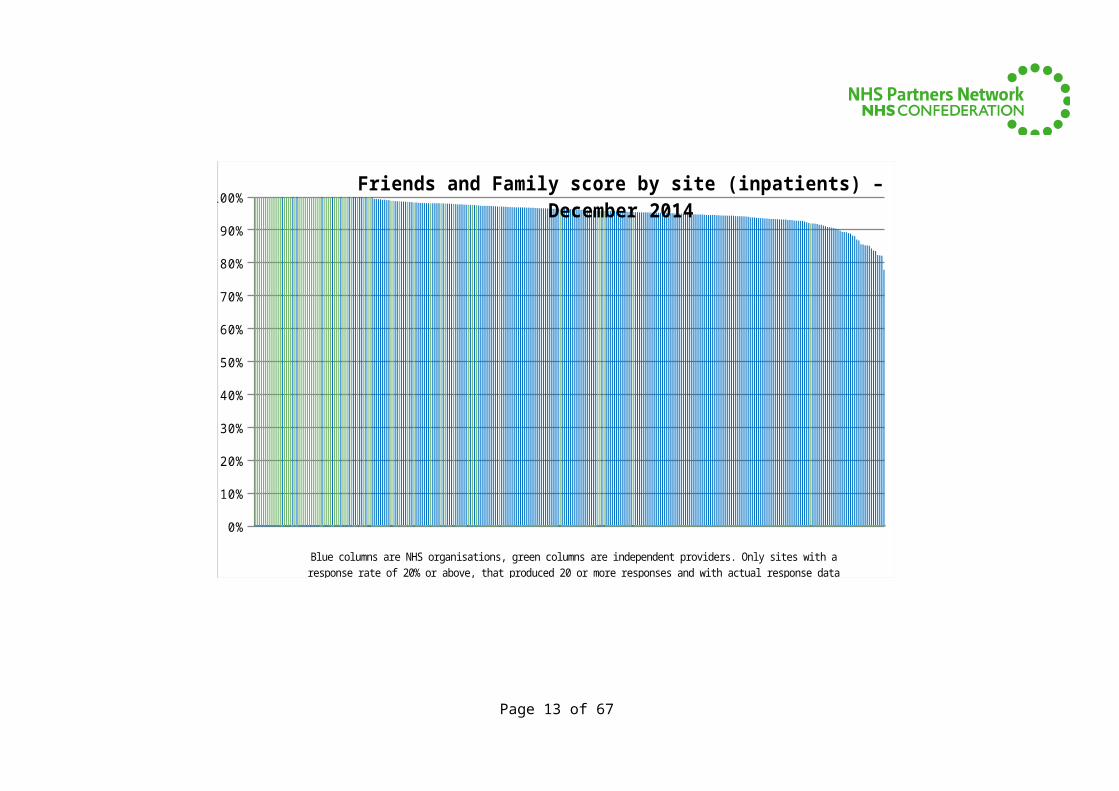
Friends and family test – performance of all providersIndependent providers cluster at the ‘high end’ of performance. The graph below shows the performance of all providers that collect the FFT for inpatient acute care and which produce a minimum response rate of 20% amounting to at least 20 patients per month. Green bars represent independent organisations and blue bars show NHS hospitals.
0%
10%
20%
30%
40%
50%
60%
70%
80%
90%
100%Friends and Family score by site (inpatients) – December 2014
Blue columns are NHS organisations, green columns are independent providers. Only sites with a response rate of 20% or above, that produced 20 or more responses and with actual response data are shown. Source: NHS Eng
Page 9 of 49
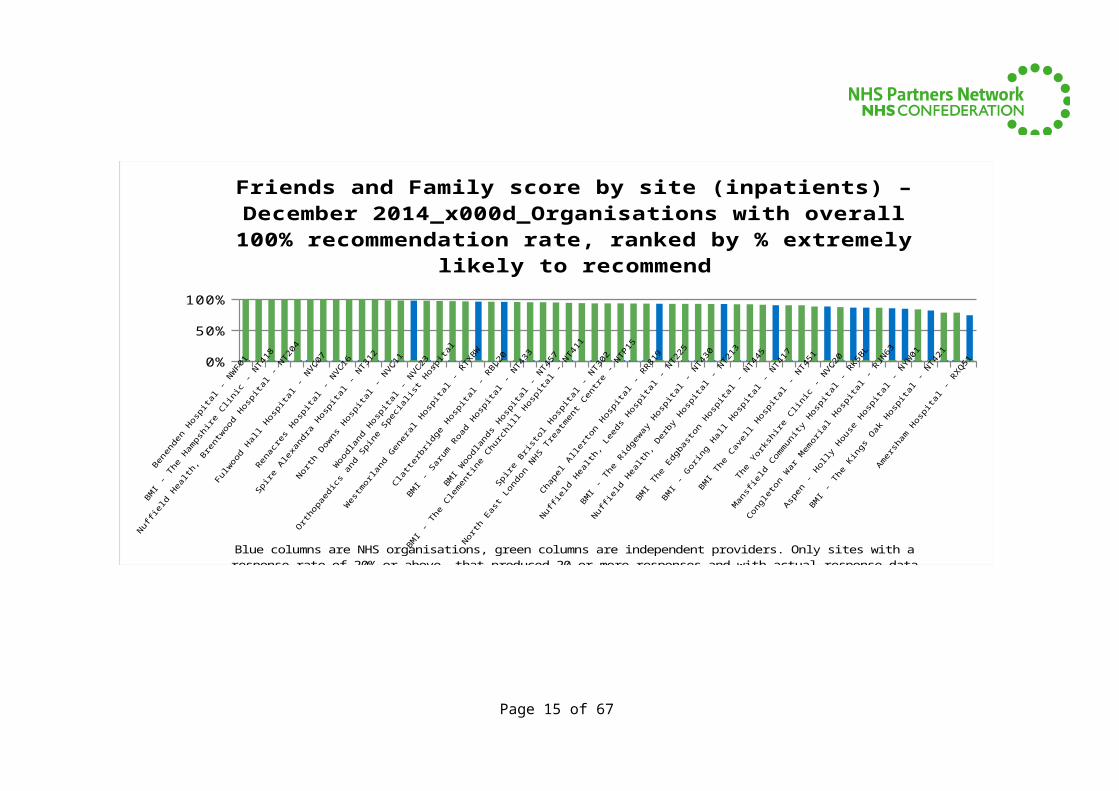
Friends and family test – the top performersThe graph below shows those hospitals that scored a 100% recommendation rate (extremely likely and likely to recommend) as measured by patients in their response to the FFT for acute inpatient care. Within this group, organisations are ordered on the basis of those with the highest proportion of patients ‘extremely likely’ to recommend their providers (highest on left, lowest on right). NB some providers with an overall percentage recommendation rate below 100% may have achieved higher rates of patients ‘extremely likely’ to recommend them than those shown on this graph.
Benen
den H
ospita
l - N
WF0
1
BMI -
The
Hampsh
ire C
l inic
- N
T418
Nuffi
eld H
ealth
, Bre
ntwood H
ospita
l - N
T204
Fulw
ood Hal
l Hosp
ital -
NVC07
Renac
res
Hospita
l - N
VC16
Spire
Ale
xandra
Hosp
ital -
NT3
12
North
Dow
ns Hosp
ital -
NVC11
Woodla
nd Hosp
ital -
NVC23
Orth
opaedic
s an
d Sp in
e Sp
ecia
list H
ospita
l
Wes
tmorla
nd Gen
eral
Hosp
ital -
RTX
BW
Clatter
bridge
Hosp
ital -
RBL2
0
BMI -
Sar
um R
oad H
ospita
l - N
T433
BMI W
oodlands
Hospita
l - N
T457
BMI -
The
Clem
entine
Churchil l
Hosp
ital -
NT4
11
Spire
Bris
tol H
ospita
l - N
T302
North
Eas
t London N
HS Tr
eatm
ent C
entre
- N
TP15
Chapel
Alle
rton H
ospita
l - R
R819
Nuffi
eld H
ealth
, Lee
ds Hosp
ital -
NT2
25
BMI -
The
Ridge
way
Hosp
ital -
NT4
30
Nuffi
eld H
ealth
, Der
by Hosp
ital -
NT2
13
BMI T
he Ed
gbas
ton H
ospita
l - N
T445
BMI -
Gorin
g Hal
l Hosp
ital -
NT4
17
BMI T
he Cav
ell H
ospita
l - N
T451
The
York
shire
Clin
ic -
NVC20
Man
sfiel
d Com
munity
Hosp
ital -
RK5BL
Conglet
on War
Mem
orial H
ospita
l - R
JN63
Aspen
- Holly
House
Hosp
ital -
NYW
01
BMI -
The
Kings
Oak
Hosp
ital -
NT4
21
Amer
sham
Hosp
ital -
RXQ
510%
20%
40%
60%
80%
100%
Friends and Family score by site (inpatients) – December 2014_x000d_Organisations with overall 100% recommendation rate,
ranked by % extremely likely to recommend
Blue columns are NHS organisations, green columns are independent providers. Only sites with a response rate of 20% or above, that produced 20 or more responses and with actual response data are shown. Orgs are ranked by 'extremely likely' percentage and
Page 10 of 49
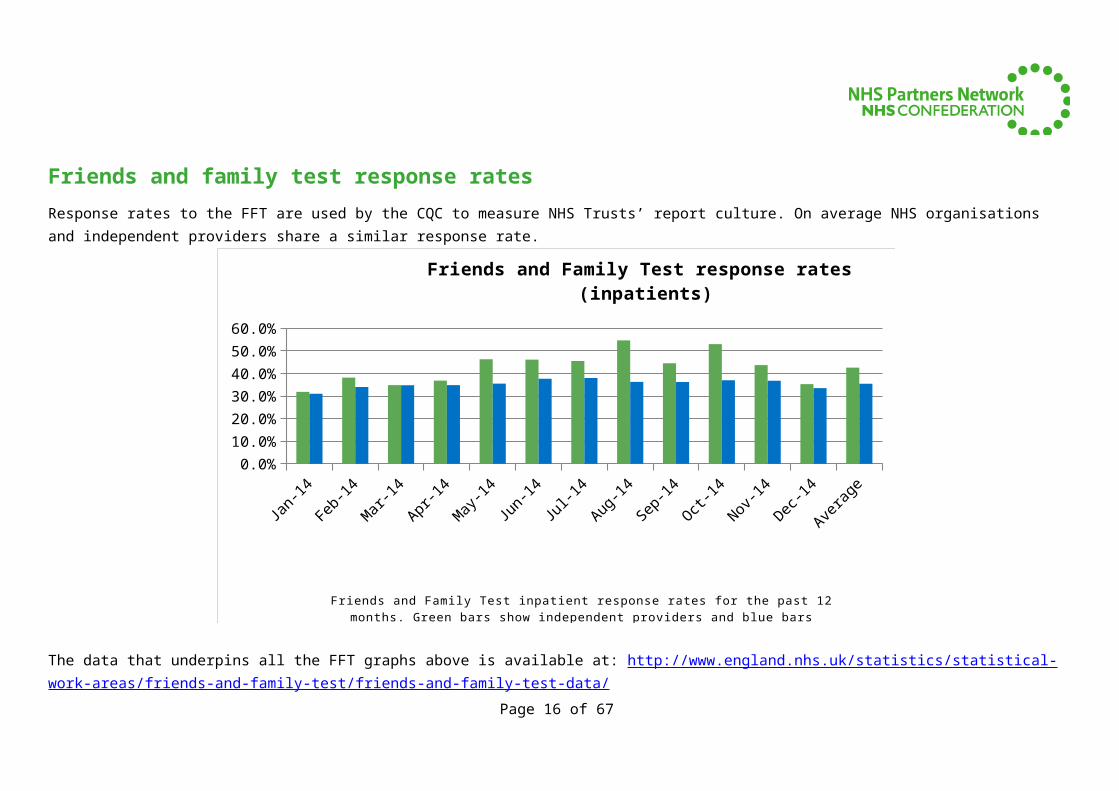
Friends and family test response ratesResponse rates to the FFT are used by the CQC to measure NHS Trusts’ report culture. On average NHS organisations and independent providers share a similar response rate.
Jan-14 Feb-14 Mar-14 Apr-14 May-14 Jun-14 Jul-14 Aug-14 Sep-14 Oct-14 Nov-14 Dec-14 Average0.0%
10.0%
20.0%
30.0%
40.0%
50.0%
60.0%
Friends and Family Test response rates (inpatients)
Friends and Family Test inpatient response rates for the past 12 months. Green bars show independent providers and blue bars represent NHS organisations. Source: NHS England
The data that underpins all the FFT graphs above is available at: http://www.england.nhs.uk/statistics/statistical-work-areas/friends-and-family-test/friends-and-family-test-data/
Page 11 of 49
Clinical quality
Page 12 of 49
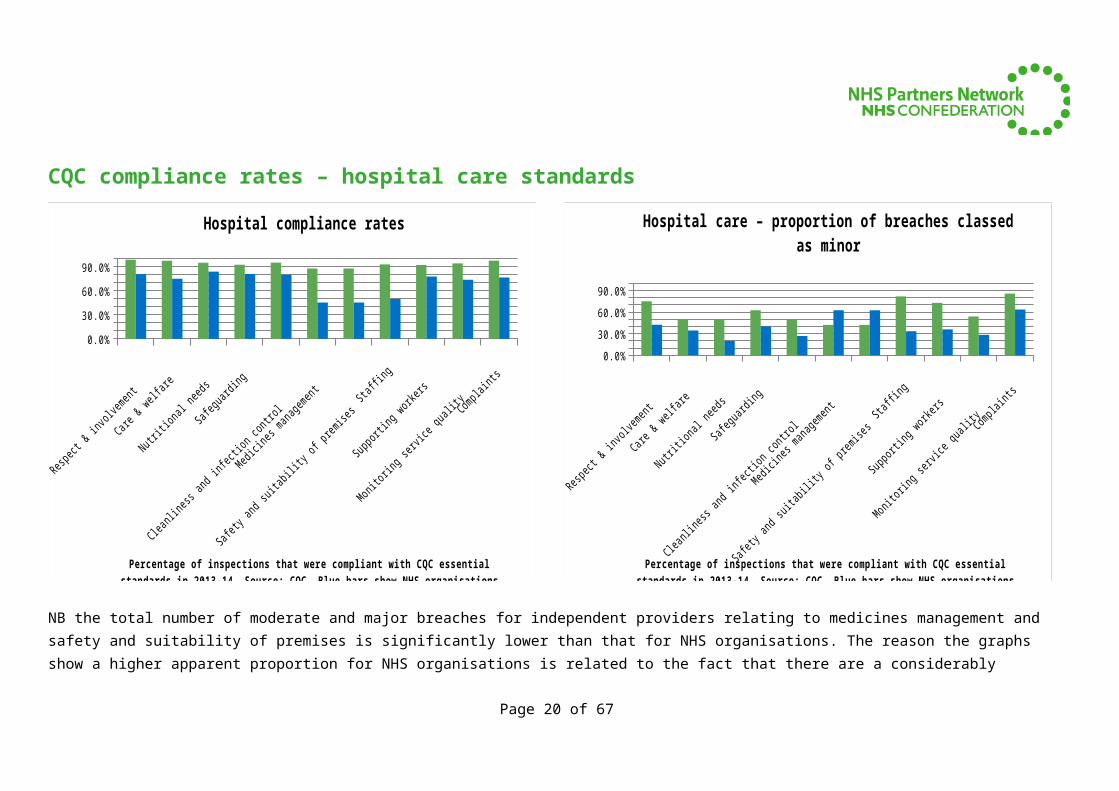
CQC standards 2013–14The CQC is currently introducing a new approach to regulating independent and NHS organisations. This will go live across all areas of care from April 2015. We hope that this will allow a fair and appropriate comparison between all providers of health and social care.
The existing regime is based on compliance with a set of standards defined by the CQC. The CQC has assessed all providers against these outcome measures for the past three years. In general the IS complies with more outcome measures than its NHS peers. The graphs that follow show the rate at which independent and NHS organisations comply with CQC standards. We have shown all relevant standards for the care areas covered by NHS Partners Network members, i.e.:
hospital care standards community healthcare standards independent ambulances (the CQC does not hold comparable State of Care category data for NHS ambulance services)
The graphs that follow are compiled from information provided by the CQC in response to a Freedom of Information request. It provides more detail compliance rates for comparable categories of independent and NHS organisations than was provided in figure 1.2 in the CQC’s latest annual State of Care report.
Source: http://www.cqc.org.uk/content/state-care-2013-14 and the CQC via a Freedom of Information request.
NB when interpreting the graphs below, higher compliance is better. Also, breaches are classed either as minor, moderate or major. It is therefore better if the proportion of breaches classed as minor is higher, as this means a lower proportion of all breaches were moderate and major breaches.
Page 13 of 49

CQC compliance rates – hospital care standards
Respect & involvem
ent
Care & welfare
Nutritional needs
Safeguarding
Cleanliness and infection contro
l
Medicines managem
ent
Safety a
nd suitability of prem
isesSta
ffing
Supporting worke
rs
Monitoring service quality Complain
ts
0.0%10.0%20.0%30.0%40.0%50.0%60.0%70.0%80.0%90.0%
100.0%
Hospital compliance rates
Percentage of inspections that were compliant with CQC essential standards in 2013-14. Source: CQC. Blue bars show NHS organisations and green bars indicate independent providers.
Respect & involvem
ent
Care & welfar
e
Nutritional needs
Safeguarding
Cleanliness and infecti
on control
Medicines m
anagement
Safety a
nd suitability of prem
isesSta
ffing
Supporting worke
rs
Monitoring service quality Complain
ts
0.0%10.0%20.0%30.0%40.0%50.0%60.0%70.0%80.0%90.0%
100.0%
Hospital care – proportion of breaches classed as minor
Percentage of inspections that were compliant with CQC essential standards in 2013-14. Source: CQC. Blue bars show NHS organisations and green bars indicate independent providers.
NB the total number of moderate and major breaches for independent providers relating to medicines management and safety and suitability of premises is significantly lower than that for NHS organisations. The reason the graphs show a higher apparent proportion for NHS organisations is related to the fact that there are a considerably greater proportion of overall breaches by NHS organisations for these standards compared with their independent sector counterparts.
Page 14 of 49
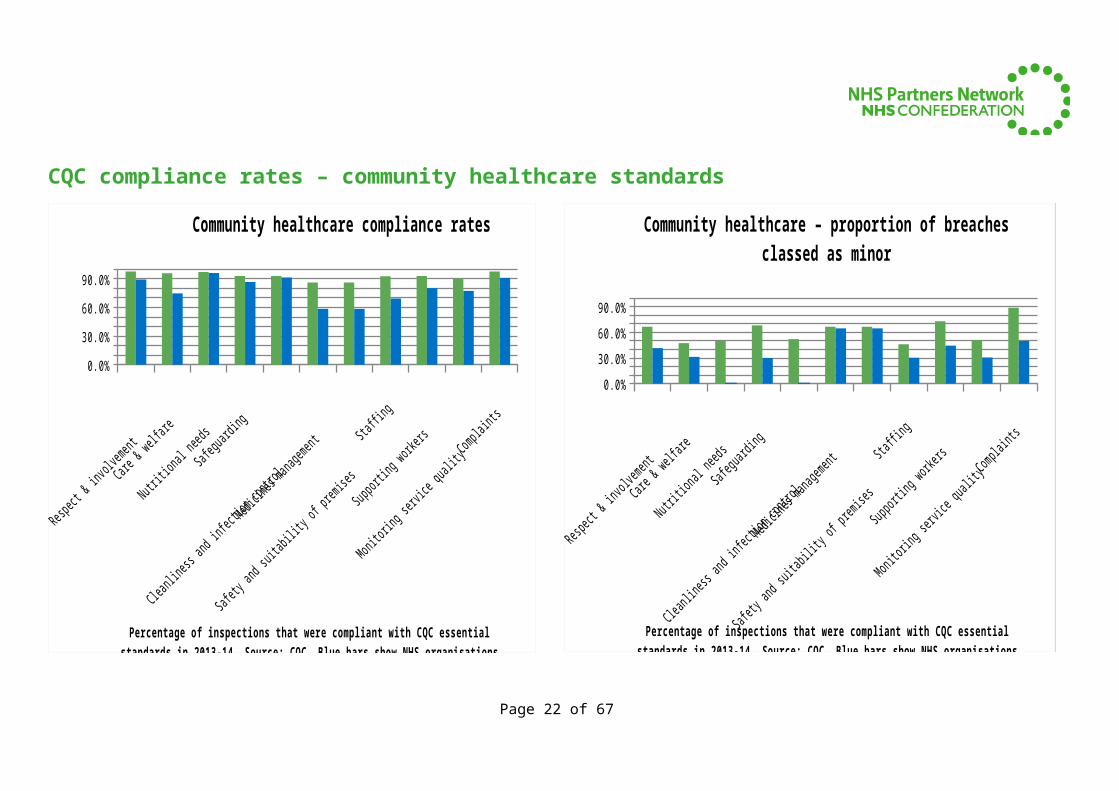
CQC compliance rates – community healthcare standards
Respect & involvement
Care & welfa
re
Nutritional n
eeds
Safeguarding
Cleanliness and infection control
Medicines management
Safety a
nd suitability
of premises
Staffing
Supporting workers
Monitoring service q
uality Complaints
0.0%10.0%20.0%30.0%40.0%50.0%60.0%70.0%80.0%90.0%
100.0%
Community healthcare compliance rates
Percentage of inspections that were compliant with CQC essential standards in 2013-14. Source: CQC. Blue bars show NHS organisations and green bars indicate independent providers.
Respect & involvem
entCare & welfare
Nutritional n
eeds
Safeguarding
Cleanliness a
nd infection control
Medicines m
anagement
Safety a
nd suitability
of premises
Staffing
Supporting workers
Monitoring service quality Complaints
0.0%10.0%20.0%30.0%40.0%50.0%60.0%70.0%80.0%90.0%
100.0%
Community healthcare – proportion of breaches classed as minor
Percentage of inspections that were compliant with CQC essential standards in 2013-14. Source: CQC. Blue bars show NHS organisations and green bars indicate independent providers.
Page 15 of 49
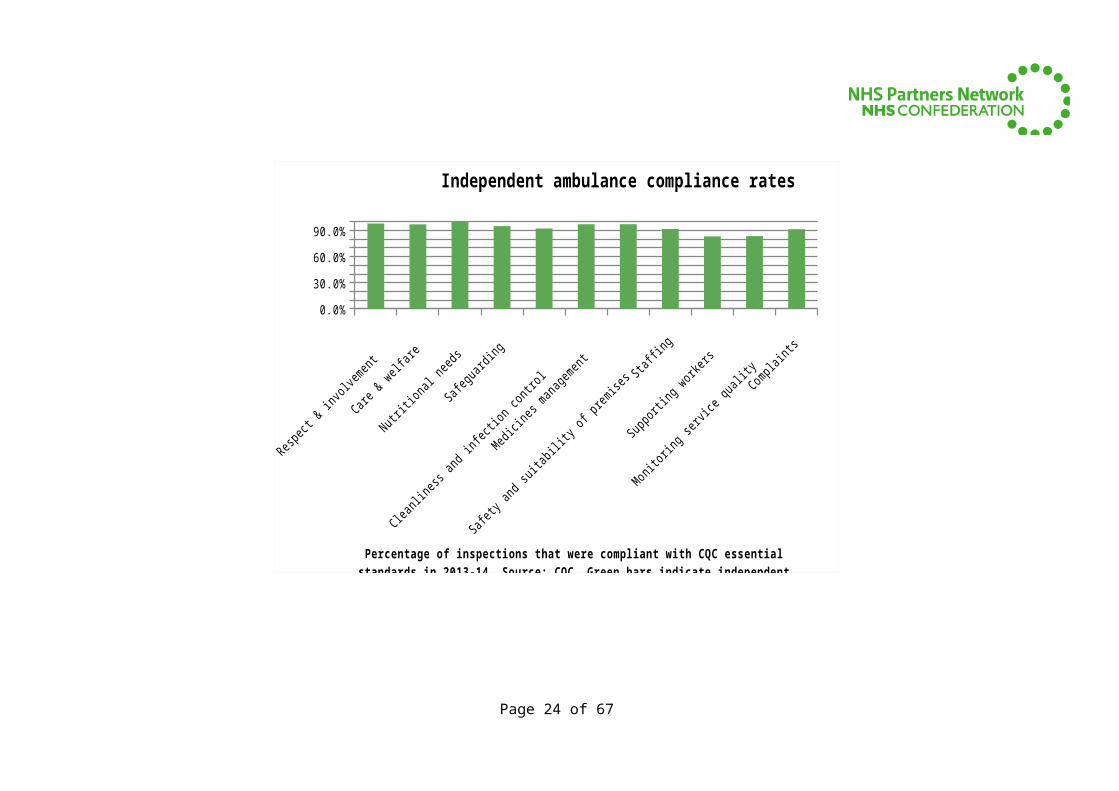
CQC compliance rates – independent ambulancesNB, information for independent ambulances is shown below. The CQC does not hold comparable State of Care category data for NHS ambulance services. Because the actual number of breaches is very low, we have not produced a graph of the proportion of minor breaches as this would not be statistically meaningful.
Respect
& involvement
Care & welfa
re
Nutritional n
eeds
Safegu
arding
Cleanliness
and infec
tion contro
l
Medicines m
anagement
Safety
and suitab
ility o
f premises
Staffing
Supporting worke
rs
Monitorin
g servic
e qualit
yComplain
ts
0.0%10.0%20.0%30.0%40.0%50.0%60.0%70.0%80.0%90.0%
100.0%
Independent ambulance compliance rates
Percentage of inspections that were compliant with CQC essential standards in 2013-14. Source: CQC. Green bars indicate independent providers. No data is available for NHS Ambulance Trusts.
Page 16 of 49
Patient outcomes and safety
Page 17 of 49
Patient outcomes and safety
Indicators that relate to outcomes and safety for which it is reasonable to make comparisons between independent sector organisations and their NHS counterparts include:
Patient Reported Outcome Measures (PROMs); and Rate of assessment for VTE (blood clots)
Infection control information is also an important indicator. Because Public Health England analyses information collected for the independent sector and the NHS organisations on a different basis, its view is that like-for-like comparison should not be made. For completeness, we have published rates for independent sector providers in the pages that follow. These show that independent providers have very low rates of healthcare-acquired infections.
Page 18 of 49

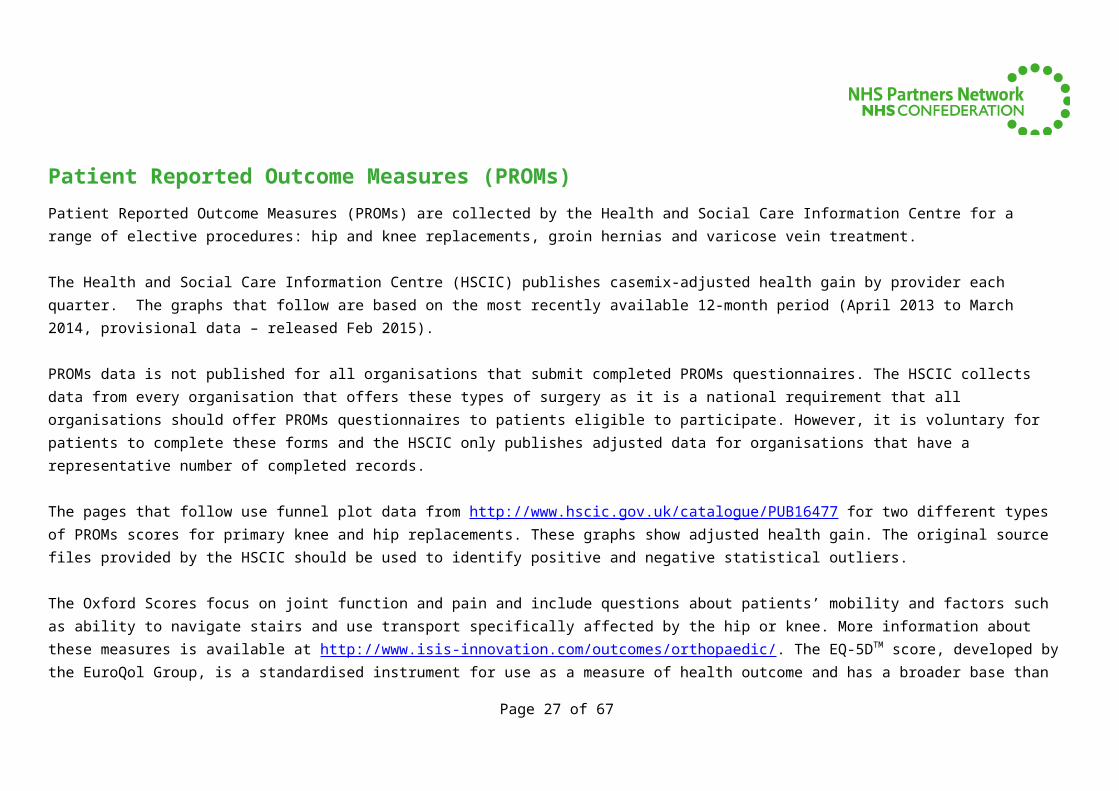
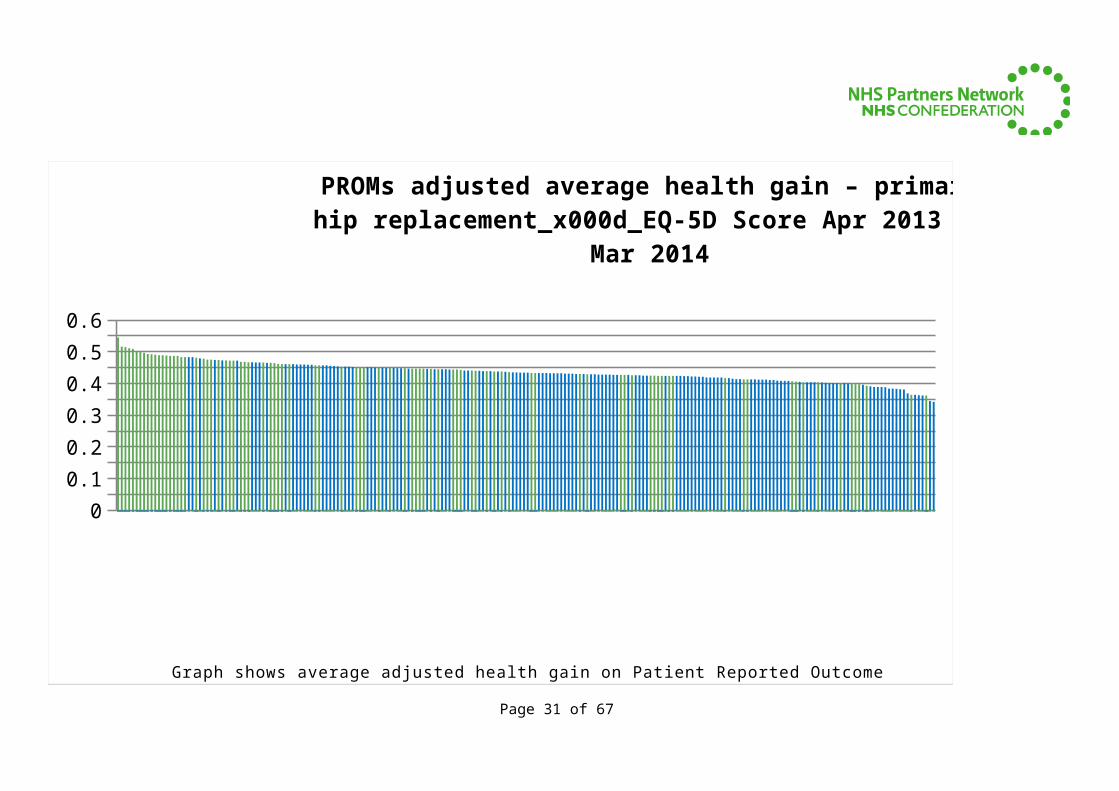
Patient Reported Outcome Measures (PROMs)Patient Reported Outcome Measures (PROMs) are collected by the Health and Social Care Information Centre for a range of elective procedures: hip and knee replacements, groin hernias and varicose vein treatment.
The Health and Social Care Information Centre (HSCIC) publishes casemix-adjusted health gain by provider each quarter. The graphs that follow are based on the most recently available 12-month period (April 2013 to March 2014, provisional data – released Feb 2015).
PROMs data is not published for all organisations that submit completed PROMs questionnaires. The HSCIC collects data from every organisation that offers these types of surgery as it is a national requirement that all organisations should offer PROMs questionnaires to patients eligible to participate. However, it is voluntary for patients to complete these forms and the HSCIC only publishes adjusted data for organisations that have a representative number of completed records.
The pages that follow use funnel plot data from http://www.hscic.gov.uk/catalogue/PUB16477 for two different types of PROMs scores for primary knee and hip replacements. These graphs show adjusted health gain. The original source files provided by the HSCIC should be used to identify positive and negative statistical outliers.
The Oxford Scores focus on joint function and pain and include questions about patients’ mobility and factors such as ability to navigate stairs and use transport specifically affected by the hip or knee. More information about these measures is available at http://www.isis-innovation.com/outcomes/orthopaedic/. The EQ-5DTM score, developed by the EuroQol Group, is a standardised instrument for use as a measure of health outcome and has a broader base than the Oxford scores. Its questions relate to mobility, self-care, usual life activities, pain/discomfort and anxiety/depression. More information about the EQ-5D is available at http://www.euroqol.org. The Health and Social Care Information Centre also provides an informative guide to PROMs methodology used by the Centre, available at http://www.hscic.gov.uk/article/3843/Background-information-about-PROMs.
Page 19 of 49
0
5
10
15
20
25
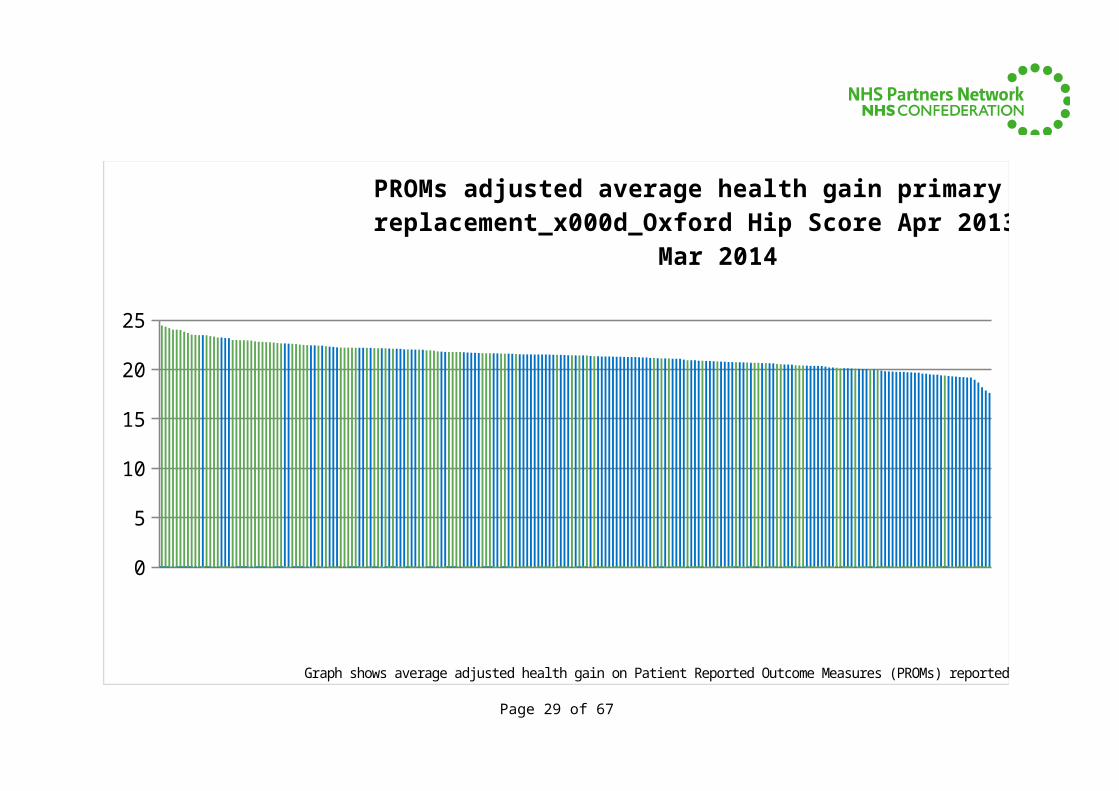
PROMs adjusted average health gain primary hip replace-ment_x000d_Oxford Hip Score Apr 2013 to Mar 2014
Graph shows average adjusted health gain on Patient Reported Outcome Measures (PROMs) reported by the Health and Social Care Information Centre.
Green lines relate to independent providers and blue bars treated by NHS organisationsPage 20 of 49
BMI - TH
REE SH
IRES HOSP
ITAL
BMI - TH
E PARK HOSP
ITAL
SPRIN
GFIELD
HOSPITA
L
NUFFIELD
HEA
LTH, C
AMBRIDGE HOSP
ITAL
SPIRE C
LARE P
ARK HOSP
ITAL
NUFFIELD
HEALTH
, PLYM
OUTH HOSP
ITAL
SHEP
TON M
ALLET N
HS TREA
TMEN
T CEN
TRE
ST HUGH'S
HOSPITA
L
SPIRE W
ELLES
LEY HOSP
ITAL
SPIRE C
AMBRIDGE LEA
HOSPITA
L
NUFFIELD
HEA
LTH, N
ORTH ST
AFFORDSH
IRE HOSP
ITAL
NORTHAMPTO
N GENER
AL HOSP
ITAL N
HS TRUST
EMER
SONS G
REEN N
HS TREA
TMEN
T CEN
TRE
SPIRE L
ITTLE
ASTON HOSP
ITAL
CIRCLE BATH
HOSPITA
L
SPIRE L
EICEST
ER HOSP
ITAL
CHELSEA
AND W
ESTMIN
STER HOSP
ITAL N
HS FOUNDATIO
N TRUST
YEOVIL
DISTRICT H
OSPITA
L NHS F
OUNDATION TR
UST
THE R
OYAL O
RTHOPAED
IC HOSPITA
L NHS F
OUNDATION TR
UST
SPIRE P
ORTSMOUTH
HOSPITA
L
NUFFIELD
HEA
LTH, T
HE GROSV
ENOR HOSP
ITAL,
CHESTER
THE H
ORDER CEN
TRE -
ST JO
HNS ROAD
RIVERS H
OSPITA
L
BMI - TH
E CHILT
ERN HOSP
ITAL
NUFFIELD
HEALTH
, YORK HOSP
ITAL
WOODLAND HOSP
ITAL
BMI - TH
E SANDRIN
GHAM HOSPITA
L
WEST M
IDLANDS H
OSPITA
L
SPIRE S
USSEX HOSP
ITAL
NEW HALL
HOSPITA
L
BMI - TH
E RIDGEW
AY HOSP
ITAL
BMI THE L
ANCASTER HOSP
ITAL
PENIN
SULA
NHS T
REATM
ENT C
ENTR
E
IPSWICH HOSP
ITAL N
HS TRUST
GUY'S AND ST
THOMAS'
NHS FOUNDATIO
N TRUST
BMI THE H
UDDERSFI
ELD HOSP
ITAL
BMI - TH
E BEA
UMONT HOSP
ITAL
BARLBOROUGH N
HS TREA
TMEN
T CEN
TRE
DUCHY HOSP
ITAL
EUXTO
N HALL HOSP
ITAL
DARTFORD AND GRAVESH
AM NHS T
RUST
OXFORD UN IVER
SITY H
OSPITA
LS NHS T
RUST
OAKS HOSP
ITAL
KING'S
COLLEGE H
OSPITA
L NHS F
OUNDATION TR
UST
NUFFIELD
HEA
LTH, W
OLVER
HAMPTO
N HOSPITA
L
IMPER
IAL COLLE
GE HEA
LTHCARE N
HS TRUST
ROYAL D
EVON AND EX
ETER N
HS FOUNDATIO
N TRUST
ROYAL S
URREY COUNTY
HOSPITA
L NHS F
OUNDATION TR
UST
NUFFIELD
HEA
LTH, T
AUNTON HOSP
ITAL
SPIRE H
ARPENDEN
HOSPITA
L
05
10152025
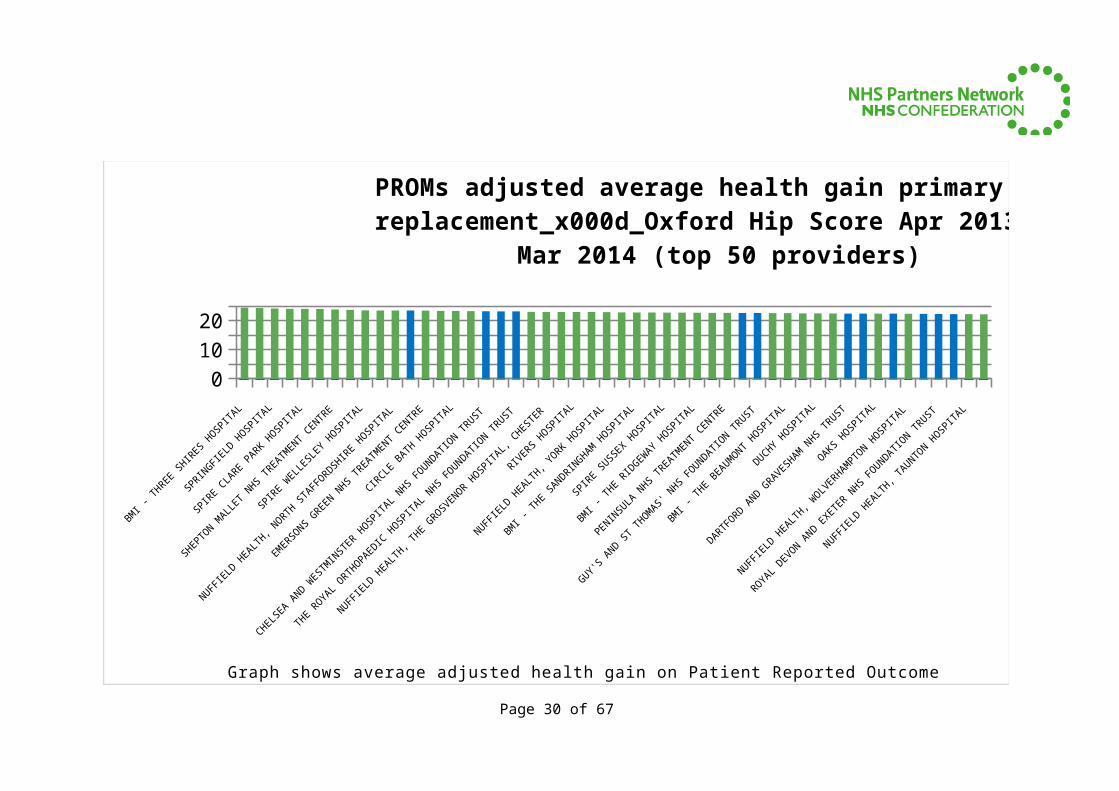
PROMs adjusted average health gain primary hip replacement_x000d_Oxford Hip Score Apr 2013 to Mar 2014 (top 50
providers)
Graph shows average adjusted health gain on Patient Reported Outcome Measures (PROMs) reported by the Health and Social Care Information Centre.
Green lines relate to independent providers and blue bars treated by NHS organisationsPage 21 of 49
00.05
0.10.15
0.20.25
0.30.35
0.40.45
0.50.55
0.6
PROMs adjusted average health gain – primary hip re-placement_x000d_EQ-5D Score Apr 2013 to Mar 2014
Graph shows average adjusted health gain on Patient Reported Outcome Measures (PROMs) reported by the Health and Social Care Information Centre.
Green lines relate to independent providers and blue bars treated by NHS organisations
Page 22 of 49
BMI - TH
E PARK HOSP
ITAL
NUFFIELD
HEALTH
, CAMBRIDGE H
OSPITA
L
BMI - TH
REE SH
IRES HOSP
ITAL
SPIRE C
LARE P
ARK HOSP
ITAL
SPRIN
GFIELD
HOSPITA
L
RIVERS H
OSPITA
L
NUFFIELD
HEALTH
, EXETE
R HOSPITA
L
BMI - TH
E CHILT
ERN HOSP
ITAL
SPIRE C
AMBRIDGE LEA
HOSPITA
L
BMI - TH
E SANDRIN
GHAM HOSPITA
L
KING'S
COLLEGE H
OSPITA
L NHS F
OUNDATION TR
UST
THE R
OYAL O
RTHOPAED
IC HOSPITA
L NHS F
OUNDATION TR
UST
ROWLEY H
ALL HOSP
ITAL
IMPER
IAL COLLE
GE HEA
LTHCARE N
HS TRUST
NORTHAMPTO
N GENER
AL HOSP
ITAL N
HS TRUST
SPIRE H
ULL AND EA
ST RIDIN
G HOSPITA
L
YEOVIL
DISTRIC
T HOSP
ITAL N
HS FOUNDATIO
N TRUST
THE H
ORDER CEN
TRE -
ST JO
HNS ROAD
OXFORD UN IVER
SITY H
OSPITA
LS NHS T
RUST
ROYAL S
URREY COUNTY
HOSPITA
L NHS F
OUNDATION TR
UST
GUY'S AND ST
THOMAS'
NHS FOUNDATIO
N TRUST
ST HUGH'S
HOSPITA
L
BMI THE L
ANCASTER HOSP
ITAL
NUFFIELD
HEALTH
, TAUNTO
N HOSPITA
L
NORTH W
EST LO
NDON HOSPITA
LS NHS T
RUST
00.15
0.30.45
0.6
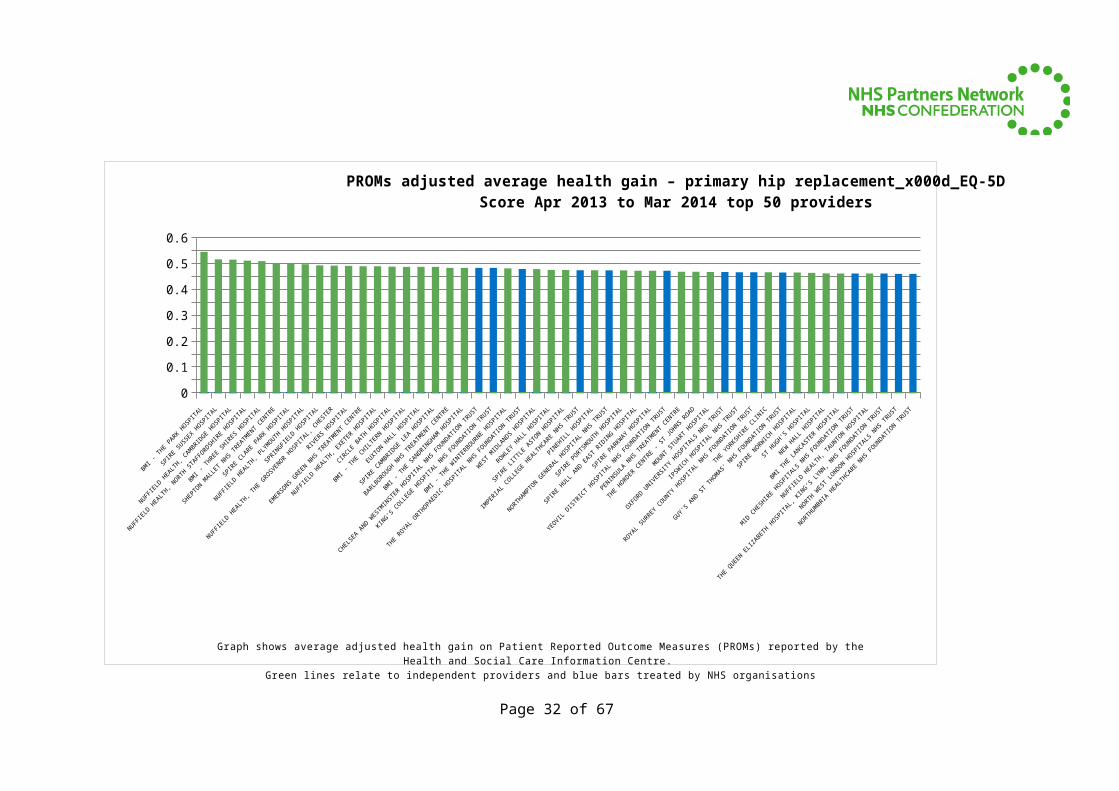
PROMs adjusted average health gain – primary hip replace-ment_x000d_EQ-5D Score Apr 2013 to Mar 2014 top 50
providers
Graph shows average adjusted health gain on Patient Reported Outcome Measures (PROMs) reported by the Health and Social Care Information Centre.
Green lines relate to independent providers and blue bars treated by NHS organisationsPage 23 of 49
02468
101214161820
PROMs adjusted average health gain – primary knee re-placement_x000d_Oxford Knee Score Apr 2013 to Mar 2014
Graph shows average adjusted health gain on Patient Reported Outcome Measures (PROMs) reported by the Health and Social Care Information Centre.
Green lines relate to independent providers and blue bars treated by NHS organisationsPage 24 of 49
BMI - TH
E BEA
UMONT HOSP
ITAL
WINFIE
LD HOSP
ITAL
NUFFIELD
HEALTH
, CAMBRIDGE H
OSPITA
L
NUFFIELD
HEALTH
, DER
BY HOSP
ITAL
FULW
OOD HALL HOSP
ITAL
SPIRE C
HESHIRE H
OSPITA
L
BENEN
DEN HOSP
ITAL
PARK HILL HOSP
ITAL
NUFFIELD
HEA
LTH, W
OLVER
HAMPTON HOSP
ITAL
NUFFIELD
HEALTH
, PLYM
OUTH HOSP
ITAL
NUFFIELD
HEALTH
, TAUNTO
N HOSPITA
L
IPSWICH HOSP
ITAL N
HS TRUST
BMI WOODLA
NDS HOSP
ITAL
SPRIN
GFIELD
HOSPITA
L
DARTFORD AND GRAVESH
AM NHS T
RUST
EUXTO
N HALL
HOSPITA
L
NORTHER
N DEVON HEA
LTHCARE N
HS TRUST
SPIRE E
LLAND HOSP
ITAL
FITZW
ILLIAM HOSP
ITAL
NUFFIELD
HEALTH
, TEES
HOSPITA
L
SPIRE P
ORTSMOUTH
HOSPITA
L
BMI - TH
E PARK HOSP
ITAL
THE R
OTHER
HAM NHS F
OUNDATION TR
UST
ISLE O
F WIGHT N
HS TRUST
EMER
SONS G
REEN N
HS TREA
TMEN
T CEN
TRE
0
6
12
18
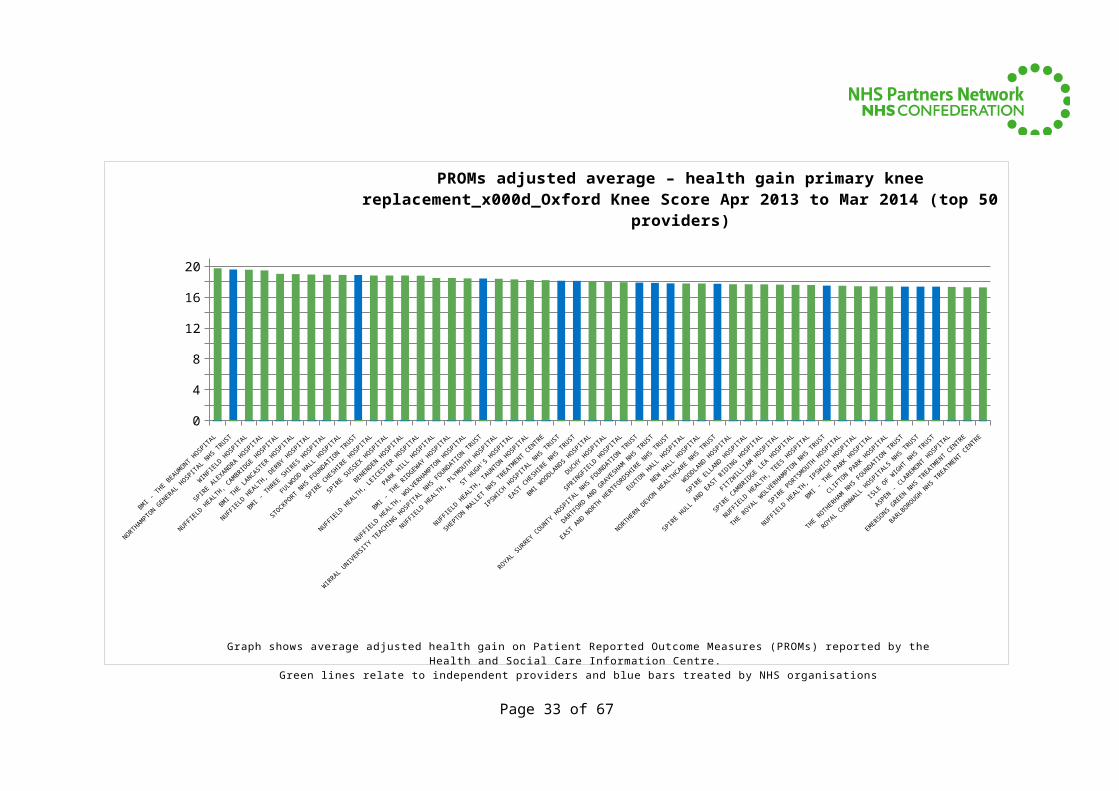
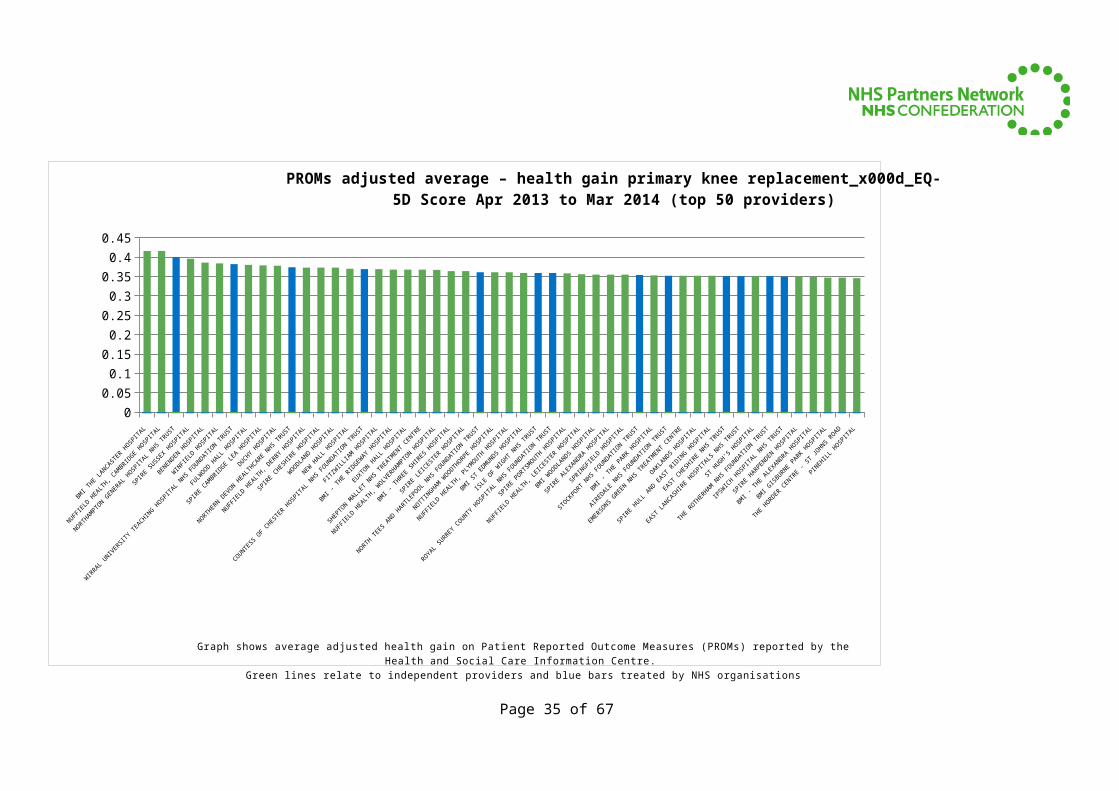
PROMs adjusted average – health gain primary knee replacement_x000d_Oxford Knee Score Apr 2013 to Mar 2014 (top 50
providers)
Graph shows average adjusted health gain on Patient Reported Outcome Measures (PROMs) reported by the Health and Social Care Information Centre.
Green lines relate to independent providers and blue bars treated by NHS organisationsPage 25 of 49
0
0.05
0.1
0.15
0.2
0.25
0.3
0.35
0.4
0.45
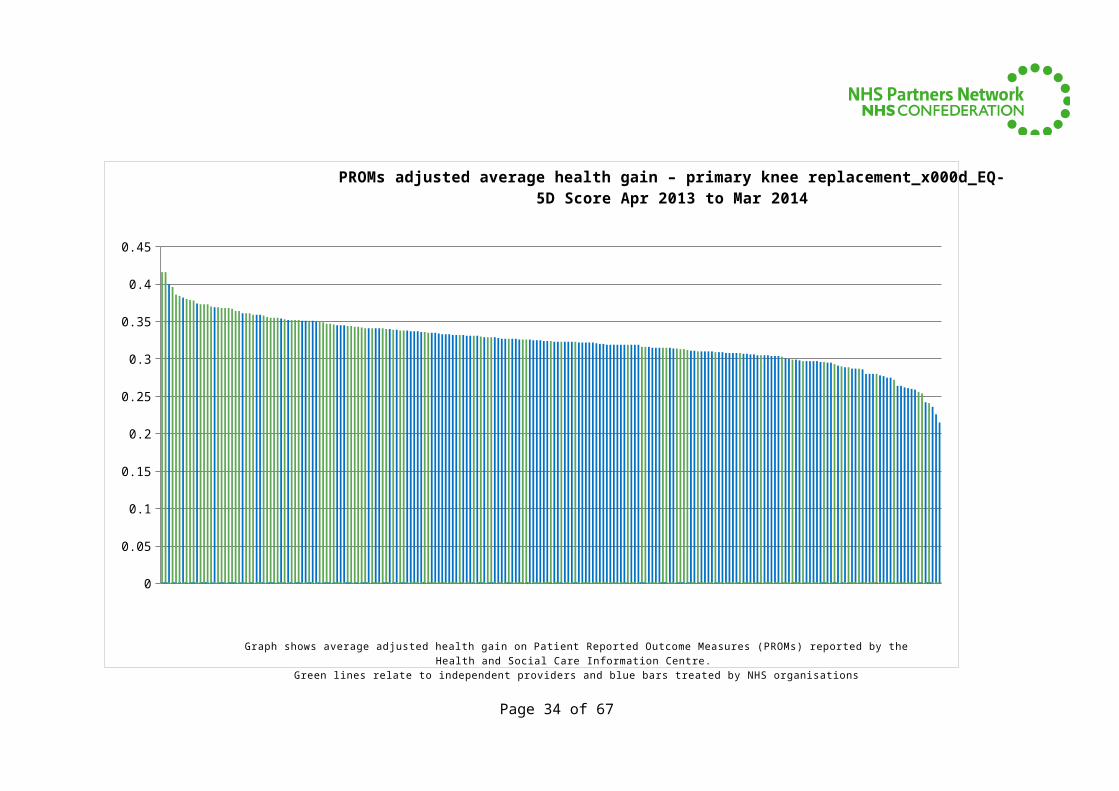
PROMs adjusted average health gain – primary knee replacement_x000d_EQ-5D Score Apr 2013 to Mar 2014
Graph shows average adjusted health gain on Patient Reported Outcome Measures (PROMs) reported by the Health and Social Care Information Centre.
Green lines relate to independent providers and blue bars treated by NHS organisationsPage 26 of 49
BMI THE L
ANCASTER HOSP
ITAL
NUFFIELD
HEALTH
, CAMBRIDGE H
OSPITA
L
NORTHAMPTO
N GENER
AL HOSP
ITAL N
HS TRUST
SPIRE S
USSEX HOSP
ITAL
BENEN
DEN HOSP
ITAL
WINFIE
LD HOSP
ITAL
WIRRAL UNIVER
SITY T
EACHIN
G HOSPITA
L NHS F
OUNDATION TR
UST
FULW
OOD HALL HOSP
ITAL
SPIRE C
AMBRIDGE LEA
HOSPITA
L
DUCHY HOSP
ITAL
NORTHER
N DEVON HEA
LTHCARE N
HS TRUST
NUFFIELD
HEALTH
, DER
BY HOSP
ITAL
SPIRE C
HESHIRE H
OSPITA
L
WOODLAND HOSP
ITAL
NEW HALL
HOSPITA
L
COUNTESS O
F CHEST
ER HOSP
ITAL N
HS FOUNDATIO
N TRUST
FITZW
ILLIAM HOSP
ITAL
BMI - TH
E RIDGEW
AY HOSP
ITAL
EUXTO
N HALL HOSP
ITAL
SHEP
TON M
ALLET N
HS TREA
TMEN
T CEN
TRE
NUFFIELD
HEALTH
, WOLV
ERHAMPTO
N HOSPITA
L
BMI - TH
REE SH
IRES HOSP
ITAL
SPIRE L
EICEST
ER HOSP
ITAL
NORTH TE
ES AND HARTLE
POOL NHS F
OUNDATION TR
UST
NOTTINGHAM W
OODTHORPE H
OSPITA
L
NUFFIELD
HEALTH
, PLYM
OUTH HOSP
ITAL
BMI ST E
DMUNDS HOSP
ITAL
ISLE O
F WIGHT N
HS TRUST
ROYAL S
URREY COUNTY
HOSPITA
L NHS F
OUNDATION TR
UST
SPIRE P
ORTSMOUTH
HOSPITAL
NUFFIELD
HEALTH
, LEIC
ESTER
HOSPITA
L
BMI WOODLA
NDS HOSP
ITAL
SPIRE A
LEXANDRA HOSP
ITAL
SPRIN
GFIELD
HOSPITA
L
STOCKPORT N
HS FOUNDATIO
N TRUST
BMI - TH
E PARK HOSP
ITAL
AIREDALE
NHS FOUNDATIO
N TRUST
EMER
SONS G
REEN N
HS TREA
TMEN
T CEN
TRE
OAKLANDS H
OSPITA
L
SPIRE H
ULL AND EA
ST RIDIN
G HOSPITA
L
EAST
CHESHIRE N
HS TRUST
EAST
LANCASH
IRE HOSP
ITALS
NHS TRUST
ST HUGH'S
HOSPITA
L
THE R
OTHER
HAM NHS F
OUNDATION TR
UST
IPSWICH HOSP
ITAL NHS T
RUST
SPIRE H
ARPENDEN HOSP
ITAL
BMI - TH
E ALEX
ANDRA HOSPITA
L
BMI GISB
URNE PARK HOSP
ITAL
THE H
ORDER CEN
TRE -
ST JO
HNS ROAD
PINEH
ILL HOSP
ITAL
00.10.20.30.4
PROMs adjusted average – health gain primary knee replace-ment_x000d_EQ-5D Score Apr 2013 to Mar 2014 (top 50
providers)
Graph shows average adjusted health gain on Patient Reported Outcome Measures (PROMs) reported by the Health and Social Care Information Centre.
Green lines relate to independent providers and blue bars treated by NHS organisationsPage 27 of 49
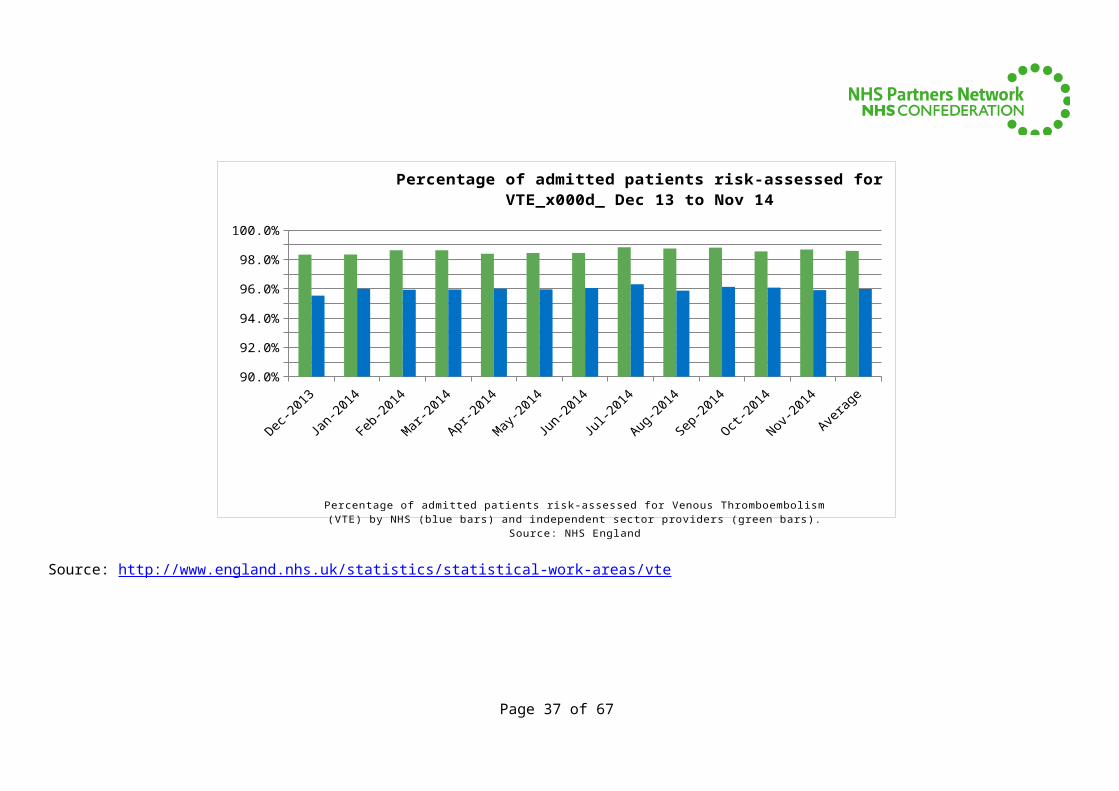
Rate of assessment for VTE (blood clots)All providers of acute adult inpatient care are required to provide information on the percentage of admitted patients who are risk-assessed for venous thromboembolism (blood clots). The graph below shows data for the past year. The average rate for independent providers is 98.4% compared with 95.9% of NHS organisations.
Dec-2013
Jan-2014
Feb-2014
Mar-2014
Apr-2014
May-2014
Jun-2014
Jul-2014
Aug-2014
Sep-2014
Oct-2014
Nov-2014
Averag
e90.0%91.0%92.0%93.0%94.0%95.0%96.0%97.0%98.0%99.0%
100.0%
Percentage of admitted patients risk-assessed for VTE_x000d_ Dec 13 to Nov 14
Percentage of admitted patients risk-assessed for Venous Thromboembolism (VTE) by NHS (blue bars) and independent sector providers (green bars). Source: NHS England
Source: http://www.england.nhs.uk/statistics/statistical-work-areas/vte
Page 28 of 49
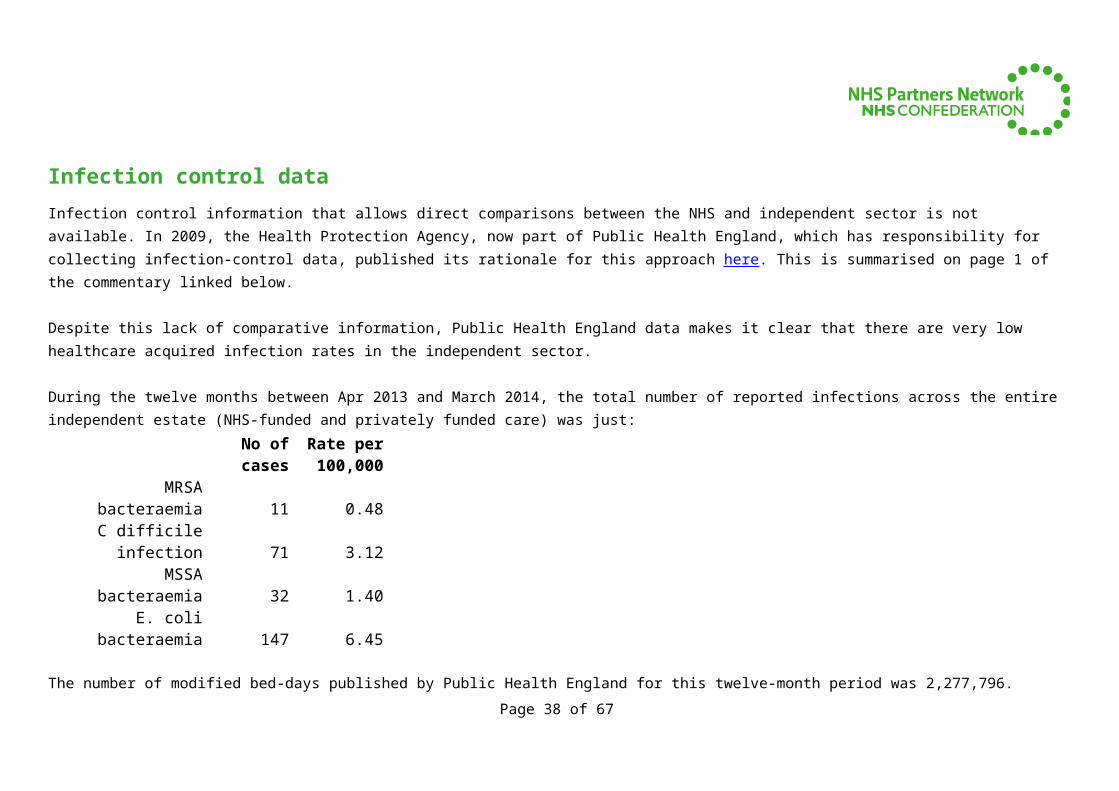
Infection control dataInfection control information that allows direct comparisons between the NHS and independent sector is not available. In 2009, the Health Protection Agency, now part of Public Health England, which has responsibility for collecting infection-control data, published its rationale for this approach here. This is summarised on page 1 of the commentary linked below.
Despite this lack of comparative information, Public Health England data makes it clear that there are very low healthcare acquired infection rates in the independent sector.
During the twelve months between Apr 2013 and March 2014, the total number of reported infections across the entire independent estate (NHS-funded and privately funded care) was just:
No of cases
Rate per 100,000
MRSA bacteraemia 11 0.48C difficile infection 71 3.12MSSA bacteraemia 32 1.40E. coli bacteraemia 147 6.45
The number of modified bed-days published by Public Health England for this twelve-month period was 2,277,796.
Source: Public Health England (https://www.gov.uk/government/statistics/mrsa-mssa-and-e-coli-bacteraemia-and-clostridium-difficile-infection-annual-data-for-independent-sector-healthcare-organisations)
Page 29 of 49
Efficiency indicators
Page 30 of 49
Referral to treatment times
Referral to treatment times show that patients are treated earlier by independent sector providers compared with those treated by NHS organisations. Waiting times are an important indicator of organisational efficiency and for patients deciding where to choose treatment.
Mean* and median waiting times are generally shorter across most specialties for both inpatients and outpatients treated by independent providers compared with their NHS peers.
Historic data has been updated this month to reflect the revised data published by NHS England in February covering December 2014. During that month: Outpatients treated by independent providers had on average (mean) waited for 5.3 weeks, i.e. 9.5 fewer days than patients treated by NHS organisations Inpatients treated by independent providers waited an average (mean) of 9.2 weeks: 4.1 fewer days than those treated by NHS organisations 95% of outpatients treated by independent sector organisations were treated within 11.8 weeks, with NHS organisations taking 16.5 weeks to treat the same
proportion of outpatients 95% of inpatients treated by independent sector organisations were treated within 15.8 weeks, with NHS organisations taking 23 weeks to treat the same
proportion of outpatients – almost five weeks above the 18-week commitment.
http://www.england.nhs.uk/statistics/statistical-work-areas/rtt-waiting-times/
* NB Means have been inferred from data published by NHS England. This data shows numbers of patients waiting between 1 and 2 weeks, 2 and 3 weeks, etc. up to 52+ weeks for RTT times and 13+ weeks for diagnostic waiting times. Mean values have been calculated on the assumption that patients who have been waiting between 1 and 2 weeks have waited an average of 1.5 weeks etc. Also, for those patients waiting longer than 52 weeks (RTT) or 13 weeks (diagnostics), we have taken a value of 13.5 weeks which is likely to be an underestimate. As we are looking at national trends rather than specific provider-level performance we have counted all patients when calculating means rather than excluding organisations with low volumes.
Page 31 of 49
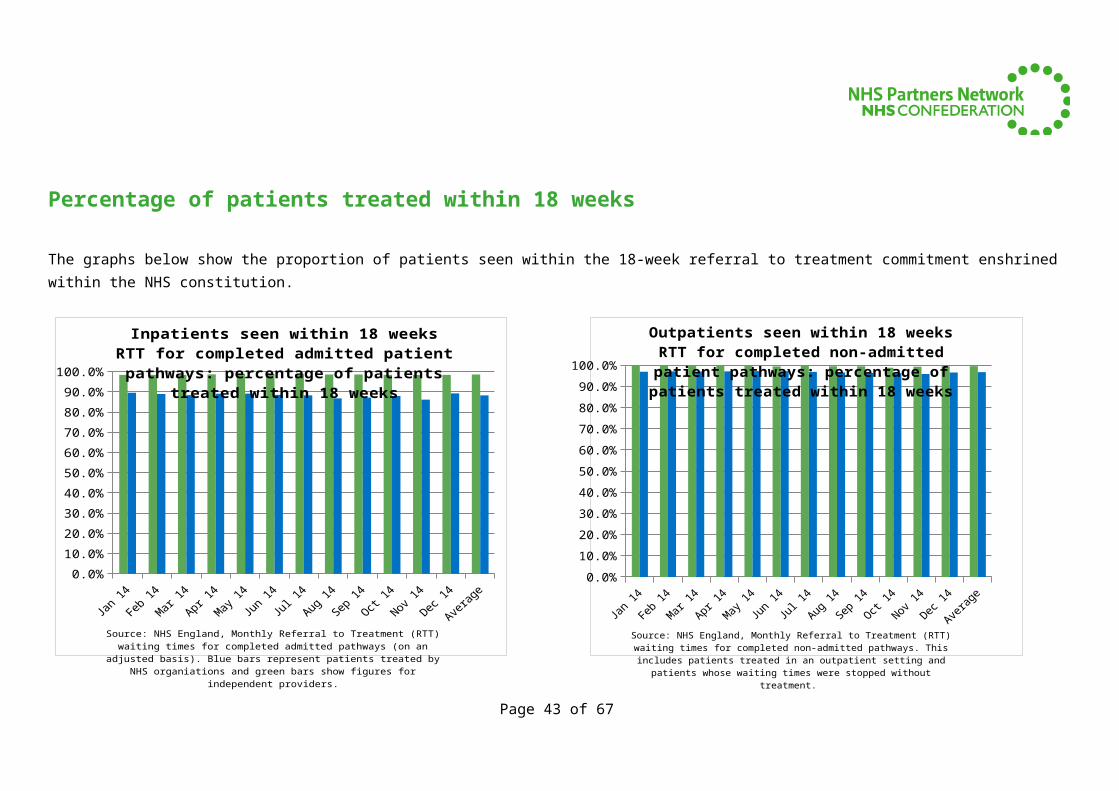
Percentage of patients treated within 18 weeks
The graphs below show the proportion of patients seen within the 18-week referral to treatment commitment enshrined within the NHS constitution.
Jan 14 Feb 14 Mar 14 Apr 14 May 14 Jun 14 Jul 14 Aug 14 Sep 14 Oct 14 Nov 14 Dec 14 Average0.0%
10.0%20.0%30.0%40.0%50.0%60.0%70.0%80.0%90.0%
100.0%
Inpatients seen within 18 weeksRTT for completed admitted patient pathways: percentage of patients
treated within 18 weeks
Source: NHS England, Monthly Referral to Treatment (RTT) waiting times for completed admitted pathways (on an ad-justed basis). Blue bars represent patients treated by NHS organiations and green bars show figures for independent
providers.
Jan 14 Feb 14 Mar 14 Apr 14 May 14 Jun 14 Jul 14 Aug 14 Sep 14 Oct 14 Nov 14 Dec 14 Average0.0%
10.0%
20.0%
30.0%
40.0%
50.0%
60.0%
70.0%
80.0%
90.0%
100.0%
Outpatients seen within 18 weeksRTT for completed non-admitted patient pathways: percentage of
patients treated within 18 weeks
Source: NHS England, Monthly Referral to Treatment (RTT) waiting times for completed non-admitted pathways. This includes patients treated in an outpatient setting and patients whose waiting times were stopped without treatment.
Page 32 of 49
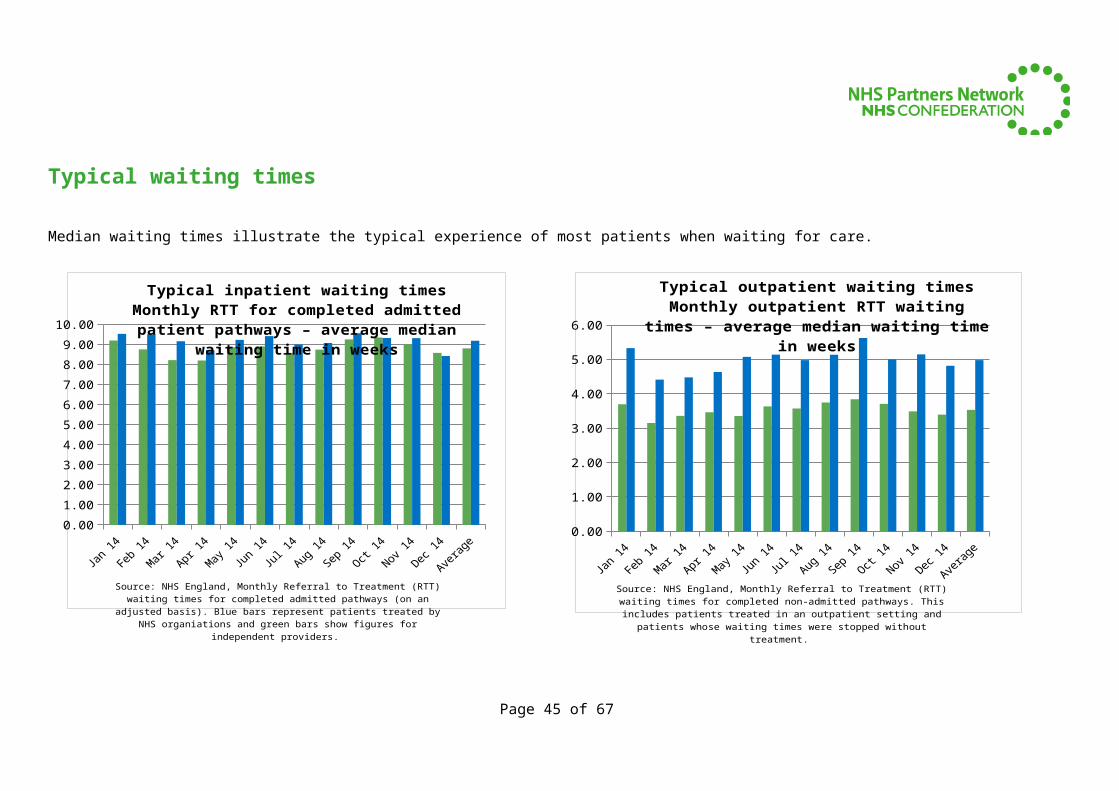
Typical waiting times
Median waiting times illustrate the typical experience of most patients when waiting for care.
Jan 14 Feb 14 Mar 14 Apr 14 May 14 Jun 14 Jul 14 Aug 14 Sep 14 Oct 14 Nov 14 Dec 14 Average0.001.002.003.004.005.006.007.008.009.00
10.00
Typical inpatient waiting timesMonthly RTT for completed admitted patient pathways – average
median waiting time in weeks
Source: NHS England, Monthly Referral to Treatment (RTT) waiting times for completed admitted pathways (on an ad-justed basis). Blue bars represent patients treated by NHS organiations and green bars show figures for independent
providers.
Jan 14 Feb 14 Mar 14 Apr 14 May 14 Jun 14 Jul 14 Aug 14 Sep 14 Oct 14 Nov 14 Dec 14 Average0.00
1.00
2.00
3.00
4.00
5.00
6.00
Typical outpatient waiting timesMonthly outpatient RTT waiting times – average median waiting time
in weeks
Source: NHS England, Monthly Referral to Treatment (RTT) waiting times for completed non-admitted pathways. This includes patients treated in an outpatient setting and patients whose waiting times were stopped without treatment.
Page 33 of 49
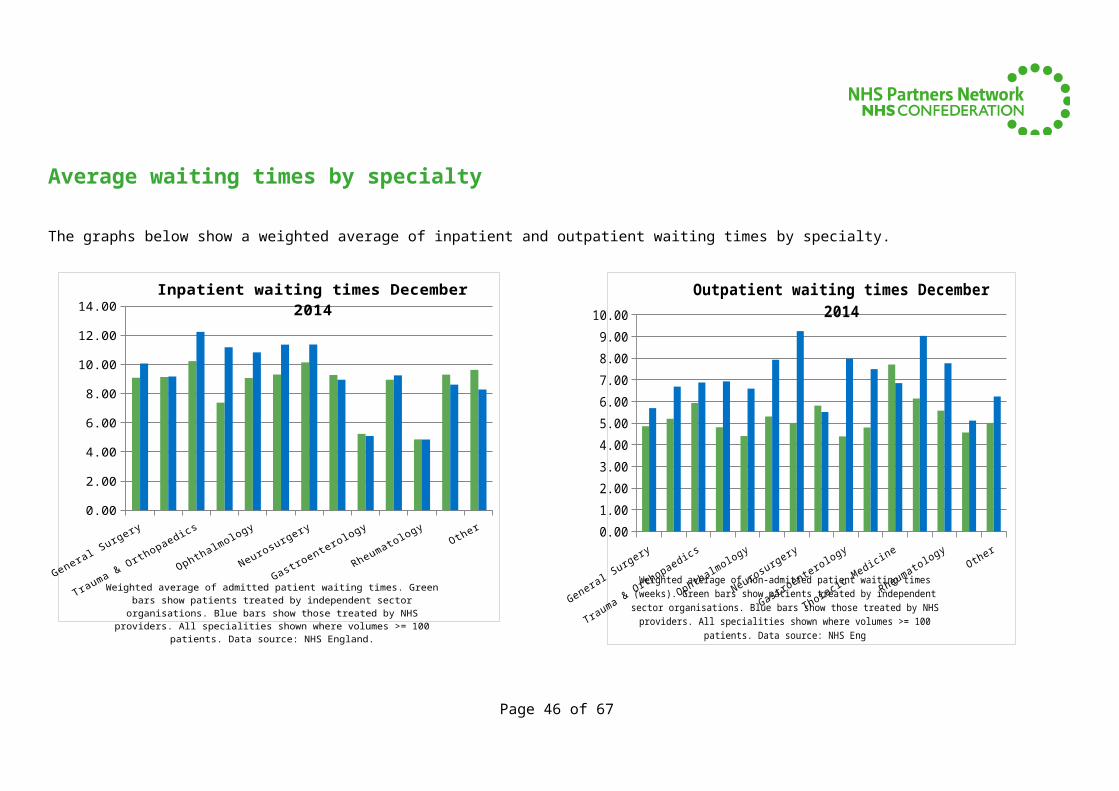
Average waiting times by specialty
The graphs below show a weighted average of inpatient and outpatient waiting times by specialty.
General Surgery Urology
Trauma & OrthopaedicsENT
OphthalmologyOral Surgery
Neurosurgery
Plastic Surgery
GastroenterologyDermatology
RheumatologyGynaecology Other
0.00
2.00
4.00
6.00
8.00
10.00
12.00
14.00Inpatient waiting times December 2014
Weighted average of admitted patient waiting times. Green bars show patients treated by independent sector organisa-tions. Blue bars show those treated by NHS providers. All specialities shown where volumes >= 100 patients. Data source:
NHS England.
General Surgery Urology
Trauma & OrthopaedicsENT
OphthalmologyOral Surgery
Neurosurgery
Plastic Surgery
GastroenterologyDermatology
Thoracic MedicineNeurology
RheumatologyGynaecology Other
0.001.002.003.004.005.006.007.008.009.00
10.00
Outpatient waiting times December 2014
Weighted average of non-admitted patient waiting times (weeks). Green bars show patients treated by independent sector organisations. Blue bars show those treated by NHS providers. All specialities shown where volumes >= 100
patients. Data source: NHS Eng
Page 34 of 49
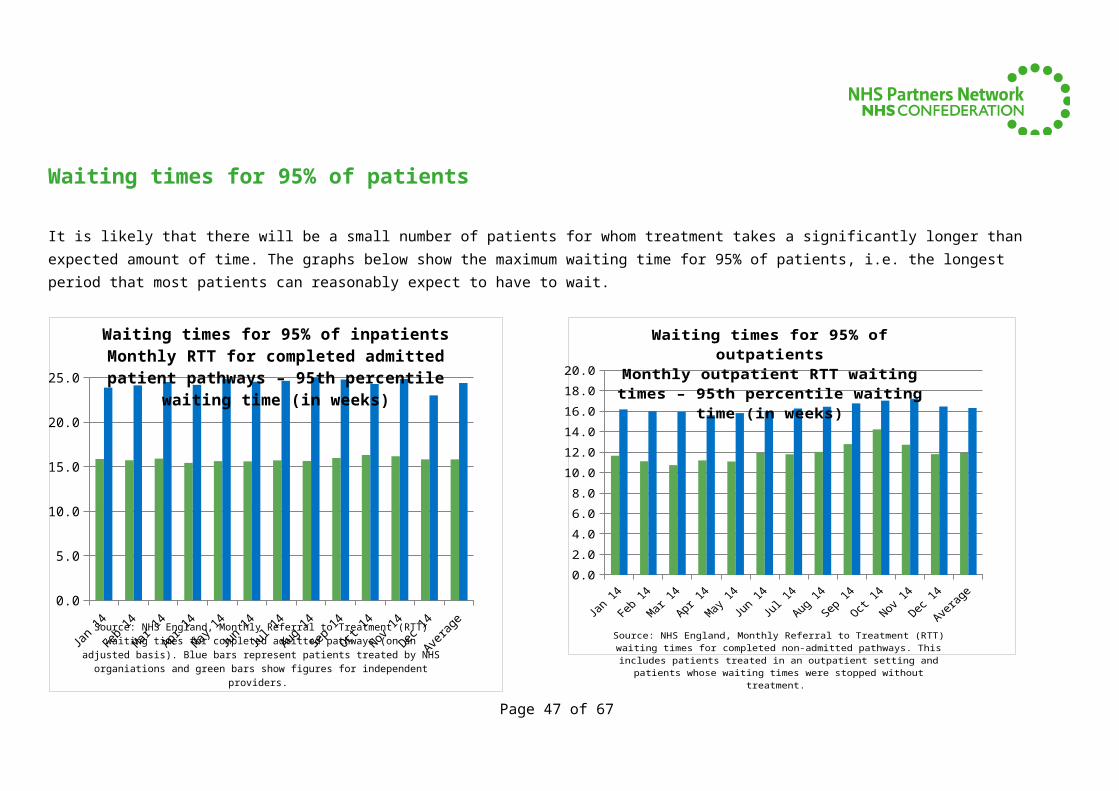
Waiting times for 95% of patients
It is likely that there will be a small number of patients for whom treatment takes a significantly longer than expected amount of time. The graphs below show the maximum waiting time for 95% of patients, i.e. the longest period that most patients can reasonably expect to have to wait.
Jan 14 Feb 14 Mar 14 Apr 14 May 14 Jun 14 Jul 14 Aug 14 Sep 14 Oct 14 Nov 14 Dec 14 Average0.0
5.0
10.0
15.0
20.0
25.0
Waiting times for 95% of inpatientsMonthly RTT for completed admitted patient pathways – 95th
percentile waiting time (in weeks)
Source: NHS England, Monthly Referral to Treatment (RTT) waiting times for completed admitted pathways (on an ad-justed basis). Blue bars represent patients treated by NHS organiations and green bars show figures for independent
providers.
Jan 14 Feb 14 Mar 14 Apr 14 May 14 Jun 14 Jul 14 Aug 14 Sep 14 Oct 14 Nov 14 Dec 14 Average0.02.04.06.08.0
10.012.014.016.018.020.0
Waiting times for 95% of outpatientsMonthly outpatient RTT waiting times – 95th percentile waiting time
(in weeks)
Source: NHS England, Monthly Referral to Treatment (RTT) waiting times for completed non-admitted pathways. This includes patients treated in an outpatient setting and patients whose waiting times were stopped without treatment.
Page 35 of 49
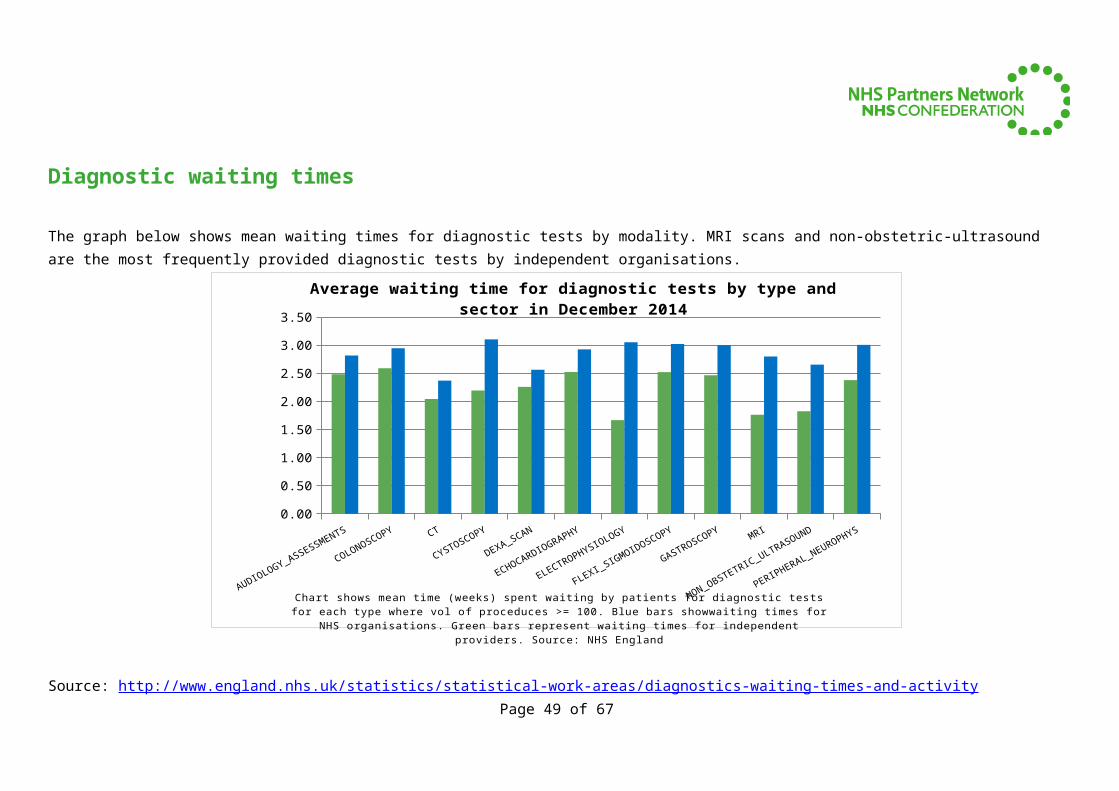
Diagnostic waiting times
The graph below shows mean waiting times for diagnostic tests by modality. MRI scans and non-obstetric-ultrasound are the most frequently provided diagnostic tests by independent organisations.
AUDIOLOGY_ASSESSMENTS
COLONOSCOPY CT
CYSTOSCOPY
DEXA_SCAN
ECHOCARDIOGRAPHY
ELECTROPHYSIOLOGY
FLEXI_SIGMOIDOSCOPY
GASTROSCOPYMRI
NON_OBSTETRIC_ULTRASOUND
PERIPHERAL_NEUROPHYS0.00
0.50
1.00
1.50
2.00
2.50
3.00
3.50
Average waiting time for diagnostic tests by type and sector in December 2014
Chart shows mean time (weeks) spent waiting by patients for diagnostic tests for each type where vol of proceduces >= 100. Blue bars showwaiting times for NHS organisations. Green bars represent waiting times
for independent providers. Source: NHS England
Source: http://www.england.nhs.uk/statistics/statistical-work-areas/diagnostics-waiting-times-and-activity NB see note in section on referral to treatment times about the calculation of mean waiting time values
Page 36 of 49
Cancelled elective operationsOperations that are cancelled on the day of surgery for non-clinical reasons are disruptive and distressing for patients. Cancellations are also a good indicator of an organisation’s system-wide efficiency.
NHS England does not publish the total number of elective operations alongside its cancellations data so it is not possible to make a precise calculation of comparative cancellation rates, however, the data published at www.england.nhs.uk/statistics/statistical-work-areas/cancelled-elective-operations reveals that NHS patients treated by independent sector providers experience far fewer cancellations on the day than those treated by traditional NHS organisations.
Cancelled Operations (elective only)The number of last minute cancelled elective operations by quarter for non-clinical reasons, NHS provider organisations in England
Period NHS provider non-clinical cancellations
(percentage of all cancellations)
Independent provider non-clinical
cancellations (percentage of all
cancellations)
Percentage of patients not treated within 28
days of last minute elective cancellation (NHS organisations)
Percentage of patients not treated within 28
days of last minute elective cancellation
(independent providers)
Quarter 2, 2013-14 (July - September 2013) 99.38% 0.62% 99.82% 0.18%Quarter 3, 2013-14 (October - December 2013) 99.38% 0.62% 99.85% 0.15%Quarter 4, 2013-14 (January - March 2014) 99.52% 0.48% 99.76% 0.24%Quarter 1, 2014-15 (April to June 2014) 99.20% 0.80% 99.88% 0.12%Quarter 2, 2014-15 (July to September 2014) 99.66% 0.34% 99.85% 0.15%Quarter 3, 2014-15 (October to December 2014) 99.76% 0.24% 100.00% 0.00%Average 99.48% 0.52% 99.86% 0.14%
Page 37 of 49
Numbers of patients treated
Page 38 of 49
Numbers of patients treated by independent providersElective care is critically dependent on independent sector provision.
Around 20% of all elective gastroenterology procedures and hip and knee replacements are now carried out by the independent sector. In some areas of the country this figure is far higher.
Health outcomes and safety are closely linked to experience treating significant volumes of patients. As well as NHS patients many independent sector providers also treat large numbers of privately-funded patients as well.
The graphs in the section that follows show a steady increase in the number and proportion of procedures carried out by independent providers since 2011 when easily comparable statistics were first published. However, the overall number of NHS patients treated by independent organisations remains a small fraction of total NHS volumes.
Page 39 of 49
Elective admissions and GP referrals (1)
Analysis of quarterly hospital activity data (http://www.england.nhs.uk/statistics/statistical-work-areas/hospital-activity/quarterly-hospital-activity/) shows that the number of patients treated by the independent sector is steadily growing.
Apr to Jun 11
Jul to Sep
11
Oct to Dec 1
1
Jan to Mar 1
2
Apr to Jun 12
Jul to Sep
12
Oct to Dec 1
2
Jan to Mar 1
3
Apr to Jun 13
Jul to Sep
13
Oct to Dec 1
3
Jan to Mar 1
4
Apr to Jun 14
Jul to Sep
14
0,000
20,000
40,000
60,000
80,000
100,000
120,000
Independent sector quarterly elective admissions
Quarterly admissions to independent sector providers: NHS elective activity. Source: NHS EnglandApr to
Jun 11
Jul to Sep
11
Oct to Dec 11
Jan to Mar 1
2
Apr to Jun 12
Jul to Sep
12
Oct to Dec 12
Jan to Mar 13
Apr to Jun 13
Jul to Sep
13
Oct to Dec 13
Jan to Mar 14
Apr to Jun 14
Jul to Sep
14
0,000
20,000
40,000
60,000
80,000
100,000
120,000
140,000
160,000
180,000
GP referrals for independent sector outpatients appointments
Quarterly GP referrals for independent sector outpatients appointments. Source: NHS England
Page 40 of 49
Elective admissions and GP referrals (2)
Despite the growth in independent sector provision, it is clear that traditional NHS providers still dominate overall provision for NHS patients.
Apr to Jun 11
Jul to Sep
11
Oct to Dec 1
1
Jan to Mar 1
2
Apr to Jun 12
Jul to Sep
12
Oct to Dec 1
2
Jan to Mar 1
3
Apr to Jun 13
Jul to Sep
13
Oct to Dec 1
3
Jan to Mar 1
4
Apr to Jun 14
Jul to Sep
14
0,000
200,000
400,000
600,000
800,000
1,000,000
1,200,000
1,400,000
Quarterly independent sector and NHS admissions
Quarterly elective admissions to independent sector providers (green bars) and NHS organisations (blue bars). Source: NHS England
Apr to Jun 11
Jul to Sep
11
Oct to Dec 1
1
Jan to Mar 1
2
Apr to Jun 12
Jul to Sep 12
Oct to Dec 1
2
Jan to Mar 1
3
Apr to Jun 13
Jul to Sep
13
Oct to Dec 1
3
Jan to Mar 1
4
Apr to Jun 14
Jul to Sep 14
0,000
500,000
1,000,000
1,500,000
2,000,000
2,500,000
3,000,000
3,500,000
Total GP referrals for outpatients appointments
Quarterly GP referrals for outpatients appointments. Independent sector providers (green bars) and NHS organisations (blue bars). Source: NHS England
Page 41 of 49
Elective admissions and GP referrals (3)
The overall percentage of patients treated by the independent sector has grown in accordance with the increasing number of patients choosing independent providers.
Apr to Jun 11
Jul to Sep
11
Oct to Dec 1
1
Jan to Mar 1
2
Apr to Jun 12
Jul to Sep
12
Oct to Dec 1
2
Jan to Mar 1
3
Apr to Jun 13
Jul to Sep
13
Oct to Dec 1
3
Jan to Mar 1
4
Apr to Jun 14
Jul to Sep
14
0.00%
1.00%
2.00%
3.00%
4.00%
5.00%
6.00%
7.00%
8.00%
Elective admissions to independent sector providers as a proportion of all NHS patients
Quarterly admissions to independent sector providers as a proportion of all NHS elective activity. Source: NHS England
Apr to Jun 11
Jul to Sep 11
Oct to Dec 1
1
Jan to Mar 1
2
Apr to Jun 12
Jul to Sep 12
Oct to Dec 1
2
Jan to Mar 13
Apr to Jun 13
Jul to Sep 13
Oct to Dec 1
3
Jan to Mar 14
Apr to Jun 14
Jul to Sep 14
0.00%
1.00%
2.00%
3.00%
4.00%
5.00%
6.00%
Percentage GP referrals for independent sector outpatients ap-pointments
Quarterly GP referrals independent sector outpatients appointments as a proportion of all NHS elective activity. Source: NHS England
Page 42 of 49
Acute elective patients treated by independent sector and NHS organisations
For most specialties, independent sector provision represents a small proportion of overall care. However, in some specialties, notably trauma & orthopaedics and ophthalmology, the proportion of care provided by independent organisations has reach significant levels.
General Surgery Urology
Trauma & OrthopaedicsENT
OphthalmologyOral Surgery
Neurosurgery
Plastic Surgery
GastroenterologyDermatology
RheumatologyGynaecology
0
10,000
20,000
30,000
40,000
50,000
60,000
Inpatients treated by independent providers and NHS organisations during December 2014
Total number of admitted pathways. Blue columns represent patients treated by NHS organisations and green columns show those treated by independent providers. Source: NHS England
General Surgery Urology
Trauma & OrthopaedicsENT
OphthalmologyOral Surgery
Neurosurgery
Plastic Surgery
GastroenterologyDermatology
Thoracic MedicineNeurology
RheumatologyGynaecology
010,00020,00030,00040,00050,00060,00070,00080,00090,000
100,000
Outpatients treated by independent providers and NHS organisations during December 2014
Total number of non-admitted pathways. Blue columns represent patients treated by NHS organisations and green columns show those treated by independent providers. Source: NHS England
Page 43 of 49

Monthly number of acute elective patients treated by the independent sector
Apr-11Jun-11
Aug-11Oct-1
1Dec-1
1Feb
-12Apr-12
Jun-12Aug-12
Oct-12Dec-1
2Feb
-13Apr-13
Jun-13Aug-13
Oct-13Dec-1
3Feb
-14Apr-14
Jun-14Aug-14
Oct-14Dec-1
4
0
5,000
10,000
15,000
20,000
25,000
30,000
35,000
Total inpatient acute elective patients (all specialties) treated by independent providers since April 2011
Number of admitted adjusted patients pathways completed each month. Source: NHS England (www.england.nhs.uk/statistics/statistical-work-areas/rtt-waiting-times
Apr-11Jun-11
Aug-11Oct-1
1Dec-1
1Feb
-12Apr-12
Jun-12Aug-12
Oct-12Dec-1
2Feb
-13Apr-13
Jun-13Aug-13
Oct-13Dec-1
3Feb
-14Apr-14
Jun-14Aug-14
Oct-14Dec-1
4
05,000
10,00015,00020,00025,00030,00035,00040,00045,000
Total outpatient acute elective patients (all specialties) treated by independent providers since April 2011
Non-admitted patients pathways completed each month. Source: NHS England (www.england.nhs.uk/statistics/statistical-work-areas/rtt-waiting-times
Page 44 of 49
Number of inpatients treated by the independent sector by specialty
40634
40756
40878
41000
41122
41244
41365
41487
41609
41730
41852
419740
5000
10000
15000
20000
25000
30000
35000
Number of NHS inpatients treated by independent providers by specialty Apr 11 to Dec 14
Other GynaecologyGeriatric Medicine RheumatologyNeurology Thoracic MedicineDermatology CardiologyGastroenterology General MedicineCardiothoracic Surgery Plastic SurgeryNeurosurgery Oral SurgeryOphthalmology ENTTrauma & Orthopaedics UrologyGeneral Surgery
Admitted adjusted patients pathways completed each month. Source: NHS England (www.eng-land.nhs.uk/statistics/statistical-work-areas/rtt-waiting-times
Page 45 of 49
Number of outpatients treated by the independent sector by specialty
Apr-11
Aug-11
Dec-1
1
Apr-12
Aug-12
Dec-1
2
Apr-13
Aug-13
Dec-1
3
Apr-14
Aug-14
Dec-1
40
5,00010,00015,00020,00025,00030,00035,00040,00045,000
Number of NHS outpatients treated by independent providers by specialty Apr 11 to Dec 14
Other GynaecologyGeriatric Medicine RheumatologyNeurology Thoracic MedicineDermatology CardiologyGastroenterology General MedicineCardiothoracic Surgery Plastic SurgeryNeurosurgery Oral SurgeryOphthalmology ENTTrauma & Orthopaedics UrologyGeneral Surgery
Non-admitted patients pathways completed each month. Source: NHS England (www.england.nhs.uk/statistics/statistical-work-areas/rtt-waiting-times
Page 46 of 49
Share of inpatients treated by the independent sector by specialty
Apr-11
Jun-1
1
Aug-11
Oct-11
Dec-1
1
Feb-1
2
Apr-12
Jun-1
2
Aug-12
Oct-12
Dec-1
2
Feb-1
3
Apr-13
Jun-1
3
Aug-13
Oct-13
Dec-1
3
Feb-1
4
Apr-14
Jun-1
4
Aug-14
Oct-14
Dec-1
40.00%
5.00%
10.00%
15.00%
20.00%
25.00%Share of all NHS inpatients treated by independent providers by
specialty Apr 11 to Dec 14
Total General SurgeryUrology Trauma & OrthopaedicsENT OphthalmologyOral Surgery NeurosurgeryPlastic Surgery Cardiothoracic SurgeryGeneral Medicine GastroenterologyCardiology DermatologyThoracic Medicine NeurologyRheumatology Geriatric MedicineGynaecology Other
Share of all NHS admitted adjusted patients pathways completed each month treated by independent providers.
Source: NHS England (www.england.nhs.uk/statistics/statistical-work-areas/rtt-waiting-times)
Page 47 of 49

Proportion of NHS outpatients treated by the independent sector by specialty
Apr-11
Jun-1
1
Aug-11
Oct-11
Dec-1
1
Feb-1
2
Apr-12
Jun-1
2
Aug-12
Oct-12
Dec-1
2
Feb-1
3
Apr-13
Jun-1
3
Aug-13
Oct-13
Dec-1
3
Feb-1
4
Apr-14
Jun-1
4
Aug-14
Oct-14
Dec-1
40.00%
2.00%
4.00%
6.00%
8.00%
10.00%
12.00%
14.00%
16.00%Share of all NHS outpatients treated by independent providers by
specialty Apr 11 to Dec 14
Total General SurgeryUrology Trauma & OrthopaedicsENT OphthalmologyOral Surgery NeurosurgeryPlastic Surgery Cardiothoracic SurgeryGeneral Medicine GastroenterologyCardiology DermatologyThoracic Medicine NeurologyRheumatology Geriatric MedicineGynaecology Other
Share of all NHS non-admitted patients pathways completed each month treated by independent providers.
Source: NHS England (www.england.nhs.uk/statistics/statistical-work-areas/rtt-waiting-times)
Page 48 of 49
Diagnostic tests carried out by independent sector by modality
The pie chart below shows the range of diagnostic tests provided by independent sector organisations.
Independent sector workload (all tests carried out by independent providers for which waiting times are collected) during December
2014
AUDIOLOGY_ASSESSMENTS COLONOSCOPYCT CYSTOSCOPYDEXA_SCAN ECHOCARDIOGRAPHYELECTROPHYSIOLOGY FLEXI_SIGMOIDOSCOPYGASTROSCOPY MRINON_OBSTETRIC_ULTRASOUND PERIPHERAL_NEUROPHYS
Page 49 of 49