Embed Size (px)
Citation preview

W W W . E F S E T . O R G
E F S E T P L U S - T O E F L C O R R E L A T I O N S T U D Y R E P O R T | 0 2
EXTERNAL VALIDITY OF EFSET PLUS WITH TOEFL iBT
This study was carried out to explore the statistical association between EFSET PLUS and TOEFL iBT scores. Three-hundred eighty four volunteer examinees participated in the study. The results suggest moderately strong, positive correlations between EFSET PLUS and TOEFL for both the reading and listening scales and provide solid evidence of convergent validity. The reliabilities for both the EFSET PLUS reading and listening score scales were also very high because of the adaptive nature of the test.
Abstract
E F S E T P L U S - T O E F L C O R R E L A T I O N S T U D Y R E P O R T | 0 3
TABLE OF CONTENTS
Introduction
Analysis and Results
Discussion
References
About the Author
5
12
16
17
18
E F S E T P L U S - T O E F L C O R R E L A T I O N S T U D Y R E P O R T | 0 4
INTRODUCTION
This report describes a validation study carried out in fall 2014 for the new EF Standard English Test PLUS (EFSET PLUS). This report presents empirical, external validity evidence regarding the relationship between EFSET PLUS proficiency scores and reported Test of English as a Foreign Language (TOEFL iBT™) scores. The TOEFL iBT is an internet-based test of English language proficiency developed and administered by Educational Testing Service. It is generally recognized as one of the premier tests of English language proficiency in the world. The TOEFL iBT version was released for operational use in 2005. Separate TOEFL component scores are reported for each of the four modalities (reading, listening, writing and speaking), each using a score scale ranging from 0 to 30. The composite scale is a simple sum of the component scores. In contrast, EFSET PLUS is a free, online test designed to provide separate measures of English language reading and listening proficiency. The test is professionally developed and administered online with a computer interface that is standardized across computer platforms. The reading and listening sections of EFSET PLUS are adaptively tailored to each examinee’s proficiency, providing an efficient and accurate way of assessing language skills. As an interpretive aid, performance scores on EFSET PLUS are directly aligned with six levels (A1 to C2) of the Council of Europe’s Common European Framework of Reference (CEFR) for languages. In this study, an international sample of non-native English language learners was recruited and screened over a period of months. Three-hundred eighty-four examinees who met the study eligibility requirements were administered both EFSET PLUS reading and listening tests. As part of the eligibility requirements, the examinees were required to upload a digital copy of their TOEFL iBT score report. Their scores on EFSET PLUS and their reported TOEFL listening and reading scores were then analyzed to investigate the degree of statistical correspondence between the tests. The study results confirm that the EFSET PLUS scores are highly reliable across the corresponding reading and listening score scales and maintain reasonable statistical correspondence (convergent validity) with TOEFL reading and listening scores.
This study found that EFSET PLUS scores correlated reasonably well with TOEFL iBT scores—somewhat better with the total TOEFL scores than with the separate reading and listening section scores. This provides fairly solid convergent validity evidence (see Cambell & Fiske, 1959), suggesting that the EFSET PLUS score scales are tapping into some of the same English language skills as TOEFL.
The next section of the paper describes the EFSET PLUS examinations and scoring process. It also describes the participant sample used for the validation study. Analysis and results are covered in the subsequent section.
E F S E T P L U S - T O E F L C O R R E L A T I O N S T U D Y R E P O R T | 0 5
INTRODUCTION
Description of the EFSET PLUS Tests and Score Scales
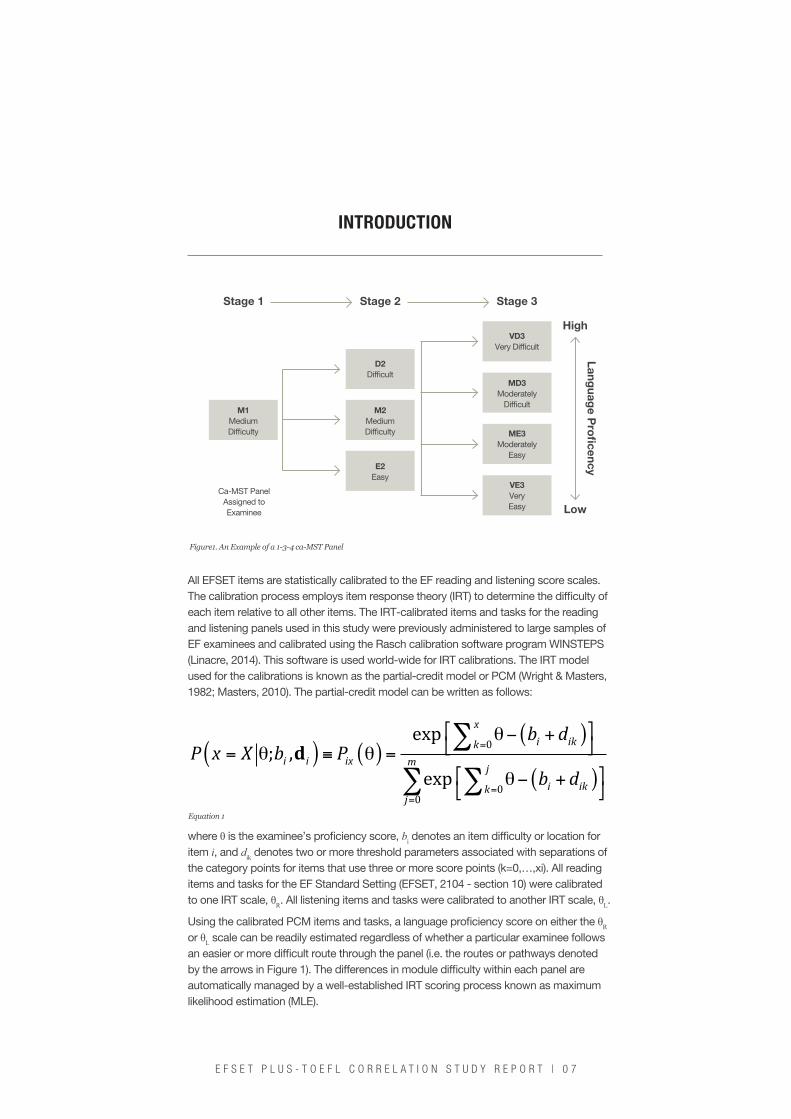
Separate reading and listening test forms which were statistically equivalent to the EFSET PLUS were used for this study. This was to ensure that there was no learning effect of the publicly available EFSET PLUS. The EFSET tests employ various types of selected-response item types, including multiple-selection items. A set of items is associated with a specific reading or listening stimulus to comprise a task. In turn, one or more tasks are assembled as a unit to prescribed statistical and content specifications; these are called modules. The modules can vary in length, depending on the number of items associated with each task. Because of the extra time needed to listen to the task-based aural stimuli, the listening modules tend to have slightly fewer items than the reading modules. In general, the reading modules for this study had from 16 to 24 items. The listening modules each had between 12 and 18 items. In aggregate, each examinee was administered a three-stage test consisting of one module per stage. The actual test forms for EFSET and EFSET PLUS are administered using an adaptive framework known as computerized adaptive multistage testing or ca-MST (Luecht & Nungester, 1998; Luecht, 2000; Zenisky, Hambleton & Luecht, 2010; Luecht, 2014a). Ca-MST is a psychometrically powerful and flexible test design that provides each examinee with a test form customized for his or her demonstrated level of language proficiency. For this study, each EFSET examinee was administered a three-stage 1-3-4 ca-MST panel with three levels of difficulty at stage 2 and four levels of difficulty at stage 3 as shown in Figure 1. The panels are self-adapting. Once assigned to an examinee, each panel has internal routing instructions that create a statistically optimal pathway for that examinee through the panel. The statistical optimization of the routing maximizes the precision of every examinee’s final score. As Figure 1 demonstrates, all examinees assigned a particular panel start with the same module at Stage 1 (M1, a medium difficulty module). Based on their performance on the M1 module, they are then routed to either module E2, M2 or D2 at Stage 2. The panel routes the lowest performing examinees to E2 and the highest performing examinees to D2. All others are routed to M2. Combining performance from both Stages 1 and 2, each examinee is then routed to module VE3, ME3, MD3, or VD3 for the final stage of testing. This type of adaptive routing has been demonstrated to significantly improve the precision of the final score estimates compared to a fixed (non-adaptive) test form of comparable length (Luecht & Nungester, 1998). The cut scores used for routing are established when the panel is constructed and statistically optimize the precision of each pathway through the panel.
E F S E T P L U S - T O E F L C O R R E L A T I O N S T U D Y R E P O R T | 0 6
INTRODUCTION
All EFSET items are statistically calibrated to the EF reading and listening score scales. The calibration process employs item response theory (IRT) to determine the difficulty of each item relative to all other items. The IRT-calibrated items and tasks for the reading and listening panels used in this study were previously administered to large samples of EF examinees and calibrated using the Rasch calibration software program WINSTEPS (Linacre, 2014). This software is used world-wide for IRT calibrations. The IRT model used for the calibrations is known as the partial-credit model or PCM (Wright & Masters, 1982; Masters, 2010). The partial-credit model can be written as follows:
Figure1. An Example of a 1-3-4 ca-MST Panel
where θ is the examinee’s proficiency score, bi denotes an item difficulty or location for item i, and dik denotes two or more threshold parameters associated with separations of the category points for items that use three or more score points (k=0,…,xi). All reading items and tasks for the EF Standard Setting (EFSET, 2104 - section 10) were calibrated to one IRT scale, θR. All listening items and tasks were calibrated to another IRT scale, θL.
Using the calibrated PCM items and tasks, a language proficiency score on either the θR or θL scale can be readily estimated regardless of whether a particular examinee follows an easier or more difficult route through the panel (i.e. the routes or pathways denoted by the arrows in Figure 1). The differences in module difficulty within each panel are automatically managed by a well-established IRT scoring process known as maximum likelihood estimation (MLE).
Equation 1
( ) ( )( )
( )
0
00
exp; ,
exp
xi ikk
i i ix mj
i ikkj
b dP x X b P
b d
=
==
⎡ ⎤θ− +⎣ ⎦= θ ≡ θ =⎡ ⎤θ− +⎣ ⎦
∑
∑ ∑d
Stage 2 Stage 3Stage 1
High
Low
Languag
e Pro
ficency
E F S E T P L U S - T O E F L C O R R E L A T I O N S T U D Y R E P O R T | 0 7
INTRODUCTION
Type of Language User Level Code Description
Basic
Beginner A1Understands familiar everyday words, expressions and very basic phrases aimed at the satisfaction of needs of a concrete type
Elementary A2Understands sentences and frequently used expressions (e.g. personal and family information, shopping, local geography, employment)
Independent
Intermediate B1Understand the main points of clear, standard input on familiar matters regularly encountered in work, school, leisure, etc.
Upper Intermediate B2
Understands main ideas of complex text or speech on both concrete and abstract topics, including technical discussions in field of specialisation
Proficient
Advanced C1 Understands a wide range of demanding, longer texts, and recognises implicit or nuanced meanings
Mastery C2
Understands with ease virtually every form of material read, including abstract or linguistically complex text such as manuals, specialised articles and literary works, and any kind of spoken language, including live broadcasts delivered at native speed
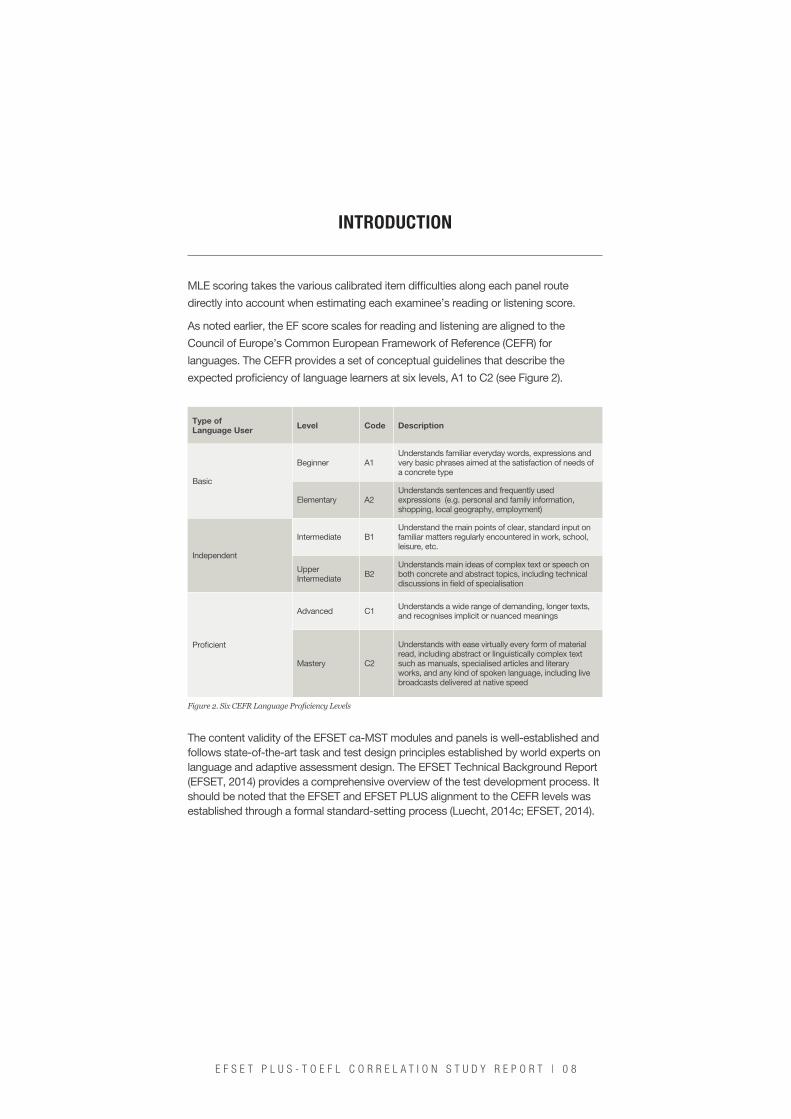
Figure 2. Six CEFR Language Proficiency Levels
MLE scoring takes the various calibrated item difficulties along each panel route
directly into account when estimating each examinee’s reading or listening score.
As noted earlier, the EF score scales for reading and listening are aligned to the
Council of Europe’s Common European Framework of Reference (CEFR) for
languages. The CEFR provides a set of conceptual guidelines that describe the
expected proficiency of language learners at six levels, A1 to C2 (see Figure 2).
The content validity of the EFSET ca-MST modules and panels is well-established and follows state-of-the-art task and test design principles established by world experts on language and adaptive assessment design. The EFSET Technical Background Report (EFSET, 2014) provides a comprehensive overview of the test development process. It should be noted that the EFSET and EFSET PLUS alignment to the CEFR levels was established through a formal standard-setting process (Luecht, 2014c; EFSET, 2014).
E F S E T P L U S - T O E F L C O R R E L A T I O N S T U D Y R E P O R T | 0 8
INTRODUCTION
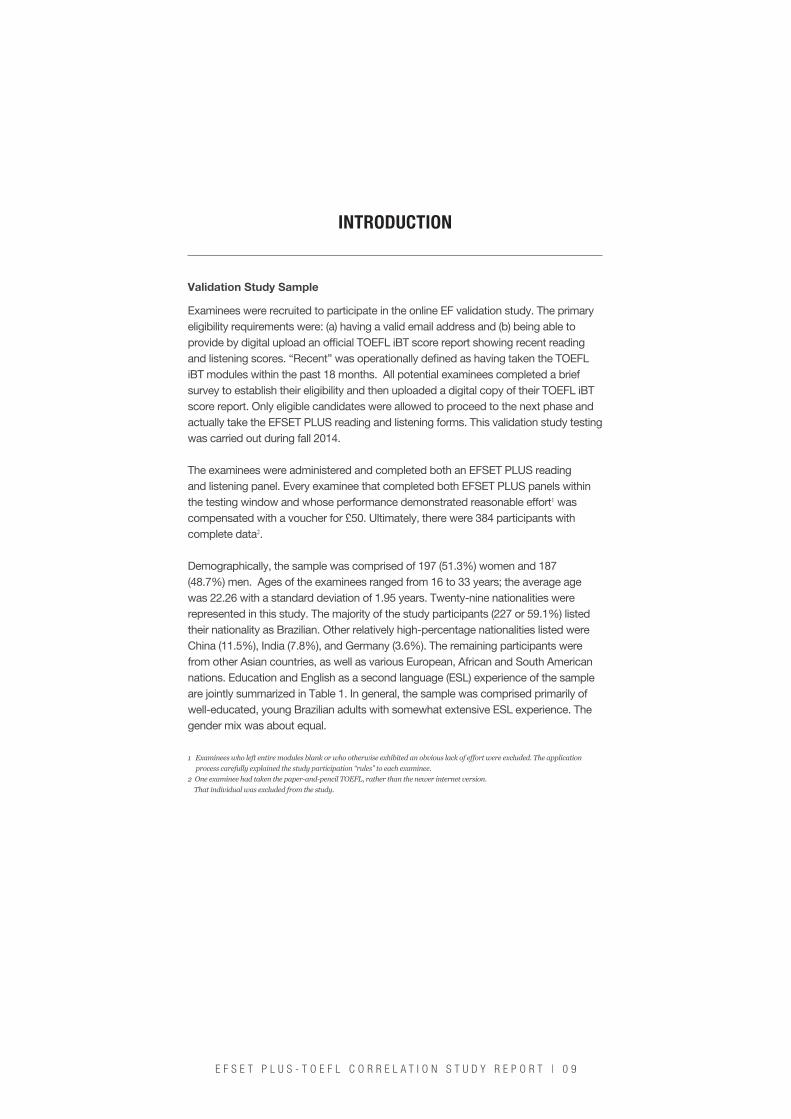
Validation Study Sample
Examinees were recruited to participate in the online EF validation study. The primary eligibility requirements were: (a) having a valid email address and (b) being able to provide by digital upload an official TOEFL iBT score report showing recent reading and listening scores. “Recent” was operationally defined as having taken the TOEFL iBT modules within the past 18 months. All potential examinees completed a brief survey to establish their eligibility and then uploaded a digital copy of their TOEFL iBT score report. Only eligible candidates were allowed to proceed to the next phase and actually take the EFSET PLUS reading and listening forms. This validation study testing was carried out during fall 2014. The examinees were administered and completed both an EFSET PLUS reading and listening panel. Every examinee that completed both EFSET PLUS panels within the testing window and whose performance demonstrated reasonable effort1 was compensated with a voucher for £50. Ultimately, there were 384 participants with complete data2. Demographically, the sample was comprised of 197 (51.3%) women and 187 (48.7%) men. Ages of the examinees ranged from 16 to 33 years; the average age was 22.26 with a standard deviation of 1.95 years. Twenty-nine nationalities were represented in this study. The majority of the study participants (227 or 59.1%) listed their nationality as Brazilian. Other relatively high-percentage nationalities listed were China (11.5%), India (7.8%), and Germany (3.6%). The remaining participants were from other Asian countries, as well as various European, African and South American nations. Education and English as a second language (ESL) experience of the sample are jointly summarized in Table 1. In general, the sample was comprised primarily of well-educated, young Brazilian adults with somewhat extensive ESL experience. The gender mix was about equal.
1 Examinees who left entire modules blank or who otherwise exhibited an obvious lack of effort were excluded. The application process carefully explained the study participation “rules” to each examinee. 2 One examinee had taken the paper-and-pencil TOEFL, rather than the newer internet version. That individual was excluded from the study.
E F S E T P L U S - T O E F L C O R R E L A T I O N S T U D Y R E P O R T | 0 9
INTRODUCTION
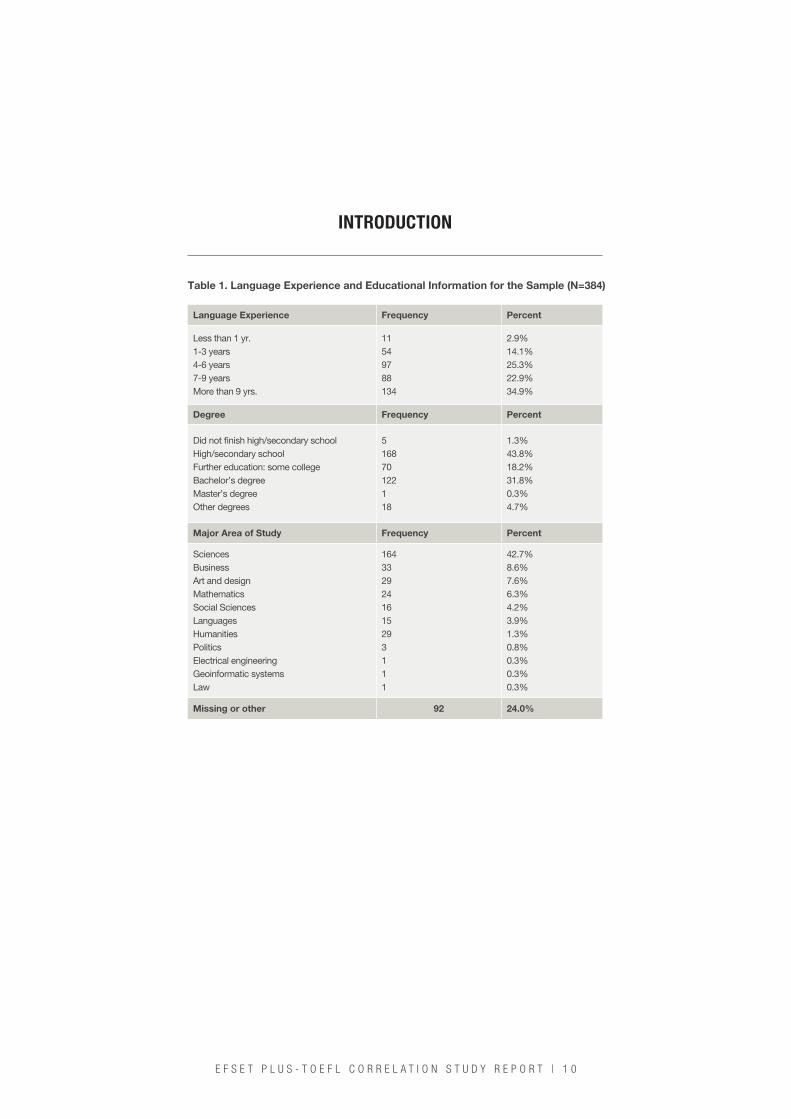
Table 1. Language Experience and Educational Information for the Sample (N=384)
Language Experience Frequency Percent
Less than 1 yr.1-3 years4-6 years7-9 yearsMore than 9 yrs.
11549788134
2.9%14.1%25.3%22.9%34.9%
Degree Frequency Percent
Did not finish high/secondary schoolHigh/secondary schoolFurther education: some collegeBachelor’s degreeMaster’s degreeOther degrees
516870122118
1.3%43.8%18.2%31.8%0.3%4.7%
Major Area of Study Frequency Percent
SciencesBusiness Art and designMathematicsSocial SciencesLanguagesHumanities PoliticsElectrical engineeringGeoinformatic systems Law
16433292416 152931 1 1
42.7%8.6%7.6%6.3%4.2% 3.9%1.3%0.8%0.3%0.3% 0.3%
Missing or other 92 24.0%
E F S E T P L U S - T O E F L C O R R E L A T I O N S T U D Y R E P O R T | 1 0
INTRODUCTION
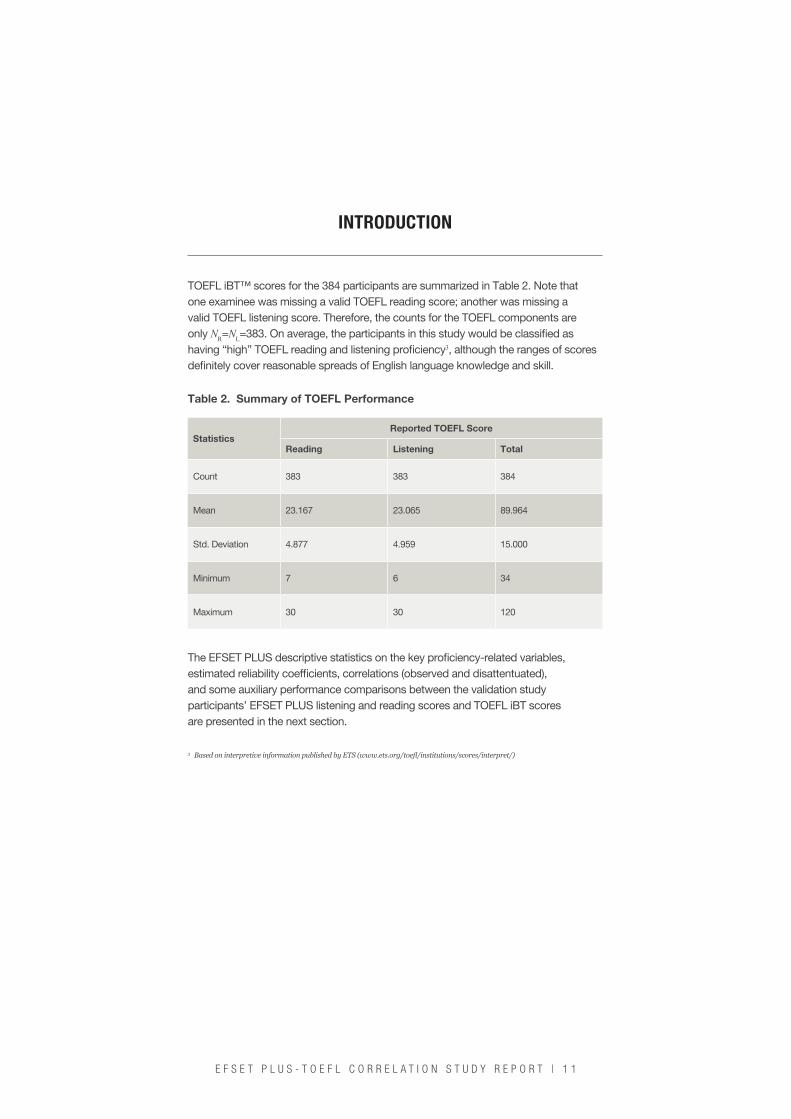
TOEFL iBT™ scores for the 384 participants are summarized in Table 2. Note that one examinee was missing a valid TOEFL reading score; another was missing a valid TOEFL listening score. Therefore, the counts for the TOEFL components are only NR=NL=383. On average, the participants in this study would be classified as having “high” TOEFL reading and listening proficiency3, although the ranges of scores definitely cover reasonable spreads of English language knowledge and skill.
The EFSET PLUS descriptive statistics on the key proficiency-related variables, estimated reliability coefficients, correlations (observed and disattentuated), and some auxiliary performance comparisons between the validation study participants’ EFSET PLUS listening and reading scores and TOEFL iBT scores are presented in the next section.
3 Based on interpretive information published by ETS (www.ets.org/toefl/institutions/scores/interpret/)
Table 2. Summary of TOEFL Performance
StatisticsReported TOEFL Score
Reading Listening Total
Count 383 383 384
Mean 23.167 23.065 89.964
Std. Deviation 4.877 4.959 15.000
Minimum 7 6 34
Maximum 30 30 120
E F S E T P L U S - T O E F L C O R R E L A T I O N S T U D Y R E P O R T | 1 1
ANALYSIS AND RESULTS
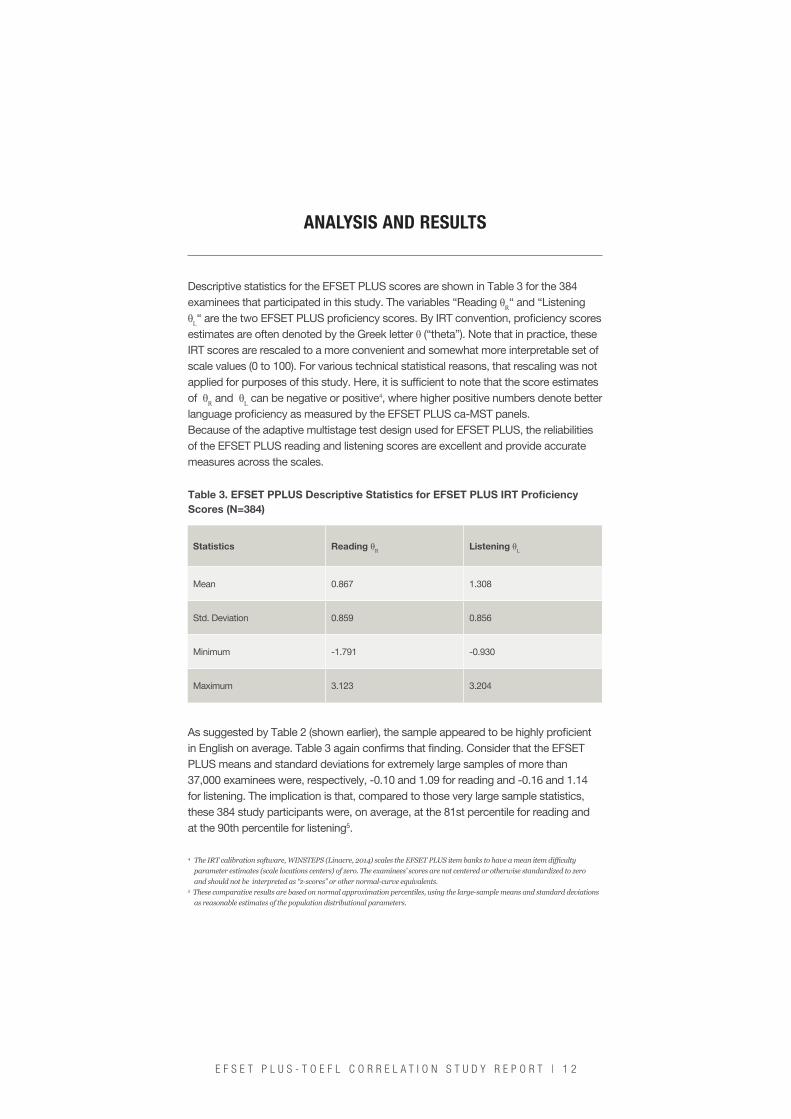
Descriptive statistics for the EFSET PLUS scores are shown in Table 3 for the 384 examinees that participated in this study. The variables “Reading θR“ and “Listening θL“ are the two EFSET PLUS proficiency scores. By IRT convention, proficiency scores estimates are often denoted by the Greek letter θ (“theta”). Note that in practice, these IRT scores are rescaled to a more convenient and somewhat more interpretable set of scale values (0 to 100). For various technical statistical reasons, that rescaling was not applied for purposes of this study. Here, it is sufficient to note that the score estimates of θR and θL can be negative or positive4, where higher positive numbers denote better language proficiency as measured by the EFSET PLUS ca-MST panels. Because of the adaptive multistage test design used for EFSET PLUS, the reliabilities of the EFSET PLUS reading and listening scores are excellent and provide accurate measures across the scales.
Table 3. EFSET PPLUS Descriptive Statistics for EFSET PLUS IRT Proficiency Scores (N=384)
Statistics Reading θR Listening θL
Mean 0.867 1.308
Std. Deviation 0.859 0.856
Minimum -1.791 -0.930
Maximum 3.123 3.204
4 The IRT calibration software, WINSTEPS (Linacre, 2014) scales the EFSET PLUS item banks to have a mean item difficulty parameter estimates (scale locations centers) of zero. The examinees’ scores are not centered or otherwise standardized to zero and should not be interpreted as “z-scores” or other normal-curve equivalents. 5 These comparative results are based on normal approximation percentiles, using the large-sample means and standard deviations as reasonable estimates of the population distributional parameters.
As suggested by Table 2 (shown earlier), the sample appeared to be highly proficient in English on average. Table 3 again confirms that finding. Consider that the EFSET PLUS means and standard deviations for extremely large samples of more than 37,000 examinees were, respectively, -0.10 and 1.09 for reading and -0.16 and 1.14 for listening. The implication is that, compared to those very large sample statistics, these 384 study participants were, on average, at the 81st percentile for reading and at the 90th percentile for listening5.
E F S E T P L U S - T O E F L C O R R E L A T I O N S T U D Y R E P O R T | 1 2
ANALYSIS AND RESULTS
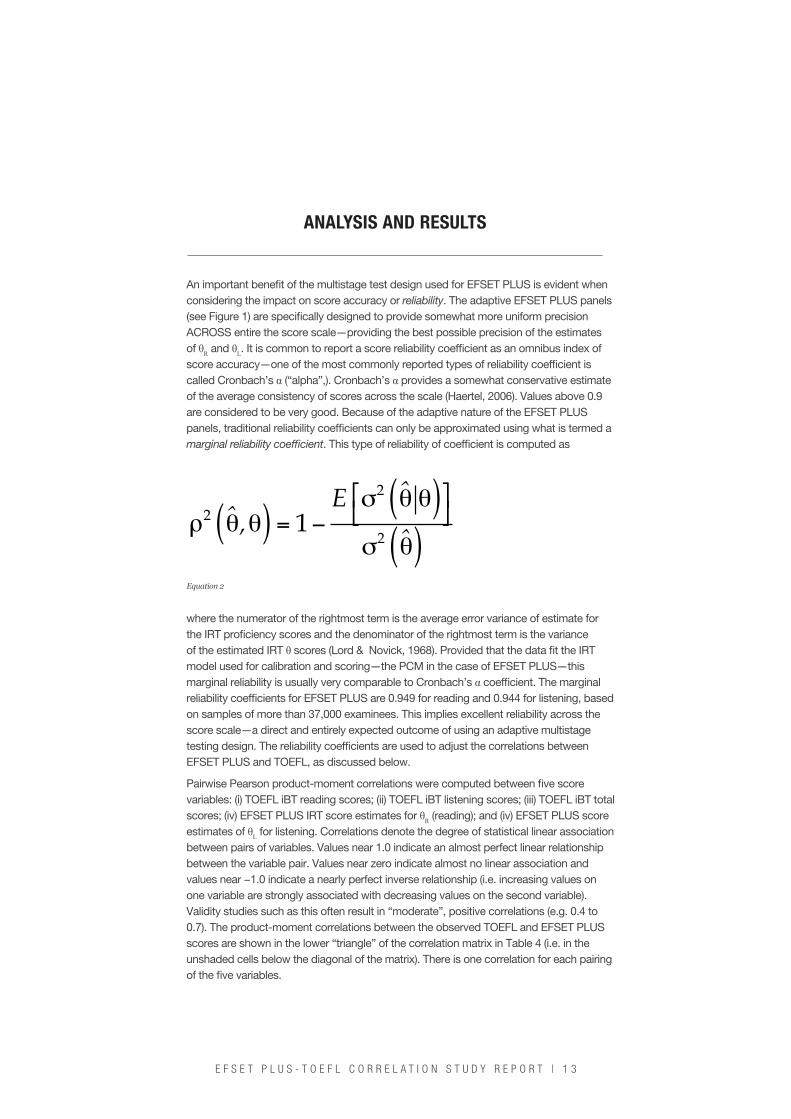
An important benefit of the multistage test design used for EFSET PLUS is evident when considering the impact on score accuracy or reliability. The adaptive EFSET PLUS panels (see Figure 1) are specifically designed to provide somewhat more uniform precision ACROSS entire the score scale—providing the best possible precision of the estimates of θR and θL. It is common to report a score reliability coefficient as an omnibus index of score accuracy—one of the most commonly reported types of reliability coefficient is called Cronbach’s α (“alpha”,). Cronbach’s α provides a somewhat conservative estimate of the average consistency of scores across the scale (Haertel, 2006). Values above 0.9 are considered to be very good. Because of the adaptive nature of the EFSET PLUS panels, traditional reliability coefficients can only be approximated using what is termed a marginal reliability coefficient. This type of reliability of coefficient is computed as
Equation 2
( ) ( )( )
2
2
21
ˆEˆ ,
ˆ
⎡ ⎤σ θ θ⎣ ⎦ρ θ θ = −σ θ
where the numerator of the rightmost term is the average error variance of estimate for the IRT proficiency scores and the denominator of the rightmost term is the variance of the estimated IRT θ scores (Lord & Novick, 1968). Provided that the data fit the IRT model used for calibration and scoring—the PCM in the case of EFSET PLUS—this marginal reliability is usually very comparable to Cronbach’s α coefficient. The marginal reliability coefficients for EFSET PLUS are 0.949 for reading and 0.944 for listening, based on samples of more than 37,000 examinees. This implies excellent reliability across the score scale—a direct and entirely expected outcome of using an adaptive multistage testing design. The reliability coefficients are used to adjust the correlations between EFSET PLUS and TOEFL, as discussed below.
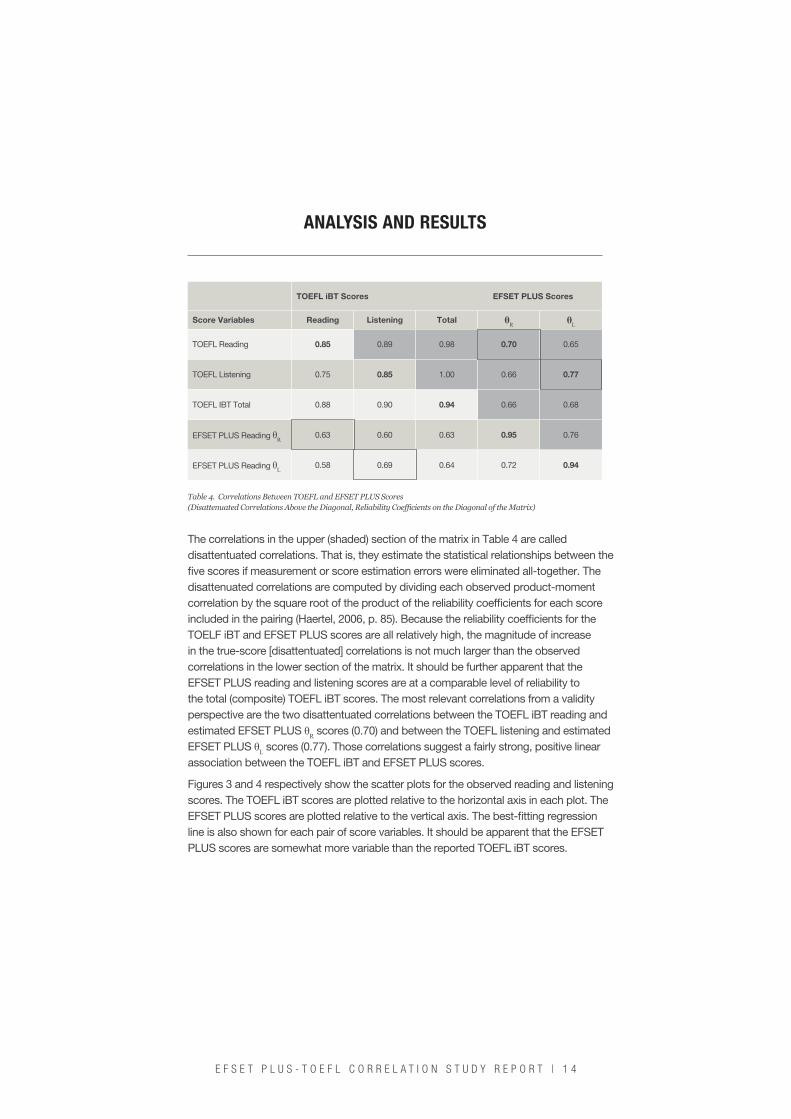
Pairwise Pearson product-moment correlations were computed between five score variables: (i) TOEFL iBT reading scores; (ii) TOEFL iBT listening scores; (iii) TOEFL iBT total scores; (iv) EFSET PLUS IRT score estimates for θR (reading); and (iv) EFSET PLUS score estimates of θL for listening. Correlations denote the degree of statistical linear association between pairs of variables. Values near 1.0 indicate an almost perfect linear relationship between the variable pair. Values near zero indicate almost no linear association and values near −1.0 indicate a nearly perfect inverse relationship (i.e. increasing values on one variable are strongly associated with decreasing values on the second variable). Validity studies such as this often result in “moderate”, positive correlations (e.g. 0.4 to 0.7). The product-moment correlations between the observed TOEFL and EFSET PLUS scores are shown in the lower “triangle” of the correlation matrix in Table 4 (i.e. in the unshaded cells below the diagonal of the matrix). There is one correlation for each pairing of the five variables.
E F S E T P L U S - T O E F L C O R R E L A T I O N S T U D Y R E P O R T | 1 3
ANALYSIS AND RESULTS
TOEFL iBT Scores EFSET PLUS Scores
Score Variables Reading Listening Total θR θL
TOEFL Reading 0.85 0.89 0.98 0.70 0.65
TOEFL Listening 0.75 0.85 1.00 0.66 0.77
TOEFL IBT Total 0.88 0.90 0.94 0.66 0.68
EFSET PLUS Reading θR0.63 0.60 0.63 0.95 0.76
EFSET PLUS Reading θL0.58 0.69 0.64 0.72 0.94
Table 4. Correlations Between TOEFL and EFSET PLUS Scores (Disattenuated Correlations Above the Diagonal, Reliability Coefficients on the Diagonal of the Matrix)
The correlations in the upper (shaded) section of the matrix in Table 4 are called disattentuated correlations. That is, they estimate the statistical relationships between the five scores if measurement or score estimation errors were eliminated all-together. The disattenuated correlations are computed by dividing each observed product-moment correlation by the square root of the product of the reliability coefficients for each score included in the pairing (Haertel, 2006, p. 85). Because the reliability coefficients for the TOELF iBT and EFSET PLUS scores are all relatively high, the magnitude of increase in the true-score [disattentuated] correlations is not much larger than the observed correlations in the lower section of the matrix. It should be further apparent that the EFSET PLUS reading and listening scores are at a comparable level of reliability to the total (composite) TOEFL iBT scores. The most relevant correlations from a validity perspective are the two disattentuated correlations between the TOEFL iBT reading and estimated EFSET PLUS θR scores (0.70) and between the TOEFL listening and estimated EFSET PLUS θL scores (0.77). Those correlations suggest a fairly strong, positive linear association between the TOEFL iBT and EFSET PLUS scores.
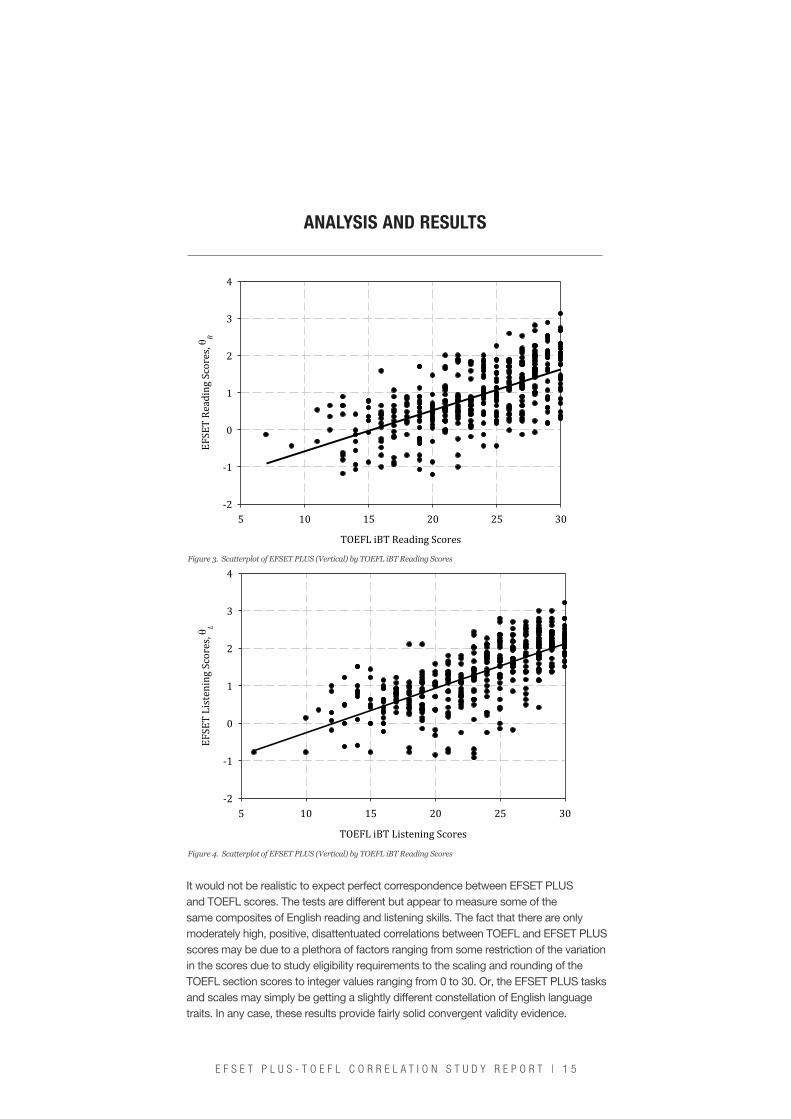
Figures 3 and 4 respectively show the scatter plots for the observed reading and listening scores. The TOEFL iBT scores are plotted relative to the horizontal axis in each plot. The EFSET PLUS scores are plotted relative to the vertical axis. The best-fitting regression line is also shown for each pair of score variables. It should be apparent that the EFSET PLUS scores are somewhat more variable than the reported TOEFL iBT scores.
E F S E T P L U S - T O E F L C O R R E L A T I O N S T U D Y R E P O R T | 1 4
TOEFL iBT Listening Scores
5 10 15 20 25 30
EFSET Listening Scores, θ
L
-‐2
-‐1
0
1
2
3
4
ANALYSIS AND RESULTS
Figure 3. Scatterplot of EFSET PLUS (Vertical) by TOEFL iBT Reading Scores
Figure 4. Scatterplot of EFSET PLUS (Vertical) by TOEFL iBT Reading Scores
It would not be realistic to expect perfect correspondence between EFSET PLUS and TOEFL scores. The tests are different but appear to measure some of the same composites of English reading and listening skills. The fact that there are only moderately high, positive, disattentuated correlations between TOEFL and EFSET PLUS scores may be due to a plethora of factors ranging from some restriction of the variation in the scores due to study eligibility requirements to the scaling and rounding of the TOEFL section scores to integer values ranging from 0 to 30. Or, the EFSET PLUS tasks and scales may simply be getting a slightly different constellation of English language traits. In any case, these results provide fairly solid convergent validity evidence.
TOEFL iBT Reading Scores
5 10 15 20 25 30
EFSET Reading Scores, θ
R
-‐2
-‐1
0
1
2
3
4
E F S E T P L U S - T O E F L C O R R E L A T I O N S T U D Y R E P O R T | 1 5
It is important to understand that there are no absolute assessment quality standards for measuring English language proficiency. The Standards for Educational and Psychological Testing (AERA, APA, NCME, 2014) and the International Test Commission Guidelines (ITC, 2008) stress the need for ongoing validity evidence gathering as a responsible measurement practice. In that spirit, test developers do the best they can to provide engaging and fair assessments that yield reasonably reliable and valid scores. TOEFL is a well-known and mature test with a world-wide user base. In contrast, EFSET PLUS is still a relatively new testing program. Both tests produce very accurate scores of reading and listening. Given the adaptive nature of EFSET PLUS, it should not be surprising that its reliabilities for the reading and listening score scales may actually be slightly higher than their TOEFL counterparts and comparable in magnitude to the reliability of TOEFL iBT total scores (see the reliability coefficients in Table 4, for example). None of those results imply that one test is better than the other, however.
Scores on the two tests are definitely related to one another and provide persuasive convergent validity evidence. That is, the correlations reported provide some compelling evidence that TOEFL and EFSET PLUS are “converging” toward measuring common reading and listening proficiency traits. However, the results do not imply that one test is more valid than the other.
Notably, given the moderate, positive correlations reported here, it may seem reasonable to try to establish some type of statistical concordance relationship between the TOEFL and EFSET PLUS score scales. That is, score users might want to have some method of direct translating between the points on the EFSET PLUS and on the TOEFL score scales. At present, there is no policy intent to provide that type of direct statistical alignment between the TOEFL and EFSET PLUS score scales. Given the small sample size in this study and the only moderate positive correlations reported, any statistical concordance would not be psychometrically appropriate6 and could be misleading.
DISCUSSION
6 Score or classification concordance tables are sometimes created to show the approximate equivalence of scores on two scales that measure similar—but not necessarily the same—constructs. An example would be the well-known concordance between college admissions tests like the ACT Assessment (Act, Inc.) and the Scholastic Aptitude Test (SAT) in the US. Basing concordance on tests with only moderate correlations can lead to misuse of the scores if some users consider the scores to actually be exchangeable. Concorded scores are not exchangeable (Kolen & Brennan, 2014). A policy decision was therefore made NOT to provide concordance information between TOEFL and EFSET PLUS until additional evidence is gathered.
E F S E T P L U S - T O E F L C O R R E L A T I O N S T U D Y R E P O R T | 1 6
American Educational Research Association, American Psychological Association, National Council on Measurement in Education. (2014). Standards for Educational and Psychological Testing. Washington, DC: AERA.
Campell, D. T, & Fiske, D. W. (1959). Convergent and discriminant validation by the multitrait-multimethod matrix. Psychological Bulletin, 56, 81-105
Educational Testing Service. (2011). Reliability and comparability of TOEFL iBT™ scores. TOEFL iBT™ Research Insight, Series I, Volume 3. Princeton, NJ: Author.
EF. (2014). EFSET Technical Background Report. London, U.K: efset.org.
Haertel, E. H. (2006). Reliability. In R. L. Brennan (Ed.). Educational Measurement, 4th Edition, pp. 65-110. Washington, DC: American Council on Education/Praeger Publishers.
International English Language Testing System. (2013). IELTS | Researchers - Test performance 2013. Author: International English Language Testing System, www.ielts.org.
International Test Commission. (2008). International Test Commission Guidelines. Website: www.intestcom.org/guidelines/
Kolen, M. J. & Brennan, R. L. (2014). Test equating, scaling, and linking: Methods and practices, 2nd edition. New York: Springer.
Linacre, M. (2014). WINSTEPS Rasch Measurement (Version 3.81). [Computer program]. Author: www.winsteps.com.
Lord F.M. & Novick, M. (1968). Statistical theories of mental test scores. Reading, MA: Addison-Wesley.
Luecht, R. M. (2000, April). Implementing the computer-adaptive sequential testing (CAST) framework to mass produce high quality computer-adaptive and mastery tests. Symposium paper presented at the Annual Meeting of the National Council on Measurement in Education, New Orleans, LA.
Luecht, R. M. (2014a). External validity and reliability of EFSET . [EF technical report]. London, U.K.: EF.
Luecht, R. M. (2014b). Computerized adaptive multistage design considerations and operational issues (pp. 69-83). In D. Yan, A. A. von Davier & C. Lewis (Eds.) Computerized Multistage Testing: Theory and Applications. New York: Taylor-Francis.
REFERENCES
E F S E T P L U S - T O E F L C O R R E L A T I O N S T U D Y R E P O R T | 1 7
Richard M. Luecht, PhD, Professor of Educational Research Methodology at the University of North Carolina at Greensboro (UNCG), is the chief psychometric consultant for the EFSET team. He is also a Senior Research Scientist with the Center for Assessment Research and Technology, a not-for-profit psychometric services division of the Center for Credentialing and Education, Greensboro, NC. Ric has published numerous articles and book chapters on technical measurement issues. He has been a technical consultant and advisor for many state department of education testing agencies and large-scale testing organizations, including New York, Pennsylvania, Delaware, Georgia, North Carolina, South Carolina, New Jersey, Puerto Rico, The College Board, Educational Testing Service, HUMRRO, the Partnership for Assessment of Readiness for College and Career (PARCC), the National Center and State Collaborative (NCSC), the American Institute of Certified Public Accountants, the National Board on Professional Teaching Standards, Cisco Corporation, the Defense Language Institute, the National Commission on the Certification of Physicians Assistants, and Education First (EFSET). He has been an active participant previously at the National Council of Measurement in Education (NCME), American Educational Research Association (AERA) and Association of Test Publishers (ATP)meetings, teaching workshops and giving presentations on topics such as assessment engineering and principled assessment design, computer-based testing, multistage testing design and implementation, standard setting, automated test assembly, IRT calibration, scale maintenance and scoring, designing complex performance assessments, diagnostic testing, multidimensional IRT, and language testing. Before joining UNCG, Ric was the Director for Computerized Adaptive Testing Research and Senior Psychometrician at the National Board of Medical Examiners where he oversaw psychometric processing for the United States Medical Licensing Examination (USMLE) Step and numerous subject examinations, as well being instrumental in the design of systems and technologies for the migration of the United States Medical Licensing Examination programs to computerized delivery. He has also designed software systems and algorithms for large-scale automated test assembly and devised a computerized adaptive multistage testing implementation framework that is used by a number of large-scale testing programs. His most recent work involves the development of a comprehensive framework and associated methodologies for a new approach to large-scale formative assessment design and implementation called assessment engineering (AE).
ABOUT THE AUTHOR
E F S E T P L U S - T O E F L C O R R E L A T I O N S T U D Y R E P O R T | 1 8

WWW.EFSET.ORGCopyright © EF Education First Ltd. All r ights reserved