Embed Size (px)
Citation preview

Supplementary Figure 1
Figure S1. Representative flow cytometry dot plots for membrane CD markers of freshly isolated and MACS-sorted CD45negc-kitpos cardiac cells from normal adult rat hearts (for each FACS analysis 1 digested heart was used).
Note 1: FITC-Conj Anti-mouse Ab refers to FITC-conjugated anti-mouse secondary antibodies used against primary antibodies for FLK-1.Note2: PE-Conj Anti-rabbit Ab refers to PE-conjugated anti-rabbit secondary antibodies used against primary antibodies for c-kit, CD-166, PDGF-R, CD34 and ROR2.Note3: FITC-Conj Anti-goat Ab refers to FITC-conjugated anti-goat secondary antibodies used against primary antibody for CD-105. Note4: PE-Isotype control and FITC-isotype control refers to isotype control PE-conjugated and FITC-conjugated primary antibodies (IgG1) for CD31 and CD45.Note5: all antibodies were titrated and the same concentrations for primary and secondary antibodies are shown.
1

Supplementary Figure 2
Figure S2. Flow cytometry dot plots show all the FITC- or PE-conjugated primary antibodies (rat IgG1 and mouse IgG2a or IgG2b) used as isotype controls for all specific FITC- and PE-conjugated primary antibodies (specified in parenthesis) shown in Figure 1D.
Note: all antibodies were titrated and the same concentrations for primary and secondary antibodies are shown.
2

Supplementary Figure 3
Figure S3. (A) mRNA transcript levels through a dedicated RT-PCR plate confirmed that freshly isolated mouse CD45negc-kitpos cardiac cells express known cardiac stem and progenitor markers along with the pluripotency genes Oct-4, Nanog, Klf-4 and Sox-2 and other genes implicated in stem cell renewal and cardiac development. (B) Immunostaining confocal microscopy images (representative of n=5) showing the expression of self-renewal genes and cardiac transcription
3

factors in freshly isolated CD45negc-kitpos cardiac cells. (C) Light microscopy representative image of a clone derived from single cell deposition of CD45neg c-kitpos cardiac cells. (D) Light microscopy representative image of cardiospheres generated from plating CD45neg c-kitpos cardiac cells in bacteriological dishes. (E-F) Flow cytometry dot plots (representative of n=3) show BrdU incorporation of freshly isolated CD45neg c-kitpos cardiac cells and after 1 passage (P1) in culture (For freshly isolated, BrdU -50mg/kg- was intraperitoneally administered in vivo for 6 days in adult mice every 12 hours before sacrifice; For P1, BrdU -10uM- was administered in vitro every 12 hours for 7 days). (G) Confocal microscopy images (representative of n=6) show CD45neg c-kitpos cardiac cells are multipotent in vitro, being able to differentiate into myocytes (cardiac troponin I, cTnI, red fluorescence), smooth muscle cells (smooth muscle actin, SMA, green fluorescence) and endothelial cells (von Willebrand Factor, vWF, Cy5 yellow fluorescence). Nuclei are stained by DAPI in blue.
4

Supplementary Figure 4
Figure S4. Representative flow cytometry dot plots (representative of n=3) for membrane CD markers of freshly isolated, MACS-sorted CD45negc-kitpos cardiac cells from normal adult mouse hearts (for each FACS analysis 3-4 digested hearts were pooled together before MACS sorting) after passage 1 (P1) in culture.
5

Supplementary Figure 5
Figure S5. (A) Immunofluorescent staining and confocal images of cloned c-kitpos (green) CSCs for expression of pluripotent markers (red). Nuclei are stained in blue by DAPI. Bar = 30µm. (B) Representative karyotype of cloned c-kitpos rat CSCs after 65 passages.
6

Supplementary Figure 6
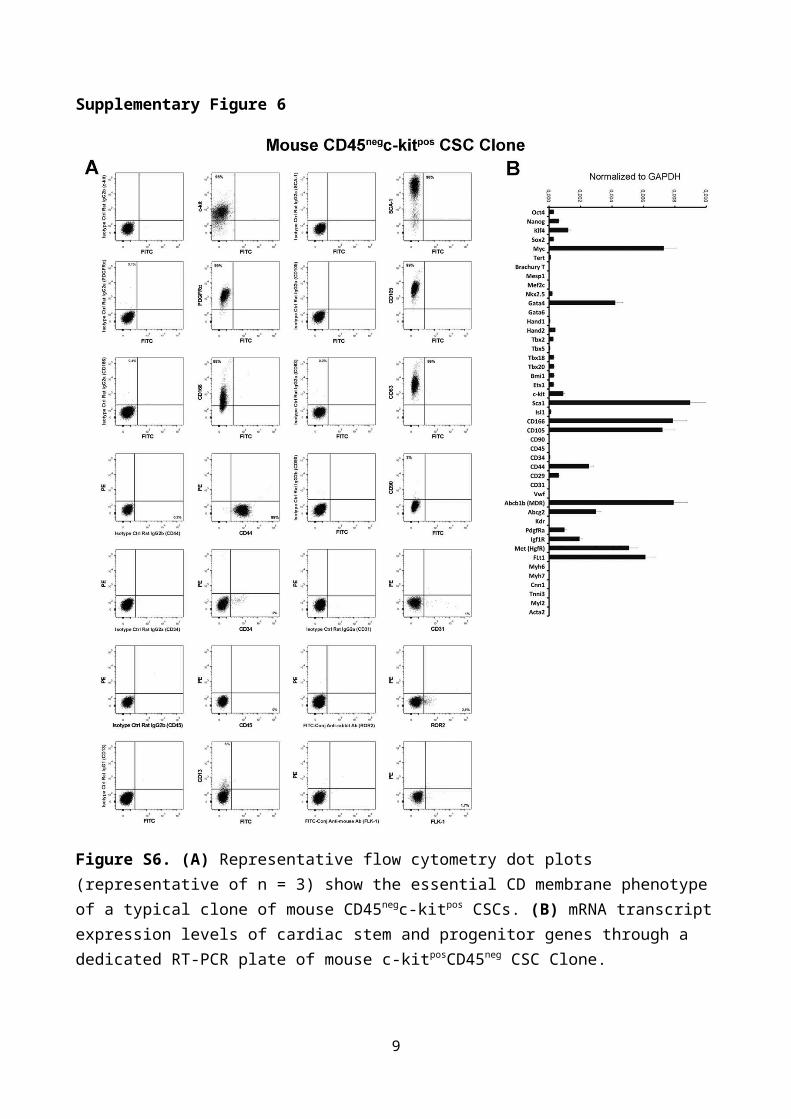
Figure S6. (A) Representative flow cytometry dot plots (representative of n = 3) show the essential CD membrane phenotype of a typical clone of mouse CD45negc-kitpos CSCs. (B) mRNA transcript expression levels of cardiac stem and progenitor genes through a dedicated RT-PCR plate of mouse c-kitposCD45neg CSC Clone.
7
Supplementary Figure 7
Figure S7. (A) CSCs (c-kit, red) express the Wnt receptor, Frizzled (Frizzled; green). Merged staining is yellow. Bar = 20µm. (B) CSCs (c-kit, green) express the Wnt co-receptor, LRP-6 (LRP-
8
6; red). Merged staining is yellow. Bar = 20µm. (C) CD45negc-kitpos CSCs (green) express the receptors for TGF- receptor (TGF--R1, red). Merged staining is yellow. Bar = 20µm. Nuclei stain blue by DAPI. (D) qRT-PCR analysis showing the fold change (over undifferentiated cloned CSCs in base differentiation medium) of Oct-4, c-kit, Gata-4, Nkx-2.5 and cTnI mRNA transcripts following 14 days in LIF-deprived base differentiation medium in the absence (CTRL) or presence of Wnt-3A or BIO. *P<0.05 vs. CTRL. Data are Mean ± SD, n=3.
9

Supplementary Figure 8
Figure S8. (A) Schematics of optimized cardimyogenic differentiation protocol to obtain in vitro CSC-derived cardiomyocytes. (B) c-kitpos (green) CSC cardiospheres express multipotent stemness
10
markers and Wnt3a (red). Bar = 50µm. (C) Representative light microscopy images showing (top) clonal CSC-derived cardiospheres grown in suspension and (bottom) differentiated cardiospheres 14 days after the treatment with the optimized stage-specific TGF-β-Family/Wnt Inhibitor cocktail. (D) Cumulative RT-PCR data for the expression of myogenic genes in CSC-derived cardiospheres from day 0 to day 14 in the optimized stage-specific TGF-β-Family/Wnt Inhibitor cocktail. Ccna2, Cyclin A2; Tnnt2, cardiac troponin t2; Myl2, myosin light chain 2; Myh, myosin heavy chain; Actc1, cardiac Actin; Pln, phospholamban; Atp2a, ATPase Sarcoplasmic/Endoplasmic Reticulum Ca2+ Transporting 1 (also known as SERCA Ca(2+)-ATPases). *p<0.05 vs. 0d; #p<0.05 vs. 1d; ^p<0.05 vs. 5d; §p<0.05 vs. 10d. (E) Dissociated cells from CSC-derived beating cardiospheres stain positive for the cardiomyocyte lineage, exhibiting sarcomeric structures. MHC, myosin heavy chain; MLC2A, myosin light chain 2A; cTnI, cardiac troponin I. DAPI (blue staining) depicts cell nuclei. Bar= 20 µm. (F) Representative western blot analysis showing Gata-4, cTnI, MHC and cardiac Actin (cActin) protein levels (normalized to GAPDH) in cloned CSCs, CSC-derived cardiomyocytes in vitro (iCMs), neonatal cardiomyocytes (nCMs) and adult cardiomyocytes (aCMs). (G) Tabulated data (Mean±SEM) for calcium transients (n=14) and action potentials (n=6) of iCMs. (H) Fluorescence imaging of cardiospheres generated from Lenti-Smad2shRNA (carrying a GFP reporter gene, green fluorescence) transfected CSCs showing the efficiency of the lentiviral infection with normal sphere formation.
11

Supplementary Figure 9
Figure S9. (A) Flow cytometry dot plots show the efficiency of Lentiviral GFP construct transfection of freshly isolated total c-kitpos cardiac cells. Right panel shows GFP profile by immunocytochemistry analysis and confocal microscopy imaging of GFPposCSCs in culture. (B) Light microscopy image of freshly isolated adult cardiomyocytes from a dissociated heart 28 days
12
after myocardial infarction (MI) and CSCGFP injection (MI+CSCGFP) show a CSC-derived GFP-positive cardiomyocyte. (C) Confocal microscopy images show host-derived pre-existing GFPneg
cardiomyocytes as compared to CSC-derived GFPpos cardiomyocyte isolated from MI+CSCGFP rat hearts at 28 days after MI. Note that GFPpos cardiomyocytes are of smaller size and mono-nucleated when compared to surviving bi-nucleated GFPneg cardiomyocytes of the host. Average area profile values (in m2) are reported below each image. Data are Mean ± SD (p<0.05). N=3 rats. (D) Representative confocal images show at high magnification a CSC-derived newly formed GFPpos cardiomyocyte in the infarct-border zone 28 days after MI treated with CSCGFP.
13

Supplementary Figure 10
Figure S10. (A) Representative Masson's trichrome staining of rat cardiac cross sections at the mid/apex from Sham operated saline treated, GFPpos total c-kitpos cardiac cells and GFPpos c-kitpos CSC treated rats 28 days after MI. It is evident that myocardial scarring was reduced by c-kitpos CSCs when compared to saline and GFPpos total c-kitpos cardiac cells-treated rats. (B) High magnifications images of border/infarct zone transition show that c-kitpos CSCs increase the number of cardiomyocytes in the infarct zone (which were both pre-existing and newly generated, see figure 7A), 28 days after MI and treatment. (C-D) Representative rat cardiac cross-sections (WGA, green; MHC, red; DAPI, blue nuclei) and bar graph with cumulative data show cardiomyocyte (CM) size and hypertrophy. Saline-treated and GFPpos total c-kitpos cardiac cell-treated rats show significant
14

CM hypertrophy. GFPpos c-kitpos CSCs prevented CM hypertrophy; *p<0.05 vs. SHAM; #p<0.05 vs. Saline-treated and total c-kitpos cardiac cells. (E) Representative confocal image shows cardiomyocyte apoptosis (TdT staining, green) in saline-treated animals after MI. (F) Bar graph with cumulative data show that treatment with GFPpos total c-kitpos cardiac cells did not reduce CM apoptosis while GFPpos c-kitpos CSCs significantly reduced cardiomyocyte apoptosis; *p<0.05 vs. SHAM; #p<0.05 vs. Saline-treated and total c-kitpos cardiac cells.
15

Supplementary Figure 11
Figure S11. (A) Flow cytometry dot plots (representative of n = 3) show expression of CD45, CD31, c-kit, Sca-1 and PDGF-R in the myocyte-depleted total cardiac cells obtained through enzymatic digestion of a mouse heart by retrograde perfusion. (B) After CD45 and CD31 negative
16

sorting, the flow cytometry analysis shows the efficiency of CD45 and CD31 removal from the cell preparation. The CD45/CD31 lineage negative cardiac cells still express c-kit, Sca-1 and PDGF-R. Importantly half of the CD45neg/CD31neg c-kitpos cardiac cells (that are enriched for CSCs) express Sca-1 or PDGF-R. More importantly, roughly 20% of the CD45neg/CD31neg c-kitpos cardiac cells express both Sca-1 and PDGF-Ra. This negative/positive multiple-marker expression of freshly isolated cells is similarly shown by multipotent single cell-derived CSC clones propagated in vitro, and it represents the minimal or “essential phenotype for the identification and isolation of mammalian adult endogenous CSCs”.
17


![[XLS]media.nature.com · Web viewSupplementary Data 9. KAAS annotations of protein primary transcripts from predicted geneset GeneID KEGG ID Gene name Description EC Number Lsat_1_v5_gn_0_10121.1](https://img.pdfslide.us/doc/110x75/5ae6276c7f8b9a29048d2aa4/xlsmedia-viewsupplementary-data-9-kaas-annotations-of-protein-primary-transcripts.jpg)