Embed Size (px)
Citation preview
MEDIA RELEASE
P.O. Box 28 – 1000 AA Amsterdam – The Netherlands
Office address - Tweede Weteringplantsoen 21 – 1017 ZD Amsterdam
Heineken N.V. - Registered Office at Amsterdam – Trade Register Amsterdam No. 33011433
Page 1 of 56
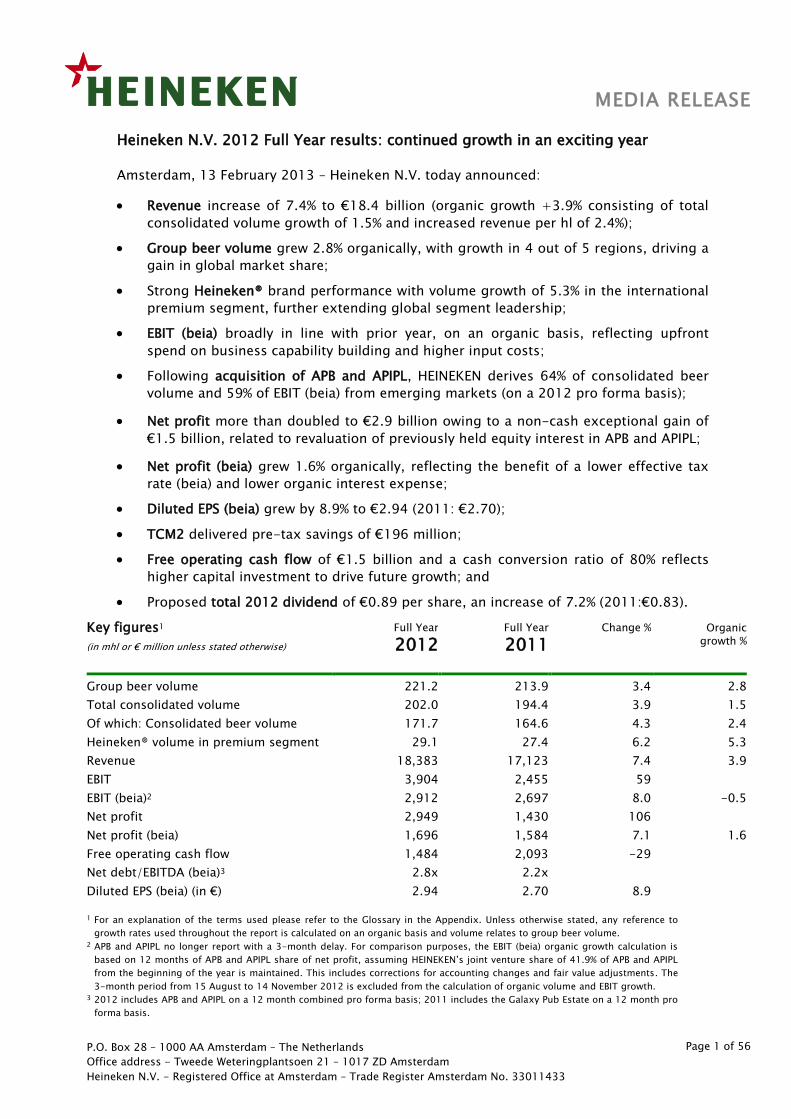
Heineken N.V. 2012 Full Year results: continued growth in an exciting year
Amsterdam, 13 February 2013 – Heineken N.V. today announced:
Revenue increase of 7.4% to €18.4 billion (organic growth +3.9% consisting of total
consolidated volume growth of 1.5% and increased revenue per hl of 2.4%);
Group beer volume grew 2.8% organically, with growth in 4 out of 5 regions, driving a
gain in global market share;
Strong Heineken® brand performance with volume growth of 5.3% in the international
premium segment, further extending global segment leadership;
EBIT (beia) broadly in line with prior year, on an organic basis, reflecting upfront
spend on business capability building and higher input costs;
Following acquisition of APB and APIPL, HEINEKEN derives 64% of consolidated beer
volume and 59% of EBIT (beia) from emerging markets (on a 2012 pro forma basis);
Net profit more than doubled to €2.9 billion owing to a non-cash exceptional gain of
€1.5 billion, related to revaluation of previously held equity interest in APB and APIPL;
Net profit (beia) grew 1.6% organically, reflecting the benefit of a lower effective tax
rate (beia) and lower organic interest expense;
Diluted EPS (beia) grew by 8.9% to €2.94 (2011: €2.70);
TCM2 delivered pre-tax savings of €196 million;
Free operating cash flow of €1.5 billion and a cash conversion ratio of 80% reflects
higher capital investment to drive future growth; and
Proposed total 2012 dividend of €0.89 per share, an increase of 7.2% (2011:€0.83).
Key figures1
(in mhl or € million unless stated otherwise)
Full Year
2012 Full Year
2011
Change % Organic
growth %
Group beer volume 221.2 213.9 3.4 2.8
Total consolidated volume 202.0 194.4 3.9 1.5
Of which: Consolidated beer volume 171.7 164.6 4.3 2.4
Heineken® volume in premium segment 29.1 27.4 6.2 5.3
Revenue 18,383 17,123 7.4 3.9
EBIT 3,904 2,455 59
EBIT (beia)2 2,912 2,697 8.0 -0.5
Net profit 2,949 1,430 106
Net profit (beia) 1,696 1,584 7.1 1.6
Free operating cash flow 1,484 2,093 -29
Net debt/EBITDA (beia)3 2.8x 2.2x
Diluted EPS (beia) (in €) 2.94 2.70 8.9
1 For an explanation of the terms used please refer to the Glossary in the Appendix. Unless otherwise stated, any reference to
growth rates used throughout the report is calculated on an organic basis and volume relates to group beer volume. 2 APB and APIPL no longer report with a 3-month delay. For comparison purposes, the EBIT (beia) organic growth calculation is
based on 12 months of APB and APIPL share of net profit, assuming HEINEKEN’s joint venture share of 41.9% of APB and APIPL
from the beginning of the year is maintained. This includes corrections for accounting changes and fair value adjustments. The
3-month period from 15 August to 14 November 2012 is excluded from the calculation of organic volume and EBIT growth. 3 2012 includes APB and APIPL on a 12 month combined pro forma basis; 2011 includes the Galaxy Pub Estate on a 12 month pro
forma basis.
MEDIA RELEASE
P.O. Box 28 – 1000 AA Amsterdam – The Netherlands
Office address - Tweede Weteringplantsoen 21 – 1017 ZD Amsterdam
Heineken N.V. - Registered Office at Amsterdam – Trade Register Amsterdam No. 33011433
Page 2 of 56
CEO STATEMENT
Jean-François van Boxmeer, Chairman of the Executive Board and CEO of Heineken N.V.,
commented:
“2012 has been another year of strong progress for HEINEKEN. Most notably, acquiring full
control of Asia Pacific Breweries significantly expanded our exposure to growth markets
and extended our business platform in Asia which, along with Africa and Latin America,
continued to perform well in 2012. In the U.S., our portfolio strategy is working, combining
a turnaround of the Heineken® brand with continued strong growth of the Mexican brand
portfolio.
At the same time we managed a challenging market environment in Europe by continuing
to invest in brands and deepening our relationships with customers, which resulted in
share gains in many key markets. Across the company we have reduced costs and
improved operating efficiencies, delivering €196 million of pre-tax savings under our
TCM2 programme.
The Heineken® brand continued its track record of outperformance, growing ahead of the
global beer market and further extending its leadership in the International Premium
Segment. The launch of global brands such as Desperados, Strongbow Gold and Sol in new
markets, as well as successful innovation such as ‘Radler’, all contributed to top-line
growth. Innovation introduced in the market within the last 3 years now represents €1
billion, or 5.3% of revenues. All in all, we generated solid results in a challenging but
rewarding year for HEINEKEN. Looking to 2013, we are confident that our strategy will
further drive continued top-line growth momentum and improved profitability.”
2013 FULL YEAR OUTLOOK
Top-line: HEINEKEN anticipates continued volume and revenue growth momentum in 2013.
The higher growth regions of Africa, Latin America and Asia Pacific are expected to more
than offset volume weakness in European markets affected by continued economic
uncertainty and government-led austerity measures. However, HEINEKEN will continue to
seek opportunities in Europe to drive positive price and sales mix.
Global brands: The Heineken® brand is expected to continue to outperform the
international premium segment and overall beer market in 2013 by further leveraging
HEINEKEN’s global marketing scale, superior brand campaigns and strong execution in the
marketplace. In 2013, the continued growth and planned roll-out of HEINEKEN’s other
premium global brands - Desperados, Strongbow Gold, Amstel Premium Pilsner and Sol –
are expected to support top-line development.
Marketing and selling expenses: HEINEKEN expects marketing and selling (beia) expense as
a percentage of revenue to remain broadly stable, reflecting improved marketing spend
effectiveness from increased global scale (2012: 12.2%).
Input costs: HEINEKEN forecasts a slight increase in input cost prices (excluding the effect
of currency translation).
MEDIA RELEASE
P.O. Box 28 – 1000 AA Amsterdam – The Netherlands
Office address - Tweede Weteringplantsoen 21 – 1017 ZD Amsterdam
Heineken N.V. - Registered Office at Amsterdam – Trade Register Amsterdam No. 33011433
Page 3 of 56
Total Cost Management 2 (TCM2): HEINEKEN now expects to realise €525 million of cost
savings under the TCM2 programme covering the period 2012-2014 (previously €500
million). The increase of €25 million reflects identified cost synergies under the acquisition
of Asia Pacific Breweries (APB) and Asia Pacific Investment Pte Ltd (APIPL).
HEINEKEN expects to incur approximately €100 million of further upfront GBS costs
through to the end of 2014 (with around two thirds of this spend expected in 2013). As a
result of on-going productivity initiatives, HEINEKEN expects an organic decline in the
number of employees in 2013.
Effective tax rate: HEINEKEN expects the effective tax rate (beia) in 2013 to be in the range
of 27% to 29% (2012: 26.5%). The higher tax rate can be primarily explained by the result
of favourable outcomes with tax authorities in 2012 and the full year consolidation of APB
and APIPL in 2013 which is subject to a higher effective tax rate.
Interest rate: HEINEKEN forecasts an average interest rate of around 4.5% in 2013 (2012:
5.4%) reflecting lower coupons on bond issuances in 2012.
Cash flow: Cash flow generation is expected to remain strong, further reducing the level of
net debt. In 2013, capital expenditure related to property, plant and equipment is forecast
to be €1.5 billion (2012: €1.2 billion) primarily reflecting the consolidation of APB and
continued investment in higher growth markets to capture anticipated top-line growth.
Increased investments in 2013 will be focused on brewing capacity expansions, the
upgrading of existing production facilities and new commercial equipment. As a
consequence, HEINEKEN expects a cash conversion ratio of below 100% in 2013.
Acquisition of APB and APIPL: The acquisition of APB and APIPL is expected to be
marginally EPS accretive in the first year.
Total dividend for 2012
The Heineken N.V. dividend policy is to pay out a ratio of 30% to 35% of full-year net profit
(beia). The payment of a total cash dividend of €0.89 per share of €1.60 nominal value for
2012 (total dividend 2011: €0.83) will be proposed to the annual meeting of shareholders.
If approved, a final dividend of €0.56 per share will be paid on 8 May 2013, as an interim
dividend of €0.33 per share was paid on 4 September 2012. The payment will be subject to
a 15% Dutch withholding tax. The ex-final dividend date for Heineken N.V. shares will be
29 April 2013.
Investor Calendar Heineken N.V.
What’s Brewing Seminar, London 25 March 2013
Trading update for Q1 2013 24 April 2013
Annual General Meeting of Shareholders (AGM) 25 April 2013
What’s Brewing Seminar (location to be determined) 28 June 2013
Half Year 2013 Results 21 August 2013
What’s Brewing Seminar, New York 6 September 2013
Trading update for Q3 2013 23 October 2013
Financial Markets Conference, Mexico 5-6 December 2013
MEDIA RELEASE
P.O. Box 28 – 1000 AA Amsterdam – The Netherlands
Office address - Tweede Weteringplantsoen 21 – 1017 ZD Amsterdam
Heineken N.V. - Registered Office at Amsterdam – Trade Register Amsterdam No. 33011433
Page 4 of 56
Press enquiries Investor and analyst enquiries John Clarke George Toulantas Head of External Communication Director of Investor Relations
E-mail: [email protected] Lucia Bergamini John-Paul Schuirink Senior Investor Relations Manager
Financial Communications Manager E-mail: [email protected]
E-mail: [email protected] Tel: +31-20-5239590
Tel: +31-20-5239355
Editorial information:
HEINEKEN is a proud, independent global brewer committed to surprise and excite consumers with its brands and
products everywhere. The brand that bears the founder’s family name – Heineken® - is available in almost every country
on the globe and is the world’s most valuable international premium beer brand. The Company’s aim is to be a leading
brewer in each of the markets in which it operates and to have the world’s most valuable brand portfolio. HEINEKEN wants
to win in all markets with Heineken® and with a full brand portfolio in markets of choice. The Company is present in over
70 countries and operates more than 165 breweries with volume of 221 million hectoliters of group beer sold. HEINEKEN
is Europe’s largest brewer and the world’s third largest by volume. HEINEKEN is committed to the responsible marketing
and consumption of its more than 250 international premium, regional, local and specialty beers and ciders. These
include Heineken®, Amstel, Anchor, Biere Larue, Bintang, Birra Moretti, Cruzcampo, Desperados, Dos Equis, Foster’s,
Newcastle Brown Ale, Ochota, Primus, Sagres, Sol, Star, Strongbow, Tecate, Tiger and Zywiec. Our leading joint venture
brands include Cristal and Kingfisher. Pro forma 2012 revenue totaled €19,765 million and EBIT (beia) €3,151 million.
The number of people employed is over 85,000. Heineken N.V. and Heineken Holding N.V. shares are listed on the
Amsterdam stock exchange. Prices for the ordinary shares may be accessed on Bloomberg under the symbols HEIA NA
and HEIO NA and on the Reuter Equities 2000 Service under HEIN.AS and HEIO.AS. Most recent information is available on
HEINEKEN's website: www.theHEINEKENcompany.com.
Disclaimer:
This press release contains forward-looking statements with regard to the financial position and results of HEINEKEN’s
activities. These forward-looking statements are subject to risks and uncertainties that could cause actual results to differ
materially from those expressed in the forward-looking statements. Many of these risks and uncertainties relate to
factors that are beyond HEINEKEN’s ability to control or estimate precisely, such as future market and economic
conditions, the behaviour of other market participants, changes in consumer preferences, the ability to successfully
integrate acquired businesses and achieve anticipated synergies, costs of raw materials, interest-rate and exchange-rate
fluctuations, changes in tax rates, changes in law, pension costs, the actions of government regulators and weather
conditions. These and other risk factors are detailed in HEINEKEN’s publicly filed annual reports. You are cautioned not to
place undue reliance on these forward-looking statements, which are only relevant as of the date of this press release.
HEINEKEN does not undertake any obligation to release publicly any revisions to these forward-looking statements to
reflect events or circumstances after the date of these statements. Market share estimates contained in this press release
are based on outside sources, such as specialised research institutes, in combination with management estimates.
MEDIA RELEASE
P.O. Box 28 – 1000 AA Amsterdam – The Netherlands
Office address - Tweede Weteringplantsoen 21 – 1017 ZD Amsterdam
Heineken N.V. - Registered Office at Amsterdam – Trade Register Amsterdam No. 33011433
Page 5 of 56
MANAGEMENT REPORT
OPERATIONAL REVIEW
Volume, global brands and innovation
Group beer volume grew 3.4% to 221 million hectolitres, including a 0.6% net consolidation
impact. On an organic basis, group beer volume increased 2.8%, with volume higher in four
out of the five regions. In 2012, the benefit of effective marketing, successful innovation
and strong outlet execution contributed to global volume market share gains, including the
key markets of Mexico, Nigeria, France, Russia, Vietnam, the U.S. and the UK.
Total consolidated volume increased 1.5% organically led by consolidated beer volume
growth of 2.4% and higher soft drinks volume. This was only partly offset by lower volume
of cider and third party products.
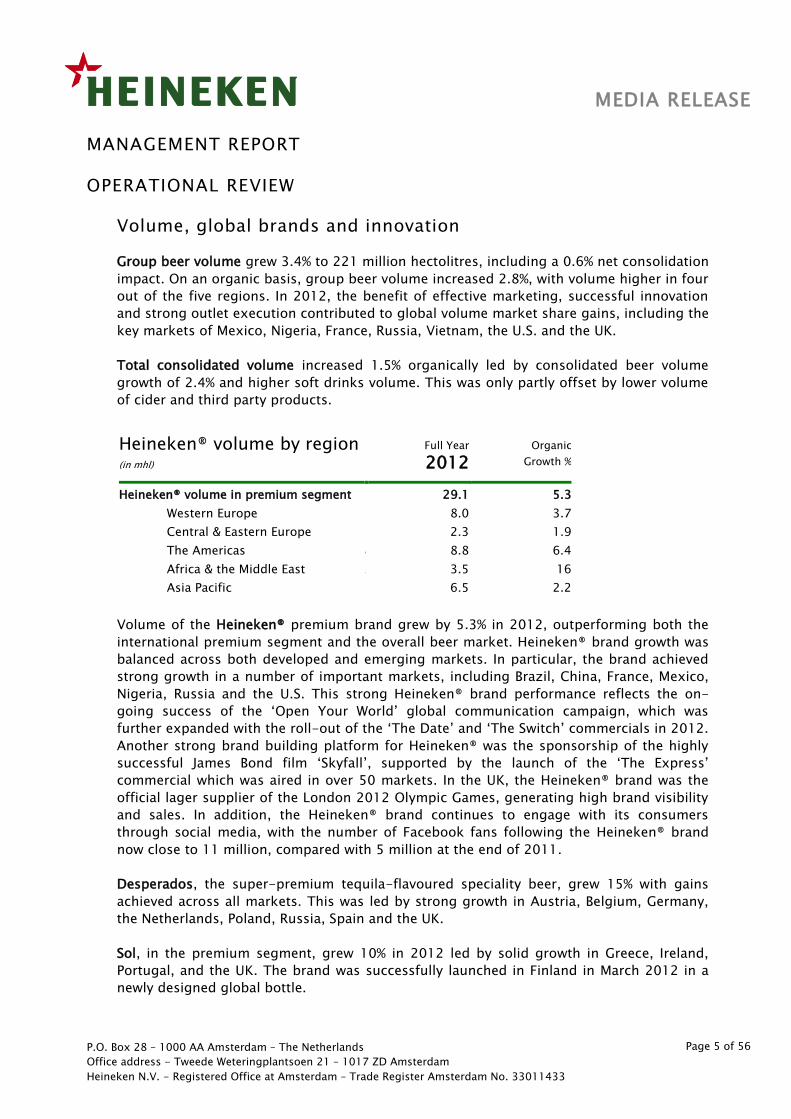
Volume of the Heineken® premium brand grew by 5.3% in 2012, outperforming both the
international premium segment and the overall beer market. Heineken® brand growth was
balanced across both developed and emerging markets. In particular, the brand achieved
strong growth in a number of important markets, including Brazil, China, France, Mexico,
Nigeria, Russia and the U.S. This strong Heineken® brand performance reflects the on-
going success of the ‘Open Your World’ global communication campaign, which was
further expanded with the roll-out of the ‘The Date’ and ‘The Switch’ commercials in 2012.
Another strong brand building platform for Heineken® was the sponsorship of the highly
successful James Bond film ‘Skyfall’, supported by the launch of the ‘The Express’
commercial which was aired in over 50 markets. In the UK, the Heineken® brand was the
official lager supplier of the London 2012 Olympic Games, generating high brand visibility
and sales. In addition, the Heineken® brand continues to engage with its consumers
through social media, with the number of Facebook fans following the Heineken® brand
now close to 11 million, compared with 5 million at the end of 2011.
Desperados, the super-premium tequila-flavoured speciality beer, grew 15% with gains
achieved across all markets. This was led by strong growth in Austria, Belgium, Germany,
the Netherlands, Poland, Russia, Spain and the UK.
Sol, in the premium segment, grew 10% in 2012 led by solid growth in Greece, Ireland,
Portugal, and the UK. The brand was successfully launched in Finland in March 2012 in a
newly designed global bottle.
Heineken® volume by region (in mhl)
Full Year
2012 Organic
Growth %
Heineken® volume in premium segment 29.1 5.3
Western Europe 8.0 3.7
Central & Eastern Europe 2.3 1.9
The Americas 8 8.8 6.4
Africa & the Middle East 3 3.5 16
Asia Pacific 6.5 2.2
MEDIA RELEASE
P.O. Box 28 – 1000 AA Amsterdam – The Netherlands
Office address - Tweede Weteringplantsoen 21 – 1017 ZD Amsterdam
Heineken N.V. - Registered Office at Amsterdam – Trade Register Amsterdam No. 33011433
Page 6 of 56
Volume of Strongbow cider declined 3% as lower volume in the UK was only partly offset by
strong growth in South Africa, Canada, US and Hungary. On 1 January 2013, HEINEKEN
regained the rights to distribute Strongbow in the U.S.
Volume of the Amstel brand grew 3% with the continued success of Amstel Premium
Pilsener in Russia and strong growth of Amstel Malta in Nigeria only partly offset by lower
brand volume in South Africa and Greece.
Innovation remains a key strategic focus area for HEINEKEN to support sustainable value
growth. At the end of 2012, HEINEKEN’s innovation rate increased to 5.3%, from 4.1% in
2011, with innovation contributing €1 billion of revenues in the year. HEINEKEN remains
well on track to achieve its target innovation rate of 6% of annual revenues by 2020. This
higher rate of innovation reflects both local innovations as well as the accelerated roll-out
of global innovations including Desperados, Sol, Strongbow Gold, Amstel Premium Pilsener
and the 4 litre PET keg. The launch of the higher margin ‘Radler’ product varieties (a
refreshing mix of beer and 100% natural juice) in eight markets in Central & Eastern Europe
was a particular success, contributing to incremental volume gains across the region.
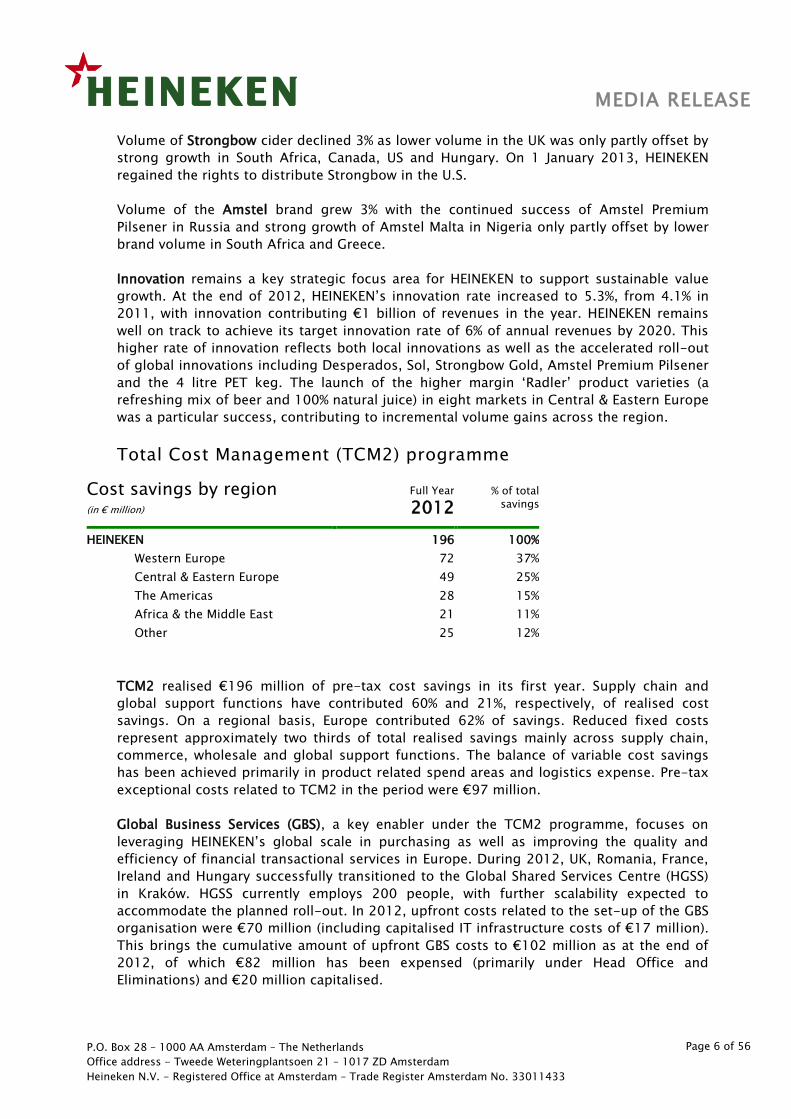
Total Cost Management (TCM2) programme
Cost savings by region (in € million)
Full Year
2012 % of total
savings
HEINEKEN 196 100%
Western Europe 72 37%
Central & Eastern Europe 49 25%
The Americas 8 28 15%
Africa & the Middle East 3 21 11%
Other 25 12%
TCM2 realised €196 million of pre-tax cost savings in its first year. Supply chain and
global support functions have contributed 60% and 21%, respectively, of realised cost
savings. On a regional basis, Europe contributed 62% of savings. Reduced fixed costs
represent approximately two thirds of total realised savings mainly across supply chain,
commerce, wholesale and global support functions. The balance of variable cost savings
has been achieved primarily in product related spend areas and logistics expense. Pre-tax
exceptional costs related to TCM2 in the period were €97 million.
Global Business Services (GBS), a key enabler under the TCM2 programme, focuses on
leveraging HEINEKEN’s global scale in purchasing as well as improving the quality and
efficiency of financial transactional services in Europe. During 2012, UK, Romania, France,
Ireland and Hungary successfully transitioned to the Global Shared Services Centre (HGSS)
in Kraków. HGSS currently employs 200 people, with further scalability expected to
accommodate the planned roll-out. In 2012, upfront costs related to the set-up of the GBS
organisation were €70 million (including capitalised IT infrastructure costs of €17 million).
This brings the cumulative amount of upfront GBS costs to €102 million as at the end of
2012, of which €82 million has been expensed (primarily under Head Office and
Eliminations) and €20 million capitalised.
MEDIA RELEASE
P.O. Box 28 – 1000 AA Amsterdam – The Netherlands
Office address - Tweede Weteringplantsoen 21 – 1017 ZD Amsterdam
Heineken N.V. - Registered Office at Amsterdam – Trade Register Amsterdam No. 33011433
Page 7 of 56
During the first half of 2013, the transition of a further four operating companies to HGSS
is planned. HEINEKEN Global Procurement Company (HGP) contributed significantly to cost
savings across both product and non-product related spend areas. Additionally, HGP
provided service expertise to many operating companies, successfully leveraging the
Company’s enhanced scale with key suppliers. These initiatives are expected to generate
substantial recurring cost savings for HEINEKEN.
Acquisition of Asia Pacific Breweries Limited (APB) and Asia
Pacific Investment Pte Ltd (APIPL)
On 8 February 2013, HEINEKEN published combined pro forma financial information for
APB and APIPL (‘the Acquired Businesses’) for the 12-month period ended 30 June 2012.
HEINEKEN has consolidated the Acquired Businesses under its Asia Pacific reporting region
from 15 November 2012. The Acquired Businesses contributed €287 million of revenue
and €93 million of EBIT (beia) during the period 15 November to 31 December 2012.
Assuming the first time consolidation of APB and APIPL from 1 January 2012, pro forma
2012 revenue and EBIT (beia) of the Acquired Businesses would have amounted to €1,698
million and €425 million, respectively (based on an average EUR/SGD exchange rate of
1.6341). HEINEKEN’s 2012 EBIT (beia) already includes €93 million related to its share of
net profit of the Acquired Businesses before consolidation. HEINEKEN’s 2012 revenue
includes €29 million related to transactions between HEINEKEN and the Acquired
Businesses prior to consolidation.
On a pro forma 2012 basis, the Asia Pacific region would have accounted for 9% of
HEINEKEN’s 2012 revenues and 16% of EBIT (beia).
The acquisition enhances HEINEKEN’s future growth prospects through providing direct
access to a significant and exciting growth region for beer and further expanding the
Company’s emerging market footprint. On a pro forma 2012 basis, HEINEKEN derives 64%
of its consolidated beer volume and 59% of group EBIT (beia) from emerging markets.
The integration of the Acquired Businesses is progressing well and in line with
management plans. This mainly comprises integration of the main activities of the
Acquired Businesses into HEINEKEN’s systems, policies and procedures. The existing head
offices of HEINEKEN and APB will be consolidated to create one regional hub in Singapore.
At the same time, HEINEKEN’s existing standalone businesses in Asia will be operationally
integrated within the APB organisation, in order to create a single regional platform.
Changes to Executive Committee
From 1 April 2013, HEINEKEN will introduce changes to its top management structure and
the composition of its Executive Committee. The changes will ensure HEINEKEN is able to
maintain the positive momentum behind its strategy and long term growth objectives.
These changes will result in a decrease in the size of the Executive Committee from 12
members to 11. Further information can be obtained from the press release issued on 8
February 2013.
MEDIA RELEASE
P.O. Box 28 – 1000 AA Amsterdam – The Netherlands
Office address - Tweede Weteringplantsoen 21 – 1017 ZD Amsterdam
Heineken N.V. - Registered Office at Amsterdam – Trade Register Amsterdam No. 33011433
Page 8 of 56
REGIONAL REVIEW
Western Europe
(in mhl or € million unless stated otherwise) Full Year
2012 Full Year
2011
Total
change %
Organic
change %
Group beer volume 44.6 45.7 -2.4 -2.0
Total consolidated volume 63.2 65.4 -3.4 -3.4
Of which: Consolidated beer volume 44.3 45.4 -2.4 -2.0
Revenue 7,785 7,752 0.4 -0.1
EBIT (beia) 964 962 0.3 -6.6
Operating profit (beia) margin 12.4% 12.4%
Group beer volume declined organically by 2%. Beer markets in the region were adversely
impacted by challenging economic conditions, rising VAT and beer excise rates in several
markets and declining consumer spending in on-premise channels. Despite these
challenges, regional volume performance was resilient, contributing to share gains in the
UK, France, Ireland and Belgium and stable market share in the Netherlands. In December
2012, the French government approved a 160% increase in the beer excise tax rate,
effective from 1 January 2013. The effect of stock building in France in the fourth quarter
of 2012 (ahead of the planned excise duty increase), is estimated to have increased
regional group beer volume by 0.5% in 2012. There was a corresponding 0.5% negative
impact to 2012 regional beer volumes following the planned withdrawal of a product in the
high-promotion discounter channel in Finland.
Revenue on an organic basis was in line with the prior year as the benefit of higher pricing
and improved sales mix offset lower volumes. EBIT (beia) includes a €57 million positive
contribution from the first-time consolidation of Galaxy pubs. The appreciation of the
British pound added a 1% positive currency impact. On an organic basis, the decline in EBIT
(beia) primarily reflects higher input costs and an adverse trade channel mix. Profit grew in
the UK, Italy and Ireland and was lower in the Netherlands, France, Spain, Portugal and
Finland.
Beer volume in the UK outperformed a declining market and contributed to a share gain of
around 60 basis points. Foster’s extended its mainstream beer leadership in the off-
premise channel, whilst the Heineken® brand grew strongly, benefiting from premium
brand building activities including the London 2012 Olympic Games and the James Bond
‘Skyfall’ partnership. Gains in the off-premise channel mostly offset reduced consumption
in the on-premise channel, due to poor summer weather and the challenging economic
environment. 2012 saw the launch of both new Strongbow packaging and Strongbow Pear
alongside continued growth of Bulmers, but overall cider volumes declined in low single
digits. Business performance was further supported by continued growth of Foster's Gold
and Desperados as well as the consolidation of the Galaxy Pub Estate.
Domestic beer volume in France grew in the mid-single digits, including the benefit of
inventory stock build by retailers ahead of the planned excise duty increase from 1 January
2013. Excluding this positive impact, volume would have been in line with prior year.
HEINEKEN again outperformed the market, resulting in volume and value market share
MEDIA RELEASE
P.O. Box 28 – 1000 AA Amsterdam – The Netherlands
Office address - Tweede Weteringplantsoen 21 – 1017 ZD Amsterdam
Heineken N.V. - Registered Office at Amsterdam – Trade Register Amsterdam No. 33011433
Page 9 of 56
leadership in the country. Excluding the impact of stock building, the key brands of
Heineken®, Pelforth and Desperados all grew in 2012.
Volume in Spain declined by low-single digits. The effect of rising unemployment and
government austerity measures (including a higher VAT rate in on-premise outlets)
continued to impede consumer confidence and erode household incomes, leading to lower
volume in on-premise outlets. Volume in off-premise outlets was stable despite growth in
private label brands and a consumer shift towards the discounter channel. The challenging
economic circumstances contributed to a mid-single digit volume decline in the fourth
quarter of 2012. Various innovations including Amstel Extra, Sol and Desperados were
successfully introduced during the year.
Volume of domestic beer sold in Italy was in line with the prior year. This volume
performance reflects declining consumer confidence and price increases taken ahead of
competition. Volume of Birra Moretti remained broadly stable, while slight growth of the
Heineken® brand contributed to further share gains in the premium segment.
Volume in the Netherlands declined in the low-single digits, in line with the beer market. A
VAT increase from October 2012 and declining consumer confidence adversely impacted
spending in on-premise channels, with increased demand for lower priced beer brands in
the off-premise channel. A reorganisation of the wholesale operations in the fourth quarter
of 2012 is expected to lead to improved sales effectiveness and operating efficiencies.
Central & Eastern Europe
(in mhl or € million unless stated otherwise) Full Year
2012 Full Year
2011 Total
change %
Organic
change %
Group beer volume 54.7 52.7 3.8 3.8
Total consolidated volume 49.9 48.3 3.4 3.4
Of which: Consolidated beer volume 47.3 45.4 4.2 4.2
Revenue 3,280 3,229 1.6 3.9
EBIT (beia) 349 346 0.8 0.9
Operating profit (beia) margin 9.9% 10.2%
Group beer volume grew 3.8% organically, led by solid gains across most markets in the
region, partly offset by lower volume in Greece and at the BHI joint venture operation in
Germany.
Organic revenue increased 3.9%, reflecting higher volume and a slight improvement in
revenue per hectolitre. The depreciation of local currencies (i.e. Russian rouble, Belarusian
rouble and the Romanian lei) versus the euro reporting currency limited reported revenue
growth to 1.6%. On an organic basis, EBIT (beia) increased by 0.9%, as higher revenue was
partly offset by substantially higher input costs and increased fixed costs. Profit was higher
in Russia, Austria and Romania and lower in Poland and Greece.
Despite an accelerated shift toward the off-trade channel, the implementation of selected
price increases across the region resulted in improved revenue per hectolitre and a marked
recovery in profitability in the second half of the year. HEINEKEN remains committed to
driving continued value growth in the region, particularly in markets with strong positions.
MEDIA RELEASE
P.O. Box 28 – 1000 AA Amsterdam – The Netherlands
Office address - Tweede Weteringplantsoen 21 – 1017 ZD Amsterdam
Heineken N.V. - Registered Office at Amsterdam – Trade Register Amsterdam No. 33011433
Page 10 of 56
This will be achieved through a renewed strategic focus on pricing, brand equity building
and leveraging regional scale across innovation and commercial capabilities.
Volume in Russia, grew in the low-double digits, resulting in a volume market share gain
of 170 basis points to 13.4% at the end of 2012 (based on Russian beer production data).
Volume growth was led by the Heineken®, Amstel Premium Pilsener, Okskoye and Three
Bears brands. The new ‘Radler’ flavour brand extensions for Zlaty Bazant and Doctor Diesel
also contributed to the strong volume performance in Russia.
Volume in Poland increased in the low-single digits, resulting in stable market share. This
growth was led by the higher margin Desperados and Paulaner brands, as well as Tatra and
Warka, whilst volume of Zywiec was stable. Consumer confidence remains low, contributing
to a continued consumer shift from traditional trade towards the discounter channel.
Innovations such as Warka Radler and Desperados Red were a success in 2012.
In Greece, the effect of a weak economic backdrop was compounded by the
implementation of new austerity measures and rising unemployment. This impacted
consumer purchasing power and resulted in a low-double digit volume decline in 2012.
The economy segment continued to grow, contributing to strong growth of the Alfa brand,
whilst volumes of the Heineken® and Amstel brands were lower.
Volume in Austria increased in the low-single digits in a broadly flat market, underpinned
by solid gains in the off-premise channel. Gösser and Zipfer grew volume and share, owing
to the successful launch of ‘Radler’ brand extensions. Additionally, Heineken® and
Desperados enjoyed solid growth, improving overall sales mix.
Volume in Romania grew by high-single digits, confirming market leadership in both
volume and value terms. The key strategic national brands of Bucegi and Ciuc, as well as
the global brands Heineken® and Amstel all grew volume and value in the double digits.
In December 2012, HEINEKEN and Efes Breweries International (EBI) agreed to unwind their
partnerships in Kazakhstan and Serbia, resulting in a net consideration for HEINEKEN of
US$161 million and full ownership of the Serbian operations. Under the agreement,
HEINEKEN agreed to sell its 28% stake in Efes Kazakhstan to EBI and acquire EBI’s 28% stake
in Central Europe Beverages, the holding company for the Serbian operations, thereby
obtaining full ownership. The transaction related to the Serbian operations closed on 27
December 2012, while the Kazakhstan disposal was completed on 8 January 2013.
In December 2012, Brau Union Austria, signed an agreement with Eckes Granini to divest
the soft drink operations of Pago International. The transaction is expected to complete in
the first quarter of 2013.
MEDIA RELEASE
P.O. Box 28 – 1000 AA Amsterdam – The Netherlands
Office address - Tweede Weteringplantsoen 21 – 1017 ZD Amsterdam
Heineken N.V. - Registered Office at Amsterdam – Trade Register Amsterdam No. 33011433
Page 11 of 56
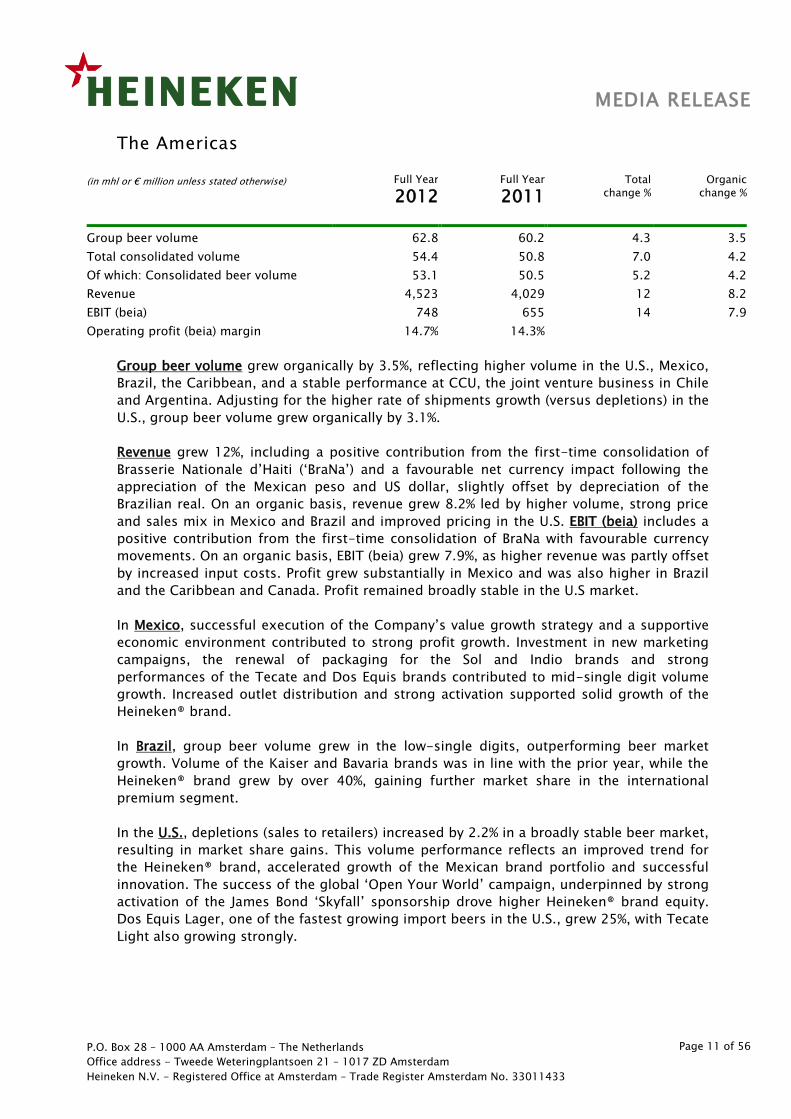
The Americas
(in mhl or € million unless stated otherwise) Full Year
2012 Full Year
2011
Total
change %
Organic
change %
Group beer volume 62.8 60.2 4.3 3.5
Total consolidated volume 54.4 50.8 7.0 4.2
Of which: Consolidated beer volume 53.1 50.5 5.2 4.2
Revenue 4,523 4,029 12 8.2
EBIT (beia) 748 655 14 7.9
Operating profit (beia) margin 14.7% 14.3%
Group beer volume grew organically by 3.5%, reflecting higher volume in the U.S., Mexico,
Brazil, the Caribbean, and a stable performance at CCU, the joint venture business in Chile
and Argentina. Adjusting for the higher rate of shipments growth (versus depletions) in the
U.S., group beer volume grew organically by 3.1%.
Revenue grew 12%, including a positive contribution from the first-time consolidation of
Brasserie Nationale d’Haiti (‘BraNa’) and a favourable net currency impact following the
appreciation of the Mexican peso and US dollar, slightly offset by depreciation of the
Brazilian real. On an organic basis, revenue grew 8.2% led by higher volume, strong price
and sales mix in Mexico and Brazil and improved pricing in the U.S. EBIT (beia) includes a
positive contribution from the first-time consolidation of BraNa with favourable currency
movements. On an organic basis, EBIT (beia) grew 7.9%, as higher revenue was partly offset
by increased input costs. Profit grew substantially in Mexico and was also higher in Brazil
and the Caribbean and Canada. Profit remained broadly stable in the U.S market.
In Mexico, successful execution of the Company’s value growth strategy and a supportive
economic environment contributed to strong profit growth. Investment in new marketing
campaigns, the renewal of packaging for the Sol and Indio brands and strong
performances of the Tecate and Dos Equis brands contributed to mid-single digit volume
growth. Increased outlet distribution and strong activation supported solid growth of the
Heineken® brand.
In Brazil, group beer volume grew in the low-single digits, outperforming beer market
growth. Volume of the Kaiser and Bavaria brands was in line with the prior year, while the
Heineken® brand grew by over 40%, gaining further market share in the international
premium segment.
In the U.S., depletions (sales to retailers) increased by 2.2% in a broadly stable beer market,
resulting in market share gains. This volume performance reflects an improved trend for
the Heineken® brand, accelerated growth of the Mexican brand portfolio and successful
innovation. The success of the global ‘Open Your World’ campaign, underpinned by strong
activation of the James Bond ‘Skyfall’ sponsorship drove higher Heineken® brand equity.
Dos Equis Lager, one of the fastest growing import beers in the U.S., grew 25%, with Tecate
Light also growing strongly.
MEDIA RELEASE
P.O. Box 28 – 1000 AA Amsterdam – The Netherlands
Office address - Tweede Weteringplantsoen 21 – 1017 ZD Amsterdam
Heineken N.V. - Registered Office at Amsterdam – Trade Register Amsterdam No. 33011433
Page 12 of 56
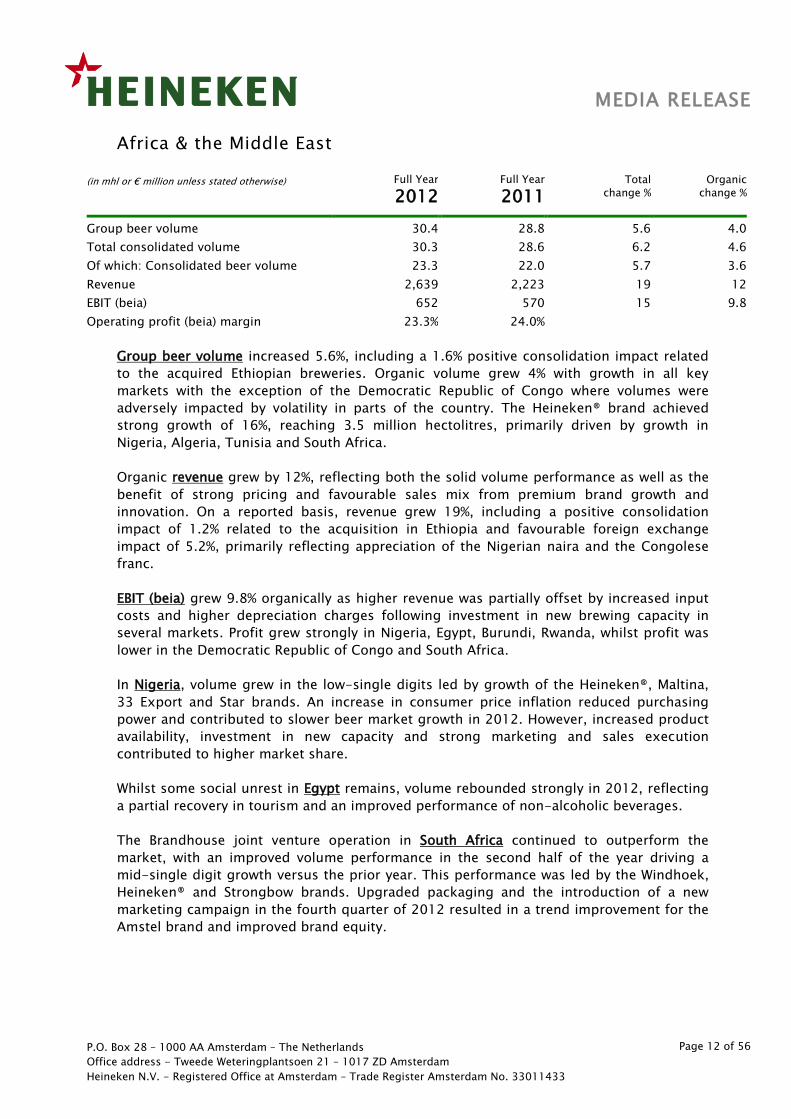
Africa & the Middle East
(in mhl or € million unless stated otherwise) Full Year
2012 Full Year
2011 Total
change %
Organic
change %
Group beer volume 30.4 28.8 5.6 4.0
Total consolidated volume 30.3 28.6 6.2 4.6
Of which: Consolidated beer volume 23.3 22.0 5.7 3.6
Revenue 2,639 2,223 19 12
EBIT (beia) 652 570 15 9.8
Operating profit (beia) margin 23.3% 24.0%
Group beer volume increased 5.6%, including a 1.6% positive consolidation impact related
to the acquired Ethiopian breweries. Organic volume grew 4% with growth in all key
markets with the exception of the Democratic Republic of Congo where volumes were
adversely impacted by volatility in parts of the country. The Heineken® brand achieved
strong growth of 16%, reaching 3.5 million hectolitres, primarily driven by growth in
Nigeria, Algeria, Tunisia and South Africa.
Organic revenue grew by 12%, reflecting both the solid volume performance as well as the
benefit of strong pricing and favourable sales mix from premium brand growth and
innovation. On a reported basis, revenue grew 19%, including a positive consolidation
impact of 1.2% related to the acquisition in Ethiopia and favourable foreign exchange
impact of 5.2%, primarily reflecting appreciation of the Nigerian naira and the Congolese
franc.
EBIT (beia) grew 9.8% organically as higher revenue was partially offset by increased input
costs and higher depreciation charges following investment in new brewing capacity in
several markets. Profit grew strongly in Nigeria, Egypt, Burundi, Rwanda, whilst profit was
lower in the Democratic Republic of Congo and South Africa.
In Nigeria, volume grew in the low-single digits led by growth of the Heineken®, Maltina,
33 Export and Star brands. An increase in consumer price inflation reduced purchasing
power and contributed to slower beer market growth in 2012. However, increased product
availability, investment in new capacity and strong marketing and sales execution
contributed to higher market share.
Whilst some social unrest in Egypt remains, volume rebounded strongly in 2012, reflecting
a partial recovery in tourism and an improved performance of non-alcoholic beverages.
The Brandhouse joint venture operation in South Africa continued to outperform the
market, with an improved volume performance in the second half of the year driving a
mid-single digit growth versus the prior year. This performance was led by the Windhoek,
Heineken® and Strongbow brands. Upgraded packaging and the introduction of a new
marketing campaign in the fourth quarter of 2012 resulted in a trend improvement for the
Amstel brand and improved brand equity.
MEDIA RELEASE
P.O. Box 28 – 1000 AA Amsterdam – The Netherlands
Office address - Tweede Weteringplantsoen 21 – 1017 ZD Amsterdam
Heineken N.V. - Registered Office at Amsterdam – Trade Register Amsterdam No. 33011433
Page 13 of 56
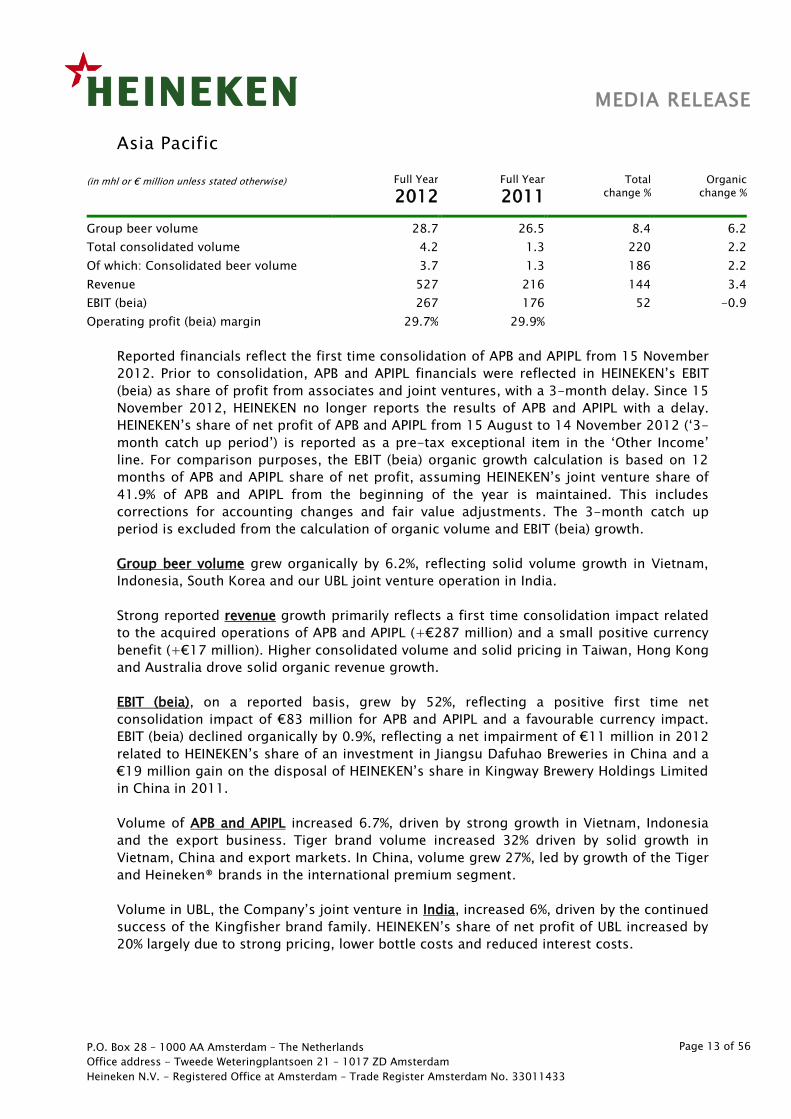
Asia Pacific
(in mhl or € million unless stated otherwise) Full Year
2012 Full Year
2011 Total
change %
Organic
change %
Group beer volume 28.7 26.5 8.4 6.2
Total consolidated volume 4.2 1.3 220 2.2
Of which: Consolidated beer volume 3.7 1.3 186 2.2
Revenue 527 216 144 3.4
EBIT (beia) 267 176 52 -0.9
Operating profit (beia) margin 29.7% 29.9%
Reported financials reflect the first time consolidation of APB and APIPL from 15 November
2012. Prior to consolidation, APB and APIPL financials were reflected in HEINEKEN’s EBIT
(beia) as share of profit from associates and joint ventures, with a 3-month delay. Since 15
November 2012, HEINEKEN no longer reports the results of APB and APIPL with a delay.
HEINEKEN’s share of net profit of APB and APIPL from 15 August to 14 November 2012 (‘3-
month catch up period’) is reported as a pre-tax exceptional item in the ‘Other Income’
line. For comparison purposes, the EBIT (beia) organic growth calculation is based on 12
months of APB and APIPL share of net profit, assuming HEINEKEN’s joint venture share of
41.9% of APB and APIPL from the beginning of the year is maintained. This includes
corrections for accounting changes and fair value adjustments. The 3-month catch up
period is excluded from the calculation of organic volume and EBIT (beia) growth.
Group beer volume grew organically by 6.2%, reflecting solid volume growth in Vietnam,
Indonesia, South Korea and our UBL joint venture operation in India.
Strong reported revenue growth primarily reflects a first time consolidation impact related
to the acquired operations of APB and APIPL (+€287 million) and a small positive currency
benefit (+€17 million). Higher consolidated volume and solid pricing in Taiwan, Hong Kong
and Australia drove solid organic revenue growth.
EBIT (beia), on a reported basis, grew by 52%, reflecting a positive first time net
consolidation impact of €83 million for APB and APIPL and a favourable currency impact.
EBIT (beia) declined organically by 0.9%, reflecting a net impairment of €11 million in 2012
related to HEINEKEN’s share of an investment in Jiangsu Dafuhao Breweries in China and a
€19 million gain on the disposal of HEINEKEN’s share in Kingway Brewery Holdings Limited
in China in 2011.
Volume of APB and APIPL increased 6.7%, driven by strong growth in Vietnam, Indonesia
and the export business. Tiger brand volume increased 32% driven by solid growth in
Vietnam, China and export markets. In China, volume grew 27%, led by growth of the Tiger
and Heineken® brands in the international premium segment.
Volume in UBL, the Company’s joint venture in India, increased 6%, driven by the continued
success of the Kingfisher brand family. HEINEKEN’s share of net profit of UBL increased by
20% largely due to strong pricing, lower bottle costs and reduced interest costs.
MEDIA RELEASE
P.O. Box 28 – 1000 AA Amsterdam – The Netherlands
Office address - Tweede Weteringplantsoen 21 – 1017 ZD Amsterdam
Heineken N.V. - Registered Office at Amsterdam – Trade Register Amsterdam No. 33011433
Page 14 of 56
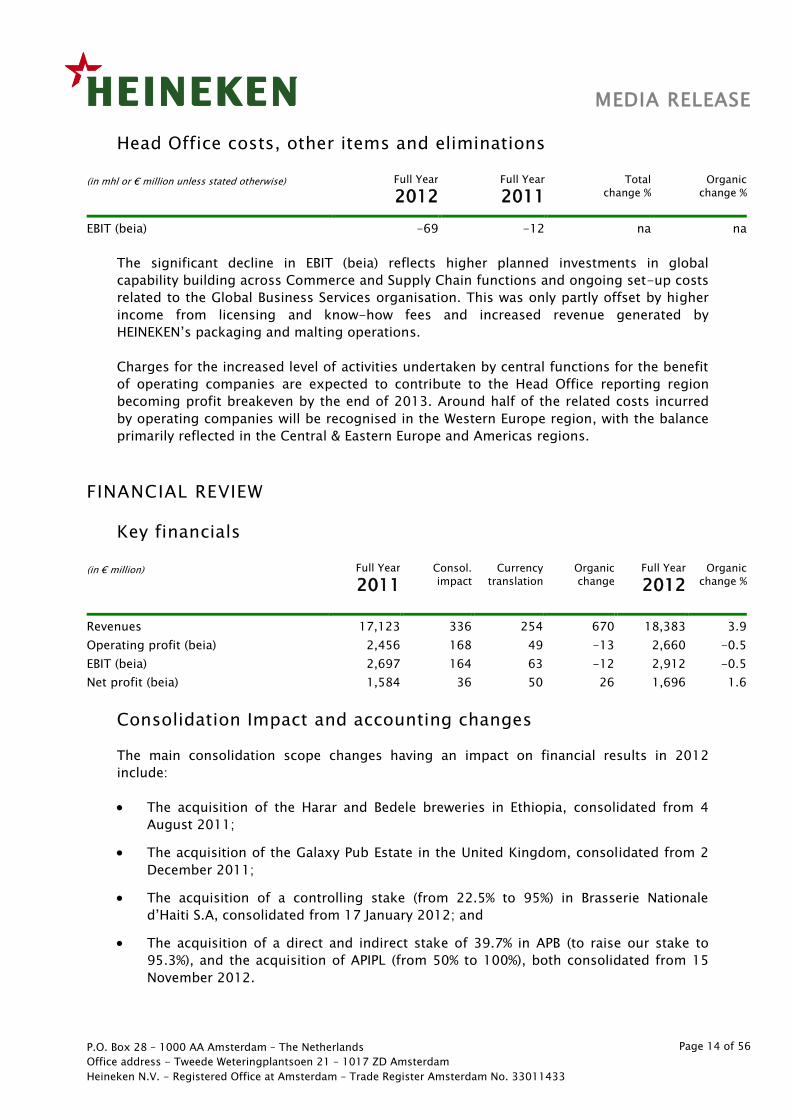
Head Office costs, other items and eliminations
(in mhl or € million unless stated otherwise) Full Year
2012 Full Year
2011 Total
change %
Organic
change %
EBIT (beia) -69 -12 na na
The significant decline in EBIT (beia) reflects higher planned investments in global
capability building across Commerce and Supply Chain functions and ongoing set-up costs
related to the Global Business Services organisation. This was only partly offset by higher
income from licensing and know-how fees and increased revenue generated by
HEINEKEN’s packaging and malting operations.
Charges for the increased level of activities undertaken by central functions for the benefit
of operating companies are expected to contribute to the Head Office reporting region
becoming profit breakeven by the end of 2013. Around half of the related costs incurred
by operating companies will be recognised in the Western Europe region, with the balance
primarily reflected in the Central & Eastern Europe and Americas regions.
FINANCIAL REVIEW
Key financials
(in € million) Full Year
2011
Consol.
impact
Currency
translation
Organic
change
Full Year
2012 Organic
change %
Revenues 17,123 336 254 670 18,383 3.9
Operating profit (beia) 2,456 168 49 -13 2,660 -0.5
EBIT (beia) 2,697 164 63 -12 2,912 -0.5
Net profit (beia) 1,584 36 50 26 1,696 1.6
Consolidation Impact and accounting changes
The main consolidation scope changes having an impact on financial results in 2012
include:
The acquisition of the Harar and Bedele breweries in Ethiopia, consolidated from 4
August 2011;
The acquisition of the Galaxy Pub Estate in the United Kingdom, consolidated from 2
December 2011;
The acquisition of a controlling stake (from 22.5% to 95%) in Brasserie Nationale
d’Haiti S.A, consolidated from 17 January 2012; and
The acquisition of a direct and indirect stake of 39.7% in APB (to raise our stake to
95.3%), and the acquisition of APIPL (from 50% to 100%), both consolidated from 15
November 2012.
MEDIA RELEASE
P.O. Box 28 – 1000 AA Amsterdam – The Netherlands
Office address - Tweede Weteringplantsoen 21 – 1017 ZD Amsterdam
Heineken N.V. - Registered Office at Amsterdam – Trade Register Amsterdam No. 33011433
Page 15 of 56
With effect from 1 January 2013 HEINEKEN has adopted the amended IAS19 in its
accounting policies. Had this policy change been introduced from 1 January 2012, this
would have led to an estimated increase in total pension costs of €99 million in 2012.
Previously, the interest expense on the net pension liability was reported within personnel
expenses. With effect from 1 January 2013, HEINEKEN will report the interest expense on
its net pension liability in the ‘Other net finance income/ (expenses)’ line of the income
statement. Had this change been introduced from 1 January 2012, this would have led to
an estimated pre-tax increase in HEINEKEN’s 2012 ‘Other net finance income/ (expenses)’
line of €68 million and an increase in personnel expenses, resulting in a reduction in group
EBIT (beia)) of €31 million. The new accounting standard will be applied retrospectively and
accordingly, HEINEKEN will restate 2012 financials in its 2013 results.
Revenue
Revenue increased 7.4% to €18,383 million, reflecting revenue growth of 3.9% on an
organic basis, a positive net consolidation effect of 2% (+€336 million) and a favourable
foreign currency effect of 1.5% (+€254 million), largely driven by the Nigerian naira, the
Mexican peso and the British pound. Organic revenue growth of 3.9% is made up of total
consolidation volume growth of 1.5% and a 2.4% increase in revenue per hectolitre. The
2.4% is net of a negative country mix effect of 0.6%.
Total Expenses
Total expenses (beia) increased 4.7% on an organic basis. Input costs increased organically
by 11%, and by 8.3% on a per hectolitre basis, primarily reflecting higher malted barley
prices.
Energy and water costs were €562 million, up 4.9% organically. Personnel costs increased
4.9% organically.
Marketing and selling (beia) expenses increased organically by 0.3%, to €2,250 million,
representing 12.2% of revenues (2011: 12.8%). Improved effectiveness of marketing spend,
combined with brand equity building activities and innovation, contributed to global
volume market share gains in 2012.
EBIT and EBIT (beia)
EBIT (beia) grew 8% to €2,912 million. First time consolidations added €164 million (+6.1%),
related to the acquisitions of APB and APIPL, Galaxy Pub Estate in the UK and BraNa in Haiti.
Favourable currency movements (in particular the British pound, Nigeria naira and Mexico
peso) increased EBIT (beia) by €63 million (+2.4%).
EBIT (beia) was 0.5% lower organically, as the benefit of higher revenues and realised cost
savings were offset by higher planned capability building and increased input costs.
HEINEKEN’s share of profit in joint ventures and associates increased as higher profit from
joint venture operations in India, Ghana, Germany and the Republic of Congo, was only
partly offset by lower profitability of the CCU joint venture business and APB. The lower
share of profit in APB reflects the impact of one-time items related to the disposal of
HEINEKEN’s share of two separate investments in China.
MEDIA RELEASE
P.O. Box 28 – 1000 AA Amsterdam – The Netherlands
Office address - Tweede Weteringplantsoen 21 – 1017 ZD Amsterdam
Heineken N.V. - Registered Office at Amsterdam – Trade Register Amsterdam No. 33011433
Page 16 of 56
On a reported basis, EBIT increased by 59% to €3,904 million with marginally lower results
from operating activities offset by a €1,486 million exceptional gain related to the
revaluation of HEINEKEN’s previously held equity interest in APB and APIPL.
Net finance expenses
On reported basis, interest expenses increased by €65 million, reflecting higher interest
expense related to financing raised for the acquisition of APB and APIPL. On an organic
basis, net interest costs declined by €23 million. The average interest rate in 2012 was
5.4%, compared with 5.2% in 2011, mainly due to Nigeria representing a higher proportion
of total group interest expense.
On a reported basis, other net finance income/ (expense) includes a €20 million capital
gain related to the revaluation of HEINEKEN’s existing 22% interest in Brasserie d’Haiti and
a €175 million gain related to the sale of a 9.3% interest in a brewery in the Dominican
Republic.
Taxation
The effective tax rate (beia) was 26.5%, slightly below the 2011 (beia) tax rate of 26.8%.
Similar to 2011, the effective tax rate (beia) in 2012 includes the result of favourable
outcomes with tax authorities in certain markets. The lower reported tax rate in 2012 of
15.3% (2011: 26.1%) can be explained by the tax exempt revaluation of HEINEKEN’s
previously held equity interest in APB, prior to consolidation.
Net profit and net profit (beia)
Net profit (beia) grew organically by 1.6% to €1,696 million, driven by a lower effective tax
rate, a decline in interest expense and other net financial costs and higher dividend income.
Favourable foreign currency movements increased net profit by €50 million (+3.1%). The
net contribution from first time consolidations added €36 million (+2.3%) mainly related to
the acquisitions of APB and APIPL and the Galaxy Pub Estate in the UK.
Reported net profit increased to €2,949 million from €1,430 million in 2011. 2012 net
profit includes the recognition of a €1,486 million exceptional gain related to the
revaluation of HEINEKEN’s previously held equity interest in APB and APIPL.
MEDIA RELEASE
P.O. Box 28 – 1000 AA Amsterdam – The Netherlands
Office address - Tweede Weteringplantsoen 21 – 1017 ZD Amsterdam
Heineken N.V. - Registered Office at Amsterdam – Trade Register Amsterdam No. 33011433
Page 17 of 56
Exceptional items and amortisation of acquisition related
intangible assets (eia)
(in € million) Full Year
2012
Full Year
2011
Amortisation of acquisition related intangible assets incl. in EBIT
Amortisation of acquisition related intangible assets (198) (170)
Exceptional items included in EBIT
APB and APIPL revaluation gain 1,486 0
APB and APIPL reversal of revaluation of inventory (76) 0
APB and APIPL acquisition costs (28) 0
TCM2 programme (97) (81)
Others (95) 9
Net eia (losses)/gains included in EBIT 992 (242)
BraNa revaluation gain 20 0
Gain on sale of brewery investment in the Dominican Republic 175 0
Other 11 14
Net eia (losses)/gains incl. in net finance expenses 206 14
eia included in income tax expenses
Tax on amortisation of acquisition related intangible assets 53 47
Tax effect on other exceptional items 2 27
Exceptional tax items 0 0
Net eia (losses)/gains incl. in income tax expenses 55 74
Total eia (losses)/gains included in net profit 1,253 (154)
In 2012, the increase in amortisation of acquisition related intangible assets reflects the
first time consolidation of APB and APIPL, the Galaxy Pub Estate in the UK and BraNa in
Haiti.
On 17 January 2012, HEINEKEN increased its shareholding in BraNa from 22.5% to 95%. The
alignment to fair value of the existing stake in BraNa resulted in the recognition of a book
gain of €20 million.
On 16 April 2012 HEINEKEN sold its 9.3% minority stake in Cervecería Nacional Dominicana
S.A. (‘CND’) in the Dominican Republic for US$237 million. This gave rise to a pre-tax gain
of €175 million.
In 2012, a €1,486 million pre-tax exceptional gain was recognised, related to the
revaluation of HEINEKEN’s previously held equity interest in APB and APIPL. Pre-tax
exceptional costs of €97 million under TCM2 were primarily related to the restructuring of
wholesale operations in the Western Europe region.
MEDIA RELEASE
P.O. Box 28 – 1000 AA Amsterdam – The Netherlands
Office address - Tweede Weteringplantsoen 21 – 1017 ZD Amsterdam
Heineken N.V. - Registered Office at Amsterdam – Trade Register Amsterdam No. 33011433
Page 18 of 56
In 2012, ‘Other’ exceptional items included in EBIT comprise:
€37 million exceptional cost from decommissioning of two biomass plants in UK;
€20 million arising from an adjustment to an acquisition outside the provisional
accounting period;
€36 million related to the write-off of a deferred tax asset in an associate.
Foreign exchange rate movements
Favourable currency fluctuations improved EBIT (beia) by €63 million in 2012. This was
largely due to an appreciation of the Nigerian naira (+6%), the British pound (+7%), the
Mexican peso (+2%) and the Singapore dollar (+9%). At the net profit level, foreign
currency movements had a positive impact of €50 million.
HEINEKEN delays the impact of the U.S. dollar fluctuations versus the euro by hedging the
net cash inflow of US dollars from exports for up to 18 months in advance.
The average EUR/USD exchange rate inclusive of hedging was 1.36 in 2012, versus 1.35 in
2011. For the full year 2013, the net dollar inflow is forecast at USD 625 million, of which
81% has been hedged at EUR/USD1.31. For 2014, the net dollar inflow is forecast at
approximately USD 613 million of which 23% is hedged at EUR/USD 1.30 as of 8 February
2013.
Balance sheet and cash flow
Total assets increased to €36.0 billion (2011: €27.1 billion) reflecting the acquisition of
APB and APIPL. Capital expenditure related to property, plant and equipment increased to
€1,170 million (2011: €800 million) representing 6.4% of revenues. The higher capital
expenditure in 2012 reflects investments in additional brewing capacity and the renewal
and expansion of the returnable bottle fleet in higher growth markets.
Free operating cash flow declined to €1,485 million from €2,093 million, predominantly
owing to increased capital expenditure in high growth markets.
Equity attributable to equity holders of the Company increased by €1,917 million to
€11,691 million, mainly driven by the strong reported net profit performance (including
the exceptional revaluation gain on HEINEKEN’s previously held equity interest in APB and
APIPL), partly offset by dividends paid.
Financial Structure
Net debt increased to €12,312 million (from €8,355 million at the end of December 2011),
due to the acquisition of APB which had a material impact on net debt.
The pro forma net debt/EBITDA (beia) ratio was 2.8x on 31 December 2012. HEINEKEN is
committed to return to within the Company’s long-term target ratio of below 2.5x by the
end of 2014.
MEDIA RELEASE
P.O. Box 28 – 1000 AA Amsterdam – The Netherlands
Office address - Tweede Weteringplantsoen 21 – 1017 ZD Amsterdam
Heineken N.V. - Registered Office at Amsterdam – Trade Register Amsterdam No. 33011433
Page 19 of 56
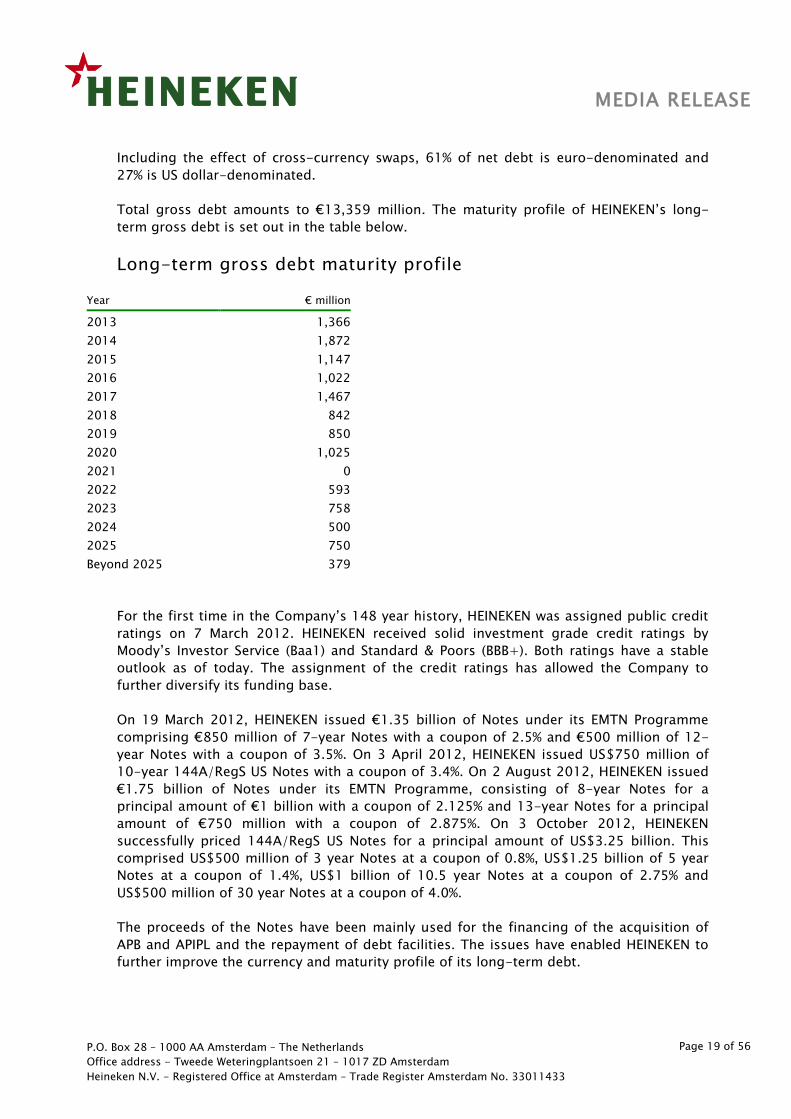
Including the effect of cross-currency swaps, 61% of net debt is euro-denominated and
27% is US dollar-denominated.
Total gross debt amounts to €13,359 million. The maturity profile of HEINEKEN’s long-
term gross debt is set out in the table below.
Long-term gross debt maturity profile
Year € million
2013 1,366
2014 1,872
2015 1,147
2016 1,022
2017 1,467
2018 842
2019 850
2020 1,025
2021 0
2022 593
2023 758
2024 500
2025 750
Beyond 2025 379
For the first time in the Company’s 148 year history, HEINEKEN was assigned public credit
ratings on 7 March 2012. HEINEKEN received solid investment grade credit ratings by
Moody’s Investor Service (Baa1) and Standard & Poors (BBB+). Both ratings have a stable
outlook as of today. The assignment of the credit ratings has allowed the Company to
further diversify its funding base.
On 19 March 2012, HEINEKEN issued €1.35 billion of Notes under its EMTN Programme
comprising €850 million of 7-year Notes with a coupon of 2.5% and €500 million of 12-
year Notes with a coupon of 3.5%. On 3 April 2012, HEINEKEN issued US$750 million of
10-year 144A/RegS US Notes with a coupon of 3.4%. On 2 August 2012, HEINEKEN issued
€1.75 billion of Notes under its EMTN Programme, consisting of 8-year Notes for a
principal amount of €1 billion with a coupon of 2.125% and 13-year Notes for a principal
amount of €750 million with a coupon of 2.875%. On 3 October 2012, HEINEKEN
successfully priced 144A/RegS US Notes for a principal amount of US$3.25 billion. This
comprised US$500 million of 3 year Notes at a coupon of 0.8%, US$1.25 billion of 5 year
Notes at a coupon of 1.4%, US$1 billion of 10.5 year Notes at a coupon of 2.75% and
US$500 million of 30 year Notes at a coupon of 4.0%.
The proceeds of the Notes have been mainly used for the financing of the acquisition of
APB and APIPL and the repayment of debt facilities. The issues have enabled HEINEKEN to
further improve the currency and maturity profile of its long-term debt.
MEDIA RELEASE
P.O. Box 28 – 1000 AA Amsterdam – The Netherlands
Office address - Tweede Weteringplantsoen 21 – 1017 ZD Amsterdam
Heineken N.V. - Registered Office at Amsterdam – Trade Register Amsterdam No. 33011433
Page 20 of 56
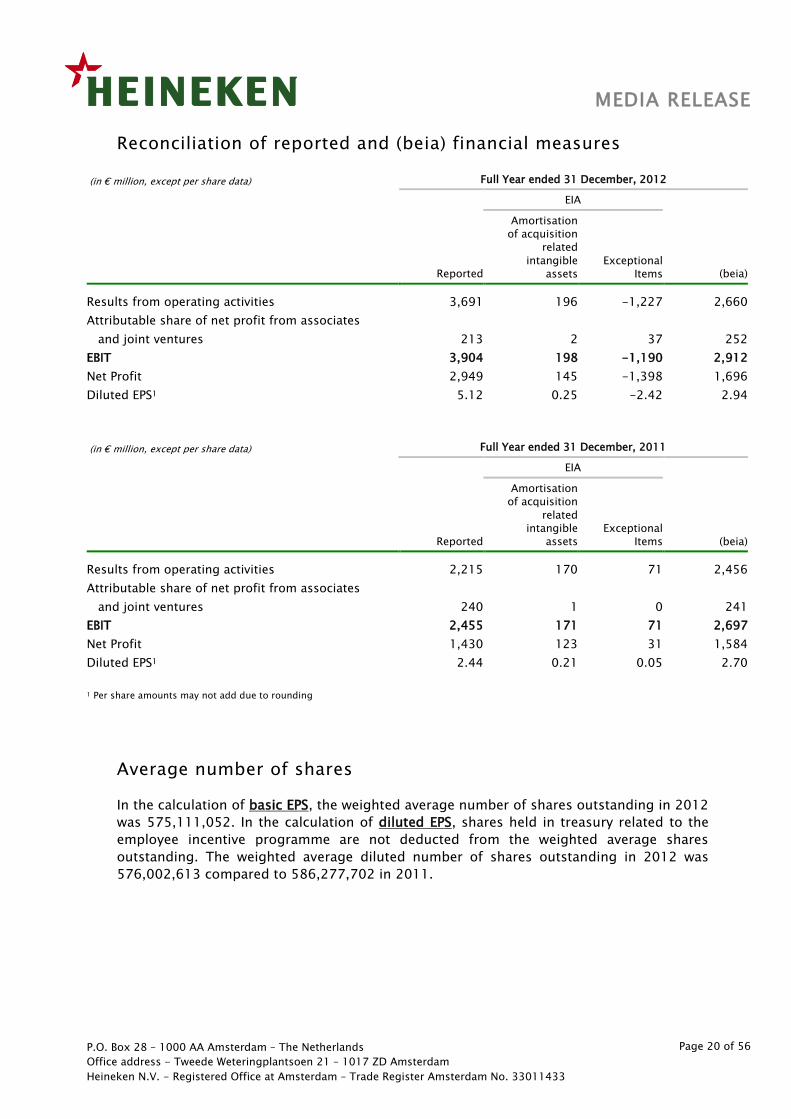
Reconciliation of reported and (beia) financial measures
(in € million, except per share data) Full Year ended 31 December, 2012
Reported
EIA
Amortisation
of acquisition
related
intangible
assets
Exceptional
Items (beia)
Results from operating activities 3,691 196 -1,227 2,660
Attributable share of net profit from associates
and joint ventures 213 2 37 252
EBIT 3,904 198 -1,190 2,912
Net Profit 2,949 145 -1,398 1,696
Diluted EPS1 5.12 0.25 -2.42 2.94
(in € million, except per share data) Full Year ended 31 December, 2011
Reported
EIA
Amortisation
of acquisition
related
intangible
assets
Exceptional
Items (beia)
Results from operating activities 2,215 170 71 2,456
Attributable share of net profit from associates
and joint ventures 240 1 0 241
EBIT 2,455 171 71 2,697
Net Profit 1,430 123 31 1,584
Diluted EPS1 2.44 0.21 0.05 2.70
1 Per share amounts may not add due to rounding
Average number of shares
In the calculation of basic EPS, the weighted average number of shares outstanding in 2012
was 575,111,052. In the calculation of diluted EPS, shares held in treasury related to the
employee incentive programme are not deducted from the weighted average shares
outstanding. The weighted average diluted number of shares outstanding in 2012 was
576,002,613 compared to 586,277,702 in 2011.
MEDIA RELEASE
P.O. Box 28 – 1000 AA Amsterdam – The Netherlands
Office address - Tweede Weteringplantsoen 21 – 1017 ZD Amsterdam
Heineken N.V. - Registered Office at Amsterdam – Trade Register Amsterdam No. 33011433
Page 21 of 56
Establishment of Level 1 sponsored American Depositary Receipt
(ADR) program
On 11 December 2012, HEINEKEN announced that it has established a sponsored Level 1
ADR program. The transition from a previously unsponsored to new sponsored ADR
program is aimed at better facilitating the trading of Heineken N.V. and Heineken Holding
N.V. stock in the United States.
HEINEKEN’s shares are trading Over-the-Counter (OTC) in the U.S. as ADRs. There are two
separate ADR programs representing ownership respectively in Heineken N.V. and
Heineken Holding N.V. For both programs, the ratio between HEINEKEN ADRs and the
ordinary Dutch (euro-denominated) shares is 2:1 i.e. two ADRs represent one ordinary
share.
MEDIA RELEASE
P.O. Box 28 – 1000 AA Amsterdam – The Netherlands
Office address - Tweede Weteringplantsoen 21 – 1017 ZD Amsterdam
Heineken N.V. - Registered Office at Amsterdam – Trade Register Amsterdam No. 33011433
Page 22 of 56
APPENDICES
1. Consolidated income statement
2. Consolidated statement of comprehensive income
3. Consolidated statement of financial position
4. Consolidated statement of cash flows
5. Consolidated statement of changes in equity
6. Earnings per share
7. Dividends
8. Operating segments
9. Acquisitions and disposals
10. Raw materials, consumables and services
11. Loans and borrowings
12. Notes to the appendices
13. Glossary
MEDIA RELEASE
P.O. Box 28 – 1000 AA Amsterdam – The Netherlands
Office address - Tweede Weteringplantsoen 21 – 1017 ZD Amsterdam
Heineken N.V. - Registered Office at Amsterdam – Trade Register Amsterdam No. 33011433
Page 23 of 56
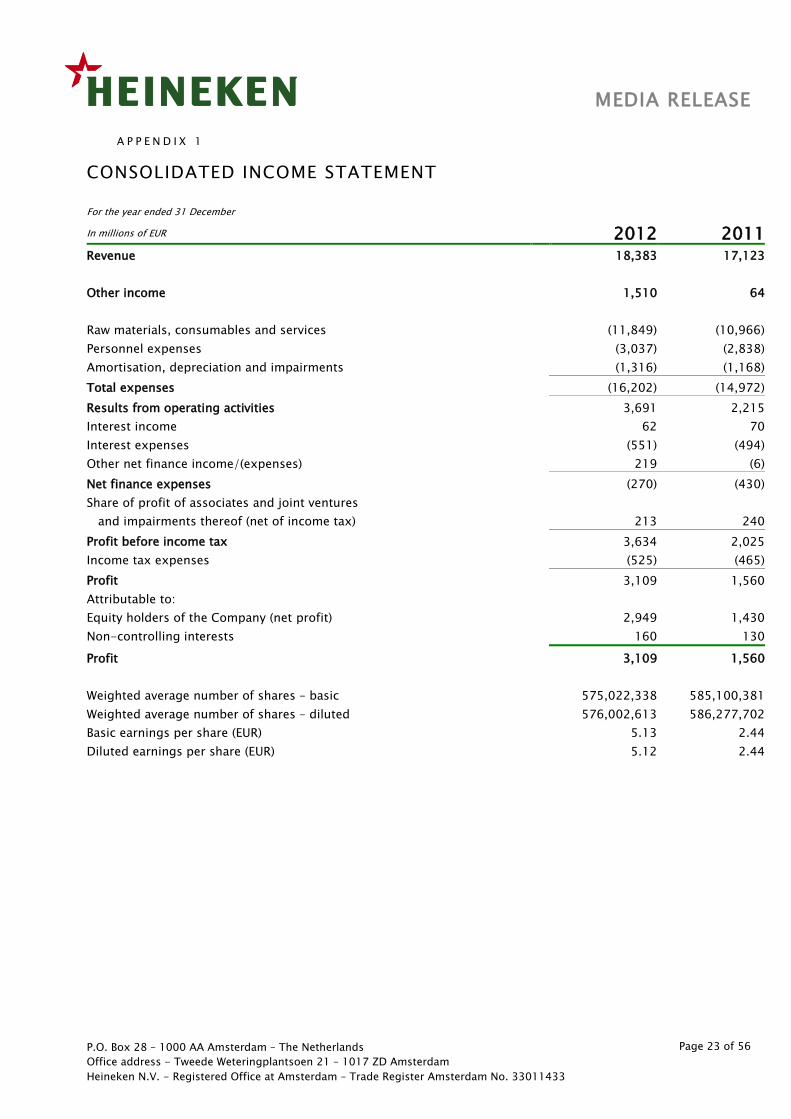
A P P E N D I X 1
CONSOLIDATED INCOME STATEMENT
For the year ended 31 December
In millions of EUR 2012 2011 Revenue 18,383 17,123
Other income 1,510 64
Raw materials, consumables and services (11,849) (10,966)
Personnel expenses (3,037) (2,838)
Amortisation, depreciation and impairments (1,316) (1,168)
Total expenses (16,202) (14,972)
Results from operating activities 3,691 2,215
Interest income 62 70
Interest expenses (551) (494)
Other net finance income/(expenses) 219 (6)
Net finance expenses (270) (430)
Share of profit of associates and joint ventures
and impairments thereof (net of income tax) 213 240
Profit before income tax 3,634 2,025
Income tax expenses (525) (465)
Profit 3,109 1,560
Attributable to:
Equity holders of the Company (net profit) 2,949 1,430
Non-controlling interests 160 130
Profit 3,109 1,560
Weighted average number of shares – basic 575,022,338 585,100,381
Weighted average number of shares – diluted 576,002,613 586,277,702
Basic earnings per share (EUR) 5.13 2.44
Diluted earnings per share (EUR) 5.12 2.44
MEDIA RELEASE
P.O. Box 28 – 1000 AA Amsterdam – The Netherlands
Office address - Tweede Weteringplantsoen 21 – 1017 ZD Amsterdam
Heineken N.V. - Registered Office at Amsterdam – Trade Register Amsterdam No. 33011433
Page 24 of 56
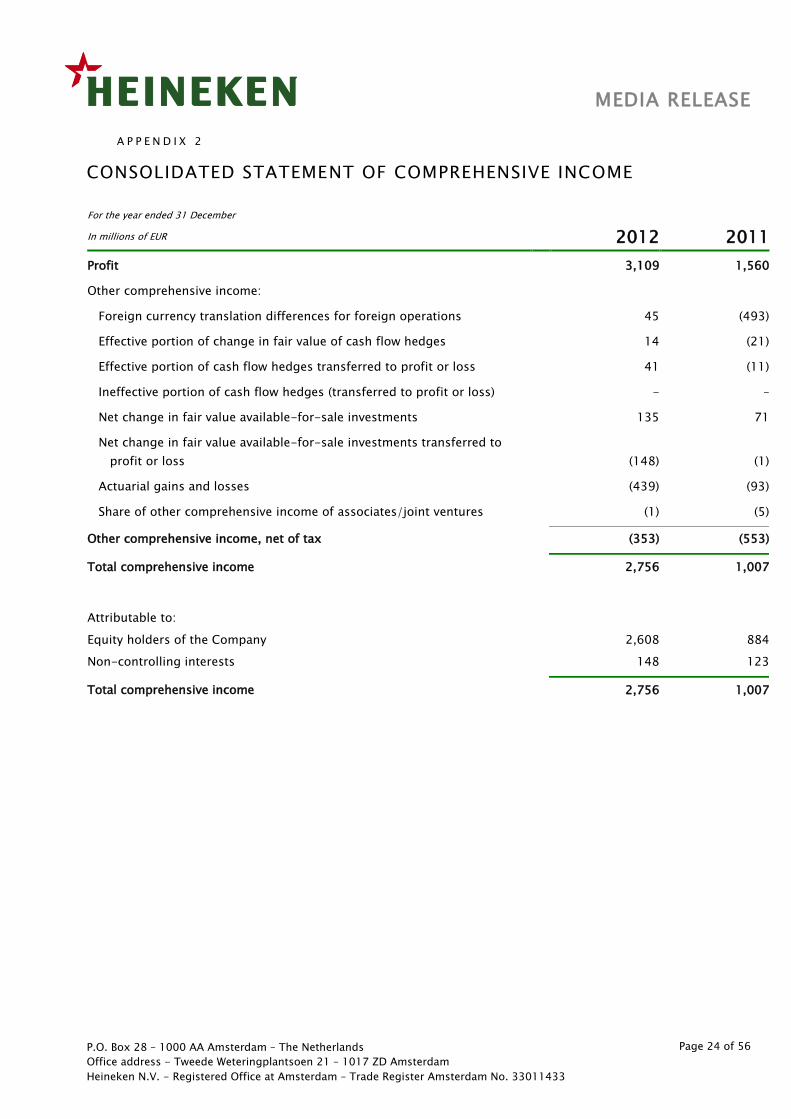
A P P E N D I X 2
CONSOLIDATED STATEMENT OF COMPREHENSIVE INCOME
For the year ended 31 December
In millions of EUR 2012 2011
Profit 3,109 1,560
Other comprehensive income:
Foreign currency translation differences for foreign operations 45 (493)
Effective portion of change in fair value of cash flow hedges 14 (21)
Effective portion of cash flow hedges transferred to profit or loss 41 (11)
Ineffective portion of cash flow hedges (transferred to profit or loss) - –
Net change in fair value available-for-sale investments 135 71
Net change in fair value available-for-sale investments transferred to
profit or loss
(148) (1)
Actuarial gains and losses (439) (93)
Share of other comprehensive income of associates/joint ventures (1) (5)
Other comprehensive income, net of tax (353) (553)
Total comprehensive income 2,756 1,007
Attributable to:
Equity holders of the Company 2,608 884
Non-controlling interests 148 123
Total comprehensive income 2,756 1,007
MEDIA RELEASE
P.O. Box 28 – 1000 AA Amsterdam – The Netherlands
Office address - Tweede Weteringplantsoen 21 – 1017 ZD Amsterdam
Heineken N.V. - Registered Office at Amsterdam – Trade Register Amsterdam No. 33011433
Page 25 of 56
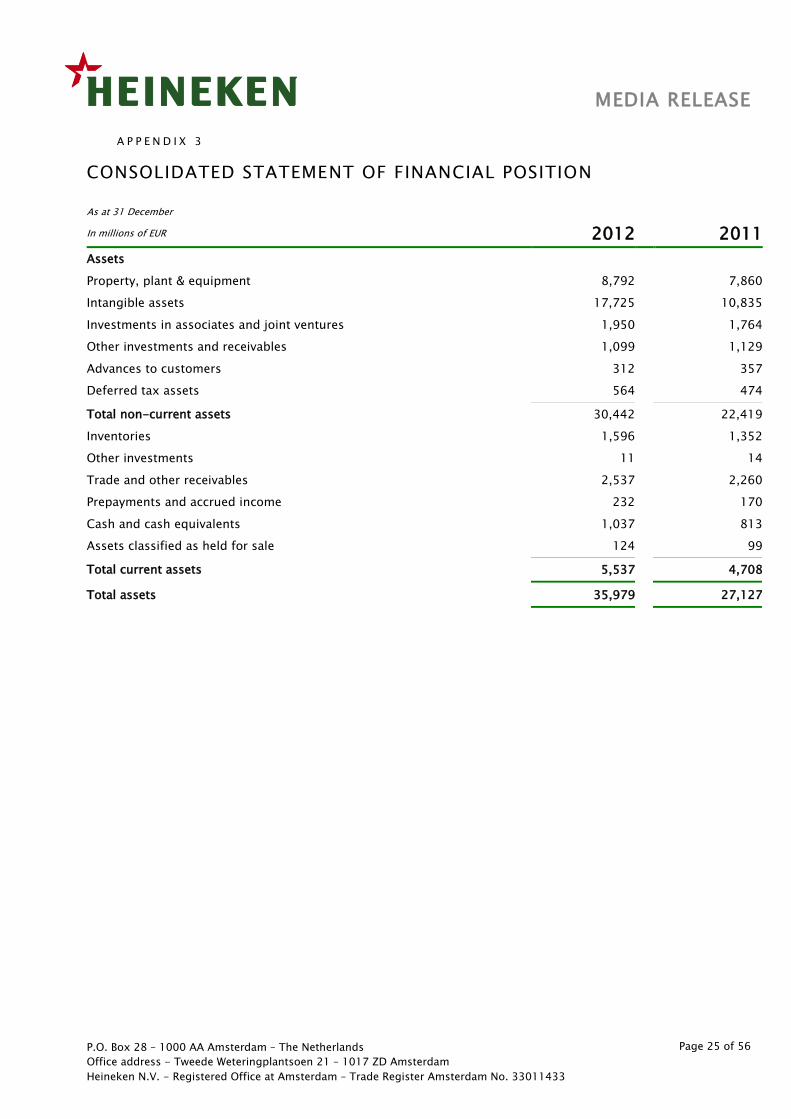
A P P E N D I X 3
CONSOLIDATED STATEMENT OF FINANCIAL POSITION
As at 31 December
In millions of EUR 2012 2011
Assets
Property, plant & equipment 8,792 7,860
Intangible assets 17,725 10,835
Investments in associates and joint ventures 1,950 1,764
Other investments and receivables 1,099 1,129
Advances to customers 312 357
Deferred tax assets 564 474
Total non-current assets 30,442 22,419
Inventories 1,596 1,352
Other investments 11 14
Trade and other receivables 2,537 2,260
Prepayments and accrued income 232 170
Cash and cash equivalents 1,037 813
Assets classified as held for sale 124 99
Total current assets 5,537 4,708
Total assets 35,979 27,127
MEDIA RELEASE
P.O. Box 28 – 1000 AA Amsterdam – The Netherlands
Office address - Tweede Weteringplantsoen 21 – 1017 ZD Amsterdam
Heineken N.V. - Registered Office at Amsterdam – Trade Register Amsterdam No. 33011433
Page 26 of 56
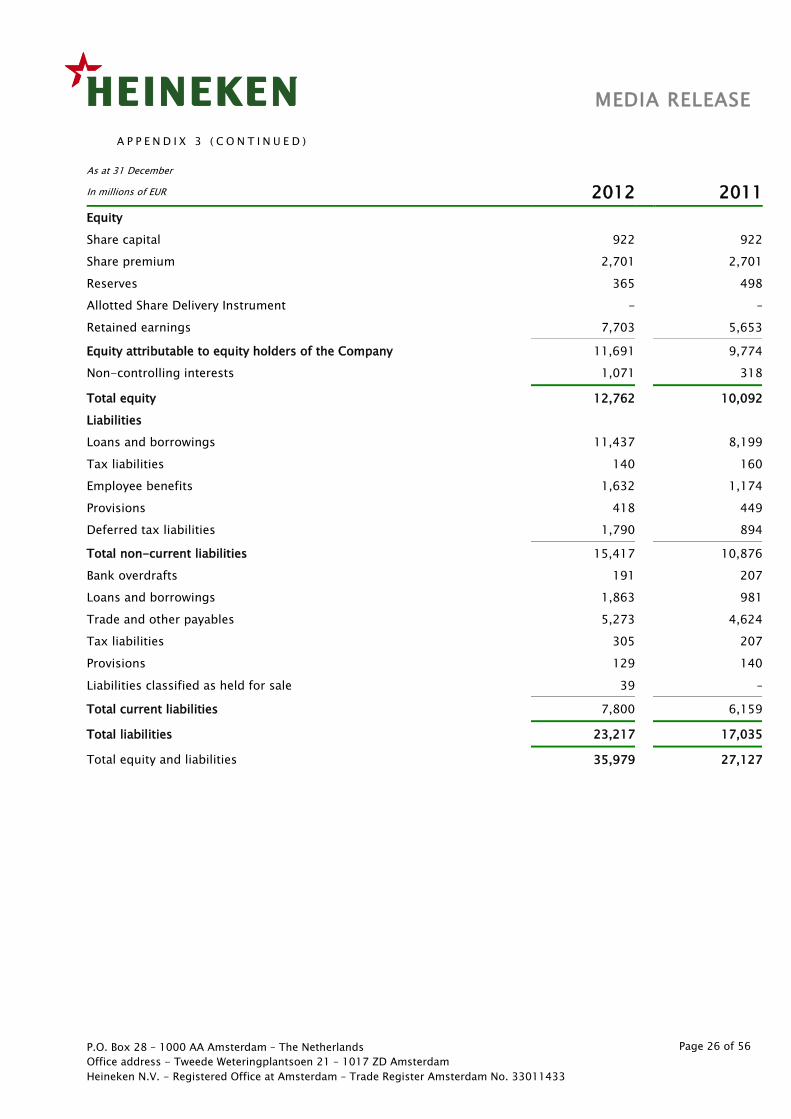
A P P E N D I X 3 ( C O N T I N U E D )
As at 31 December
In millions of EUR 2012 2011
Equity
Share capital 922 922
Share premium 2,701 2,701
Reserves 365 498
Allotted Share Delivery Instrument - –
Retained earnings 7,703 5,653
Equity attributable to equity holders of the Company 11,691 9,774
Non-controlling interests 1,071 318
Total equity 12,762 10,092
Liabilities
Loans and borrowings 11,437 8,199
Tax liabilities 140 160
Employee benefits 1,632 1,174
Provisions 418 449
Deferred tax liabilities 1,790 894
Total non-current liabilities 15,417 10,876
Bank overdrafts 191 207
Loans and borrowings 1,863 981
Trade and other payables 5,273 4,624
Tax liabilities 305 207
Provisions 129 140
Liabilities classified as held for sale 39 –
Total current liabilities 7,800 6,159
Total liabilities 23,217 17,035
Total equity and liabilities 35,979 27,127
MEDIA RELEASE
P.O. Box 28 – 1000 AA Amsterdam – The Netherlands
Office address - Tweede Weteringplantsoen 21 – 1017 ZD Amsterdam
Heineken N.V. - Registered Office at Amsterdam – Trade Register Amsterdam No. 33011433
Page 27 of 56
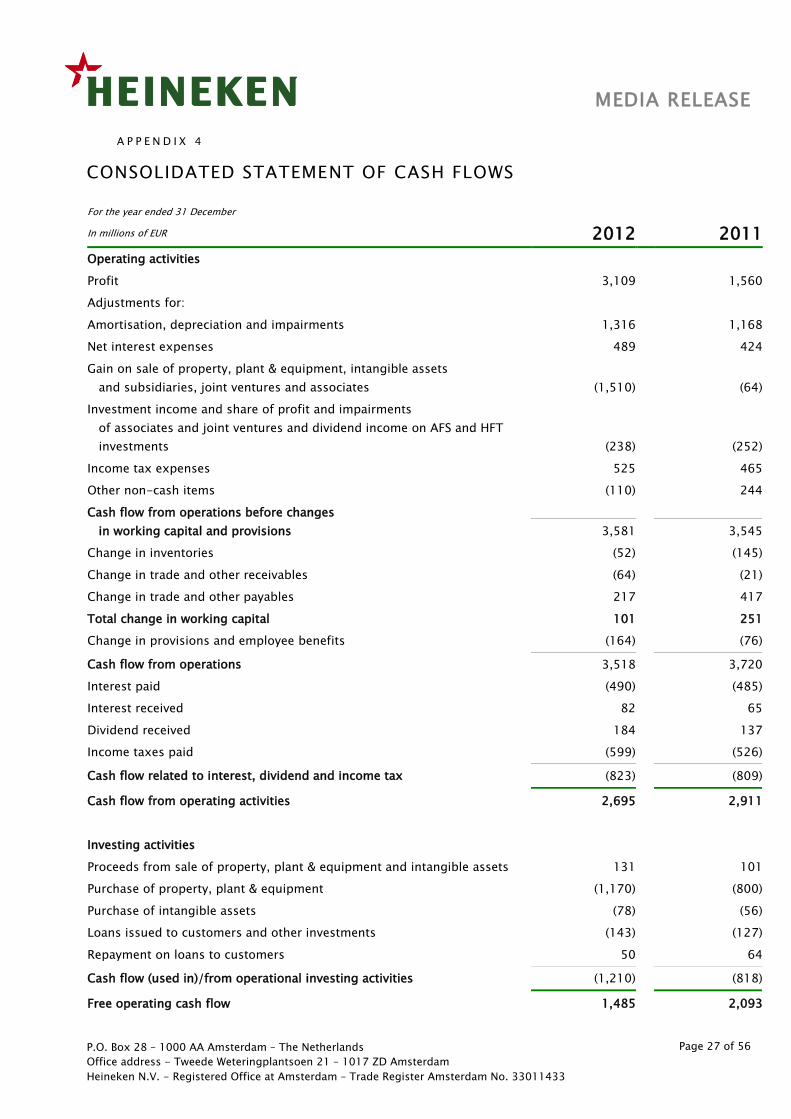
A P P E N D I X 4
CONSOLIDATED STATEMENT OF CASH FLOWS
For the year ended 31 December
In millions of EUR 2012
2011
Operating activities
Profit 3,109 1,560
Adjustments for:
Amortisation, depreciation and impairments 1,316 1,168
Net interest expenses 489 424
Gain on sale of property, plant & equipment, intangible assets
and subsidiaries, joint ventures and associates (1,510)
(64)
Investment income and share of profit and impairments
of associates and joint ventures and dividend income on AFS and HFT
investments (238)
(252)
Income tax expenses 525 465
Other non-cash items (110) 244
Cash flow from operations before changes
in working capital and provisions 3,581
3,545
Change in inventories (52) (145)
Change in trade and other receivables (64) (21)
Change in trade and other payables 217 417
Total change in working capital 101 251
Change in provisions and employee benefits (164) (76)
Cash flow from operations 3,518 3,720
Interest paid (490) (485)
Interest received 82 65
Dividend received 184 137
Income taxes paid (599) (526)
Cash flow related to interest, dividend and income tax (823) (809)
Cash flow from operating activities 2,695 2,911
Investing activities
Proceeds from sale of property, plant & equipment and intangible assets 131 101
Purchase of property, plant & equipment (1,170) (800)
Purchase of intangible assets (78) (56)
Loans issued to customers and other investments (143) (127)
Repayment on loans to customers 50 64
Cash flow (used in)/from operational investing activities (1,210) (818)
Free operating cash flow 1,485 2,093
MEDIA RELEASE
P.O. Box 28 – 1000 AA Amsterdam – The Netherlands
Office address - Tweede Weteringplantsoen 21 – 1017 ZD Amsterdam
Heineken N.V. - Registered Office at Amsterdam – Trade Register Amsterdam No. 33011433
Page 28 of 56
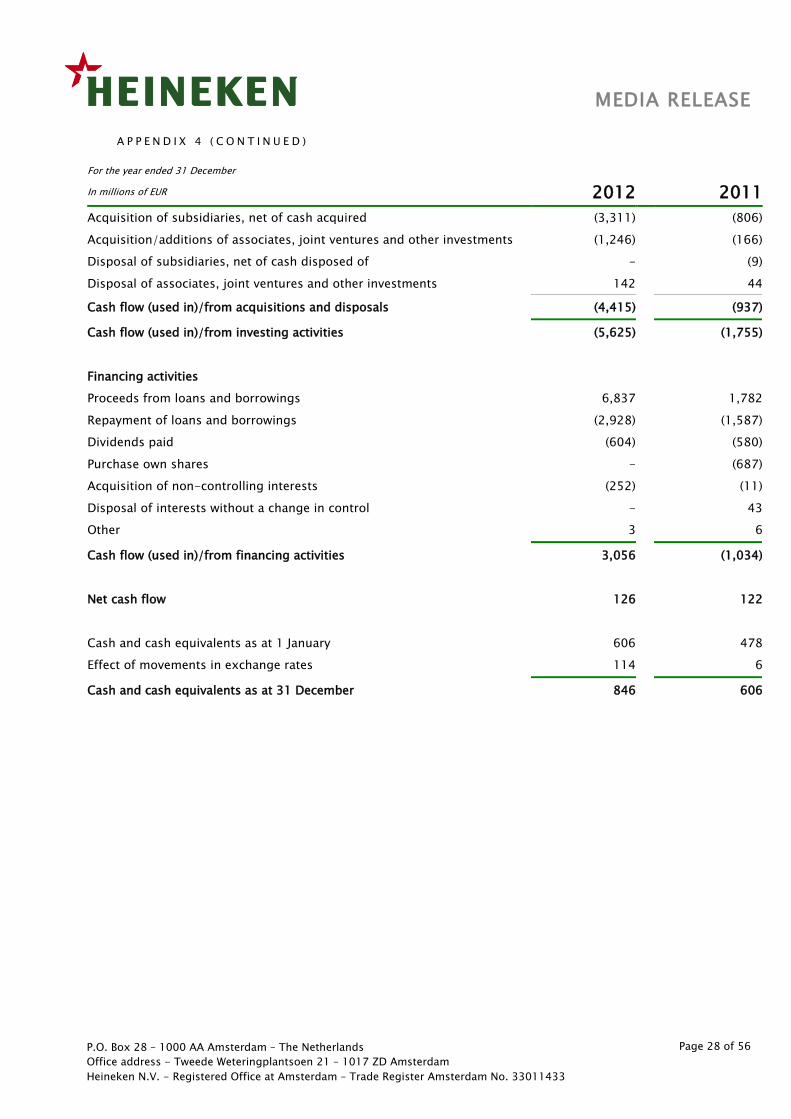
A P P E N D I X 4 ( C O N T I N U E D )
For the year ended 31 December
In millions of EUR 2012
2011
Acquisition of subsidiaries, net of cash acquired (3,311) (806)
Acquisition/additions of associates, joint ventures and other investments (1,246) (166)
Disposal of subsidiaries, net of cash disposed of - (9)
Disposal of associates, joint ventures and other investments 142 44
Cash flow (used in)/from acquisitions and disposals (4,415) (937)
Cash flow (used in)/from investing activities (5,625) (1,755)
Financing activities
Proceeds from loans and borrowings 6,837 1,782
Repayment of loans and borrowings (2,928) (1,587)
Dividends paid (604) (580)
Purchase own shares - (687)
Acquisition of non-controlling interests (252) (11)
Disposal of interests without a change in control - 43
Other 3 6
Cash flow (used in)/from financing activities 3,056 (1,034)
Net cash flow 126 122
Cash and cash equivalents as at 1 January 606 478
Effect of movements in exchange rates 114 6
Cash and cash equivalents as at 31 December 846 606
MEDIA RELEASE
P.O. Box 28 – 1000 AA Amsterdam – The Netherlands
Office address - Tweede Weteringplantsoen 21 – 1017 ZD Amsterdam
Heineken N.V. - Registered Office at Amsterdam – Trade Register Amsterdam No. 33011433
Page 29 of 56
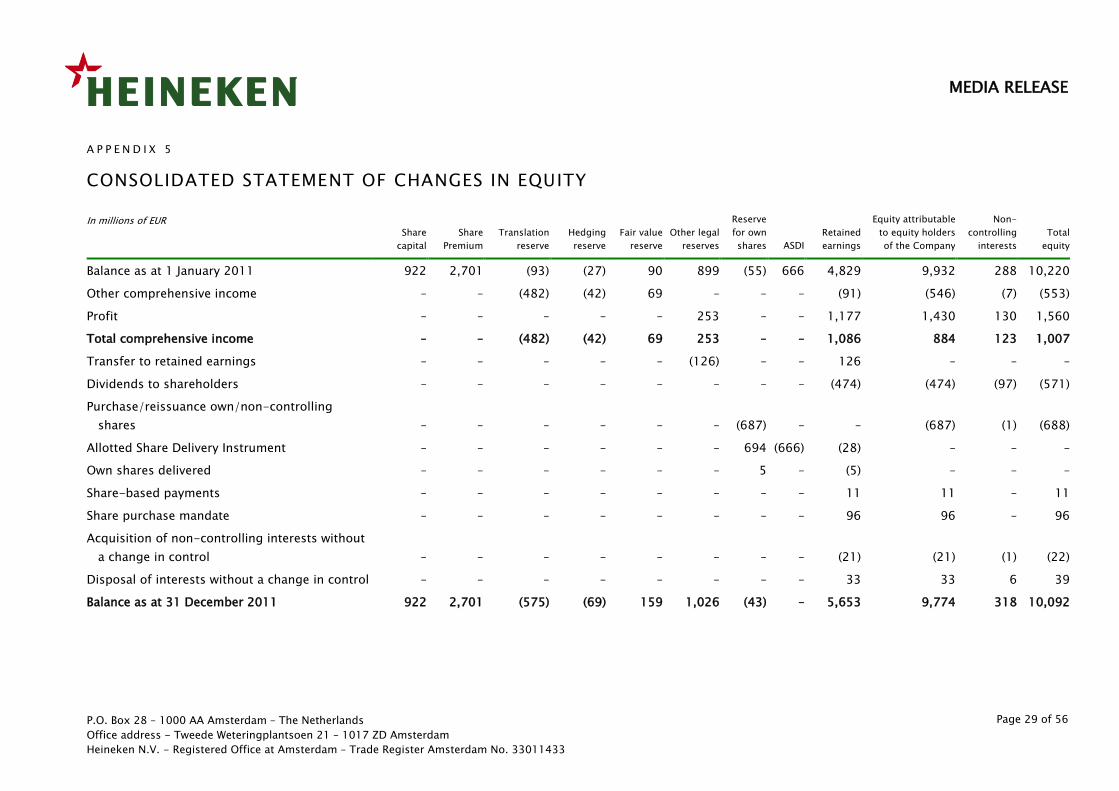
A P P E N D I X 5
CONSOLIDATED STATEMENT OF CHANGES IN EQUITY
In millions of EUR Share
capital
Share
Premium
Translation
reserve
Hedging
reserve
Fair value
reserve
Other legal
reserves
Reserve
for own
shares ASDI
Retained
earnings
Equity attributable
to equity holders
of the Company
Non-
controlling
interests
Total
equity
Balance as at 1 January 2011 922 2,701 (93) (27) 90 899 (55) 666 4,829 9,932 288 10,220
Other comprehensive income – – (482) (42) 69 – – – (91) (546) (7) (553)
Profit – – – – – 253 – – 1,177 1,430 130 1,560
Total comprehensive income – – (482) (42) 69 253 – – 1,086 884 123 1,007
Transfer to retained earnings – – – – – (126) – – 126 – – –
Dividends to shareholders – – – – – – – – (474) (474) (97) (571)
Purchase/reissuance own/non-controlling
shares – – – – – – (687) – – (687) (1) (688)
Allotted Share Delivery Instrument – – – – – – 694 (666) (28) – – –
Own shares delivered – – – – – – 5 – (5) – – –
Share-based payments – – – – – – – – 11 11 – 11
Share purchase mandate – – – – – – – – 96 96 – 96
Acquisition of non-controlling interests without
a change in control – – – – – – – – (21) (21) (1) (22)
Disposal of interests without a change in control – – – – – – – – 33 33 6 39
Balance as at 31 December 2011 922 2,701 (575) (69) 159 1,026 (43) – 5,653 9,774 318 10,092
MEDIA RELEASE
P.O. Box 28 – 1000 AA Amsterdam – The Netherlands
Office address - Tweede Weteringplantsoen 21 – 1017 ZD Amsterdam
Heineken N.V. - Registered Office at Amsterdam – Trade Register Amsterdam No. 33011433
Page 30 of 56
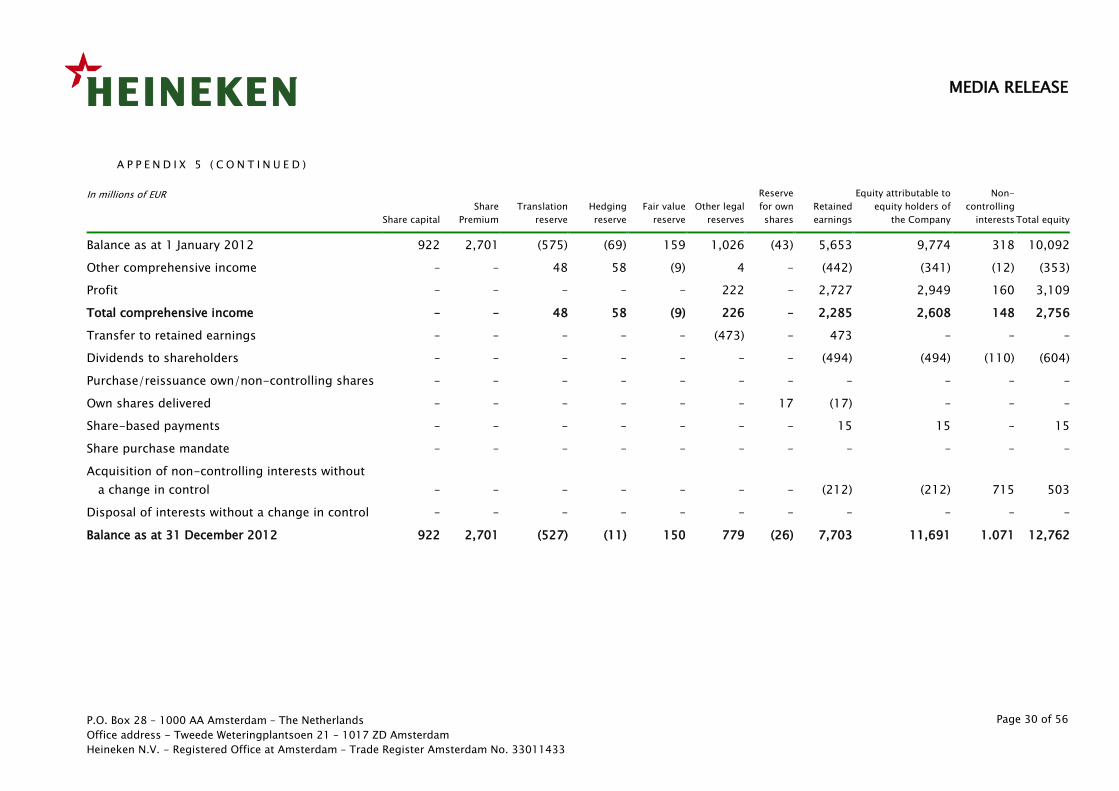
A P P E N D I X 5 ( C O N T I N U E D )
In millions of EUR
Share capital
Share
Premium
Translation
reserve
Hedging
reserve
Fair value
reserve
Other legal
reserves
Reserve
for own
shares
Retained
earnings
Equity attributable to
equity holders of
the Company
Non-
controlling
interests Total equity
Balance as at 1 January 2012 922 2,701 (575) (69) 159 1,026 (43) 5,653 9,774 318 10,092
Other comprehensive income – – 48 58 (9) 4 – (442) (341) (12) (353)
Profit – – – – – 222 – 2,727 2,949 160 3,109
Total comprehensive income – – 48 58 (9) 226 – 2,285 2,608 148 2,756
Transfer to retained earnings – – – – – (473) – 473 – – –
Dividends to shareholders – – – – – – – (494) (494) (110) (604)
Purchase/reissuance own/non-controlling shares – – – – – – – – – – –
Own shares delivered – – – – – – 17 (17) – – –
Share-based payments – – – – – – – 15 15 – 15
Share purchase mandate – – – – – – – – – – –
Acquisition of non-controlling interests without
a change in control – – – – – – – (212) (212) 715 503
Disposal of interests without a change in control – – – – – – – – – – –
Balance as at 31 December 2012 922 2,701 (527) (11) 150 779 (26) 7,703 11,691 1.071 12,762
P.O. Box 28 – 1000 AA Amsterdam – The Netherlands
Office address - Tweede Weteringplantsoen 21 – 1017 ZD Amsterdam
Heineken N.V. - Registered Office at Amsterdam – Trade Register Amsterdam No. 33011433
Page 31 of 56
Page 31 of 56
MEDIA RELEASE
A P P E N D I X 6
EARNINGS PER SHARE
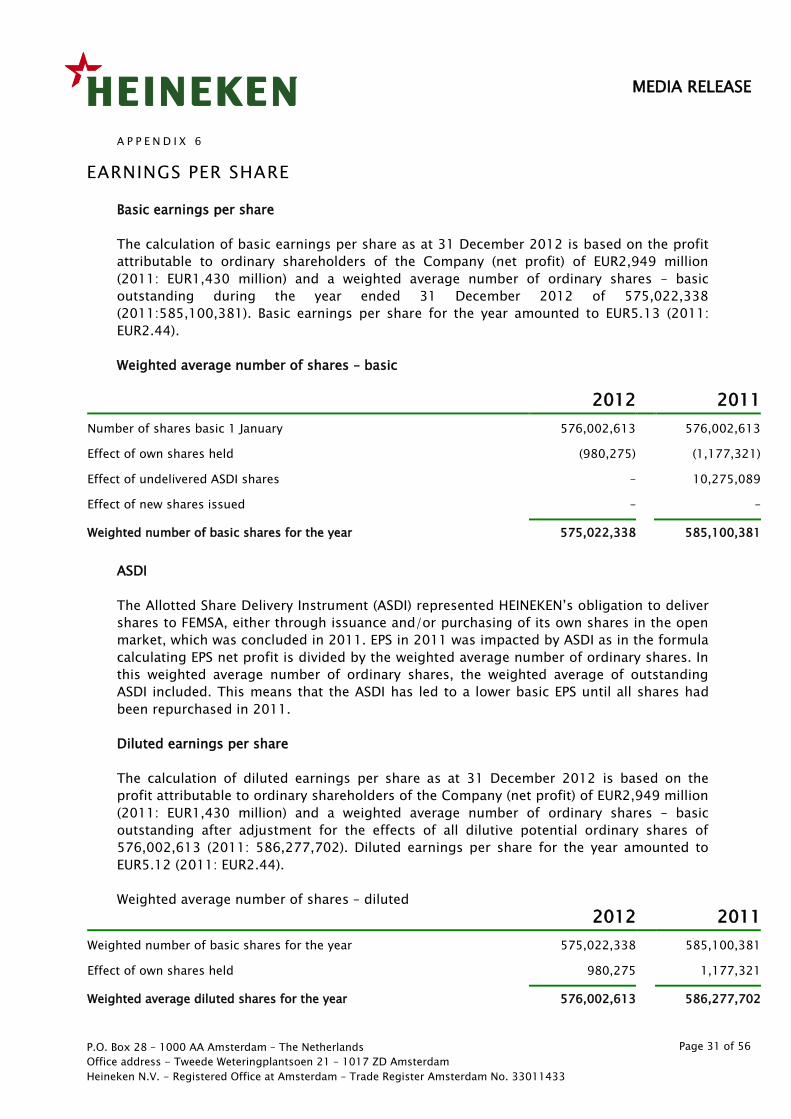
Basic earnings per share
The calculation of basic earnings per share as at 31 December 2012 is based on the profit
attributable to ordinary shareholders of the Company (net profit) of EUR2,949 million
(2011: EUR1,430 million) and a weighted average number of ordinary shares – basic
outstanding during the year ended 31 December 2012 of 575,022,338
(2011:585,100,381). Basic earnings per share for the year amounted to EUR5.13 (2011:
EUR2.44).
Weighted average number of shares – basic
2012 2011
Number of shares basic 1 January 576,002,613 576,002,613
Effect of own shares held (980,275) (1,177,321)
Effect of undelivered ASDI shares – 10,275,089
Effect of new shares issued – –
Weighted number of basic shares for the year 575,022,338 585,100,381
ASDI
The Allotted Share Delivery Instrument (ASDI) represented HEINEKEN’s obligation to deliver
shares to FEMSA, either through issuance and/or purchasing of its own shares in the open
market, which was concluded in 2011. EPS in 2011 was impacted by ASDI as in the formula
calculating EPS net profit is divided by the weighted average number of ordinary shares. In
this weighted average number of ordinary shares, the weighted average of outstanding
ASDI included. This means that the ASDI has led to a lower basic EPS until all shares had
been repurchased in 2011.
Diluted earnings per share
The calculation of diluted earnings per share as at 31 December 2012 is based on the
profit attributable to ordinary shareholders of the Company (net profit) of EUR2,949 million
(2011: EUR1,430 million) and a weighted average number of ordinary shares – basic
outstanding after adjustment for the effects of all dilutive potential ordinary shares of
576,002,613 (2011: 586,277,702). Diluted earnings per share for the year amounted to
EUR5.12 (2011: EUR2.44).
Weighted average number of shares – diluted
2012 2011
Weighted number of basic shares for the year 575,022,338 585,100,381
Effect of own shares held 980,275 1,177,321
Weighted average diluted shares for the year 576,002,613 586,277,702
P.O. Box 28 – 1000 AA Amsterdam – The Netherlands
Office address - Tweede Weteringplantsoen 21 – 1017 ZD Amsterdam
Heineken N.V. - Registered Office at Amsterdam – Trade Register Amsterdam No. 33011433
Page 32 of 56
Page 32 of 56
MEDIA RELEASE
A P P E N D I X 7
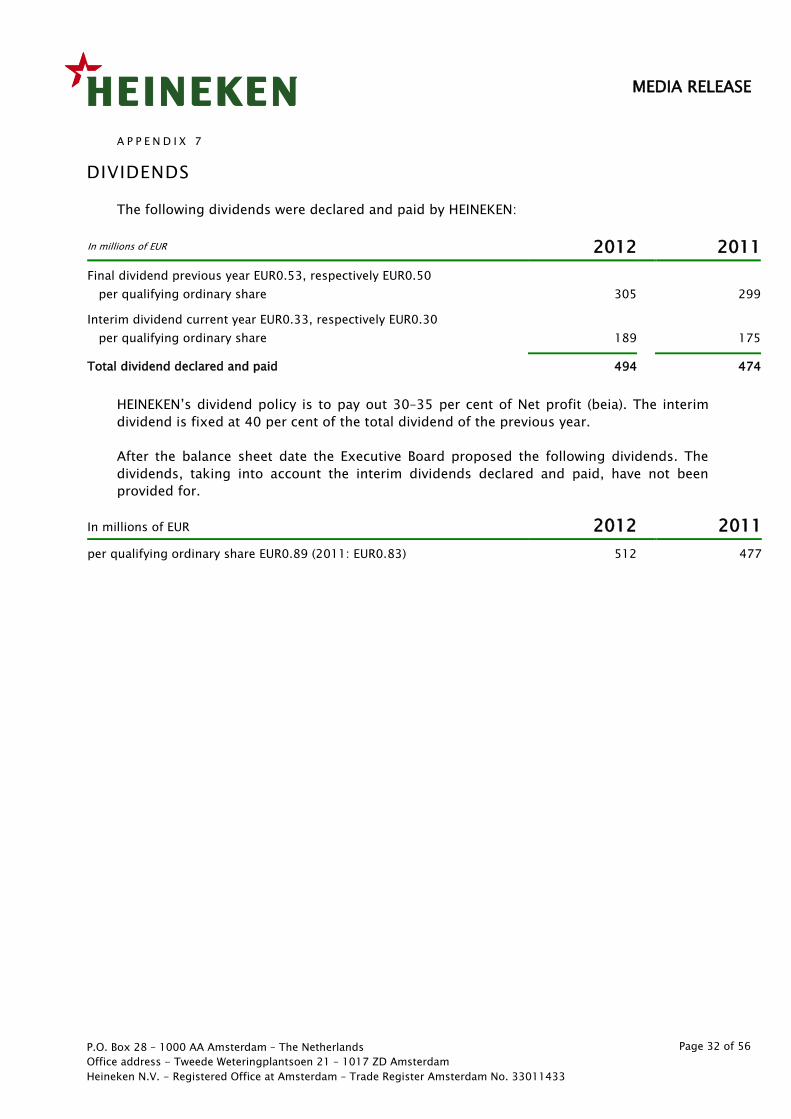
DIVIDENDS
The following dividends were declared and paid by HEINEKEN:
In millions of EUR 2012 2011
Final dividend previous year EUR0.53, respectively EUR0.50
per qualifying ordinary share 305
299
Interim dividend current year EUR0.33, respectively EUR0.30
per qualifying ordinary share 189
175
Total dividend declared and paid 494 474
HEINEKEN’s dividend policy is to pay out 30–35 per cent of Net profit (beia). The interim
dividend is fixed at 40 per cent of the total dividend of the previous year.
After the balance sheet date the Executive Board proposed the following dividends. The
dividends, taking into account the interim dividends declared and paid, have not been
provided for.
In millions of EUR 2012 2011
per qualifying ordinary share EUR0.89 (2011: EUR0.83) 512 477
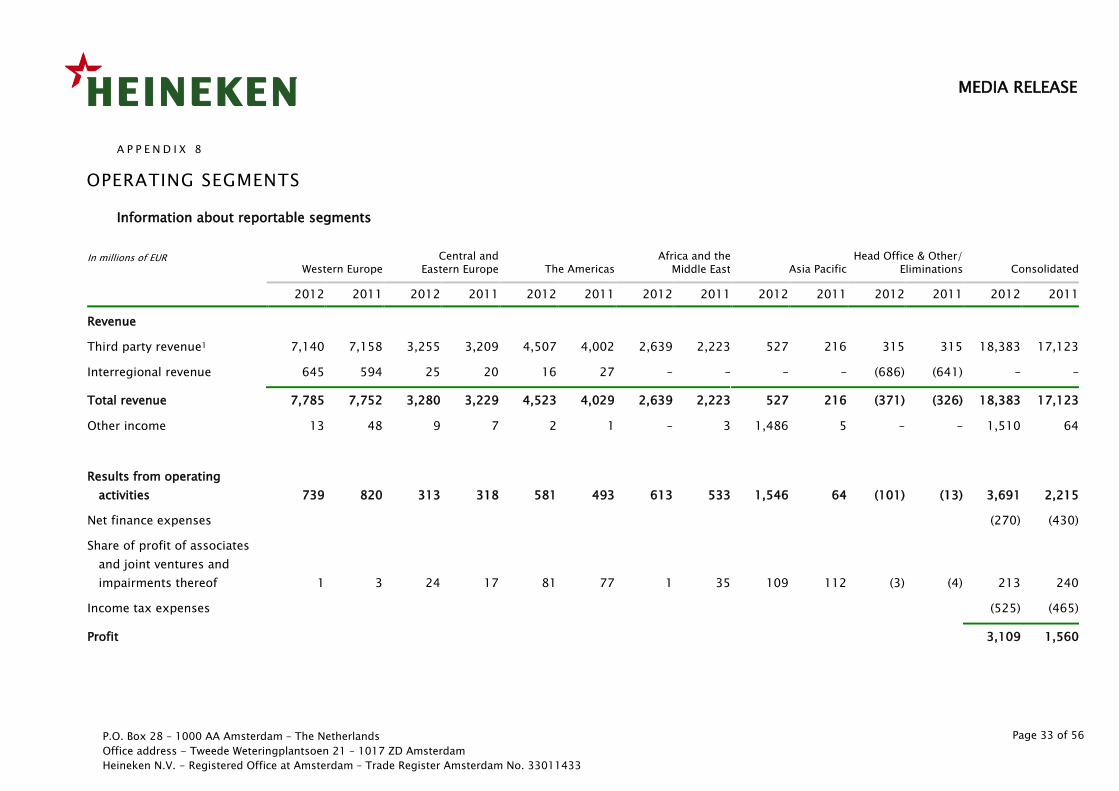
MEDIA RELEASE
P.O. Box 28 – 1000 AA Amsterdam – The Netherlands
Office address - Tweede Weteringplantsoen 21 – 1017 ZD Amsterdam
Heineken N.V. - Registered Office at Amsterdam – Trade Register Amsterdam No. 33011433
Page 33 of 56
A P P E N D I X 8
OPERATING SEGMENTS
Information about reportable segments
In millions of EUR Western Europe
Central and
Eastern Europe The Americas Africa and the
Middle East Asia Pacific Head Office & Other/
Eliminations Consolidated
2012 2011 2012 2011 2012 2011 2012 2011 2012 2011 2012 2011 2012 2011
Revenue
Third party revenue1 7,140 7,158 3,255 3,209 4,507 4,002 2,639 2,223 527 216 315 315 18,383 17,123
Interregional revenue 645 594 25 20 16 27 – – – – (686) (641) – –
Total revenue 7,785 7,752 3,280 3,229 4,523 4,029 2,639 2,223 527 216 (371) (326) 18,383 17,123
Other income 13 48 9 7 2 1 – 3 1,486 5 – – 1,510 64
Results from operating
activities 739 820 313 318 581 493 613 533 1,546 64 (101) (13) 3,691 2,215
Net finance expenses (270) (430)
Share of profit of associates
and joint ventures and
impairments thereof 1 3 24 17 81 77 1 35 109 112 (3) (4) 213 240
Income tax expenses (525) (465)
Profit 3,109 1,560
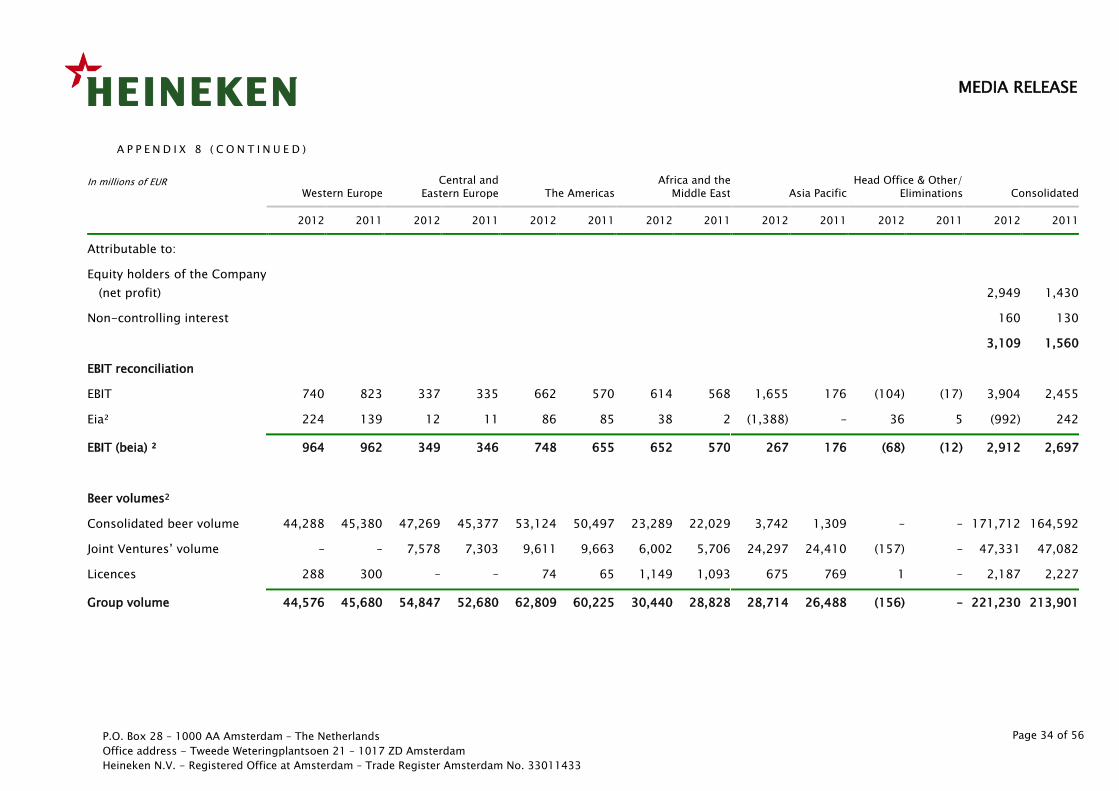
MEDIA RELEASE
P.O. Box 28 – 1000 AA Amsterdam – The Netherlands
Office address - Tweede Weteringplantsoen 21 – 1017 ZD Amsterdam
Heineken N.V. - Registered Office at Amsterdam – Trade Register Amsterdam No. 33011433
Page 34 of 56
A P P E N D I X 8 ( C O N T I N U E D )
In millions of EUR Western Europe
Central and
Eastern Europe The Americas Africa and the
Middle East Asia Pacific Head Office & Other/
Eliminations Consolidated
2012 2011 2012 2011 2012 2011 2012 2011 2012 2011 2012 2011 2012 2011
Attributable to:
Equity holders of the Company
(net profit) 2,949 1,430
Non-controlling interest 160 130
3,109 1,560
EBIT reconciliation
EBIT 740 823 337 335 662 570 614 568 1,655 176 (104) (17) 3,904 2,455
Eia² 224 139 12 11 86 85 38 2 (1,388) – 36 5 (992) 242
EBIT (beia) ² 964 962 349 346 748 655 652 570 267 176 (68) (12) 2,912 2,697
Beer volumes2
Consolidated beer volume 44,288 45,380 47,269 45,377 53,124 50,497 23,289 22,029 3,742 1,309 – – 171,712 164,592
Joint Ventures’ volume – – 7,578 7,303 9,611 9,663 6,002 5,706 24,297 24,410 (157) – 47,331 47,082
Licences 288 300 – – 74 65 1,149 1,093 675 769 1 – 2,187 2,227
Group volume 44,576 45,680 54,847 52,680 62,809 60,225 30,440 28,828 28,714 26,488 (156) – 221,230 213,901
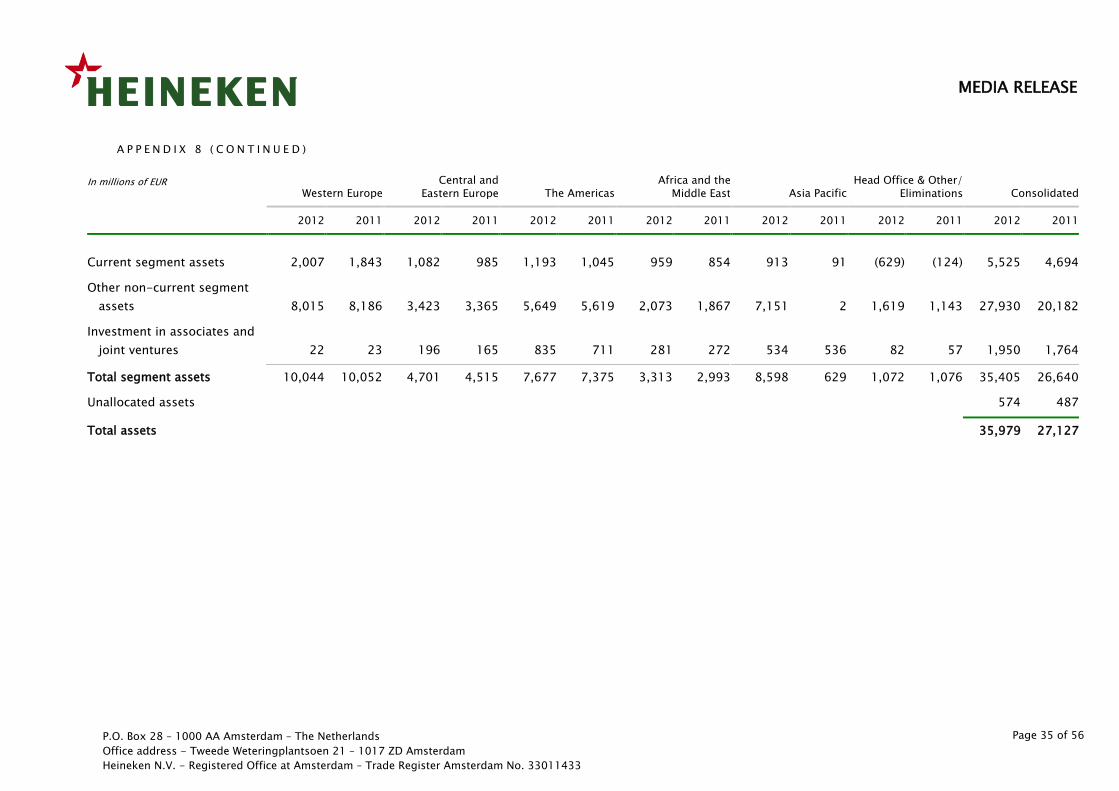
MEDIA RELEASE
P.O. Box 28 – 1000 AA Amsterdam – The Netherlands
Office address - Tweede Weteringplantsoen 21 – 1017 ZD Amsterdam
Heineken N.V. - Registered Office at Amsterdam – Trade Register Amsterdam No. 33011433
Page 35 of 56
A P P E N D I X 8 ( C O N T I N U E D )
In millions of EUR Western Europe
Central and
Eastern Europe The Americas Africa and the
Middle East Asia Pacific Head Office & Other/
Eliminations Consolidated
2012 2011 2012 2011 2012 2011 2012 2011 2012 2011 2012 2011 2012 2011
Current segment assets 2,007 1,843 1,082 985 1,193 1,045 959 854 913 91 (629) (124) 5,525 4,694
Other non-current segment
assets 8,015 8,186 3,423 3,365 5,649 5,619 2,073 1,867 7,151 2 1,619 1,143 27,930 20,182
Investment in associates and
joint ventures 22 23 196 165 835 711 281 272 534 536 82 57 1,950 1,764
Total segment assets 10,044 10,052 4,701 4,515 7,677 7,375 3,313 2,993 8,598 629 1,072 1,076 35,405 26,640
Unallocated assets 574 487
Total assets 35,979 27,127
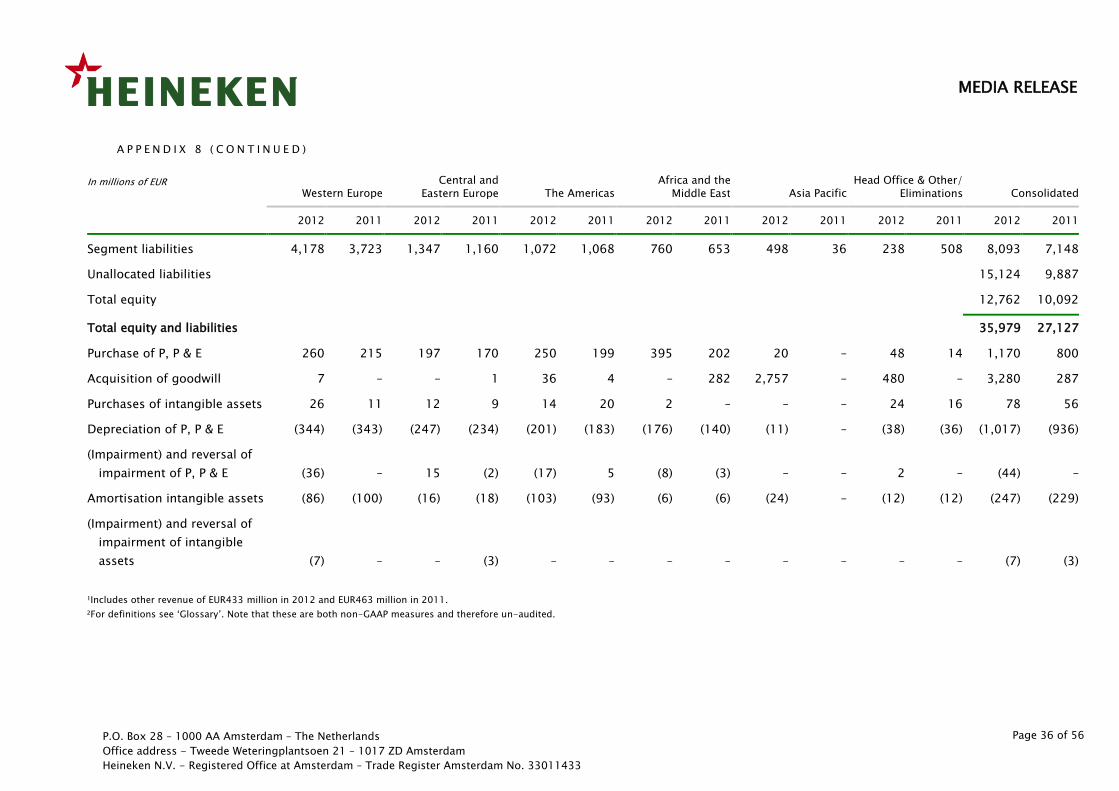
MEDIA RELEASE
P.O. Box 28 – 1000 AA Amsterdam – The Netherlands
Office address - Tweede Weteringplantsoen 21 – 1017 ZD Amsterdam
Heineken N.V. - Registered Office at Amsterdam – Trade Register Amsterdam No. 33011433
Page 36 of 56
A P P E N D I X 8 ( C O N T I N U E D )
In millions of EUR Western Europe
Central and
Eastern Europe The Americas Africa and the
Middle East Asia Pacific Head Office & Other/
Eliminations Consolidated
2012 2011 2012 2011 2012 2011 2012 2011 2012 2011 2012 2011 2012 2011
Segment liabilities 4,178 3,723 1,347 1,160 1,072 1,068 760 653 498 36 238 508 8,093 7,148
Unallocated liabilities 15,124 9,887
Total equity 12,762 10,092
Total equity and liabilities 35,979 27,127
Purchase of P, P & E 260 215 197 170 250 199 395 202 20 – 48 14 1,170 800
Acquisition of goodwill 7 – – 1 36 4 – 282 2,757 – 480 – 3,280 287
Purchases of intangible assets 26 11 12 9 14 20 2 – – – 24 16 78 56
Depreciation of P, P & E (344) (343) (247) (234) (201) (183) (176) (140) (11) – (38) (36) (1,017) (936)
(Impairment) and reversal of
impairment of P, P & E (36) – 15 (2) (17) 5 (8) (3) – – 2 – (44) –
Amortisation intangible assets (86) (100) (16) (18) (103) (93) (6) (6) (24) – (12) (12) (247) (229)
(Impairment) and reversal of
impairment of intangible
assets (7) – – (3) – – – – – – – – (7) (3)
¹Includes other revenue of EUR433 million in 2012 and EUR463 million in 2011.
²For definitions see ‘Glossary’. Note that these are both non-GAAP measures and therefore un-audited.
P.O. Box 28 – 1000 AA Amsterdam – The Netherlands
Office address - Tweede Weteringplantsoen 21 – 1017 ZD Amsterdam
Heineken N.V. - Registered Office at Amsterdam – Trade Register Amsterdam No. 33011433
Page 37 of 56
MEDIA RELEASE
A P P E N D I X 9
ACQUISITIONS AND DISPOSALS OF SUBSIDIARIES AND
NON-CONTROLLING INTERESTS
Acquisition of the beer operations in Asia Pacific Breweries
On 17 August 2012, HEINEKEN announced that, through its wholly owned subsidiary
Heineken International B.V., it had signed the definitive agreements with Fraser & Neave,
Limited (‘F&N’) regarding the acquisition of control of Asia Pacific Investment Pte. Ltd
(‘APIPL’) and Asia Pacific Breweries Ltd. (‘APB’) and their subsidiaries (together referred to
as the ‘Acquired Businesses’, the ‘Transaction’ or ‘APIPL/APB acquisition’). For this
Transaction, HEINEKEN agreed to pay SGD53.00 per share for F&N’s entire (direct and
indirect) 39.7 per cent effective stake in APB for a total consideration of EUR3,480 million
and a total consideration of EUR104 million for F&N’s interest in the non-APB assets held
by APIPL. The Transaction has been approved by F&N’s Extraordinary General Meeting on
28 September 2012 and was completed, after regulatory approvals, on 15 November 2012.
Between 17 August 2012 and 15 November 2012, HEINEKEN purchased an additional 13.7
per cent stake in APB (including an 8.6 per cent stake it acquired from Kindest Place Group
Limited on 24 September 2012) for a total consideration of EUR1,194 million.
Prior to the Acquisition, HEINEKEN owned a 50 per cent stake in APIPL, a combined direct
and indirect stake in APB of 55.6 per cent as well as a direct stake in PT Multi Bintang of
6.78 per cent. Together these stakes are referred to as the Previously Held Equity Interests
(‘PHEI’). Prior to the acquisition HEINEKEN did not have control over APB as 64.8 per cent of
the shares were held by APIPL, the joint venture between F&N and HEINEKEN. In accordance
with IFRS, the PHEI in the Acquired Businesses is accounted for at fair value at the date of
acquisition and amounts to EUR2,975 million. The fair value of the PHEI has been
determined using valuation techniques, based on the Acquired Businesses’ equity value
and the undisturbed share price. HEINEKEN’s carrying amount consists of the book value of
the original investment as well as the price paid for shares bought up to 15 November
2012. The fair value compared to HEINEKEN’s carrying amount results in a non-cash
exceptional gain of EUR1,486 million, recognised in Other Income.
After completion of the Transaction, HEINEKEN, in aggregate, owns a 95.3 per cent stake in
APB, wholly owns APIPL and also has a combined direct and indirect stake of 83.6 per cent
in PT Multi Bintang. From 15 November 2012 onwards these entities are consolidated by
HEINEKEN.
On 15 November 2012, HEINEKEN announced a Mandatory General Offer (‘MGO’) for all
shares of APB that HEINEKEN does not already own (i.e. the remaining 4.7 per cent APB
free-float shares), in accordance with the Singapore Code on Take-overs and Mergers.
HEINEKEN expects to delist APB around 18 February 2013. The total consideration for all
remaining shares will be EUR398 million.
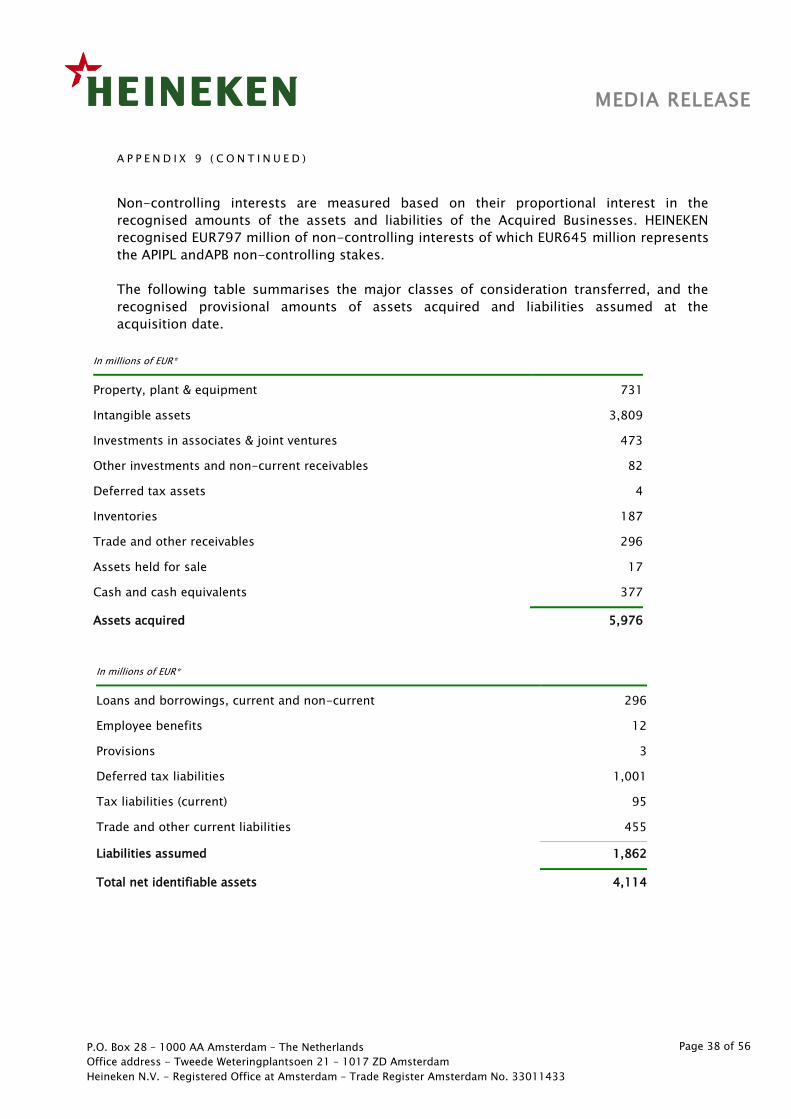
P.O. Box 28 – 1000 AA Amsterdam – The Netherlands
Office address - Tweede Weteringplantsoen 21 – 1017 ZD Amsterdam
Heineken N.V. - Registered Office at Amsterdam – Trade Register Amsterdam No. 33011433
Page 38 of 56
MEDIA RELEASE
A P P E N D I X 9 ( C O N T I N U E D )
Non-controlling interests are measured based on their proportional interest in the
recognised amounts of the assets and liabilities of the Acquired Businesses. HEINEKEN
recognised EUR797 million of non-controlling interests of which EUR645 million represents
the APIPL andAPB non-controlling stakes.
The following table summarises the major classes of consideration transferred, and the
recognised provisional amounts of assets acquired and liabilities assumed at the
acquisition date.
In millions of EUR*
Property, plant & equipment 731
Intangible assets 3,809
Investments in associates & joint ventures 473
Other investments and non-current receivables 82
Deferred tax assets 4
Inventories 187
Trade and other receivables 296
Assets held for sale 17
Cash and cash equivalents 377
Assets acquired 5,976
In millions of EUR*
Loans and borrowings, current and non-current 296
Employee benefits 12
Provisions 3
Deferred tax liabilities 1,001
Tax liabilities (current) 95
Trade and other current liabilities 455
Liabilities assumed 1,862
Total net identifiable assets 4,114
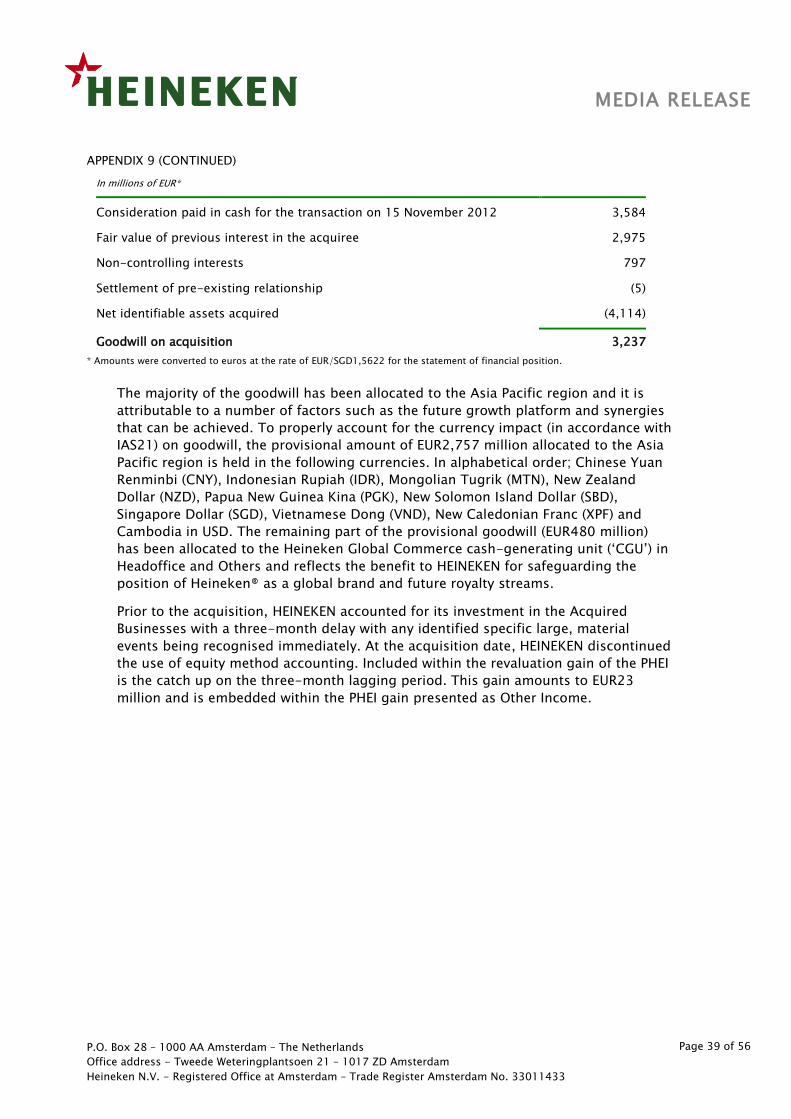
P.O. Box 28 – 1000 AA Amsterdam – The Netherlands
Office address - Tweede Weteringplantsoen 21 – 1017 ZD Amsterdam
Heineken N.V. - Registered Office at Amsterdam – Trade Register Amsterdam No. 33011433
Page 39 of 56
MEDIA RELEASE
APPENDIX 9 (CONTINUED)
In millions of EUR*
Consideration paid in cash for the transaction on 15 November 2012 3,584
Fair value of previous interest in the acquiree 2,975
Non-controlling interests 797
Settlement of pre-existing relationship (5)
Net identifiable assets acquired (4,114)
Goodwill on acquisition 3,237
* Amounts were converted to euros at the rate of EUR/SGD1,5622 for the statement of financial position.
The majority of the goodwill has been allocated to the Asia Pacific region and it is
attributable to a number of factors such as the future growth platform and synergies
that can be achieved. To properly account for the currency impact (in accordance with
IAS21) on goodwill, the provisional amount of EUR2,757 million allocated to the Asia
Pacific region is held in the following currencies. In alphabetical order; Chinese Yuan
Renminbi (CNY), Indonesian Rupiah (IDR), Mongolian Tugrik (MTN), New Zealand
Dollar (NZD), Papua New Guinea Kina (PGK), New Solomon Island Dollar (SBD),
Singapore Dollar (SGD), Vietnamese Dong (VND), New Caledonian Franc (XPF) and
Cambodia in USD. The remaining part of the provisional goodwill (EUR480 million)
has been allocated to the Heineken Global Commerce cash-generating unit (‘CGU’) in
Headoffice and Others and reflects the benefit to HEINEKEN for safeguarding the
position of Heineken® as a global brand and future royalty streams.
Prior to the acquisition, HEINEKEN accounted for its investment in the Acquired
Businesses with a three-month delay with any identified specific large, material
events being recognised immediately. At the acquisition date, HEINEKEN discontinued
the use of equity method accounting. Included within the revaluation gain of the PHEI
is the catch up on the three-month lagging period. This gain amounts to EUR23
million and is embedded within the PHEI gain presented as Other Income.
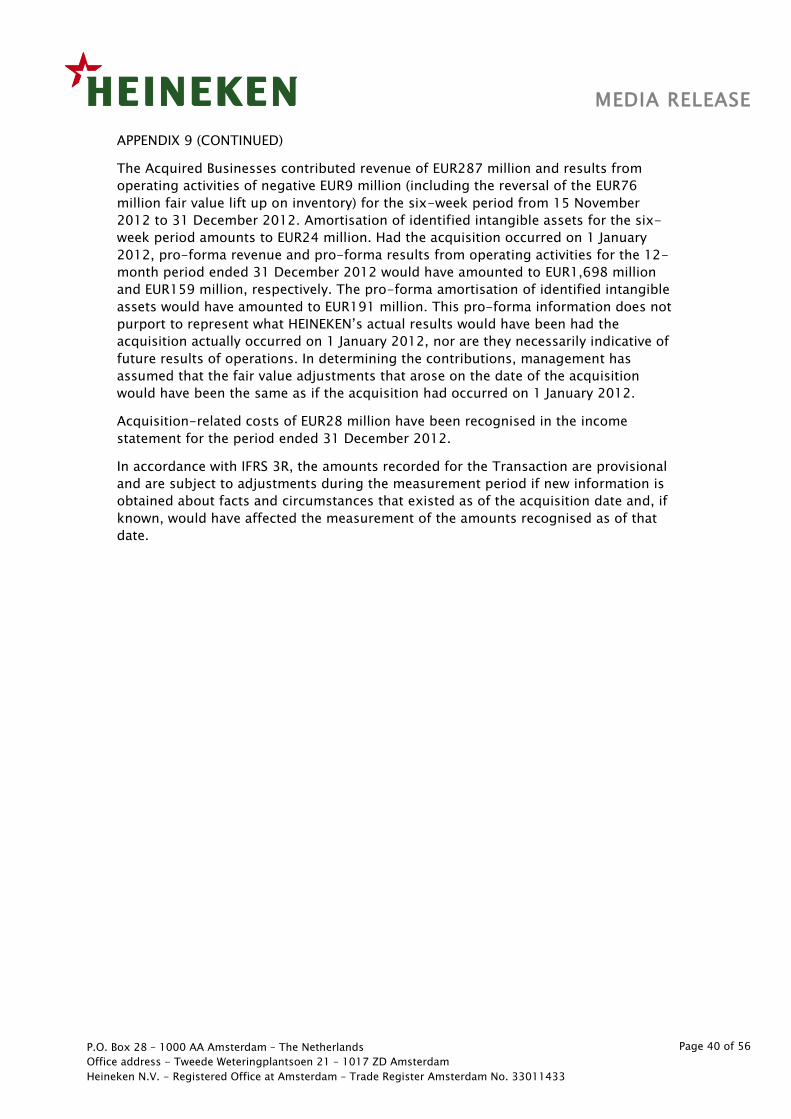
P.O. Box 28 – 1000 AA Amsterdam – The Netherlands
Office address - Tweede Weteringplantsoen 21 – 1017 ZD Amsterdam
Heineken N.V. - Registered Office at Amsterdam – Trade Register Amsterdam No. 33011433
Page 40 of 56
MEDIA RELEASE
APPENDIX 9 (CONTINUED)
The Acquired Businesses contributed revenue of EUR287 million and results from
operating activities of negative EUR9 million (including the reversal of the EUR76
million fair value lift up on inventory) for the six-week period from 15 November
2012 to 31 December 2012. Amortisation of identified intangible assets for the six-
week period amounts to EUR24 million. Had the acquisition occurred on 1 January
2012, pro-forma revenue and pro-forma results from operating activities for the 12-
month period ended 31 December 2012 would have amounted to EUR1,698 million
and EUR159 million, respectively. The pro-forma amortisation of identified intangible
assets would have amounted to EUR191 million. This pro-forma information does not
purport to represent what HEINEKEN’s actual results would have been had the
acquisition actually occurred on 1 January 2012, nor are they necessarily indicative of
future results of operations. In determining the contributions, management has
assumed that the fair value adjustments that arose on the date of the acquisition
would have been the same as if the acquisition had occurred on 1 January 2012.
Acquisition-related costs of EUR28 million have been recognised in the income
statement for the period ended 31 December 2012.
In accordance with IFRS 3R, the amounts recorded for the Transaction are provisional
and are subject to adjustments during the measurement period if new information is
obtained about facts and circumstances that existed as of the acquisition date and, if
known, would have affected the measurement of the amounts recognised as of that
date.
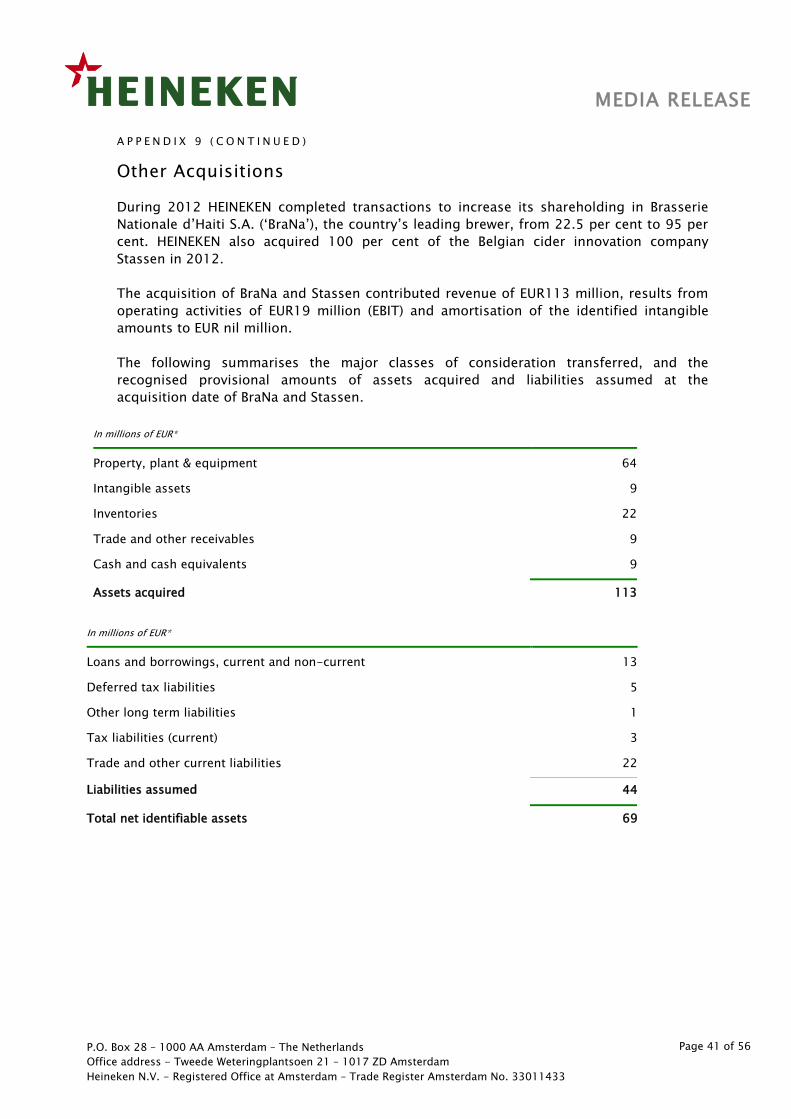
P.O. Box 28 – 1000 AA Amsterdam – The Netherlands
Office address - Tweede Weteringplantsoen 21 – 1017 ZD Amsterdam
Heineken N.V. - Registered Office at Amsterdam – Trade Register Amsterdam No. 33011433
Page 41 of 56
MEDIA RELEASE
A P P E N D I X 9 ( C O N T I N U E D )
Other Acquisitions
During 2012 HEINEKEN completed transactions to increase its shareholding in Brasserie
Nationale d’Haiti S.A. (‘BraNa’), the country’s leading brewer, from 22.5 per cent to 95 per
cent. HEINEKEN also acquired 100 per cent of the Belgian cider innovation company
Stassen in 2012.
The acquisition of BraNa and Stassen contributed revenue of EUR113 million, results from
operating activities of EUR19 million (EBIT) and amortisation of the identified intangible
amounts to EUR nil million.
The following summarises the major classes of consideration transferred, and the
recognised provisional amounts of assets acquired and liabilities assumed at the
acquisition date of BraNa and Stassen.
In millions of EUR*
Property, plant & equipment 64
Intangible assets 9
Inventories 22
Trade and other receivables 9
Cash and cash equivalents 9
Assets acquired 113
In millions of EUR*
Loans and borrowings, current and non-current 13
Deferred tax liabilities 5
Other long term liabilities 1
Tax liabilities (current) 3
Trade and other current liabilities 22
Liabilities assumed 44
Total net identifiable assets 69
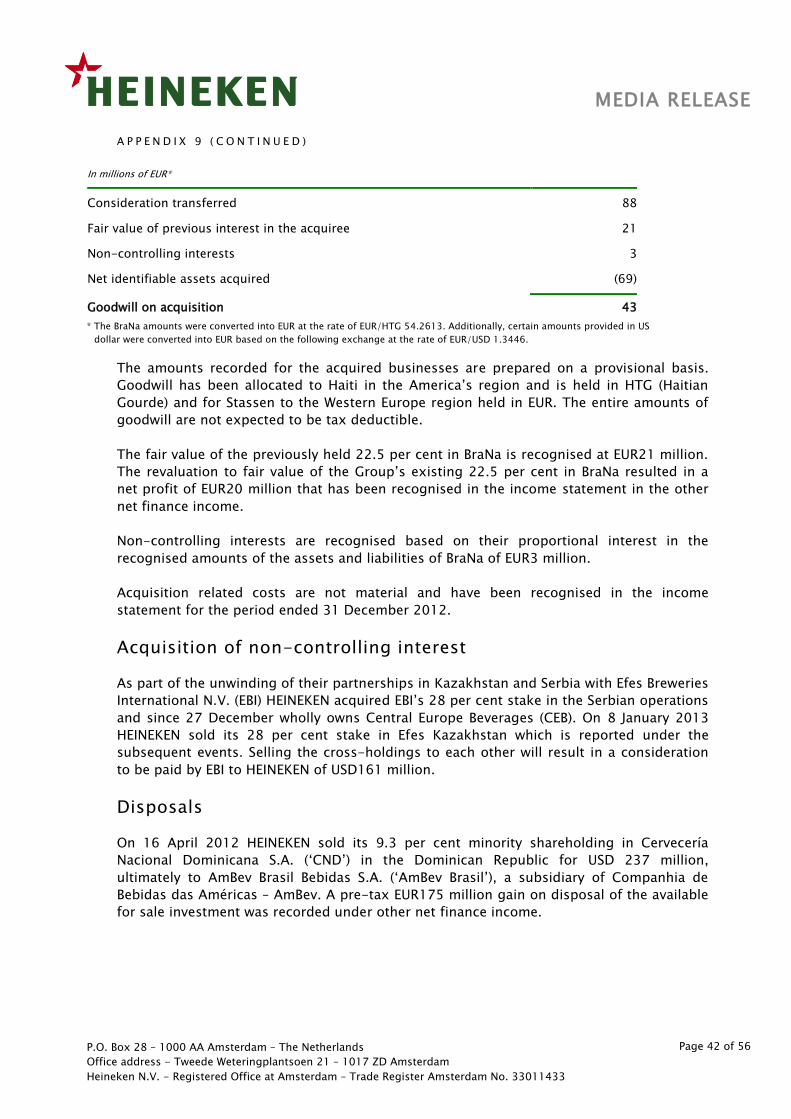
P.O. Box 28 – 1000 AA Amsterdam – The Netherlands
Office address - Tweede Weteringplantsoen 21 – 1017 ZD Amsterdam
Heineken N.V. - Registered Office at Amsterdam – Trade Register Amsterdam No. 33011433
Page 42 of 56
MEDIA RELEASE
A P P E N D I X 9 ( C O N T I N U E D )
In millions of EUR*
Consideration transferred 88
Fair value of previous interest in the acquiree 21
Non-controlling interests 3
Net identifiable assets acquired (69)
Goodwill on acquisition 43
* The BraNa amounts were converted into EUR at the rate of EUR/HTG 54.2613. Additionally, certain amounts provided in US
dollar were converted into EUR based on the following exchange at the rate of EUR/USD 1.3446.
The amounts recorded for the acquired businesses are prepared on a provisional basis.
Goodwill has been allocated to Haiti in the America’s region and is held in HTG (Haitian
Gourde) and for Stassen to the Western Europe region held in EUR. The entire amounts of
goodwill are not expected to be tax deductible.
The fair value of the previously held 22.5 per cent in BraNa is recognised at EUR21 million.
The revaluation to fair value of the Group’s existing 22.5 per cent in BraNa resulted in a
net profit of EUR20 million that has been recognised in the income statement in the other
net finance income.
Non-controlling interests are recognised based on their proportional interest in the
recognised amounts of the assets and liabilities of BraNa of EUR3 million.
Acquisition related costs are not material and have been recognised in the income
statement for the period ended 31 December 2012.
Acquisition of non-controlling interest
As part of the unwinding of their partnerships in Kazakhstan and Serbia with Efes Breweries
International N.V. (EBI) HEINEKEN acquired EBI’s 28 per cent stake in the Serbian operations
and since 27 December wholly owns Central Europe Beverages (CEB). On 8 January 2013
HEINEKEN sold its 28 per cent stake in Efes Kazakhstan which is reported under the
subsequent events. Selling the cross-holdings to each other will result in a consideration
to be paid by EBI to HEINEKEN of USD161 million.
Disposals
On 16 April 2012 HEINEKEN sold its 9.3 per cent minority shareholding in Cervecería
Nacional Dominicana S.A. (‘CND’) in the Dominican Republic for USD 237 million,
ultimately to AmBev Brasil Bebidas S.A. (‘AmBev Brasil’), a subsidiary of Companhia de
Bebidas das Américas – AmBev. A pre-tax EUR175 million gain on disposal of the available
for sale investment was recorded under other net finance income.
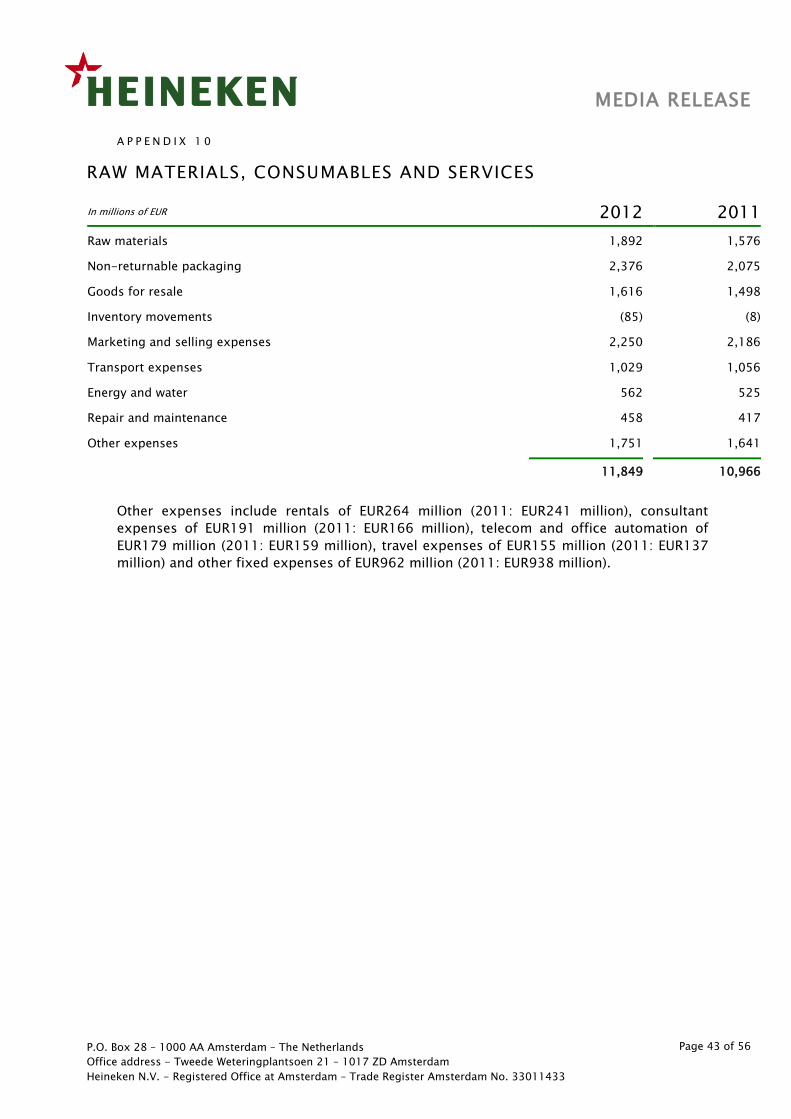
P.O. Box 28 – 1000 AA Amsterdam – The Netherlands
Office address - Tweede Weteringplantsoen 21 – 1017 ZD Amsterdam
Heineken N.V. - Registered Office at Amsterdam – Trade Register Amsterdam No. 33011433
Page 43 of 56
MEDIA RELEASE
A P P E N D I X 1 0
RAW MATERIALS, CONSUMABLES AND SERVICES
In millions of EUR 2012 2011
Raw materials 1,892 1,576
Non-returnable packaging 2,376 2,075
Goods for resale 1,616 1,498
Inventory movements (85) (8)
Marketing and selling expenses 2,250 2,186
Transport expenses 1,029 1,056
Energy and water 562 525
Repair and maintenance 458 417
Other expenses 1,751 1,641
11,849 10,966
Other expenses include rentals of EUR264 million (2011: EUR241 million), consultant
expenses of EUR191 million (2011: EUR166 million), telecom and office automation of
EUR179 million (2011: EUR159 million), travel expenses of EUR155 million (2011: EUR137
million) and other fixed expenses of EUR962 million (2011: EUR938 million).
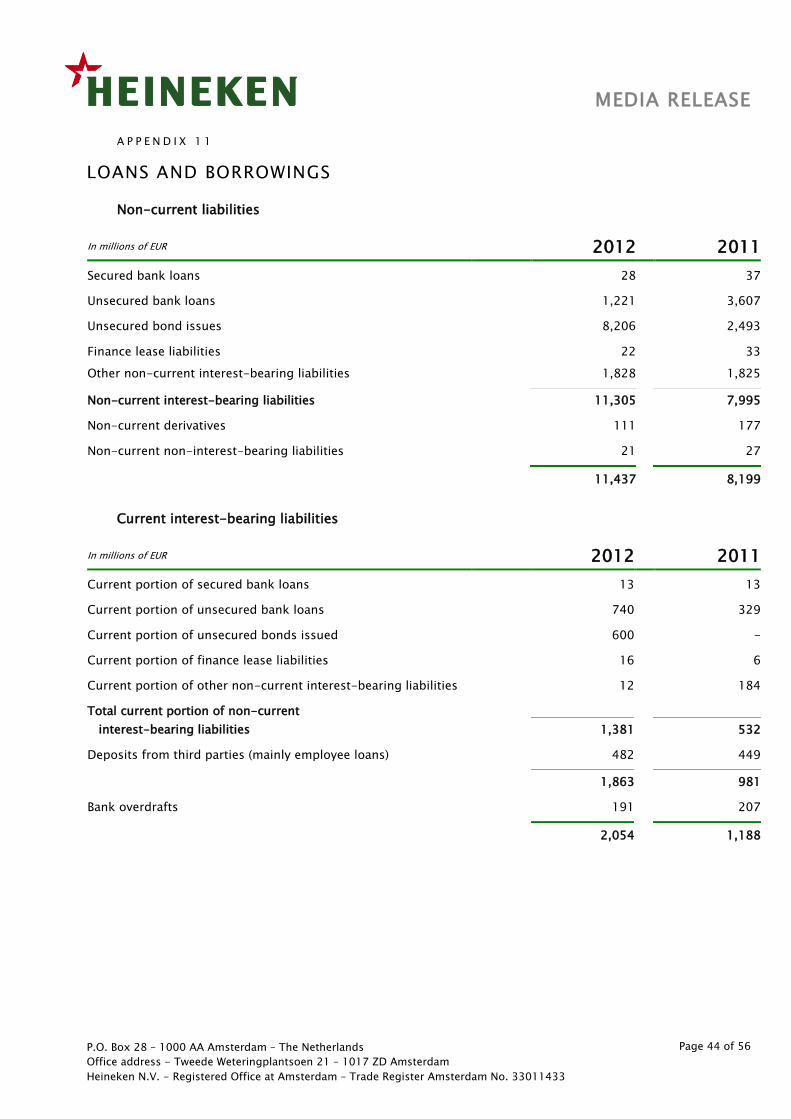
P.O. Box 28 – 1000 AA Amsterdam – The Netherlands
Office address - Tweede Weteringplantsoen 21 – 1017 ZD Amsterdam
Heineken N.V. - Registered Office at Amsterdam – Trade Register Amsterdam No. 33011433
Page 44 of 56
MEDIA RELEASE
A P P E N D I X 1 1
LOANS AND BORROWINGS
Non-current liabilities
In millions of EUR 2012 2011
Secured bank loans 28 37
Unsecured bank loans 1,221 3,607
Unsecured bond issues 8,206 2,493
Finance lease liabilities 22 33
Other non-current interest-bearing liabilities 1,828 1,825
Non-current interest-bearing liabilities 11,305 7,995
Non-current derivatives 111 177
Non-current non-interest-bearing liabilities 21 27
11,437 8,199
Current interest-bearing liabilities
In millions of EUR 2012 2011
Current portion of secured bank loans 13 13
Current portion of unsecured bank loans 740 329
Current portion of unsecured bonds issued 600 -
Current portion of finance lease liabilities 16 6
Current portion of other non-current interest-bearing liabilities 12 184
Total current portion of non-current
interest-bearing liabilities 1,381
532
Deposits from third parties (mainly employee loans) 482 449
1,863 981
Bank overdrafts 191 207
2,054 1,188
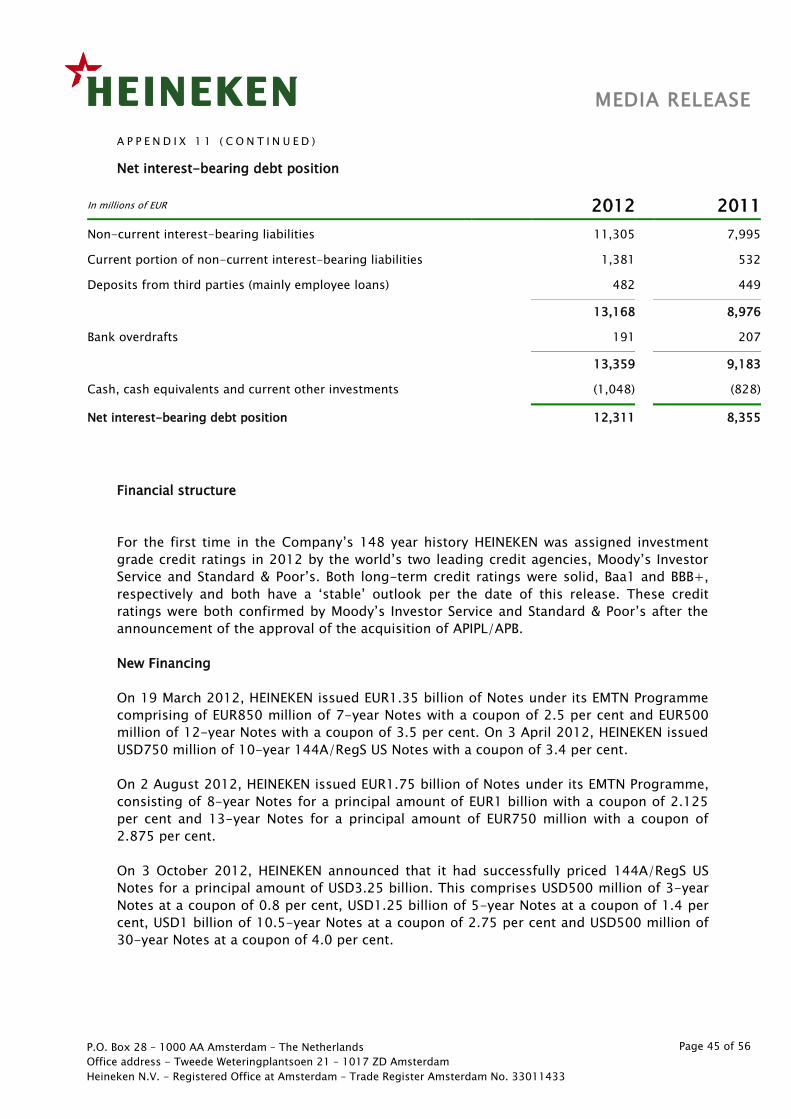
P.O. Box 28 – 1000 AA Amsterdam – The Netherlands
Office address - Tweede Weteringplantsoen 21 – 1017 ZD Amsterdam
Heineken N.V. - Registered Office at Amsterdam – Trade Register Amsterdam No. 33011433
Page 45 of 56
MEDIA RELEASE
A P P E N D I X 1 1 ( C O N T I N U E D )
Net interest-bearing debt position
In millions of EUR 2012 2011
Non-current interest-bearing liabilities 11,305 7,995
Current portion of non-current interest-bearing liabilities 1,381 532
Deposits from third parties (mainly employee loans) 482 449
13,168 8,976
Bank overdrafts 191 207
13,359 9,183
Cash, cash equivalents and current other investments (1,048) (828)
Net interest-bearing debt position 12,311 8,355
Financial structure
For the first time in the Company’s 148 year history HEINEKEN was assigned investment
grade credit ratings in 2012 by the world’s two leading credit agencies, Moody’s Investor
Service and Standard & Poor’s. Both long-term credit ratings were solid, Baa1 and BBB+,
respectively and both have a ‘stable’ outlook per the date of this release. These credit
ratings were both confirmed by Moody’s Investor Service and Standard & Poor’s after the
announcement of the approval of the acquisition of APIPL/APB.
New Financing
On 19 March 2012, HEINEKEN issued EUR1.35 billion of Notes under its EMTN Programme
comprising of EUR850 million of 7-year Notes with a coupon of 2.5 per cent and EUR500
million of 12-year Notes with a coupon of 3.5 per cent. On 3 April 2012, HEINEKEN issued
USD750 million of 10-year 144A/RegS US Notes with a coupon of 3.4 per cent.
On 2 August 2012, HEINEKEN issued EUR1.75 billion of Notes under its EMTN Programme,
consisting of 8-year Notes for a principal amount of EUR1 billion with a coupon of 2.125
per cent and 13-year Notes for a principal amount of EUR750 million with a coupon of
2.875 per cent.
On 3 October 2012, HEINEKEN announced that it had successfully priced 144A/RegS US
Notes for a principal amount of USD3.25 billion. This comprises USD500 million of 3-year
Notes at a coupon of 0.8 per cent, USD1.25 billion of 5-year Notes at a coupon of 1.4 per
cent, USD1 billion of 10.5-year Notes at a coupon of 2.75 per cent and USD500 million of
30-year Notes at a coupon of 4.0 per cent.
P.O. Box 28 – 1000 AA Amsterdam – The Netherlands
Office address - Tweede Weteringplantsoen 21 – 1017 ZD Amsterdam
Heineken N.V. - Registered Office at Amsterdam – Trade Register Amsterdam No. 33011433
Page 46 of 56
MEDIA RELEASE
APPENDIX 11 (CONTINUED)
The proceeds of the Notes have been mainly used for the financing of the acquisition of
APIPL/APB and the repayment of debt facilities. The issues have enabled HEINEKEN to
further improve the currency and maturity profile of its long-term debt.
Incurrence covenant
HEINEKEN has an incurrence covenant in some of its financing facilities. The incurrence
covenant is calculated by dividing net debt (calculated in accordance with the consolidation
method of the 2007 Annual Accounts) by EBITDA (beia) (also calculated in accordance with
the consolidation method of the 2007 Annual Accounts and including the pro-forma full-
year EBITDA of any acquisitions made in 2012). As at 31 December 2012 this ratio was 2.8
(2011: 2.1). If the ratio would be beyond a level of 3.5, the incurrence covenant would
prevent us from conducting further significant debt financed acquisitions.
P.O. Box 28 – 1000 AA Amsterdam – The Netherlands
Office address - Tweede Weteringplantsoen 21 – 1017 ZD Amsterdam
Heineken N.V. - Registered Office at Amsterdam – Trade Register Amsterdam No. 33011433
Page 47 of 56
MEDIA RELEASE
A P P E N D I X 1 2
NOTES TO THE APPENDICES
Reporting entity
Heineken N.V. (the ‘Company’) is a company domiciled in the Netherlands. The address of
the Company’s registered office is Tweede Weteringplantsoen 21, Amsterdam. The
financial information contained in this document of the Company as at and for the year
ended 31 December 2012 comprise the Company, its subsidiaries (together referred to as
‘HEINEKEN’ or the ‘Group’ and individually as ‘HEINEKEN’ entities) and HEINEKEN’s interest
in jointly controlled entities and associates.
HEINEKEN is primarily involved in the brewing and selling of beer.
Accounting Policies
The accounting policies applied by HEINEKEN in these appendices are the same as the
policies applied by HEINEKEN in the consolidated financial statements for 2011. Applied
are International Financial Reporting Standards (IFRS) adopted by the EU (i.e. only IFRS’s
that are adopted for use in the EU at the date of publication).
These appendices do not contain all the information required for a complete full-year set
of financial statements.
Outstanding shares
As at 31 December 2012 the issued share capital comprised 576,002,613 ordinary shares.
The ordinary shares have a par value of EUR1.60. All issued shares are fully paid.
Exceptional items
In the internal management reports HEINEKEN measures its performance primarily based
on EBIT and EBIT (beia), these are non-GAAP measures not calculated in accordance with
IFRS. A similar non-GAAP adjustment can be made to the IFRS profit or loss as defined in
IAS 1 paragraph 7 being the total of income less expense. Exceptional items are defined as
items of income and expense of such size, nature or incidence, that in the view of
management their disclosure is relevant to explain the performance of HEINEKEN for the
period.
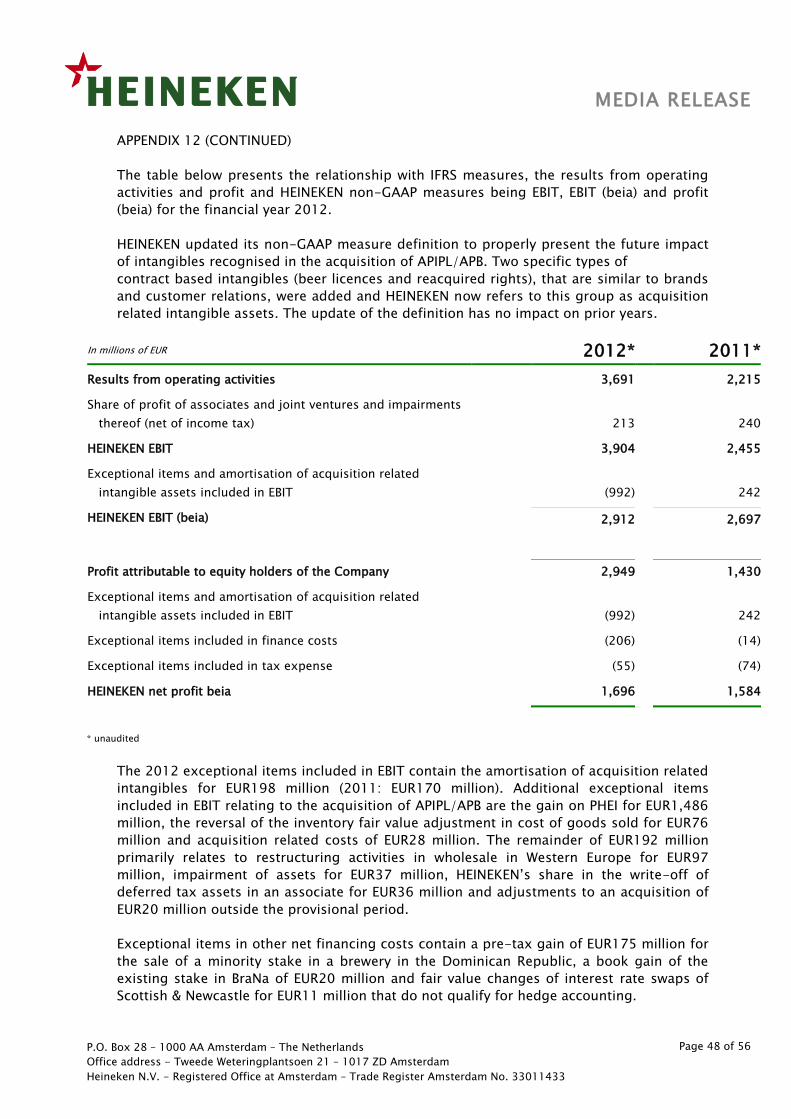
P.O. Box 28 – 1000 AA Amsterdam – The Netherlands
Office address - Tweede Weteringplantsoen 21 – 1017 ZD Amsterdam
Heineken N.V. - Registered Office at Amsterdam – Trade Register Amsterdam No. 33011433
Page 48 of 56
MEDIA RELEASE
APPENDIX 12 (CONTINUED)
The table below presents the relationship with IFRS measures, the results from operating
activities and profit and HEINEKEN non-GAAP measures being EBIT, EBIT (beia) and profit
(beia) for the financial year 2012.
HEINEKEN updated its non-GAAP measure definition to properly present the future impact
of intangibles recognised in the acquisition of APIPL/APB. Two specific types of
contract based intangibles (beer licences and reacquired rights), that are similar to brands
and customer relations, were added and HEINEKEN now refers to this group as acquisition
related intangible assets. The update of the definition has no impact on prior years.
In millions of EUR 2012* 2011*
Results from operating activities 3,691 2,215
Share of profit of associates and joint ventures and impairments
thereof (net of income tax) 213
240
HEINEKEN EBIT 3,904 2,455
Exceptional items and amortisation of acquisition related
intangible assets included in EBIT (992)
242
HEINEKEN EBIT (beia) 2,912 2,697
Profit attributable to equity holders of the Company 2,949 1,430
Exceptional items and amortisation of acquisition related
intangible assets included in EBIT (992)
242
Exceptional items included in finance costs (206) (14)
Exceptional items included in tax expense (55) (74)
HEINEKEN net profit beia 1,696 1,584
* unaudited
The 2012 exceptional items included in EBIT contain the amortisation of acquisition related
intangibles for EUR198 million (2011: EUR170 million). Additional exceptional items
included in EBIT relating to the acquisition of APIPL/APB are the gain on PHEI for EUR1,486
million, the reversal of the inventory fair value adjustment in cost of goods sold for EUR76
million and acquisition related costs of EUR28 million. The remainder of EUR192 million
primarily relates to restructuring activities in wholesale in Western Europe for EUR97
million, impairment of assets for EUR37 million, HEINEKEN’s share in the write-off of
deferred tax assets in an associate for EUR36 million and adjustments to an acquisition of
EUR20 million outside the provisional period.
Exceptional items in other net financing costs contain a pre-tax gain of EUR175 million for
the sale of a minority stake in a brewery in the Dominican Republic, a book gain of the
existing stake in BraNa of EUR20 million and fair value changes of interest rate swaps of
Scottish & Newcastle for EUR11 million that do not qualify for hedge accounting.
P.O. Box 28 – 1000 AA Amsterdam – The Netherlands
Office address - Tweede Weteringplantsoen 21 – 1017 ZD Amsterdam
Heineken N.V. - Registered Office at Amsterdam – Trade Register Amsterdam No. 33011433
Page 49 of 56
MEDIA RELEASE
APPENDIX 12 (CONTINUED)
The exceptional items in the tax expense are EUR53 million (2011: EUR47 million) related
to acquisition related intangibles and the remainder of EUR2 million represents the net
impact of other exceptional items included in EBIT and finance cost.
EBIT and EBIT (beia) are not financial measures calculated in accordance with IFRS. The
presentation on these financial measures may not be comparable to similarly titled
measures reported by other companies due to differences in the ways the measures are
calculated.
P.O. Box 28 – 1000 AA Amsterdam – The Netherlands
Office address - Tweede Weteringplantsoen 21 – 1017 ZD Amsterdam
Heineken N.V. - Registered Office at Amsterdam – Trade Register Amsterdam No. 33011433
Page 50 of 56
MEDIA RELEASE
APPENDIX 12 (CONTINUED)
Contingencies
Netherlands
On 19 December 2012 the European Court of Justice in Luxembourg confirmed the fine
imposed on HEINEKEN for their participation in a cartel on the Dutch market from 1996 to
1999. This judgement is not subject to appeal. The fine was paid in 2007 and was treated
as an expense in the 2007 Annual Report.
Brazil
As part of the acquisition of the beer operations of FEMSA, HEINEKEN also inherited
existing legal proceedings with labour unions, tax authorities and other parties of its, now
wholly-owned, subsidiaries Cervejarias Kaiser and Cervejarias Kaiser Nordeste (jointly,
Heineken Brasil). The proceedings have arisen in the ordinary course of business and are
common in the current economic and legal environment of Brazil. The proceedings have
partly been provided for. The contingent amount being claimed against Heineken Brasil
resulting from such proceedings as at 31 December 2012 is EUR663 million. Such
contingencies were classified by legal counsel as less than probable but more than remote
of being settled against Heineken Brasil. However, HEINEKEN believes that the ultimate
resolution of such legal proceedings will not have a material adverse effect on its
consolidated financial position or result of operations. HEINEKEN does not expect any
significant liability to arise from these contingencies. A significant part of the
aforementioned contingencies (EUR367 million) are tax related and qualify for
indemnification by FEMSA.
As is customary in Brazil, Heineken Brasil has been requested by the tax authorities to
collateralise tax contingencies currently in litigation amounting to EUR292 million by either
pledging fixed assets or entering into available lines of credit which cover such
contingencies.
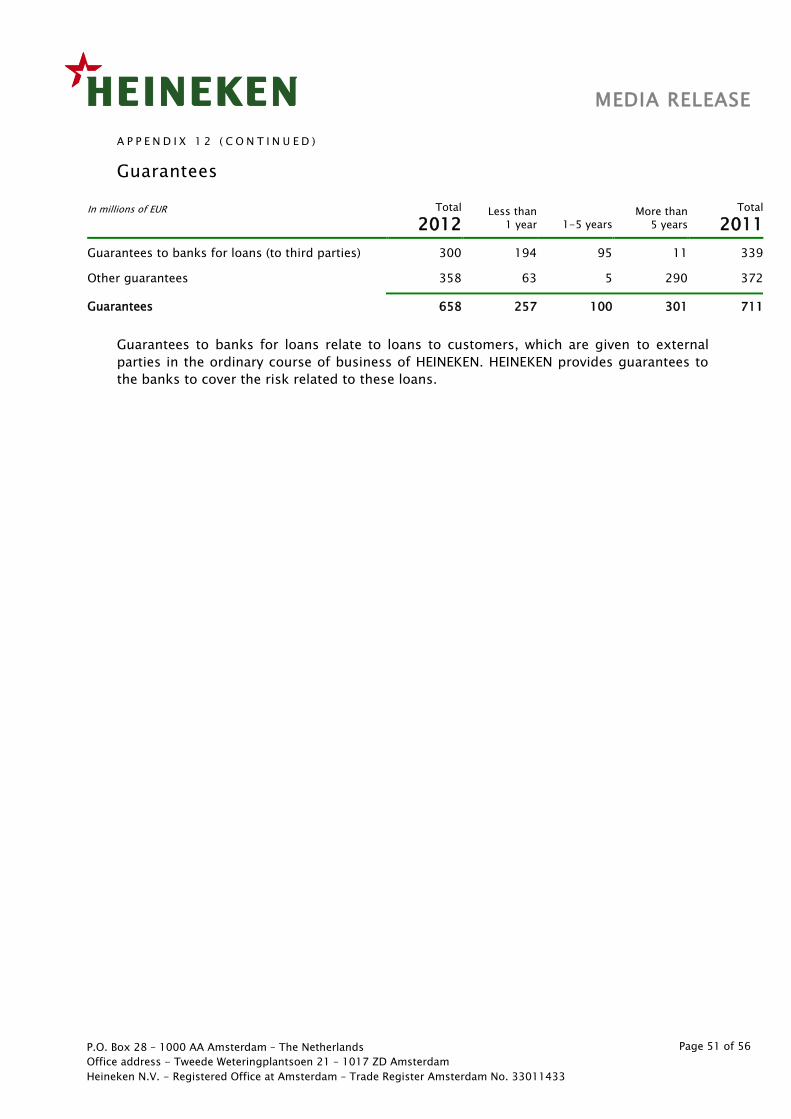
P.O. Box 28 – 1000 AA Amsterdam – The Netherlands
Office address - Tweede Weteringplantsoen 21 – 1017 ZD Amsterdam
Heineken N.V. - Registered Office at Amsterdam – Trade Register Amsterdam No. 33011433
Page 51 of 56
MEDIA RELEASE
A P P E N D I X 1 2 ( C O N T I N U E D )
Guarantees
In millions of EUR Total
2012 Less than
1 year 1-5 years More than
5 years
Total
2011
Guarantees to banks for loans (to third parties) 300 194 95 11 339
Other guarantees 358 63 5 290 372
Guarantees 658 257 100 301 711
Guarantees to banks for loans relate to loans to customers, which are given to external
parties in the ordinary course of business of HEINEKEN. HEINEKEN provides guarantees to
the banks to cover the risk related to these loans.
P.O. Box 28 – 1000 AA Amsterdam – The Netherlands
Office address - Tweede Weteringplantsoen 21 – 1017 ZD Amsterdam
Heineken N.V. - Registered Office at Amsterdam – Trade Register Amsterdam No. 33011433
Page 52 of 56
MEDIA RELEASE
APPENDIX 12 (CONTINUED)
Subsequent events
Share of stake in Kazakhstan
On 21 December 2012 HEINEKEN announced its intentions to sell its 28% stake in Efes
Kazakhstan JSC FE to majority shareholders Efes Breweries International N.V. The
transaction closed on 10 January 2013 and resulted in an estimated post tax book
gain of EUR80 million.
Sale of Jiangsu Dafuhao Breweries Co. Ltd
On 9 January 2013 HEINEKEN’s Asian subsidiary that holds a 49% stake in Jiangsu
Dafuhao Breweries Co. Ltd entered into a conditional share transfer agreement
whereby Nantong Fuhao Alcohol Co. Ltd. will purchase HEINEKEN’s shareholding
interests for USD24.5 million. The transaction closed on 15 January 2013 when the
funds were received in full.
Sale of Pago International GmbH
On 17 December 2012 HEINEKEN announced the sale of its wholly-owned subsidiary
Pago International GmbH to Eckes-Granini Group. The transaction is expected to
close before March 2013.
Mandatory unconditional cash offer (Offer for APB shares)
On 17 January 2013 HEINEKEN announced that the final closing date of its Offer for
all of the issued and paid-up ordinary APB shares other than those already owned or
controlled by HEINEKEN is 31 January 2013.
On 16 January 2013 the required acceptance level of 90 per cent of the APB shares in
the open market was reached. As such, HEINEKEN was entitled to exercise its right of
compulsory acquisition of the remaining APB shares. The total cash consideration in
relation to the acquisition of the remaining shares after 31 December 2012 amounts
to approximately EUR146 million.
Strategic review of Hartwall in Finland
On 4 February 2013 HEINEKEN announced that it had started a strategic review of its
Hartwall business in Finland. During this review, HEINEKEN evaluates strategic options for
Hartwall to drive continued growth of the business, within or outside of HEINEKEN. The
strategic review is expected to be finalised before the end of the year.
P.O. Box 28 – 1000 AA Amsterdam – The Netherlands
Office address - Tweede Weteringplantsoen 21 – 1017 ZD Amsterdam
Heineken N.V. - Registered Office at Amsterdam – Trade Register Amsterdam No. 33011433
Page 53 of 56
MEDIA RELEASE
A P P E N D I X 1 3
GLOSSARY
Acquisition related intangible assets
Acquisition related intangible assets are assets that HEINEKEN only recognises as part of a
purchase price allocation following an acquisition. This includes amongst others brands,
customer-related and certain contract-based intangibles.
ASDI
Allotted share delivery instrument (ASDI) representing HEINEKEN’s obligation to deliver
Heineken NV shares, either through issuance and/or purchasing of its own shares.
Beia
Before exceptional items and amortisation of acquisition related intangible assets.
Cash conversion ratio
Free operating cash flow/Net profit (beia) before deduction of non-controlling interests.
Depletions
Sales by distributors to the retail trade.
Dividend payout
Proposed dividend as percentage of net profit (beia).
Earnings per share
Basic
Net profit divided by the weighted average number of shares – basic – during the year.
Diluted
Net profit divided by the weighted average number of shares – diluted – during the year
EBIT
Earnings before interest and taxes and net finance expenses. EBIT includes HEINEKEN’s
share in net profit of associates and joint ventures.
EBITDA
Earnings before interest and taxes and net finance expenses before depreciation and
amortisation.
P.O. Box 28 – 1000 AA Amsterdam – The Netherlands
Office address - Tweede Weteringplantsoen 21 – 1017 ZD Amsterdam
Heineken N.V. - Registered Office at Amsterdam – Trade Register Amsterdam No. 33011433
Page 54 of 56
MEDIA RELEASE
APPENDIX 13 (CONTINUED)
Effective tax rate
Income tax expense expressed as a percentage of the profit before income tax, adjusted
for share of profit of associates and joint ventures and impairments thereof (net of income
tax).
Eia
Exceptional items and amortisation of acquisition-related intangible assets
Fixed costs
Fixed costs include personnel costs, depreciation and amortisation, repair and
maintenance costs, energy and water, and other fixed costs. Exceptional items are
excluded from these costs.
Free operating cash flow
This represents the total of cash flow from operating activities, and cash flow from
operational investing activities.
Innovation rate
The Innovation Rate is calculated as revenues generated from innovations launched /
introduced in the past 12 quarters divided by revenue
Net debt
Non-current and current interest-bearing loans and borrowings and bank overdrafts less
investments held for trading and cash.
Net debt/EBITDA (beia) ratio
The ratio is based on a twelve month rolling calculation for EBITDA (beia).
Net profit
Profit after deduction of non-controlling interests (profit attributable to equity holders of
the Company).
Organic growth
Growth excluding the effect of foreign currency translational effects, consolidation changes,
exceptional items, amortisation of acquisition-related intangible assets.
P.O. Box 28 – 1000 AA Amsterdam – The Netherlands
Office address - Tweede Weteringplantsoen 21 – 1017 ZD Amsterdam
Heineken N.V. - Registered Office at Amsterdam – Trade Register Amsterdam No. 33011433
Page 55 of 56
MEDIA RELEASE
A P P E N D I X 1 3 ( C O N T I N U E D )
Organic volume growth
Increase in volume, excluding the effect of the first time consolidation of acquisitions.
Operating profit
Results from operating activities
Profit
Total profit of the Group before deduction of non-controlling interests.
®
All brand names mentioned in this report, including those brand names not marked by an
®, represent registered trademarks and are legally protected.
Region
A region is defined as HEINEKEN’s managerial classification of countries into geographical
units.
Revenue
Net realised sales proceeds in euros.
Top-line growth
Growth in net revenue.
Volume
Consolidated beer volume 100 per cent of beer volume produced and sold by fully consolidated companies
(excluding the beer volume brewed and sold by joint venture companies).
Group beer volume 100 per cent of beer volume produced and sold by fully consolidated companies and joint
venture companies as well as the volume of HEINEKEN’s brands produced and sold under
license by third parties.
Heineken® volume The Group beer volume of the Heineken® brand.
Heineken® volume in premium segment The Group beer volume of the Heineken® brand in the premium segment (Heineken®
volume in the Netherlands is excluded).
P.O. Box 28 – 1000 AA Amsterdam – The Netherlands
Office address - Tweede Weteringplantsoen 21 – 1017 ZD Amsterdam
Heineken N.V. - Registered Office at Amsterdam – Trade Register Amsterdam No. 33011433
Page 56 of 56
MEDIA RELEASE
A P P E N D I X 1 3 ( C O N T I N U E D )
Total Consolidated volume Volume produced and sold by fully consolidated companies (including beer, cider, soft
drinks and other beverages), volume of third party products and volume of HEINEKEN’s
brands produced and sold under license by third parties.
Weighted average number of shares
Basic
Weighted average number of issued shares including the weighted average of outstanding
ASDI, adjusted for the weighted average of own shares purchased in the year.
Diluted Weighted average number of issued shares including weighted average of outstanding
ASDI.