Embed Size (px)
Citation preview

28th May 2015 New Delhi
Media Interaction, FY’15
Presentation overview
Highlights 1
Performance FY’15 2
Pursuits 4
Overseas operations 3
Non-E&P business 5
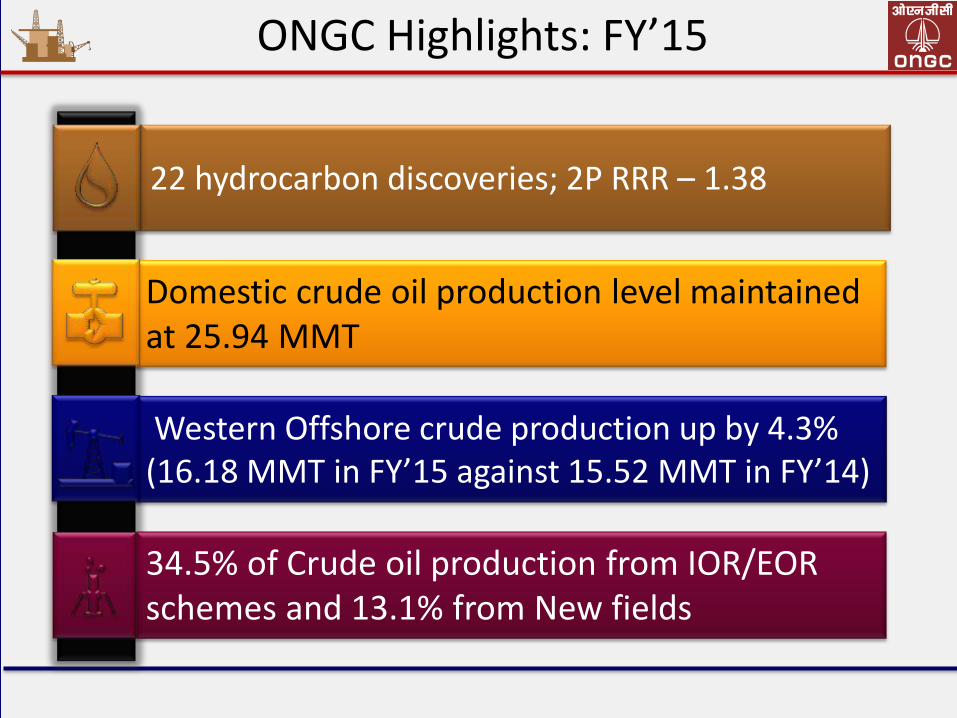
ONGC Highlights: FY’15
22 hydrocarbon discoveries; 2P RRR – 1.38
Domestic crude oil production level maintained at 25.94 MMT
34.5% of Crude oil production from IOR/EOR schemes and 13.1% from New fields
Western Offshore crude production up by 4.3% (16.18 MMT in FY’15 against 15.52 MMT in FY’14) )
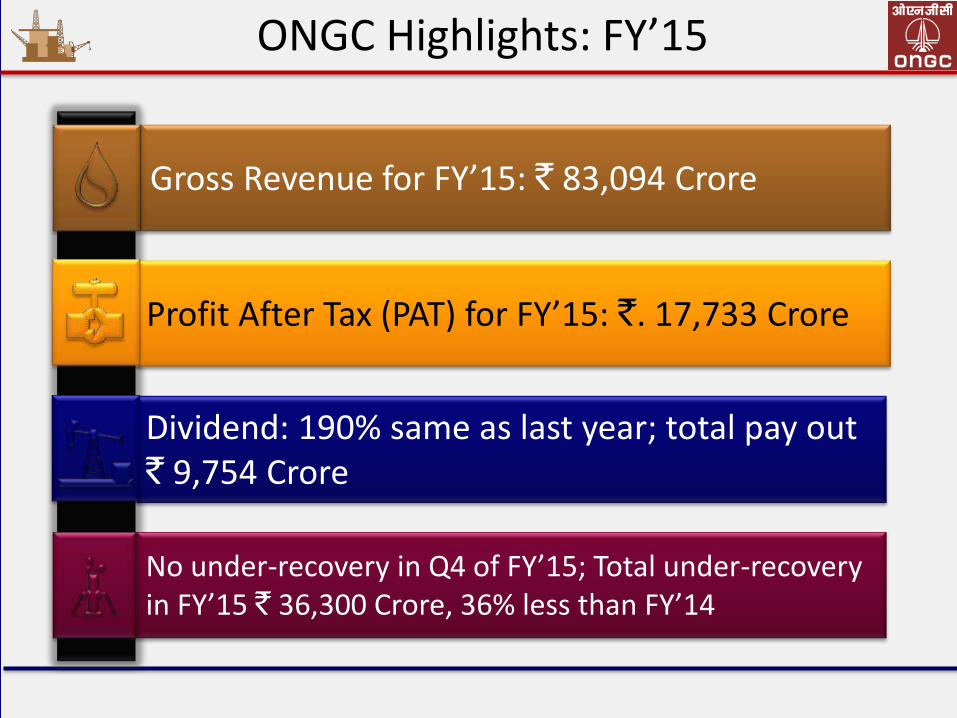
ONGC Highlights: FY’15
Gross Revenue for FY’15: ` 83,094 Crore
Profit After Tax (PAT) for FY’15: `. 17,733 Crore
No under-recovery in Q4 of FY’15; Total under-recovery in FY’15 ` 36,300 Crore, 36% less than FY’14
Dividend: 190% same as last year; total pay out ` 9,754 Crore
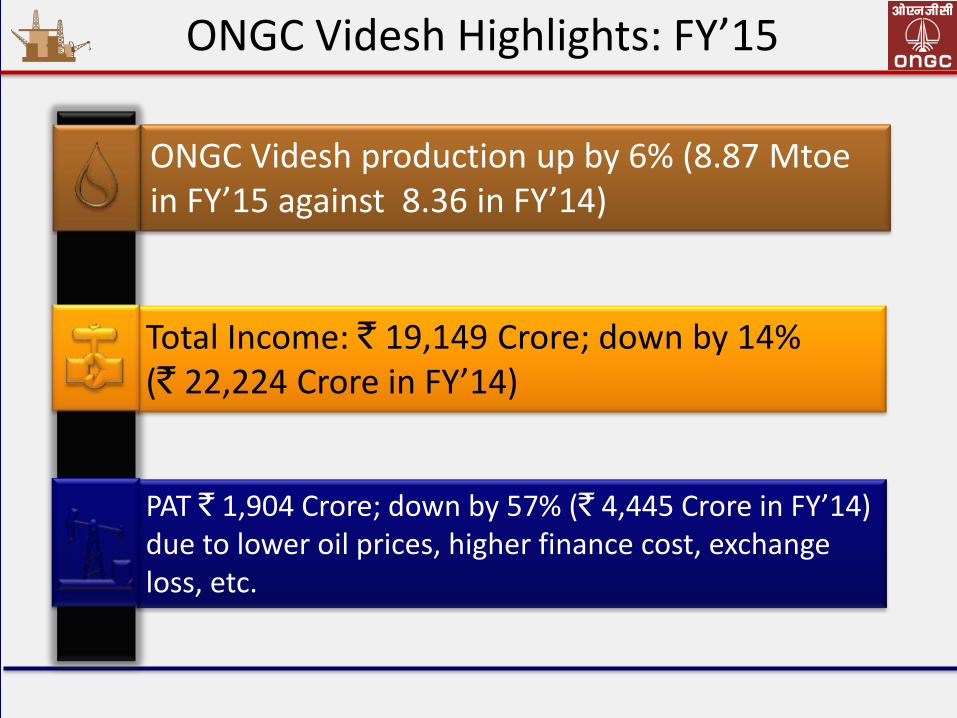
ONGC Videsh Highlights: FY’15
ONGC Videsh production up by 6% (8.87 Mtoe in FY’15 against 8.36 in FY’14)
Total Income: ` 19,149 Crore; down by 14% (` 22,224 Crore in FY’14)
PAT ` 1,904 Crore; down by 57% (` 4,445 Crore in FY’14) due to lower oil prices, higher finance cost, exchange loss, etc.

MRPL Highlights: FY’15
OMPL: ONGC Mangalore Petrochemicals Ltd.
FY’15: Turnover down by 17% due to lower product prices; PAT (-) ` 1,170 Crore down against ` 601 Crore in FY’14 due to inventory/exchange losses
MRPL increases its equity in OMPL (51%) for synergy of operations.
MRPL registers highest-ever thruput of 14.65 MMT in FY’15
All units under Phase-III refinery expansion project commissioned

ONGC Physical: Q4, FY’15
7
Domestic crude oil production levels maintained
Crude oil production (MMT) Gas production (BCM)
5.81 5.43
0.36 0.38
Q4 FY'14 Q4 FY'15
ONGC PSC-JV
5.53 5.54
0.94 0.91
Q4 FY'14 Q4 FY'15
ONGC PSC-JV
6.45 6.47 5.81 6.17

ONGC Financials: Q4, FY’15
8
Turnover down up by 1.3% due to higher crude sales; PAT down by 19.5%
21,403 21,683
Q4 FY'14 Q4 FY'15
4,889 3,935
Q4 FY'14 Q4 FY'15
Turnover PAT Under-recovery
` Crore
16,202
0
9,122
0
Q4 FY'14 Q4 FY'15
Subsidy Impact on PAT
1.3%
19.5%

Performance FY’15 2
ONGC Group

10
(Mtoe) Mtoe Oil Gas Total
ONGC 463.56 587.61 1,051.17
PSC JV 2.26 - 3.29 - 1.03
OVL 258.29 353.78 612.07
Total 724.11 738.10 1,662.21
711
23 203
936 1,051
-1
612
1,662
1,359
3
647
2,009
ONGC JV OVL Total
1P 2P 3P
2P Reserves = 1,662.21 mtoe (ONGC: 63%; OVL: 37%)
ONGC Group: Reserves (as on 1st April 2015)
Reserves (2P)
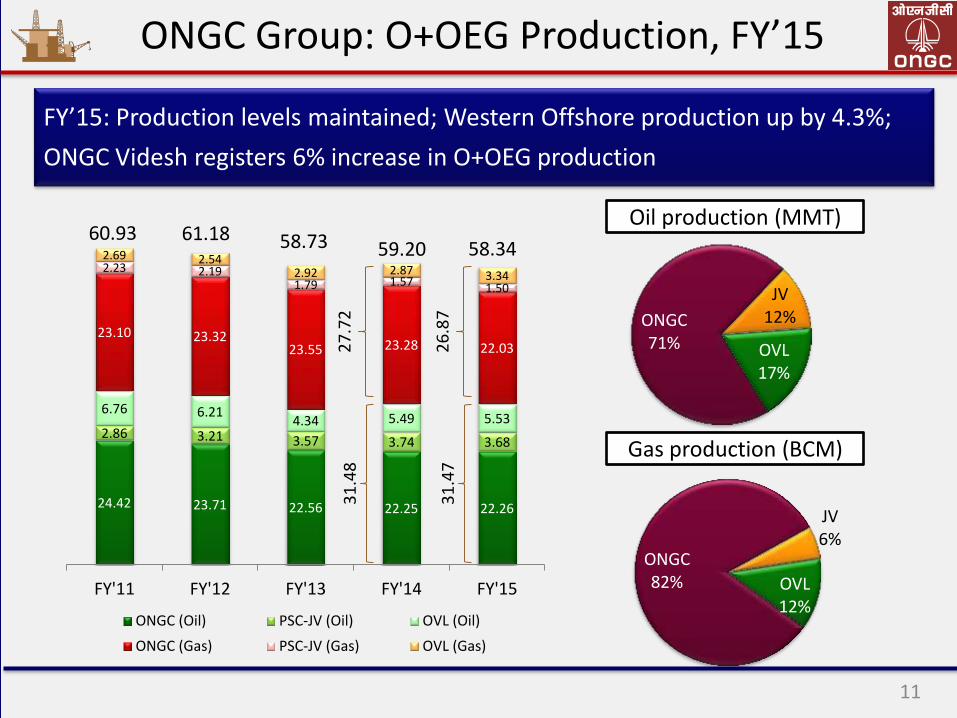
ONGC Group: O+OEG Production, FY’15
11
FY’15: Production levels maintained; Western Offshore production up by 4.3%;
ONGC Videsh registers 6% increase in O+OEG production
24.42 23.71 22.56 22.25 22.26
2.86 3.21 3.57 3.74 3.68
6.76 6.21 4.34 5.49 5.53
23.10 23.32 23.55 23.28 22.03
2.23 2.19 1.79 1.57 1.50
2.69 2.54 2.92 2.87 3.34
FY'11 FY'12 FY'13 FY'14 FY'15
ONGC (Oil) PSC-JV (Oil) OVL (Oil)
ONGC (Gas) PSC-JV (Gas) OVL (Gas)
60.93 61.18 58.73 59.20 58.34
ONGC 71%
JV 12%
OVL 17%
ONGC 82%
JV 6%
OVL 12%
Oil production (MMT)
Gas production (BCM) 3
1.4
7
26
.87
31
.48
2
7.7
2
ONGC Group: Financials, FY’15
12
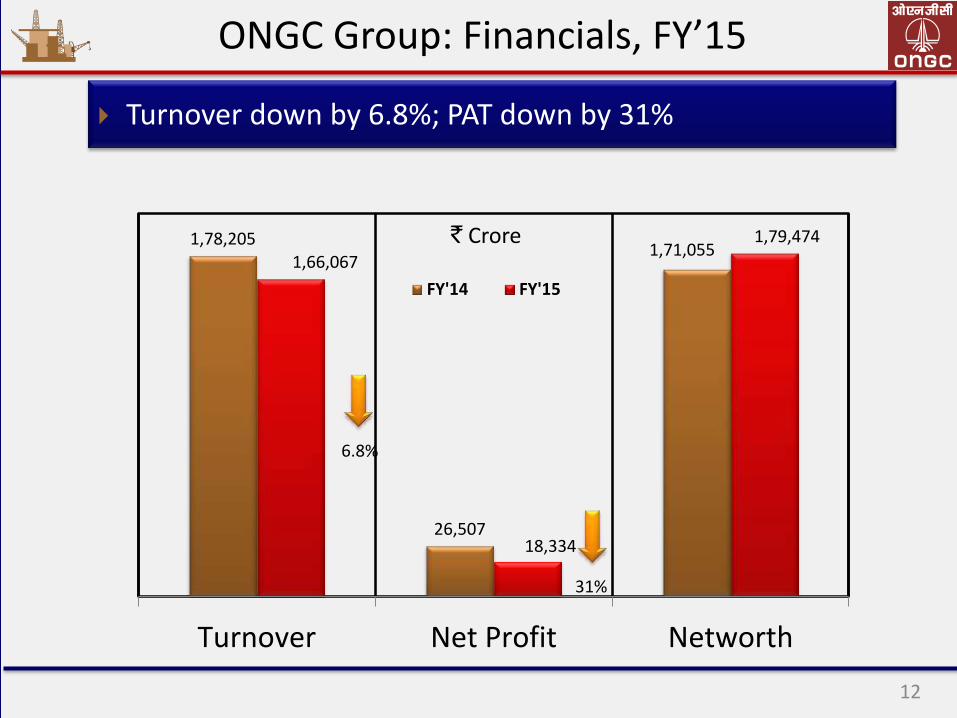
Turnover down by 6.8%; PAT down by 31%
1,78,205
26,507
1,71,055 1,66,067
18,334
1,79,474
Turnover Net Profit Networth
FY'14 FY'15
` Crore
6.8%
31%

Performance FY’15 2
ONGC

New Prospects Discovery: 10
1 Rupal-2 Oil
2 YS-9 / YS-9-1 (Shift) Gas
3 Vadatal-10 Oil
4 TK-3A Gas
5 GKS092NAA-1 Gas
6 MD -5 Gas
7 GD-11-1 Gas
8 GK091NDA-1 Gas
9 Vadatal-11 Oil
10 South Pasarlapudi – 1 Oil
ONGC: Reserve Accretion
14
New Pool Discovery = 12
1 C-1-F (C-1, N. Tapti) Oil & Gas
2 C-1-H (C-1, N. Tapti) Oil & Gas
3 Gandhar-699 Oil & Gas
4 GS-29-10 Oil & Gas
5 RSAK (R-184) Oil
6 WO-5-11 Oil
7 Damoh-4 Gas
8 Madanam-6 Oil & Gas
9 G-1-NE-AB Oil & Gas
10 G-1-NE-AA Oil
11 Khoraghat-35 Gas
12 Khoraghat-37 Gas
22 Oil & Gas discoveries (7 in NELP blocks) Oil: 7; Oil & Gas: 6; Gas & Condensate: 9 (Onshore: 15; Offshore:7)
63.09 58.67
67.59
56.26
61.05
1.33 1.25
1.47
1.24
1.38
0.00
0.18
0.36
0.54
0.72
0.90
1.08
1.26
1.44
1.62
0
10
20
30
40
50
60
70
80
90
Res
erve
Rep
lace
men
t R
atio
Ult
imat
e R
eser
ves
(MM
T)
2P Reserves RRR
2P Reserve Replacement Ratio (RRR) more than 1 for 9 years
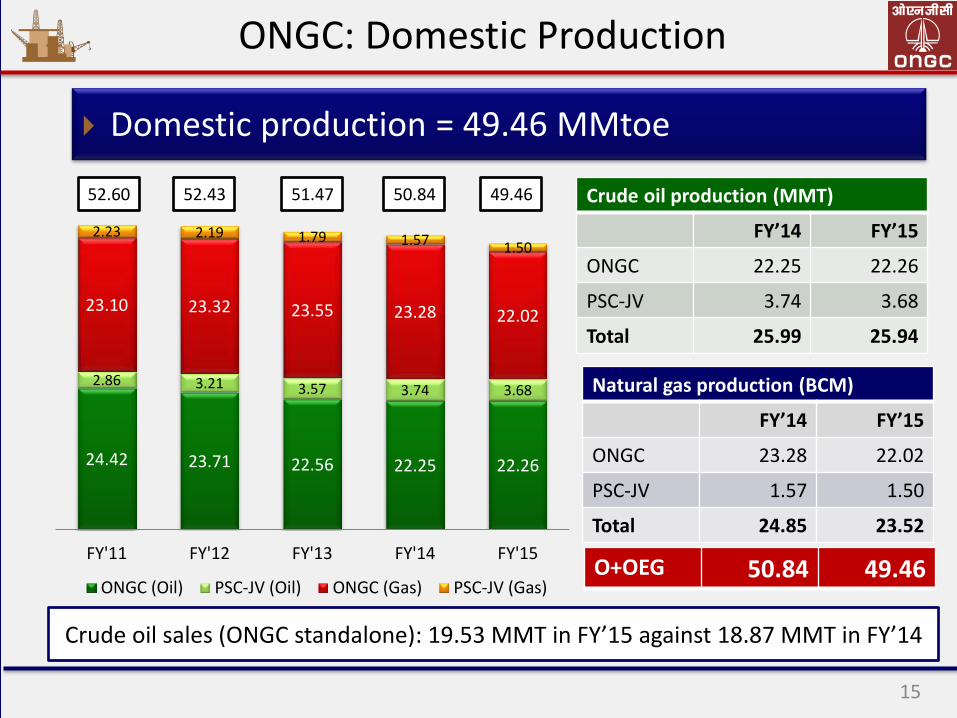
ONGC: Domestic Production
15
Crude oil production (MMT)
FY’14 FY’15
ONGC 22.25 22.26
PSC-JV 3.74 3.68
Total 25.99 25.94
Natural gas production (BCM)
FY’14 FY’15
ONGC 23.28 22.02
PSC-JV 1.57 1.50
Total 24.85 23.52
52.60 52.43
Domestic production = 49.46 MMtoe
51.47 50.84
O+OEG 50.84 49.46
49.46
24.42 23.71 22.56 22.25 22.26
2.86 3.21 3.57 3.74 3.68
23.10 23.32 23.55 23.28 22.02
2.23 2.19 1.79 1.57 1.50
FY'11 FY'12 FY'13 FY'14 FY'15
ONGC (Oil) PSC-JV (Oil) ONGC (Gas) PSC-JV (Gas)
Crude oil sales (ONGC standalone): 19.53 MMT in FY’15 against 18.87 MMT in FY’14
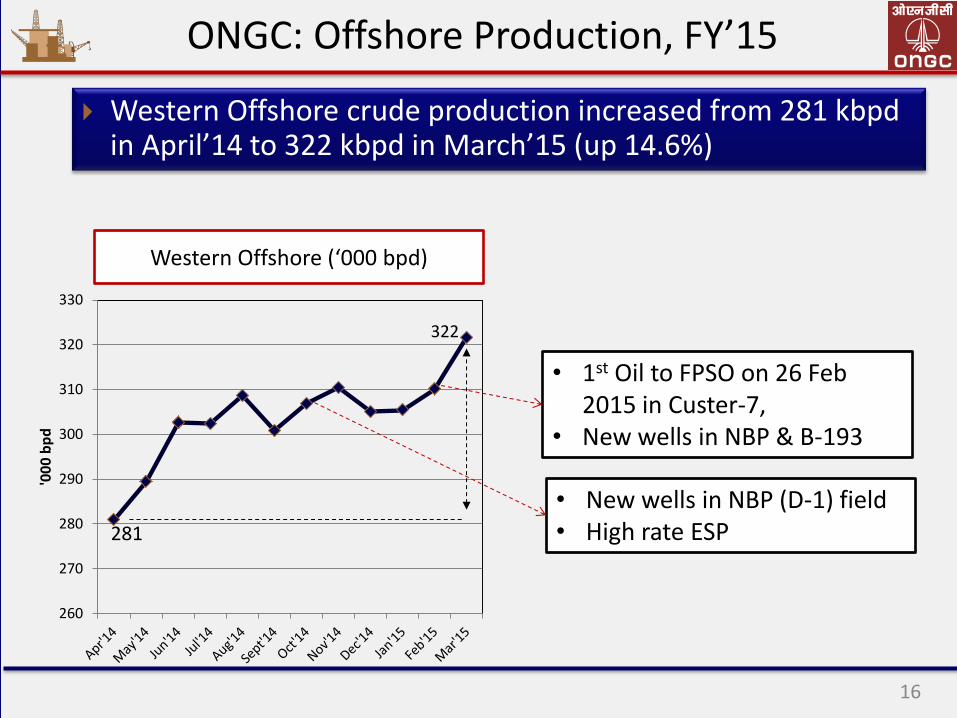
ONGC: Offshore Production, FY’15
16
Western Offshore crude production increased from 281 kbpd in April’14 to 322 kbpd in March’15 (up 14.6%)
281
322
260
270
280
290
300
310
320
330
'00
0 b
pd
Western Offshore (‘000 bpd)
• 1st Oil to FPSO on 26 Feb 2015 in Custer-7,
• New wells in NBP & B-193
• New wells in NBP (D-1) field • High rate ESP
61-6
2
62-6
3
63-6
4
64-6
5
65-6
6
66-6
7
67-6
8
68-6
9
69-7
0
70-7
1
71-7
2
72-7
3
73-7
4
74-7
5
75-7
6
76-7
7
77-7
8
78-7
9
79-8
0
80-8
1
81-8
2
82-8
3
83-8
4
84-8
5
85-8
6
86-8
7
87-8
8
88-8
9
89-9
0
90-9
1
91-9
2
92-9
3
93-9
4
94-9
5
95-9
6
96-9
7
97-9
8
98-9
9
99-0
0
00-0
1
01-0
2
02-0
3
03-0
4
04-0
5
05-0
6
06-0
7
07-0
8
08-0
9
09-1
0
10-1
1
11-1
2
12-1
3
13-1
4
14-1
5
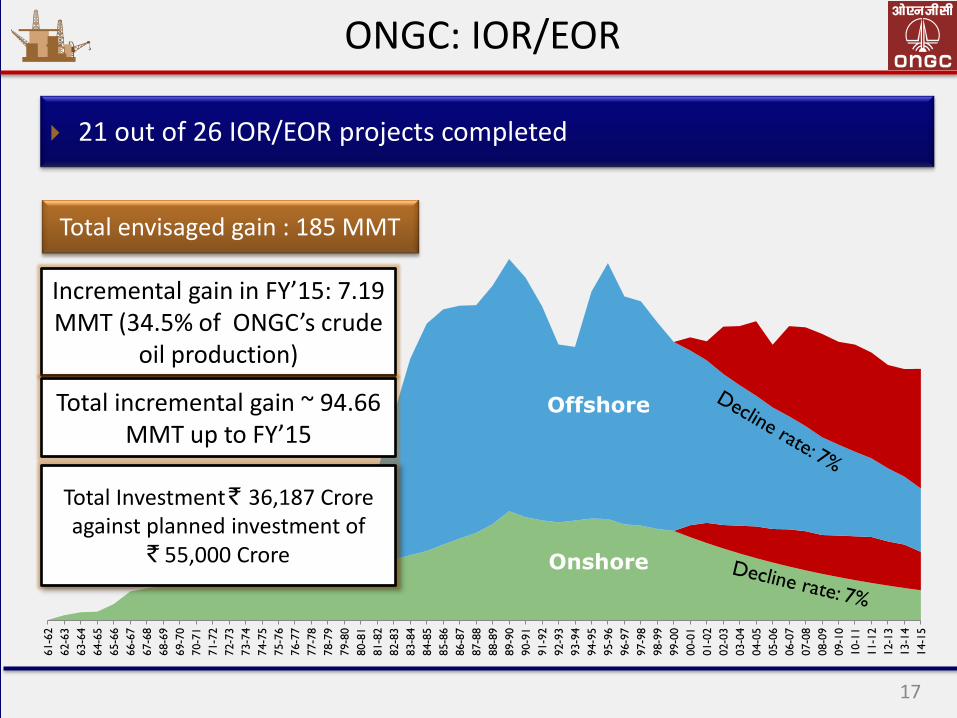
ONGC: IOR/EOR
17
Onshore
Offshore
21 out of 26 IOR/EOR projects completed
Incremental gain in FY’15: 7.19 MMT (34.5% of ONGC’s crude
oil production)
Total Investment ` 36,187 Crore against planned investment of
` 55,000 Crore
Total incremental gain ~ 94.66 MMT up to FY’15
Total envisaged gain : 185 MMT
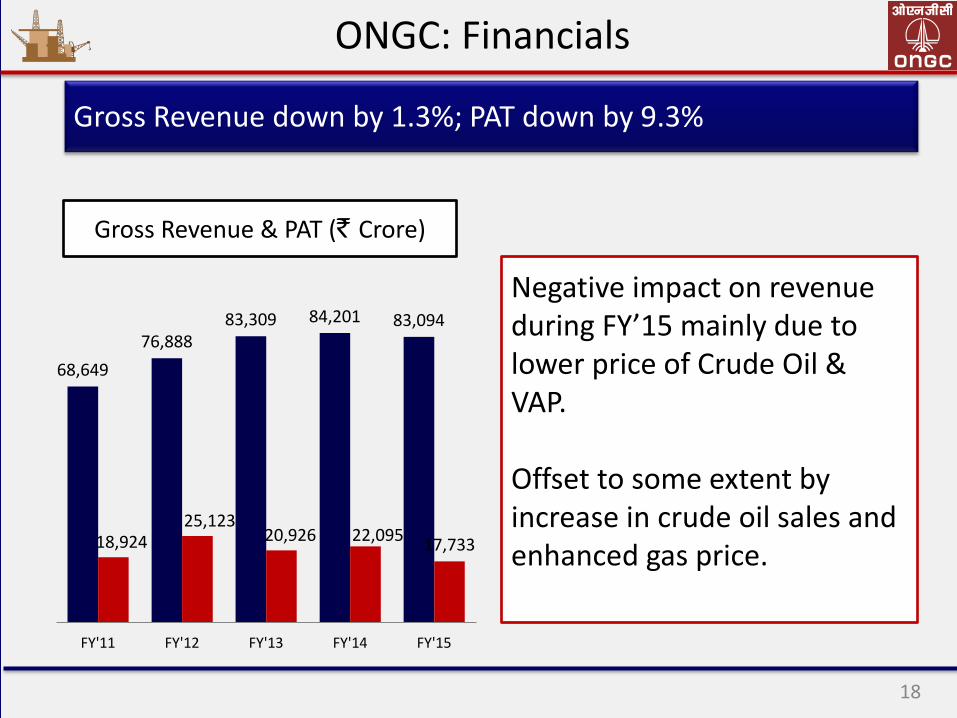
68,649
76,888 83,309 84,201 83,094
18,924 25,123
20,926 22,095 17,733
FY'11 FY'12 FY'13 FY'14 FY'15
ONGC: Financials
18
Gross Revenue down by 1.3%; PAT down by 9.3%
Gross Revenue & PAT (` Crore)
Negative impact on revenue during FY’15 mainly due to lower price of Crude Oil & VAP. Offset to some extent by increase in crude oil sales and enhanced gas price.
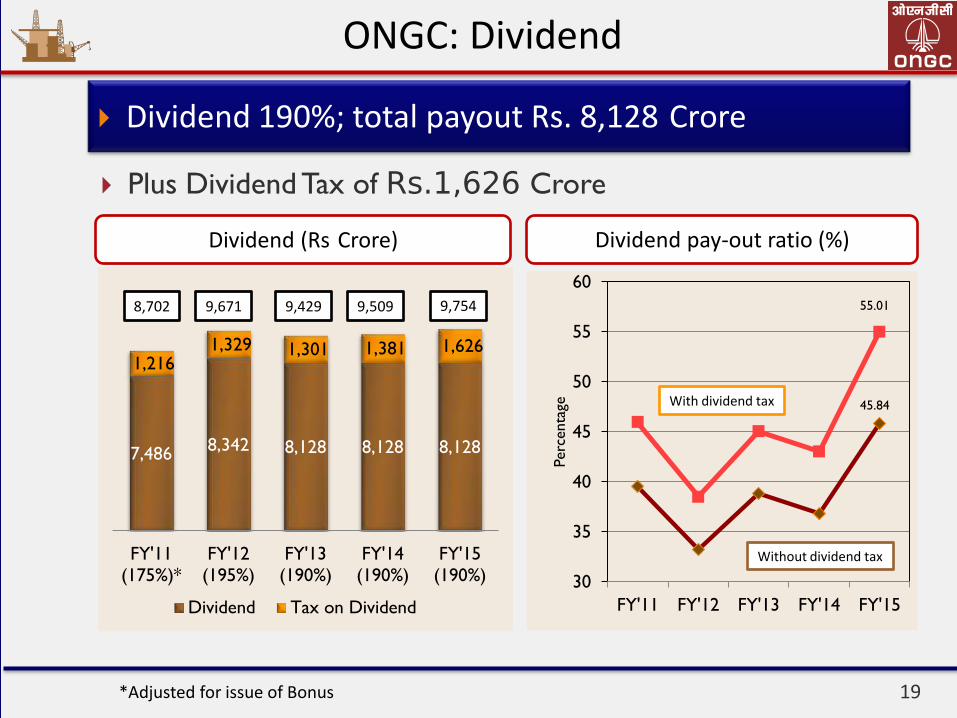
7,486 8,342 8,128 8,128 8,128
1,216 1,329 1,301 1,381 1,626
FY'11
(175%)*
FY'12
(195%)
FY'13
(190%)
FY'14
(190%)
FY'15
(190%)
Dividend Tax on Dividend
ONGC: Dividend
19
Plus Dividend Tax of Rs.1,626 Crore
Dividend 190%; total payout Rs. 8,128 Crore
45.84
55.01
30
35
40
45
50
55
60
FY'11 FY'12 FY'13 FY'14 FY'15
Perc
enta
ge
With dividend tax
Without dividend tax
Dividend (Rs Crore) Dividend pay-out ratio (%)
9,754 8,702 9,671 9,429 9,509
*Adjusted for issue of Bonus
ONGC: Capex
20
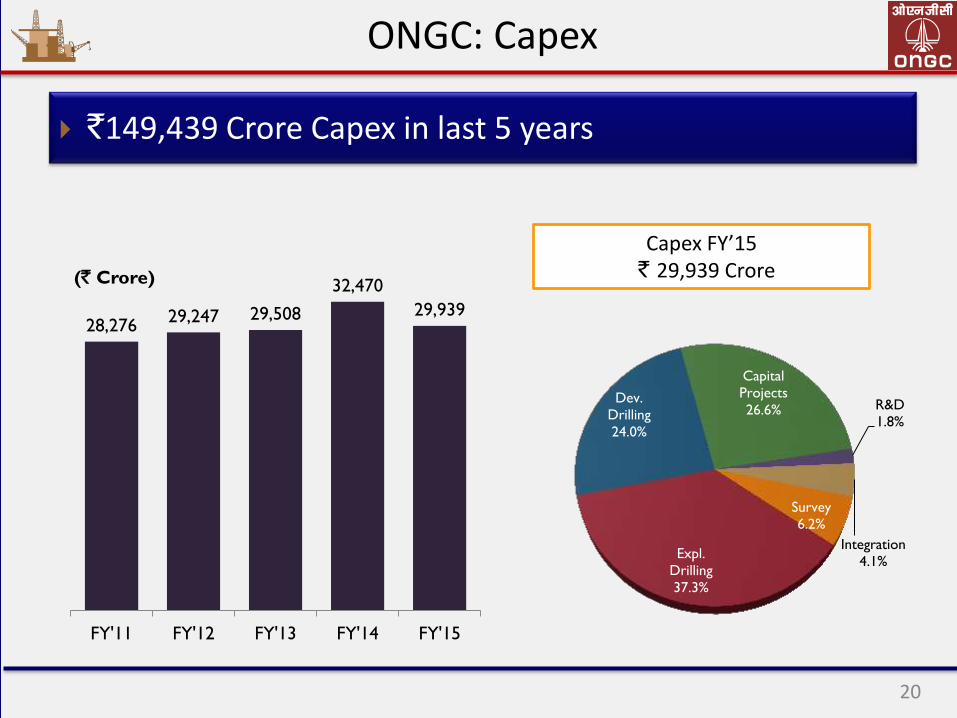
Capex FY’15 ` 29,939 Crore
28,276 29,247 29,508
32,470
29,939
FY'11 FY'12 FY'13 FY'14 FY'15
(` Crore)
`149,439 Crore Capex in last 5 years
Survey
6.2%
Expl.
Drilling
37.3%
Dev.
Drilling
24.0%
Capital
Projects
26.6% R&D
1.8%
Integration 4.1%
ONGC: Under-Recovery
21
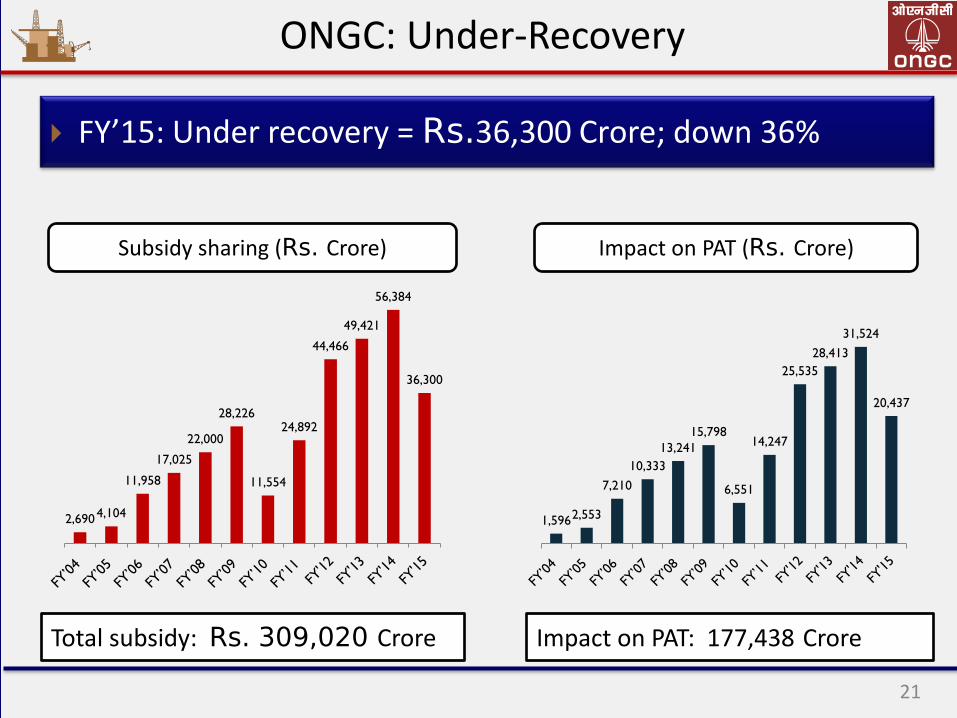
Subsidy sharing (Rs. Crore) Impact on PAT (Rs. Crore)
2,690 4,104
11,958
17,025
22,000
28,226
11,554
24,892
44,466
49,421
56,384
36,300
1,596 2,553
7,210
10,333
13,241
15,798
6,551
14,247
25,535
28,413
31,524
20,437
FY’15: Under recovery = Rs.36,300 Crore; down 36%
Total subsidy: Rs. 309,020 Crore Impact on PAT: 177,438 Crore

22
0
20
40
60
80
100
120
140
Q1
'02
Q2
'02
Q3
'02
Q4
'02
Q1
'03
Q2
'03
Q3
'03
Q4
'03
Q1
'04
Q2
'04
Q3
'04
Q4
'04
Q1
'05
Q2
'05
Q3
'05
Q4
'05
Q1
'06
Q2
'06
Q3
'06
Q4
'06
Q1
'07
Q2
'07
Q3
'07
Q4
'07
Q1
'08
Q2
'08
Q3
'08
Q4
'08
Q1
'09
Q2
'09
Q3
'09
Q4
'09
Q1
'10
Q2
'10
Q3
'10
Q4
'10
Q1
'11
Q2
'11
Q3
'11
Q4
'11
Q1
'12
Q2
'12
Q3
'12
Q4
'12
Q1
'13
Q2
'13
Q3
'13
Q4
'13
Q1
'14
Q2
'14
Q3
,14
Q4
,14
Q1
, 15
Q2
,15
Q3
,15
Q4
,15
Rates FY’08 FY’09 FY’10 FY’11 FY’12 FY’13 FY’14 FY’15
Pre-discount 85.54 86.15 71.65 89.41 117.40 110.74 106.72 85.28
Discount 32.64 38.45 15.71 35.64 62.69 62.89 65.75 40.41
Post-discount 52.90 47.70 55.94 53.76 54.71 47.85 40.97 44.87
Realizable
Realized
FY’15: Under-recovery @ $40.41/bbl; Q4,FY’15 – no subsidy
No subsidy in Q4, FY’15
ONGC: Under-recovery

Overseas operations 3
ONGC Videsh

ONGC Videsh, a wholly owned subsidiary of ONGC
Overseas investment
US$ 23.81 billion till FY’15
2P Reserves of 612 MMTOE
FY’15: Oil & Gas production 8.87 MMTOE (182,343 boe/day)
ONGC Videsh
24
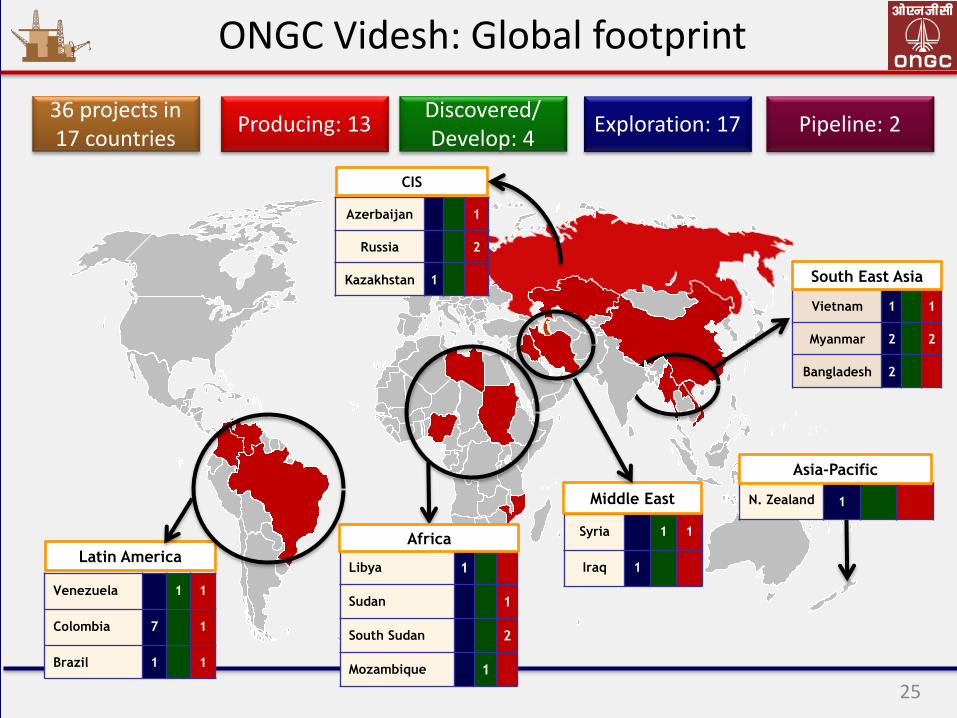
36 projects in 17 countries
Exploration: 17 Discovered/ Develop: 4
Producing: 13 Pipeline: 2
Libya 1
Sudan 1
South Sudan 2
Mozambique 1
Venezuela 1 1
Colombia 7 1
Brazil 1 1
Syria 1 1
Iraq 1
Middle East
Latin America Africa
Vietnam 1 1
Myanmar 2 2
Bangladesh 2
South East Asia
Azerbaijan 1
Russia 2
Kazakhstan 1
CIS
N. Zealand 1
Asia-Pacific
ONGC Videsh: Global footprint
25
ONGC Videsh: Reserves
26
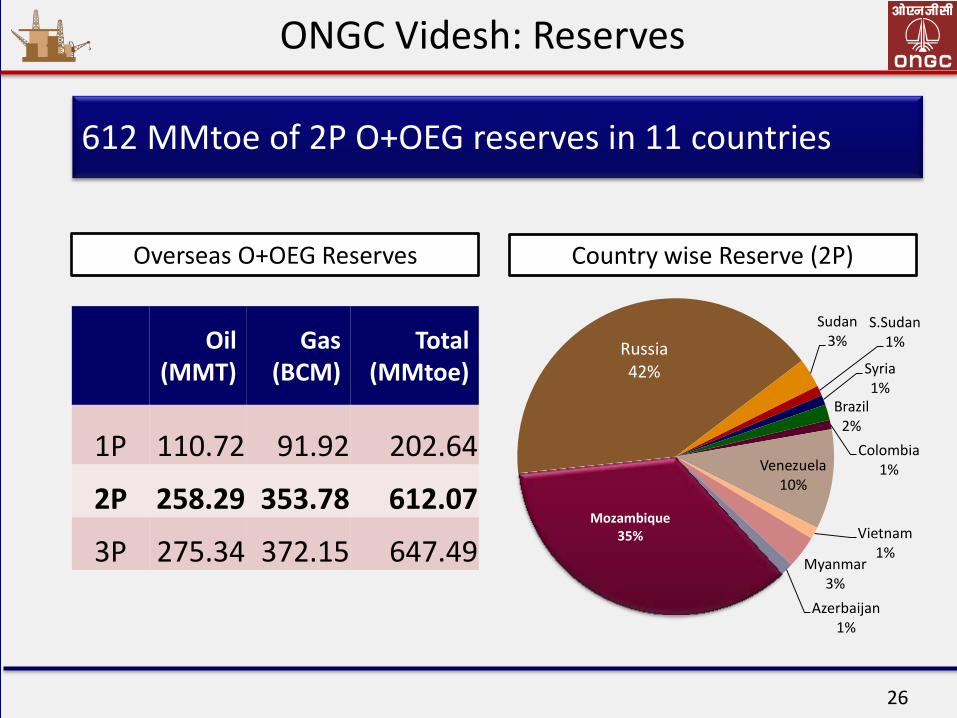
Oil (MMT)
Gas (BCM)
Total (MMtoe)
1P 110.72 91.92 202.64
2P 258.29 353.78 612.07
3P 275.34 372.15 647.49
Overseas O+OEG Reserves
612 MMtoe of 2P O+OEG reserves in 11 countries
Russia 42%
Sudan 3%
S.Sudan 1%
Syria 1%
Brazil 2%
Colombia 1% Venezuela
10%
Vietnam 1%
Myanmar 3%
Azerbaijan 1%
Mozambique 35%
Country wise Reserve (2P)

6.76 6.21
4.34 5.49 5.53
2.69 2.54
2.92
2.87 3.34
FY'11 FY'12 FY'13 FY'14 FY'15
Oil (MMT) Gas (BCM)
ONGC Videsh: Overseas Production
27
7.26
9.45
FY’15 Production 8.87 MMtoe (6% higher than in FY’14 - 8.36 MMtoe)
8.75
Russia 28%
Syria 0%
Myanmar 7%
Sudan 8%
S.Sudan 0%
Colombia 7% Vietnam
20%
Venezuela 9%
Brazil 10%
Azerbaijan 11%
8.36 8.87
Country wise production
Continuing problem
Incremental production from BC-10 (Brazil), Blocks A-1 & A-3 (Myanmar) and Shakhalin-1 (Russia)

ONGC Videsh: Financials
28
FY’15: Revenue down by 14.6%; PAT down by 57.2%
Total Income & PAT (Rs. Crore)
Lower Revenue & PAT due to
18,683
22,637
18,029
22,224
19,149
2,691 2,712 3,929 4,445
1,904
FY'11 FY'12 FY'13 FY'14 FY'15
Turnover (Rs. Crore) PAT (Rs. Crore)
Lower oil prices
Higher financing cost & Exchange loss
Higher depletion & impairment
Pursuits 4
Field Development
30
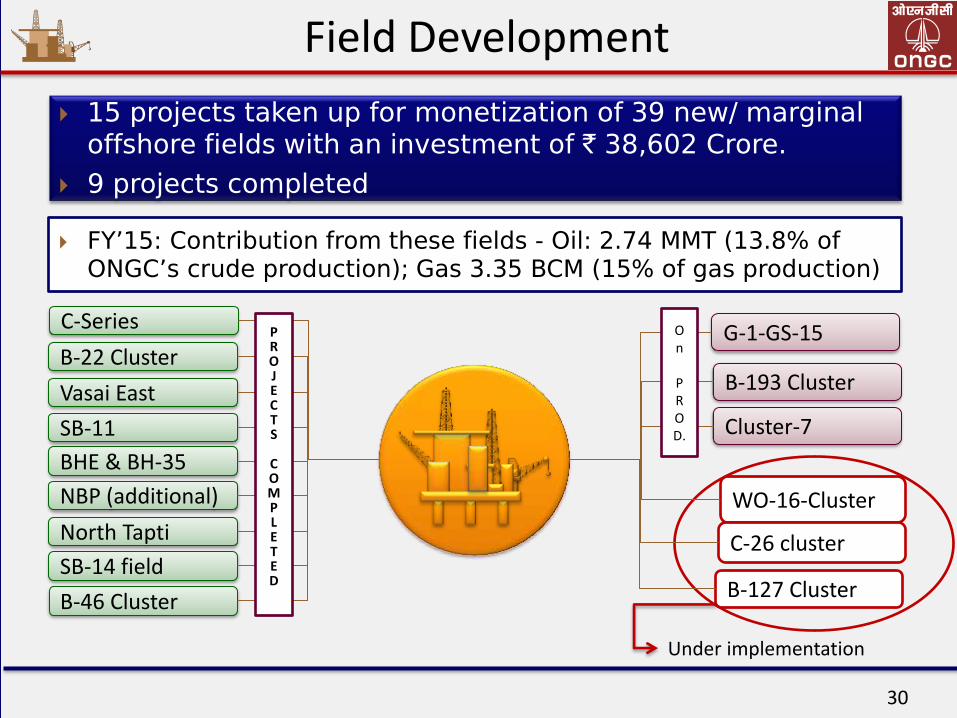
C-Series
B-22 Cluster B-193 Cluster
NBP (additional)
Cluster-7
BHE & BH-35
WO-16-Cluster
SB-14 field B-127 Cluster
C-26 cluster
B-46 Cluster
G-1-GS-15
SB-11
North Tapti
Vasai East
Under implementation
15 projects taken up for monetization of 39 new/ marginal offshore fields with an investment of ` 38,602 Crore.
9 projects completed
P R O J E C T S
C O M P L E T E D
On
P R O D.
FY’15: Contribution from these fields - Oil: 2.74 MMT (13.8% of ONGC’s crude production); Gas 3.35 BCM (15% of gas production)

Major new projects
31
Daman Project
MHS – Phase-III
MHN – Phase-III
Gamij field development
Addl. Development Vasai East
Vasistha & S-1 Development
Addl Development Bassein field Heera-South Heera Redev. Ph-II
Nagyalanka field development
` 6,086 Cr.
` 4,124 Cr.
` 4,620 Cr.
` 2,477 Cr.
` 1,881 Cr.
` 5,000 Cr.
Total ` 24,188 Cr.
` 5,813 Cr.
` 6,069 Cr.
` 5,608 Cr.
Total `17,490 Cr.
Development projects Re-development projects
6 major field development & 3 re-development projects taken up with an investment of Rs. 41,678 Crore
Now full focus on development of KG-DWN-98/2
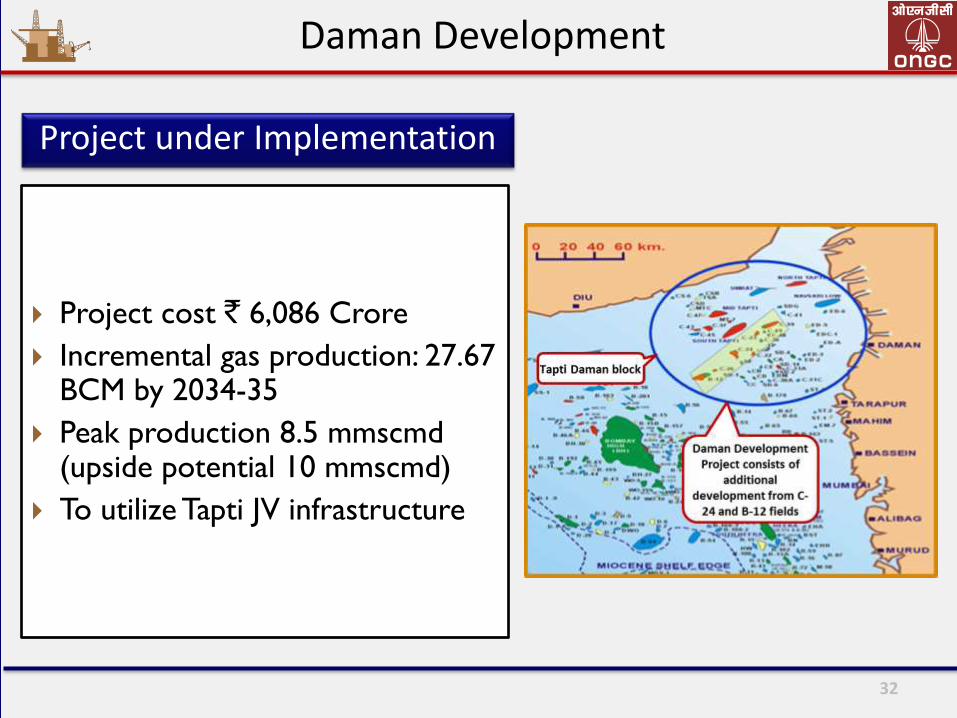
32
Project cost ` 6,086 Crore
Incremental gas production: 27.67 BCM by 2034-35
Peak production 8.5 mmscmd (upside potential 10 mmscmd)
To utilize Tapti JV infrastructure
Daman Development
Project under Implementation

33
Development of Vashista & S-1 fields
Project under Implementation
• Project cost: ` 4,124 Crore • Incremental gas production:
15.96 BCM by 2025-26 • Completion: April 2017
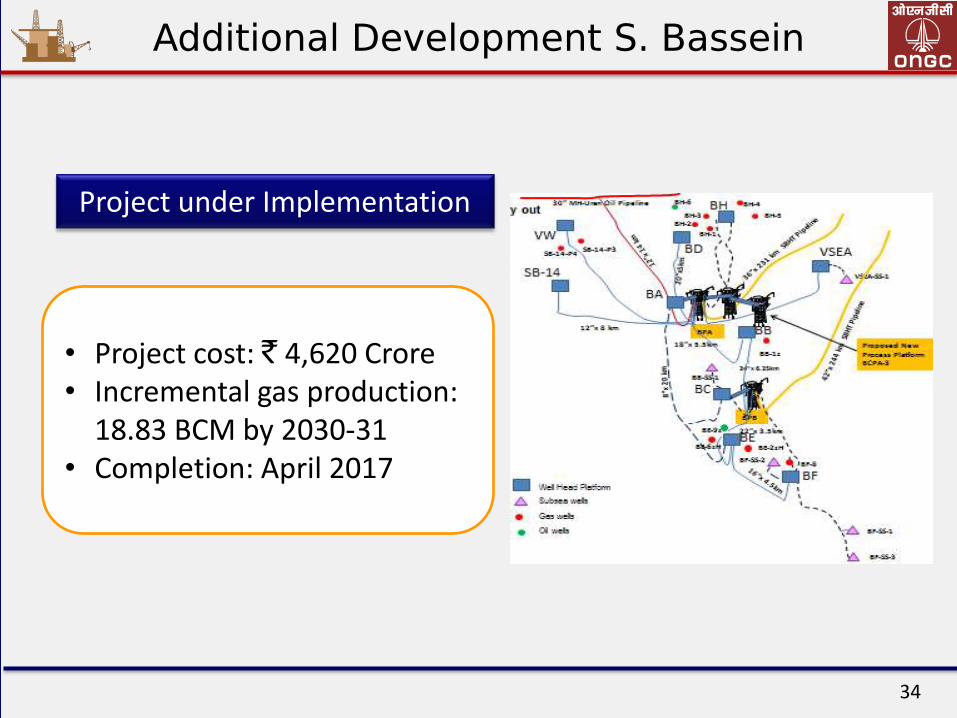
34
Additional Development S. Bassein
Project under Implementation
• Project cost: ` 4,620 Crore • Incremental gas production:
18.83 BCM by 2030-31 • Completion: April 2017

35
Additional Development Vasai East
Project under Implementation
• Project cost: Rs. 2,477 Crore • Incremental production: Oil -
1.83 MMT & Gas 1.97 BCM by 2029-30
• Completion: Dec 2018

36
OGNAJ
WADSAR
Gamij, Ahmedabad
Project under Implementation
• Project cost: Rs. 1,881 Crore • STOIIP: 51.39 MMt; incremental
oil 2.29 MMT • Crude production to be ramped
up from 350 tpd to 1,474 tpd
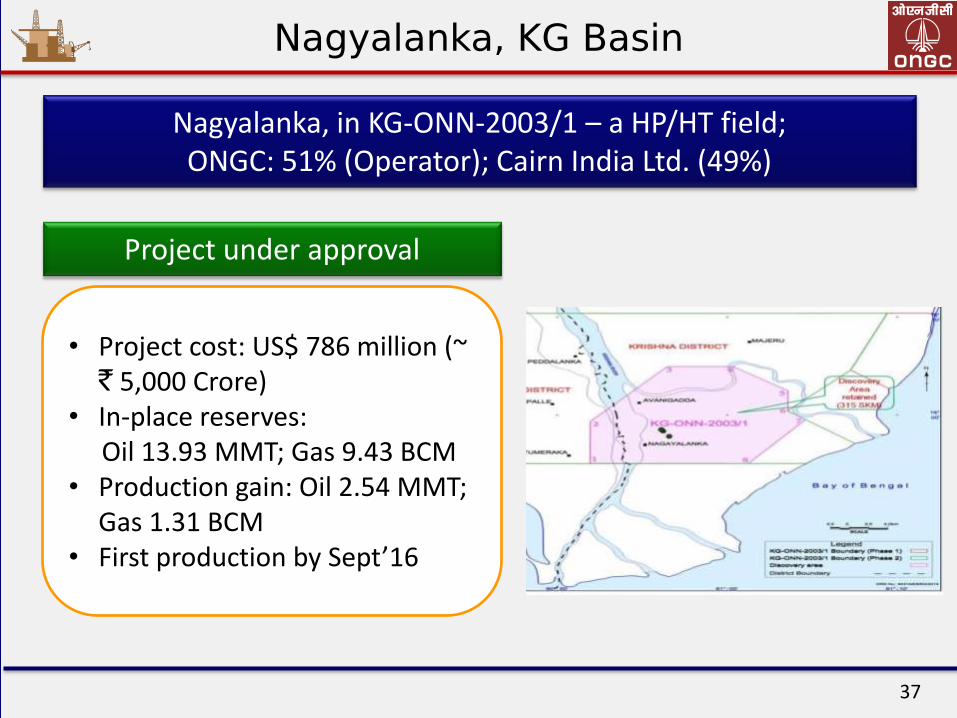
37
Nagyalanka, KG Basin
Nagyalanka, in KG-ONN-2003/1 – a HP/HT field; ONGC: 51% (Operator); Cairn India Ltd. (49%)
• Project cost: US$ 786 million (~ ` 5,000 Crore)
• In-place reserves: Oil 13.93 MMT; Gas 9.43 BCM • Production gain: Oil 2.54 MMT;
Gas 1.31 BCM • First production by Sept’16
Project under approval

MHN Redevelopment Phase-III
38
N19-1H
N19-2
N19-3H
N21-1H
N21-2H
N21-3H
N21-4H
N21-5H
N21-6H
N21-7H
N22-1
N22-2
N22-4
N22-3N22-5
N22-6H
N22-7H
N22-8H
N23-7
N23-4H
N23-3H
N23-2HN23-1H
N23-5H
N23-8
N23-9
N23-6H
N24-1
N24-2
N24-3
N24-4
N24-5
N24-6
N24-7
P6486
P6582
N21-8H
N24-8
LA
LB
LC
LD
LEN1
N10
N11
N12
N2
N3
N4
N5
N6
N7
N8
NA
N9
NB
NC
ND
NE
NH
NHO
NI
NJ
NK
NO
NP
NQ
NR
NS
NTNU
NV
NW
NX
WI-2
WI-3
WI-4
WI-5
N14
N20
N18
N17
N15
N16
BH-1
BH-14
BH-15
BH-19
BH-2
BH-3
BH-4BH-47
BH-48
BH-58
BH-59
BH-65
BH-8
1
10H
11H
2
3
4
4ZH
5
6H
7
8
9
1
1ZH
22ZH
3H
44ZH
5H
6
7
8H
99ZH
1
10H
11H11ZH
12
1ZH
22ZH
3H3ZH
4H
4Z5
6
6ZH7
8
8ZH
9H
9ZH
LC-SS
1
10
11H
2
3
4H
5H
6
7
8
9
1
1ZH
22ZH
3
44Z
5
6
7
8H
9H
1
2H
3H
4H
5H 6
7H
8H
9H
1
1
2H2ZH
3H
4H 5
6H
7H7ZH
8H
9H
1Z
2
1
2H
2ZH
3H
4H
5H
6H
8H
9H
2ZH3
4
56H
7H
8H 9H
1
10H
1ZH
2
2ZH
3
44ZH
5
8
9H
A-1H
A-2H
A-3H
A-4H
A-5H
A-6H
1
1ZH
2
33ZH
4
5
5ZH6
6ZH
7H
8H
9H
1
2
2X2Y2Z
3
3Z
44ZH
5
6
7
8
9
110
11HA
11YH11ZH
12H
13H
13ZH
1ZH
2
3
4
5
6
8
9
1
10H11
1Z
2
3
4
5
6
7 7Z
8
9H
E
1
1ZH
2
3
4
4ZH
5
6
H1
H2
H3
1
10H 10Z
11HA
12
2
3
4
5 5Z
6
7
89
1H
2H
3H 4H4XH
4YH
4ZH
5H5ZH
6H
7H88ZH
9H
1
1YH1Z
23
4
4ZH
12
2YH
2Z
3
3YH
3Z4
4YH
4Z
1
2
3
3Z
4
4Z
5
6
1
1ZH
2
3
4
5
6H
1
1ZH
2
2Z
3
3XH
3Y
3Z
4
4Z
5H
7H
8H
A-1H
A-2H
A-3H
A-4H
A-5H
A-6H
1
2
2YH
2Z3
4
55Z
6H
7H
8H
9H
A-1H
A-2H
A-3H
A-4H
A-5H
A-6H1
2
1
22Z
3
4
4ZH
5
66Z
78
9
11Z
2
3
4
5
6
7
8
9
1
22YH2Z
3
3Z
4
5H
1
2
3
4
5
5Z
6
6Z
7H
8H
9H
1
10H
11H
5
66Z7
8
8Z
9
A
AZ
BBZHH1
11Z
22Z
3
4
5
6
7
8
9
1
2
4
5
6
H
2Z
10H
11H
22Y
2Z
33ZH
4
5
5Z 6
6Y
6ZH
7
8H
9H
B
BYH
BZ
BZH
H
HZ
1
22Z
3
4
5
6
77ZH
8
8Y
8ZH
9H
11YH
1Z
2
3
3ZH
4
4YH4ZH
5
5ZH
6
6ZH
7H
8H
9H
1
2
3
4
5
5Y
5Z
6
6YH6ZH
7
8
1
22ZH
33ZH
44ZH
5
6
7
8
9
1
2
3
4
4Z
5
6
7
8
9
1
1Z
2
2Z
3
4
5
1
2
2Z
3
4
5H
6H
1
2
3
4
5H
6H
1
2
3
3ZH
4
5
6
11ZH
9Y
3Z
8Z
8ZH
10Z
1YH
2XH
1ZH
12H
12H
6H
3XH
6Z
4ZH
1ZH
8ZH
1YH
6ZH
1H
10
7H
1
4
5
7ZH
9
2H
2
1
AMH-4
3
4
5
3H
7H
1H
5H
8
9H
5H
7H
3
7H8H
8H
6H
6H
2ZH
3
5H
7H
8
6
5H
2
12H
7H
3H
4ZH
10
9
3
2
4
1H
7
8Z
6ZH
3Z
6
1
4
10
9
8H
4H
5H
6
N15-9
NQ-10
N15-10
N16-11
N5-1
NW-1
N9-1
N16-9
N16-10
NA-3
N1-2zH
NB-1
NC-5
NC-6
NR-2Y
NR-4
NR-6
LA-9
LA-11z
LA-6Z
LE-6
N19
N21
N22
N23
clampon
N24
L-III OIL
L-III Inj
L-I OIL
L-I INJ
S1 GAS
A2-V
N17-9
B
N17-10
B
N10-8ZH
A2-VII
N6-9Z
A1
NH-3ZH
A1
NK-3Y
A2-VII,B
NS-BX
A2-VII,B
NT-5Z
A2-VII,B,C
NT-7YH
A1
NV-3Y
A1
WI4-1ZHL1
A1
WI4-1ZHL2
B
NJ-2Z
A2-VII,B
LE-1Y
Land
WI4-1ZH
NP-13
NP-14
A1
N1-2ZH
A1
N1-7H
A1
NE-5H
A1
NEA-1H
A1
NU-1YH
A1
NU-7H
A2-VII
LA-3Z
A2-V,VI,VII,B,C
LA-10H
A2-V,VI,VII
LE-2ZHA2-V,VI,VII,B,C
LE-3L
A2-V,VI,VII,B,C
N7-5L
A2-VI,VII
N7-H3Z
A2-V,VI
N7-H2Z
A2-V,VI
NP15
A2-V
NP-1Z
A2-V,VI,VII,B,C,D
NQ-3L
A2-V,VI,VII,B
NR-5Z
A2-VII
NS-13
A1
ND-2ZH
A2-V, VII, B, C
NJ-7Z
NT-3
N17-11H
N17-12H
L-II
732800 733600 734400 735200 736000 736800 737600 738400 739200 740000 740800 741600 742400 743200 744000 744800 745600 746400 747200 748000 748800 749600 750400 751200 752000 752800 753600 754400 755200 756000
732800 733600 734400 735200 736000 736800 737600 738400 739200 740000 740800 741600 742400 743200 744000 744800 745600 746400 747200 748000 748800 749600 750400 751200 752000 752800 753600 754400 755200 7560002154400
2155200
2156000
2156800
2157600
2158400
2159200
2160000
2160800
2161600
2162400
2163200
2164000
2164800
2165600
2166400
2167200
2168000
2168800
2169600
2170400
2171200
2172000
2172800
2173600
2174400
2175200
2176000
2176800
2177600
2154400
2155200
2156000
2156800
2157600
2158400
2159200
2160000
2160800
2161600
2162400
2163200
2164000
2164800
2165600
2166400
2167200
2168000
2168800
2169600
2170400
2171200
2172000
2172800
2173600
2174400
2175200
2176000
2176800
2177600
0 500 1000 1500 2000 2500m
1:50000
Location Map MHNRD_Ph-III Final
N23
N22
N19
N21
N24
N11
New Platform Clamp-on
Monetizing untapped reserves & tapping bypassed oil in western periphery
• Capex: Rs.5,813 Crore • 5 new platforms • Wells: 52 new & 24 sidetracks • Incremental production Oil:
6.99 MMT; Gas: 5.25 BCM by 2030
• Incremental production already started through existing slots
• Completion: Facilities by April 2016; Wells by May 2017

MHS Redevelopment Phase-III
39
• Capex of ` 6,069 Crore • 6 new platforms • Wells: 36 new & 34 sidetracks • Incremental production Oil: 7.547
MMT & Gas: 3.86 BCM • Incremental production already
started through existing slots • Completion: Facilities by April 2016,
Wells by March 2019
Monetizing untapped reserves from L-II, S-1, L-III and Basal Clastic reservoirs.

Heera & S.Heera Redevelopment Phase-II
40
• Capex - ` 5,608 Crore • 3 well platforms, 1 process
platform, 3 clamp-on and & pipeline
• Wells: 42 • Incremental production Oil:
13.36 MMT, Gas: 1.67 BCM by 2034-35
• Production already started • Completion: Dec’2015
Monetizing untapped reserves from L-II, S-1, L-III and Basal Clastic reservoirs.
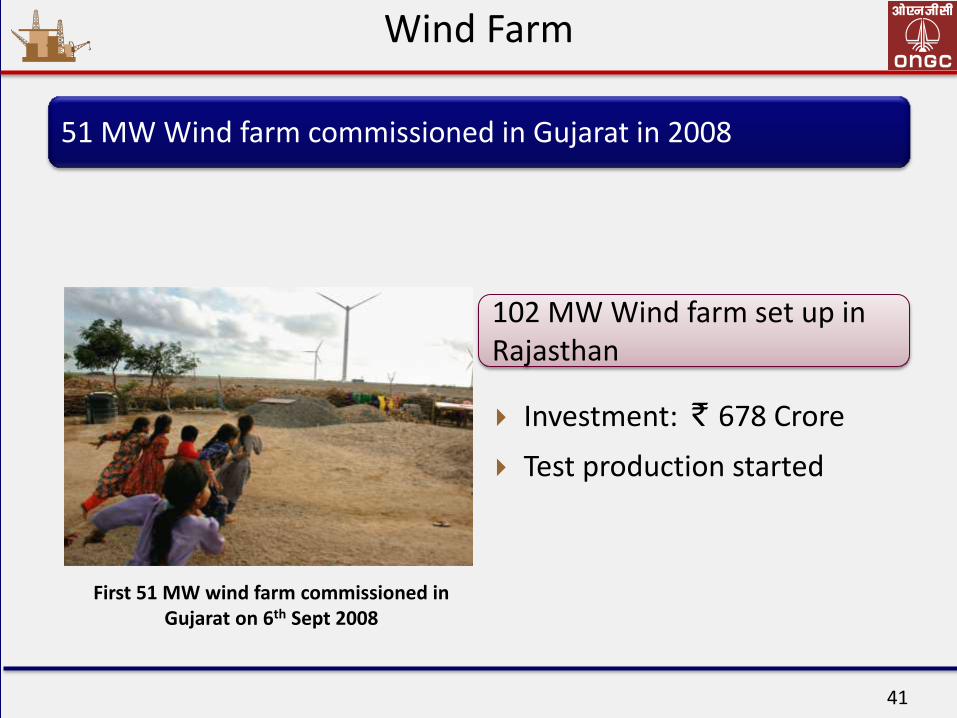
Wind Farm
41
First 51 MW wind farm commissioned in Gujarat on 6th Sept 2008
51 MW Wind farm commissioned in Gujarat in 2008
Investment: ` 678 Crore
Test production started
102 MW Wind farm set up in Rajasthan

Beyond hydrocarbons
42
US Patent & Trademark Office has issued a Patent to ONGC Energy Centre (OEC) & Institute of Chemical Technology (ICT), Mumbai for the innovative research
work on “Hydrogen Production Method by Multi-step Copper-Chlorine Thermochemical Cycle
Thermo-Chemical Reactor for Hydrogen Generation. Collaborative projects with IIT-D & ICT, Mumbai. Three reactors under installation
Uranium exploration: Thirteen Parametric wells in Suket-Jhalawar area of Rajasthan & three wells in Kaikalur area of Tamil Nadu taken up during FY’15.
One well identified for Geothermal potential Cambay basin in collaboration with M/s. Talboom, Belgium

Non-E&P business 5
Mangalore Refinery Petrochemicals Ltd.(MRPL)
44
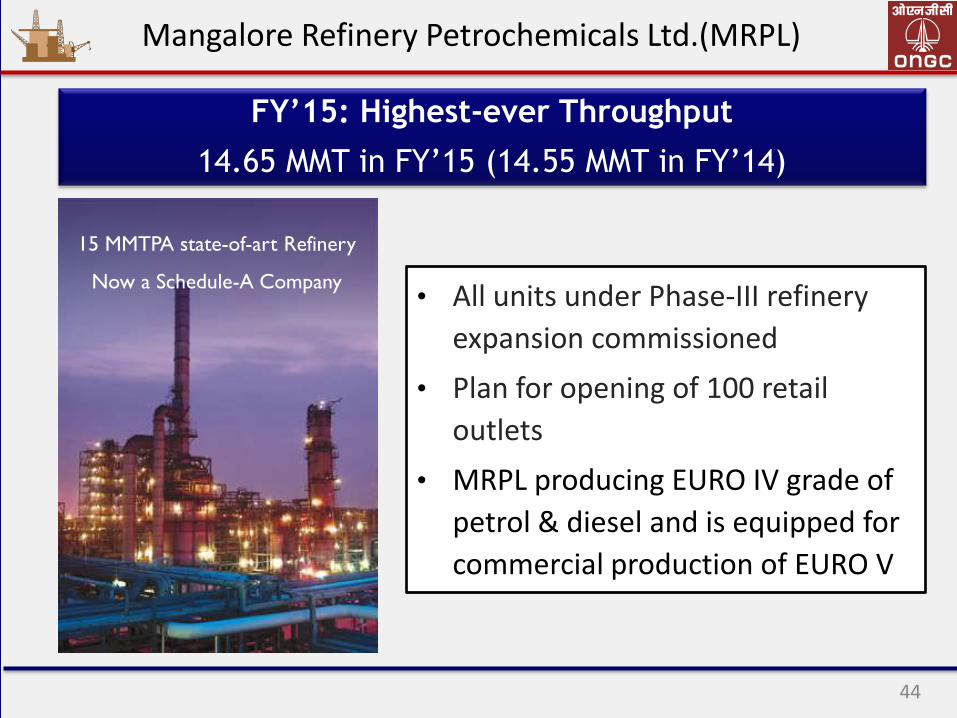
15 MMTPA state-of-art Refinery
Now a Schedule-A Company
FY’15: Highest-ever Throughput
14.65 MMT in FY’15 (14.55 MMT in FY’14)
• All units under Phase-III refinery
expansion commissioned
• Plan for opening of 100 retail
outlets
• MRPL producing EURO IV grade of
petrol & diesel and is equipped for
commercial production of EURO V
MRPL Financials
45
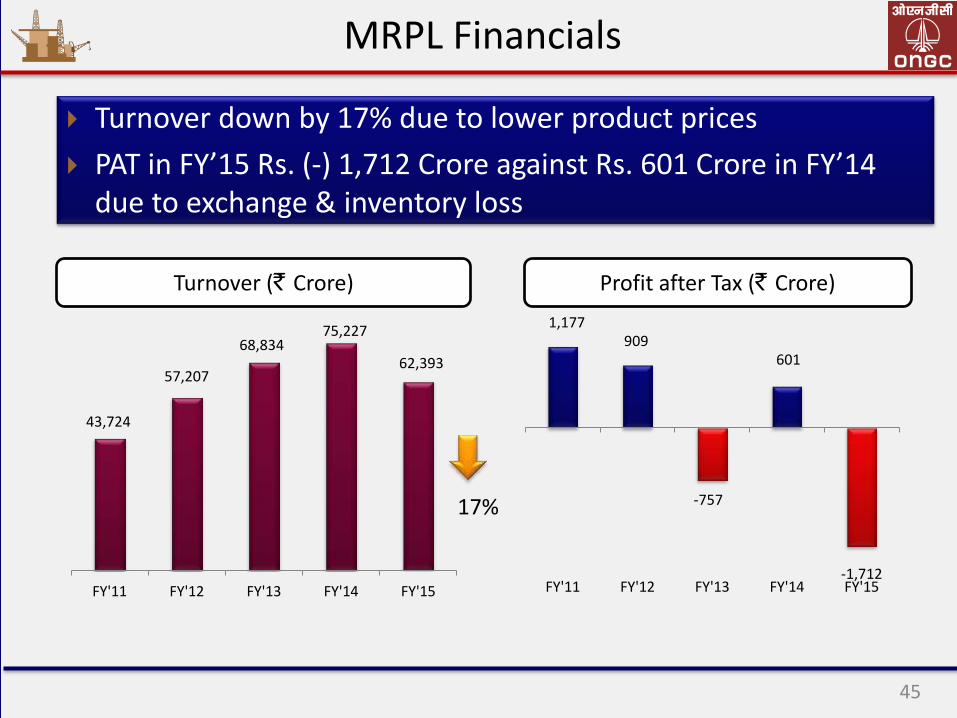
Turnover down by 17% due to lower product prices
PAT in FY’15 Rs. (-) 1,712 Crore against Rs. 601 Crore in FY’14 due to exchange & inventory loss
Turnover (` Crore) Profit after Tax (` Crore)
43,724
57,207
68,834 75,227
62,393
FY'11 FY'12 FY'13 FY'14 FY'15
1,177 909
-757
601
-1,712 FY'11 FY'12 FY'13 FY'14 FY'15
17%

Project cost: ` 6,875 Crore
Aromatic Petrochemical Complex producing Paraxylene & Benzene
Equity Structure*: MRPL-51%; ONGC-49%
Now a subsidiary of MRPL – synergy between MRPL & OMPL
46 @ MRPL
ONGC Mangalore Petrochemicals Ltd. (OMPL)
Benzene & Para-xylene production started – October 2014
* wef 28th Feb 2015
Naphtha & Aromatic streams
Feedstock@
Para-xylene: 914,000 TPA Benzene: 283,000 TPA
Products
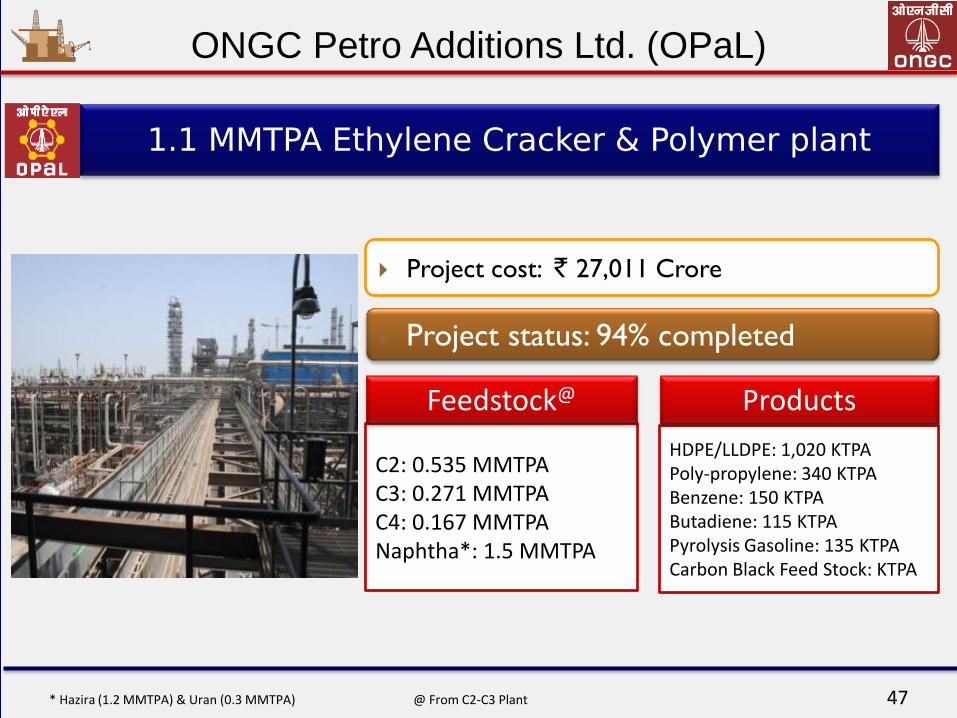
Project cost: ` 27,011 Crore
1.1 MMTPA Ethylene Cracker & Polymer plant
47
Project status: 94% completed
* Hazira (1.2 MMTPA) & Uran (0.3 MMTPA) @ From C2-C3 Plant
ONGC Petro Additions Ltd. (OPaL)
C2: 0.535 MMTPA C3: 0.271 MMTPA C4: 0.167 MMTPA Naphtha*: 1.5 MMTPA
Feedstock@
HDPE/LLDPE: 1,020 KTPA Poly-propylene: 340 KTPA Benzene: 150 KTPA Butadiene: 115 KTPA Pyrolysis Gasoline: 135 KTPA Carbon Black Feed Stock: KTPA
Products
48
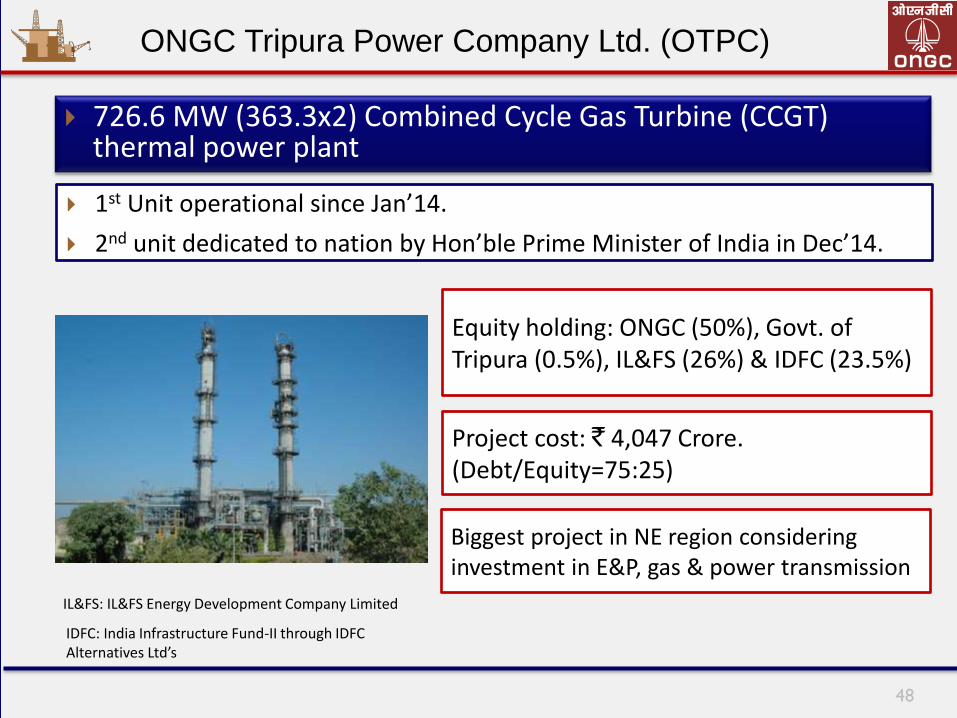
726.6 MW (363.3x2) Combined Cycle Gas Turbine (CCGT) thermal power plant
Equity holding: ONGC (50%), Govt. of Tripura (0.5%), IL&FS (26%) & IDFC (23.5%)
ONGC Tripura Power Company Ltd. (OTPC)
IL&FS: IL&FS Energy Development Company Limited
IDFC: India Infrastructure Fund-II through IDFC Alternatives Ltd’s
1st Unit operational since Jan’14.
2nd unit dedicated to nation by Hon’ble Prime Minister of India in Dec’14.
Project cost: ` 4,047 Crore. (Debt/Equity=75:25)
Biggest project in NE region considering investment in E&P, gas & power transmission

Commitments 6

50
Focus Areas
Health care
Entrepreneurship devl.
Infrastructure devl.
Environment protection
Promotion of artisans
Education
Water management
Care for differently abled
Women empowerment
Promoting sports
11
6.0
5
16
9.5
4
16
9.0
4
26
8.8
0
21
9.0
3
12
1.0
8 26
3.4
3
34
1.2
5 4
95
.23
0.00
0.50
1.00
1.50
2.00
2.50
0
100
200
300
400
500
600
FY'07 FY'08 FY'09 FY'10 FY'11 FY'12 FY'13 FY'14 FY'15
Pe
rce
nta
ge o
f P
AT
Rs.
Cro
re
CSR Expenditure Rs.2,163 Crore in last 9 years
ONGC pursuing major projects - setting up Educational Institutes, Hospitals, Wind farm
2% of PAT for CSR activities
Caring society

51
Integrity Pact was signed with Transparency India Ltd. on 1st July’05
A first by any Indian company
ONGC ranked 26th among 124 global companies by ‘Transparency International’ for ethical & transparent business practices
Source: 'Transparency in corporate reporting: Assessing the world's largest companies’ Report 2012‘, Transparency International
ONGC: Acclaimed for Transparency
ONGC – one of the only two companies and the only PSU to feature in the highly prestigious list
The assessment focused on three parameters - reporting on anti-corruption programs, organizational transparency and country by country reporting.
ONGC ranks above several oil majors and NOCs
52
2014
ONGC ranked 217 in Newsweek Green Rankings 2014 Global 500 list (ranked 386th in the previous edition of the rankings)
UNFCCC (United Nations Framework Convention on Climate Change)
ONGC registers one of the largest CDM project in world on OTPC for an annual CER of 1.6 m with UNFCCC.
12 projects registered with UNFCC, highest by single entity. Issued 2,69,029
CERs (Certified Emission Reductions).
Sustainability

53
Among only two companies from India in the list
Only PSU to figure in the list
(Based on the survey of the identified respondents)
# 3 E&P Company in the World
# 21 Energy Company in the World (Based on Asset, Revenue, Profit & ROCE)
# 357 by Revenue among global 500 companies ‘Randstad Award
2013’ for Most
Attractive
employer in
Energy Sector in
India
Fortune Global 500 (2014)
October, 2014
Fortune World’s most Admired Companies 2014
Globally acclaimed
# 424 by Revenue among global 500 companies
Global 2000 list 2014
# 183 in the Forbes Global 2000 list of world's
biggest companies. (Based on Sales, Profit, Assets, Market
Value).
Recognitions
54
Gold Trophy of SCOPE Meritorious Award for Corporate
Social Responsibility & Responsiveness
ONGC won five safety awards in different categories and
one individual award instituted by Oil Industry Safety
Awards (OISD), MoP&NG
SCOPE Award for Excellence & Outstanding contribution
to the Public Sector Management
ONGC clinched 3 prestigious awards in PetroFed Oil &
Gas Industry awards 2012 including the award for
‘Exploration & Production Company of the year’
Rashtriya Khel Protsahan Puruskar from Hon’ble
President of India – Aug’14
Thank You