Embed Size (px)
Citation preview
Media-Driven High Frequency Trading:
Evidence from News Analytics
Bastian von Beschwitz*
INSEAD
Donald B. Keim**
Wharton School
Massimo Massa***
INSEAD
October 2, 2013
Abstract
We investigate whether providers of high frequency media analytics affect the stock market. This
question is difficult to answer as the response to news analytics usually cannot be distinguished from the
reaction to the news itself. We exploit a unique experiment based on differences in news event
classifications between different product releases of a major provider of news analytics for algorithmic
traders. Comparing the market reaction to similar news items depending on whether the news has been
released to customers or not, we are able to determine the causal effect of news analytics on stock prices,
irrespective of the informational content of the news. We show that coverage in news analytics speeds up
the market reaction by both increasing the stock price update and the trading volume in the first few
seconds after the news event. Such coverage also increases prices if the content of the news is positive.
Placebo tests and econometric robustness checks, either based on difference-in-difference specifications
or different samples, confirm the results. The fact that a provider of media analytics impacts the market in
a separate and distinct way from the underlying information content of the news has important normative
implications for the regulatory debate.
JEL classification: G10, G12, G14
Keywords: High Frequency Trading, News Wires, Textual Analysis, Market Reaction
* Bastian von Beschwitz, INSEAD, Finance Department, Bd de Constance, 77305 Fontainebleau Cedex, France, tel. +33 638 027
859, email: [email protected], website: www.beschwitz.com (corresponding author).
** Donald B. Keim, Wharton School, University of Pennsylvania, Philadelphia, PA 19104; [email protected]
*** Massimo Massa, INSEAD, Finance Department, Bd de Constance, 77305 Fontainebleau Cedex, France, tel. + 33-(0)160-
724-481, email: [email protected]
We are grateful to RavenPack for providing their data, and Malcolm Bain in particular for his expertise on different RavenPack
releases. Thanks also to the technical personnel at WRDS, especially Mark Keintz, for making the construction of the intraday-
market indexes possible. We acknowledge the financial support of the Wharton-INSEAD Center for Global Research and
Education. All remaining errors are our responsibility.
1
In recent years, sophisticated traders in financial markets have increasingly used new sources of
information such as “sentiment” indicators derived from news wire articles. Such news analytics are
computed by computer algorithms and can tell traders within milliseconds whether an article is positive or
negative. In parallel with this, the growth of computerized trading has accelerated the process of
accessing such information and increased the speed with which it is incorporated into stock prices. Access
to such low-latency information can provide a competitive advantage to its users, which are mainly high
frequency and algorithmic traders (e.g., Hendershott and Riordan, 2009, Hasbrouck and Saar, 2013,
Baron, Brogaard, Kirilenko, 2012, Brogaard, Hendershott, Riordan, 2012, Boehmer, Fong, and Wu 2012).
However, inaccurate low-latency signals can lead to unintended consequences when algorithms
automatically initiate trades based on false information. In April 2013, an incorrect twitter feed about a
White House explosion caused a mini flash crash. Some quickly blamed algorithmic trading for the
reaction, while others argued that human traders were mainly responsible.1 In any case, news reading
algorithms may be more likely to misinterpret news than human traders.
In July 2013, New York State Attorney General Eric Schneiderman rebuked Thomson Reuters for
selling access to key economic survey data two seconds early to high-frequency algorithmic traders.
Unlike the early release of such economic survey data, news analytics are based on publicly available
news. Therefore, they constitute a “fairly earned” advantage. However, since news analytics help to trade
on public information faster, they give a trader a similar advantage as an early access to private
information. In either case, an important question is whether quick-triggered trading initiated by such
low-latency information has an impact on the market that is distinct from the underlying informational
content of the news. That is, are there potentially distortionary price effects induced by high frequency
trading based on news analytics? It seems that only the existence of such distortions should justify
regulatory intervention.
This question is very difficult to answer as the response to news analytics normally cannot be
distinguished from the reaction to the news itself. We address this identification issue by exploiting a
unique experiment provided by differences in product versions of a major provider of news analytics.
Because this provider has improved the sophistication of its technology over time, there are differences
between older and newer versions. We use the back-filled analytics of the new version to proxy for the
informational content of the news, while traders reacted to the old version that was released at the time.
The differences between the old and new version enable us to study the causal impact of news analytics
1 See for example “The Trading Robots Really Are Reading Twitter”- http://finance.yahoo.com/news/trading-robots-really-reading-twitter-124443495.html and “#hashcrash: The anatomy of an investment panic” http://goinfront.com/blog/article/497
2
on stock prices. While such differences were rare in a relative sense (roughly 3%), their absolute number
of 24,963 is high enough to allow for tests that have sufficient power.
The provider of news analytics in our study is called “RavenPack”. It analyzes all articles on the Dow
Jones Newswire with a computer algorithm and delivers article-level metrics to its users (mostly high
frequency traders and hedge funds). The latency – i.e. the time from the release of the Dow Jones
Newswire to the release of the RavenPack metrics – is approximately 300 milliseconds. RavenPack
determines which companies are mentioned in the article, how relevant the article is to the company and
reports different sentiment indicators indicating whether the article is good or bad news for the company.
RavenPack is very skilled in identifying the relevance and sentiment of an article: We find that highly
relevant articles, which are positive (negative) are followed by positive (negative) stock returns, while
there is almost no reaction to articles with a low relevance score.
Since the release of the service in April 2009, RavenPack has been constantly upgrading and
improving its technology. There have been three versions improving the technology, the most recent of
which was released at the end of our sample period, September 10, 2012. RavenPack has provided us with
data from each of the release-specific products, back-filled to February 2004. Thus, we have access to the
news analytics which were passed on to traders (old versions) as well as the one best proxying for the
informational content of the news (the most recent version). We focus on differences in the relevance
score of an article for a certain company. These differences are due to improved technology such as using
executives and ticker symbols to determine company references and identifying more event types. We
define three classification categories: High relevance articles Released as High relevance articles (HRH);
Low relevance articles Released as High relevance (LRH); High relevance articles Released as Low
relevance articles (HRL). HRH and HRL articles have the same informational content according to the
most recent version of RavenPack, but only the HRH articles were consistently released to the market –
i.e., analysis based on current technology is consistent with the release based on earlier technology.
Comparing between the two groups allows us to estimate the causal effect of RavenPack on the market.
We investigate whether coverage in RavenPack increases the speed at which the market reacts to
news. Indeed, we find that the market’s speed of reaction, defined both in terms of absolute stock returns
and trading volume concentrated in the first 5 seconds compared to the total reaction over 120 seconds, is
positively and significantly greater for relevant articles that were released as highly relevant (HRH) than
for those that the old technology labeled as having no relevance or a low relevance (HRL). The coverage
of an article in RavenPack increases the speed of reaction by 1.3 percentage points or 10% relative to the
mean in the case of absolute returns and by 0.5 percentage points or 9% relative to the mean in terms of
trading volume.

3
One concern in this set-up is that the two article categories (i.e., HRH and HRL) do not contain
articles with the same informational content, and that the HRH articles are systematically more relevant.
To address this issue, we use the fact that RavenPack has back-filled the data of all versions up to
February 2004. If the two categories generally have different informational content, then there should be a
difference in stock price reaction before RavenPack went live. However, we do not find a statistically
significant difference during the sample period before RavenPack went live. Moreover, we can show that
the stock price reactions to HRH and HRL articles start to diverge at the moment when RavenPack is
released and increases as more and more algorithmic traders subscribe to the service.
Next, we focus on stock returns and ask whether the market reaction to RavenPack is “directional”.
We find that the sentiment direction of an article as determined by RavenPack predicts the stock price
reaction to the article better, when RavenPack consistently identifies the article as having high relevance.
The difference in stock price reaction between HRH and HRL articles is 0.5 basis points during the first 5
seconds after the announcement, or approximately 19.5% per day. The effect is almost identical in the
case of market-adjusted returns and industry-adjusted returns. Again, a placebo test does not show a
statistically significant effect during the period before RavenPack went live.
We also provide a series of robustness checks. The first is a difference-in-difference approach.
Consistent with our main results, we find a significant increase in the difference between the effects of
HRH and HRL articles in both the speed of reaction and turnover share after RavenPack went live. The
results of this test deliver confirming evidence.
Second, we test for the robustness of our results to the definition of the placebo sample. Our sample
for the placebo tests referenced above is February 2004 - April 2009, so one might be concerned that
those results are unduly influenced by the inclusion of the financial crisis. Therefore, as an additional
robustness test, we re-estimate the same specifications as before for the period from February 2004 to
December 2007. This pre-crisis period compares the impact of RavenPack under market conditions more
similar to those that existed post-crisis. Also this alternative test fails to find evidence of a difference
between HRH and HRL articles before RavenPack went live.
Finally, we consider the sample of low relevance articles that have been released as having high
relevance (LRH) and compare its market reaction to articles that have been consistently released as
relevant (HRH). We find that articles classified as LRH have a short term impact on returns, and start
mean-reverting after 30 seconds on average, while HRH articles have a lasting stock price impact. This
suggests that the market temporarily reacts to false positives, or “false” information, realizes its
inaccuracy and quickly corrects. We exploit this feature and test how well the sentiment direction of an
article predicts the 5-second return reaction to an article depending on whether the article is truly relevant
4
or not. After the introduction of RavenPack, we find no evidence of a difference in the stock price
reaction, while HRH articles have a larger effect before. This suggests that being covered as highly
relevant in RavenPack can give a low relevant article the short-run stock price reaction of a relevant
article.
Overall, these and additional robustness tests confirm our findings that RavenPack itself has a
significant impact on the market in terms of market speed of reaction, defined both in terms of absolute
stock returns and trading volume. This effect goes beyond the underlying influence of the news itself. The
results do not appear to be due to spurious correlation or other confounding effects. Importantly, our
results have normative implications relating to recent discussions about the regulation of high-speed
sources of information and the effects of algorithmic trading. They show that news analytics allow the
market to incorporate information more quickly and be more efficient.
A paper close to ours is Riordan, Storkenmaier, Wagener, and Zhang (2013) who investigate how
markets react to Reuters News. They use Reuters News Sentiment Score data for the period 2005-2008,
and market data from the Canadian stock exchange and Thompson Reuters Tick History. However, their
goal is not to assess the role of the media provider nor do they focus on discrepancies between different
releases that would allow them to disentangle the causal impact of media reporting from the impact of the
events being reported.
Our results contribute to two major strands of literature. First, we contribute to the literature on
media. In this literature there has been an intensive debate on the causal impact of media coverage on the
stock market (Chan, 2003, Tetlock, 2007, Fang and Peress, 2009, Dougal, Engelberg, Garcia and Parsons,
2011, Peress, 2011). The endogenous nature of the media–market relationship makes proving a causal
link difficult because unobservable factors that might influence such coverage decisions also affect
investor behavior (Engelberg and Parsons, 2011). Methods to address this endogeneity issue include
exogenous scheduling of journalists (Dougal, Engelberg, Garcia, and Parsons, 2011), local media
coverage and its delay due to extreme weather (Garcia and Parsons, 2011) and newspaper strikes (Peress,
2013). We add to this literature by studying the effect of media coverage on high frequency trading
algorithms rather than private investors. Typically, this debate is considered academic and of limited
policy relevance, but it becomes more important in our setting and in a regulatory environment that is
increasingly focused on news analytics services for high-frequency traders.
Second, we contribute to the literature on financial market microstructure and the manner in which
the release of news affects market variables, and the speed of adjustment of stock prices to news (e.g.,
Hendershott and Riordan (2009), Gross-Klugmann and Hautsch (2011), Baron, Brogaard and Kirilenko
(2012), Boudoukh, Feldman, Kogan and Richardson (2012), Brogaard, Hendershott and Riordan (2012),
5
Boehmer, Fong, and Wu (2012), and Clark (2013)). A new strand of this literature has more recently
focused on algorithmic trading. For example, Hasbrouck and Saar (2013) generate a new measure of low-
latency activity that can be constructed from publicly-available NASDAQ data. They identify “strategic
runs” of trades that are connected by less than 100 milliseconds and show that high-frequency trading
improves traditional market quality measures. We contribute to this strand by confirming that high-
frequency traders and algorithmic traders react rapidly to low-latency measures of market sentiment
supplied by providers of news analytics.
The remainder of the paper is organized as follows. Section I describes the sample and the main
variables of interest. Section II provides the main results. Section III provides further econometric
robustness checks. The paper ends with a brief conclusion.
I. Data, Variable Definitions, and Test Design
The data used in this paper are derived from three sources: Data on news releases come from RavenPack;
intraday stock market data come from TAQ; and daily stock market data come from CRSP. A detailed
description of the data sources and variable construction follows, and a summary of the variables is
provided in Appendix 1.
A. RavenPack – Definition of Variables and Test Design Considerations
RavenPack provides real-time news analytics based on the Dow Jones Newswire. This service analyzes
all the articles on the Dow Jones Newswire with a computer algorithm and delivers article-level relevance
and sentiment metrics to its users. It determines which companies are mentioned in the article, how
relevant the article is to the company and reports different sentiment indicators about whether the article
is good or bad news for the company. The latency – i.e. the time from the release of the Dow Jones
Newswire to the release of the RavenPack metrics – is approximately 300 milliseconds. RavenPack
claims it has the “timeliest company sentiment indicators in the marketplace.”2 As such, RavenPack is
ideally suited for use by algorithmic news traders, and numerous hedge funds have been subscribers since
its inception.3
We extract from RavenPack the following variables. Article Category is a variable determining the
topic of the article and the role played by the company in the article. For example, Article Category might
be “acquisition – completed – acquirer” for a company announcing the completion of an acquisition of
2 “RavenPack Enables Trading Programs with Sentiment on 10,000 Global Equities,” RavenPack press release from
May 28, 2009. 3 Confidential discussions with RavenPack managers provided us with a very consistent overview of market
penetration, suggesting that major high frequency traders are in fact users of this service.
6
another company or “rating – change – negative – rater” for a rating company that just downgraded
another company. The identification of the news topic is based on a purely algorithmic approach, and a
large percentage of articles cannot be classified in this way. Article Category Identified is a dummy
variable equal to 1 if Article Category is identified by RavenPack, and zero otherwise.
There are two major sentiment scores in RavenPack. The Composite Sentiment Score (CSS) is based
on several individual RavenPack sentiment measures. It takes a value ranging from 100 (positive) to 0
(negative), where 50 is a neutral article. It is available for each article. The Event Sentiment Score (ESS)
is a sentiment index coded in the same way as CSS, but which is available only if the category of the
article can be identified. We use CSS and ESS to create additional variables. Absolute Composite
Sentiment Score is defined as Abs (CSS – 50). Neutral Composite Sentiment Score is a dummy variable
equal to 1 if CSS equals 50, zero otherwise. Absolute Event Sentiment Score is defined as Abs (ESS – 50).
Neutral Event Sentiment Score is a dummy variable equal to 1 if ESS equals 50, and zero otherwise.
Relevance is an index provided by RavenPack that indicates the relevance of an article to the
company. This takes values ranging from 0 (least relevant) to 100 (most relevant). If the type of the article
can be identified and the company plays an important role in the main context of the story – e.g. is an
acquirer or announces a buyback – then the Relevance score is 100. If the company is mentioned in the
title, but the type of article cannot be identified, then Relevance ranges between 90 and 100. If the
company is mentioned, but plays an unimportant role, than it gets a low Relevance score. For example, a
bank advising an acquisition typically get a score around 20, while a news agency reporting on the
acquisition gets a 10. We would not expect such articles to affect the bank’s or news agency’s stock
prices very much.
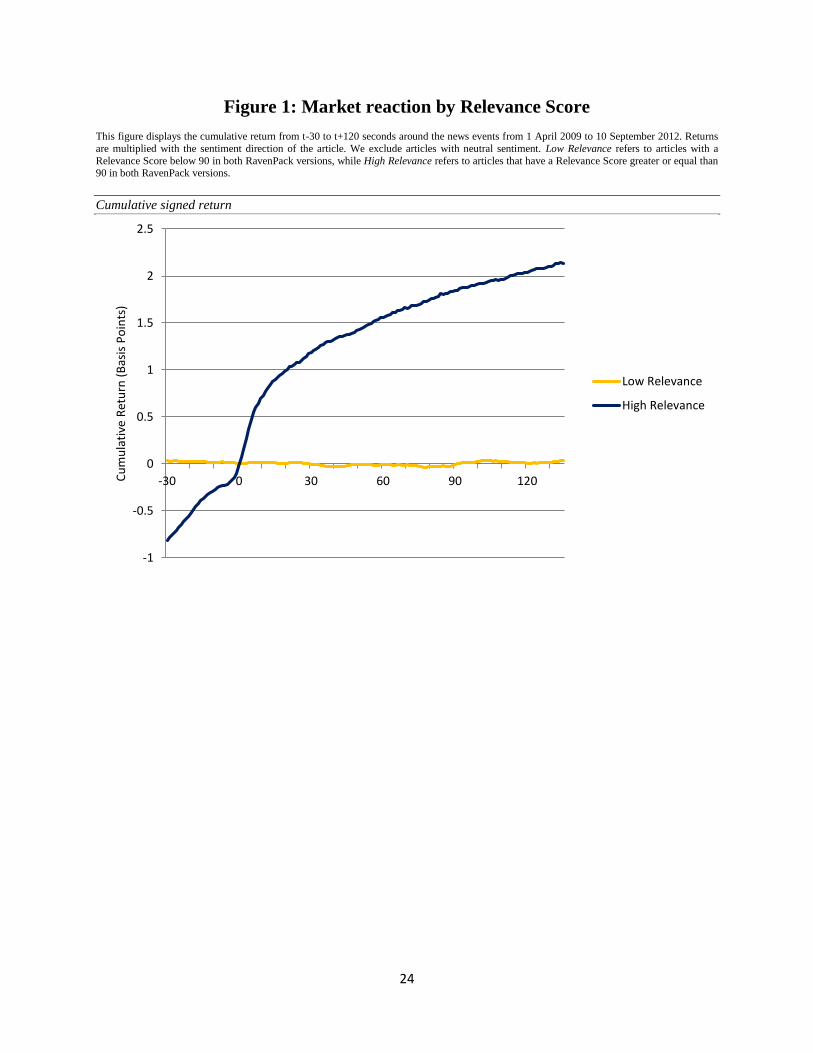
In line with this, RavenPack recommends “filtering for Relevance greater than or equal to 90 as this
helps reduce noise in the signal.” To examine this claim, Figure 1 plots the market reaction to news as a
function of the Relevance Score. We report the cumulative returns from t-30 to t+120 seconds around the
news events from April 1, 2009 to September 10, 2012. We multiply the returns by the sentiment
direction of the article.4 The articles with Relevance greater than 90 do indeed have an important effect on
stock prices, but we find there is no reaction to articles with Relevance below 90. Thus, we will refer to
articles with Relevance below 90 as having low relevance. This analysis suggests that RavenPack is good
in filtering out the relevant news for a company and identifying the sentiment of an article.
4 Sentiment is first based on the Event Sentiment Score (ESS). If ESS is larger 50, this variable is 1, if ESS is
smaller than 50, it is -1. If ESS is missing or 50, we consult the Composite Sentiment Score (CSS). If CSS is greater
than 50 we set this variable to 1, if it is smaller than 50 we set it to -1 if it equals 50, we set it to zero. We exclude
articles with neutral sentiment from this analysis.
7
RavenPack released its first version (v. 1.0) to the market on April 1, 2009,5 and a revised version of
the service (v. 2.0) with additional features on June 6, 2011. The current version (v. 3.0) was released on
September 10, 2012. Importantly, the stock-specific metrics from these three releases can sometimes
differ. RavenPack doesn’t change the overall definition of its algorithm over time, so as not to distort its
customers’ trading strategies which might be based on the specific way a variable is defined. However,
corrections have been made to the way companies are identified in an article and how the relevance of an
article to a company is determined. This means that there are articles which might have been associated
with a company in one RavenPack release, but not in another. These differences will provide the basis for
our tests. We discuss them more detail below.6
RavenPack has provided us with data from each of the release-specific algorithms, which they have
back-filled to February 2004 using the new technology. Thus, we are able to reconstruct the differences
between versions back to 2004.7 Assuming that the most recent version of RavenPack (v. 3.0, which we
hereafter refer to as New RavenPack) is the most accurate, we can infer which articles should have been
marked relevant for which companies. At the same time, using the information in RavenPack v. 1.0 and
RavenPack v. 2.0 (we will refer to those versions as Old RavenPack), we can observe which articles were
originally released to the market as relevant. This difference allows us to study the causal effect of
coverage in RavenPack on the stock market.
For our tests, we focus on the difference between the information traders received in Old RavenPack
and the information they would have received from the improved New RavenPack. Specifically, some
articles were originally labeled as highly relevant when in fact they were not, or were originally labeled as
having low relevance when in fact they were indeed highly relevant. The difference was due to
improvements in the technology, such as using executives and ticker symbols to determine company
references and in identifying new article categories. To capture the differences due to the various releases
of RavenPack, we define several variables. High relevance article Released as High relevance article
(HRH) is defined as an article that was classified as relevant in both Old and New RavenPack. High
relevance article Released as Low relevance article (HRL) is defined as an article with high relevance in
5 Even though the official release date of the RavenPack service was May 2009, some customers had access to the
service already from 1 April 2009. Thus, we refer to 1 April 2009 as the introduction of RavenPack. Before April
2009 RavenPack had a pre-existing service that also released sentiment information on the Dow Jones News Wire.
However, this service was meant more for longer term news analysis, such as charting sentiment over several days.
The prior service was not provided timely enough to be used at high frequency.
6 In addition, the number of companies covered by RavenPack has also increased between releases. There are 156
companies (3%), which are only covered in New RavenPack. We ensure by using company fixed effects that this
difference in coverage is not driving our results. 7 RavenPack 1.0 was actually released on Sept 6, 2010. A predecessor to v.1.0, that was similar to v.1.0, is the
version that was released on April 1, 2009. This predecessor version was not made available to us.
8
New Ravenpack, but low relevance in Old RavenPack. Low relevance article Released as High relevance
article (LRH) is defined as an article that was released to investors as having high relevance, but has low
relevance according to New Ravenapck. This provides us with an ideal experiment to examine how
investors react to media-enhanced news, regardless of the informational content of the news itself. The
main focus of our tests is on articles classified as HRH and HRL. By distinguishing between these two
groups of articles, we are able to estimate the causal effect of RavenPack on the market. Both are highly
relevant to the company – i.e. their informational content should be similar – but only one was classified
as highly relevant at the time of the article.
In Table 1, Panel A, we report the number of article-firm combinations classified as HRH and HRL,
both before and after RavenPack went live. In parenthesis, we report the percentage of the total
observations in that line. In Panel B, we report the number of companies included in articles in each
classification. Since many companies have articles in both classifications, the number of observations in
the two classifications does not add up to the total. The number of articles is not dramatically different
before and after the introduction of RavenPack; indeed, there are fewer HRL articles after the introduction
of RavenPack. This suggests that our results are not driven by a spurious connection between the number
of articles and the existence of RavenPack.
B. Stock Market Data
We use intraday quotes and trade data from TAQ.8 We use the TAQ National Best Bid and Offer (NBBO)
file provided by WRDS for quotes. As a first step, we aggregate the trading volume at the frequency of
one second, and compute second-by-second returns from the end-of-second bid-ask midpoint. We use
bid-ask midpoints rather than trading prices to avoid the effects of bid-ask bounce. Even after this
aggregation, the data for all the stocks in our 8-year sample is too large to be used in a standard panel set-
up due to computational limitations. Because we are interested only in the reaction of the stock prices and
trade volume around the news event, we use the TAQ return and trading volume information around
every news announcement only for companies mentioned in the news announcement.
To control for the overall market movements taking place during this period, we compute a second-
by-second intraday market index from the total TAQ universe. We compute second-by-second returns,
turnover and value-weighted volatility for the market index. We also compute returns for industry-
8 We use the usual filters of excluding all trades with zero size, negative prices, correction code different from 0 and
bid ask quotes where the bid is above the asked.

9
specific indices for the 12 Fama French industries. The details of the index construction are explained in
Appendix 2.9
To control for stock-specific information, we use the CRSP daily stock file and compute the prior
month’s return, volatility, turnover, Amihud illiquidity measure, and market capitalization. Specifically,
market capitalization is the number of shares outstanding multiplied by the closing price on the day prior
to the news release. Average volatility prior month is the average squared return in the 20 trading days
before the article. Average turnover prior month is the mean of daily trading volume divided by shares
outstanding in the 20 trading days before the article. Average illiquidity prior month is the percentile rank
of the mean Amihud (2002) measure for a stock, computed over the 20 days preceding the article, and
measured relative to all other stocks on that day.10 The most illiquid firms are assigned 100, the most
liquid 1.
We employ the following filters: To be included in our sample, a stock must be covered in CRSP and
TAQ, must have SHRCD 10 or 11, must have a beginning of the day stock price of at least $1 and must
have a beginning of the day percentage bid-ask spread of less than 10%.11 We exclude articles that occur
outside trading hours or in the first or last 20 minutes of trading in the day. To avoid distortions from
overlapping windows around articles, we exclude stale news defined as articles for which the company
had an article in the prior 15 minutes. We also exclude four companies that appear in articles mainly as
information providers: McGraw-Hill, NASDAQ, CME and Moody’s. Because we need an initial bid-ask
midpoint to compute a first return and because we want to avoid a stock’s turnover influencing the stock
price we measure, we use seconds t−480 to t−1 as a burn-in period. Only articles for which the stock has
a quote in those 8 minutes before the article are included in our analysis.
The final sample consists of 321,912 article-firm combinations, starting with the release of
RavenPack v.1.0, over the period April 1, 2009 to September 10, 2012. In Panel A of Table 2, we report
descriptive statistics for all our variables for the combined sample of articles classified as HRH and
articles classified as HRL. In Panel B we analyze the difference between the two groups. For this purpose,
we regress each article characteristic on a dummy variable equal to 1 if the article is HRH (D(HRH)) as
well as Relevance, Category, Hour and Date Fixed Effects12. We report the coefficient of D(HRH) as well
9 Thanks to the technical personnel at WRDS, especially Mark Keintz, for making the construction of these indexes
possible. The composition of the industry indexes are from Ken French’s Website. 10 The Amihud measure for stock i in month m is defined as 𝐼𝑙𝑙𝑖𝑞𝑢𝑖𝑑im =
1
Nim ∑
|rit|
dolvolit
Nimt , where rit is the daily
return for stock i on day t; dolvolit is dollar volume for stock i on day t; and Niq is the number days on which stock i
traded during month m. 11 These are the same filters applied to the intraday index construction, which is explained in Appendix 2. 12 These are the fixed effects that we employ in our regressions.

10
as a t-statistic clustered on the firm level. There is no statistical significant difference between the two
groups in terms of firm size, sentiment scores, time since the last article, turnover and illiquidity. The only
significant differences are that HRH articles have a slightly lower return (0.03%) and volatility (1.5%) in
the prior month and that they are covering fewer firms per article. However, these differences are very
small in economic terms (0.05, 0.16 and 0.44 standard deviations). The fact that HRH and HRL articles
are similar alleviates worries that our results are driven by differences in the article types. In addition, we
run placebo tests to confirm that unobservable differences are not driving our results.
II. Main Results
A. Change in Market Reaction to News after the introduction of RavenPack
We want to study how news analytics provided by RavenPack affect the way the market reacts to news
wires. As a first step, we examine whether the market reaction to news is faster after RavenPack was
introduced in April 2009. For this purpose, we focus only on articles that are reported as highly relevant
in both versions (HRH) and compare the market reaction for these articles in the time before and after
RavenPack went live. We study the reaction in terms of cumulative returns within the first 120 seconds
after an article. We multiply returns by the sentiment direction to be able to combine positive and
negative news in one analysis.
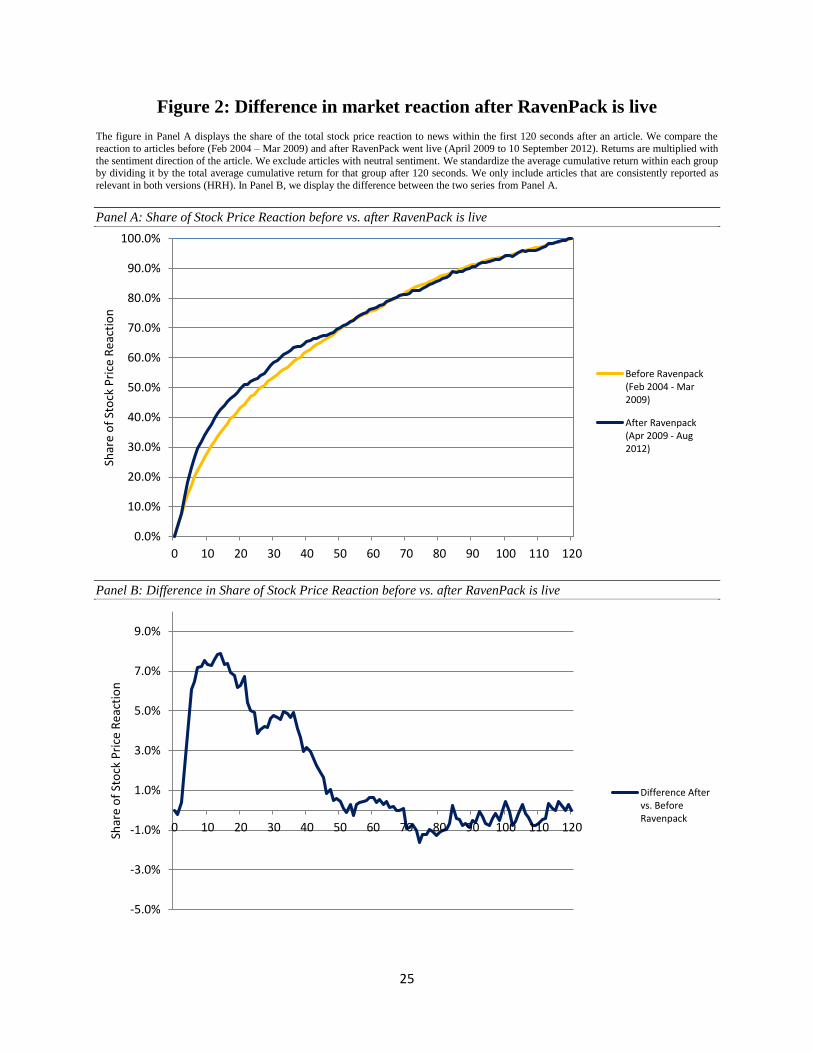
We report the results in Figure 2. Because the news before and after the release of RavenPack differ
in average importance, we standardize the average cumulative returns in each group by the total average
cumulative return for that group after 120 seconds. Thus, the graph shows how much of the total reaction
happens within a certain time period. In Panel A, we compare this share of stock price reaction before and
after RavenPack went live. We see that there is a faster reaction after the introduction of RavenPack.
After 10 seconds, 35.7% of the total reaction is incorporated into prices when RavenPack is live, while it
is only 28.4% before April 2009.
For a better illustration, we display the difference between the two series in Panel B. It is striking to
see that the faster reaction in the post-RavenPack time period occurs mainly in the first 5 seconds after an
article is released, a time period in which only a computer could react to an article. From seconds 5 to 20,
the difference stays more or less constant. After 20 to 30 seconds, it starts to decline and it is reduced to
zero after 60 seconds, a time in which a fast human trader could react to an article. This finding suggests
that the speed of reaction to news increases after April 2009. However, it is far from obvious that this
increase in market efficiency is due to RavenPack. It may also be caused by the overall increase in
11
algorithmic trading or any other phenomenon happening at the same time. To study the effect of
RavenPack on the market more thoroughly, we now investigate differences between RavenPack versions.
B. Market Reaction to High relevance news Released as having Low relevance (HRL)
We begin by focusing on highly relevant news articles. We compare news that has been reported as
having high relevance (HRH) to news that has been reported as having low relevance (HRL). This
comparison allows us to see whether the market underreacts to relevant news when RavenPack does not
classify it as relevant. It is similar to the analysis above, only that whether an article has been covered in
RavenPack is determined not by when it was released, but by how it was classified in Old Ravenapck.
This allows us to control for general time effects. If RavenPack affects stock returns, the market should
react quicker to an article that is reported as highly relevant (HRH).
B.1. Price Reaction
We consider two alternative proxies for market reaction: one based on prices/returns and one based on
trading volume. We start with the price reaction to the news event. To capture this, we define Speed of
Reaction as: Abs(Return t−1,t+5)
Abs(Return t−1,t+5)+Abs(Return t+6,t+120) over the 121 seconds around the news event.13 This
variable measures the amount of the two-minute price change that takes place in the first five seconds
after the release of the news. It is in spirit of DellaVigna and Pollet (2008). It captures the degree of
under-reaction by decomposing the market reaction into its short- and long-term components. The higher
the value of Speed of Reaction, the more the reaction to the news event concentrates in the first few
seconds after the event – i.e., the less under-reaction. We use 5 seconds after the news event as the short
term horizon as this time should be enough to allow algorithmic traders to react to the news, while it is
too short for human traders to react. We use 120 seconds after the news event as the long run horizon as
this is a long enough time for a human trader to read, process and trade on the information in the article
without being excessively long and thus noisy. Returns are based on mid-quote prices.
The main explanatory variable in our regressions is D(HRH). This is a dummy variable that takes the
value of one if the article was released as highly relevant to the market and 0 if it was released as having
low relevane (HRL). It is missing if the article has low relevance in New Ravepack, i.e. we focus only on
high relevance articles. In addition, we include various combinations of control variables and fixed
effects. To control for stock-specific information, we use market capitalization, the prior month’s return,
volatility and turnover measured over the prior month, and our illiquidity measure based on Amihud
13 We use Abs(Return t − 1, t + 5) + Abs(Return t + 6, t + 120) rather than Abs(Return t − 1, t + 120) in the
denominator to constrain the variable between 0 and 1 rather than to allow it to approach infinity as Abs(Return t −1, t + 120) approaches zero.
12
(2002). To control for characteristics of the news announcement, we include the sentiment and article-
specific variables defined in section I.A. Appendix 1 contains a description of all the variables.
We report the results in Table 3. In Panels A to C, we run our main specification during the time in
which RavenPack was active (Apr 1, 2009 – Sept 10, 2012). Speed of Reaction is computed with raw
returns in Panel A, with market-adjusted returns in Panel B, and with industry-adjusted returns in Panel C.
The model is estimated at the article level, thus allowing for both HRH and HRL articles that were
released for the same firm on the same day. This allows us to control for unobserved heterogeneity on the
firm level with firm fixed effects (regressions 1 to 3) and for unobserved heterogeneity on the daily level
with daily fixed effects (regressions 4 to 6). In all specifications we use Relevance, Category and Hour
Fixed Effects.
In regressions 1 to 3, we add daily fixed effects. In regressions 4 to 6, we add company fixed effects
and replace the daily fixed effects with quarter fixed effects and weekday (Monday-Friday) fixed effects.
In regressions 2, 3, 4, and 5 we add fixed effects for the article category (e.g. mergers and acquisitions),
the relevance score (from 90 to 100) and the hour during the day in which the article was released. In
regressions 3 and 6, we add as additional controls the absolute return, turnover and volatility each for
industry and market and for the two horizons from t−1 to t+5 and t−1 to t+120 seconds around the article.
Control variables in Panels B and C are the same as in Panel A, but are omitted for brevity. All standard
errors are clustered at the firm level.
The results show a positive and significant relation between Speed of Reaction and an article being
consistently released as highly relevant (HRH). This result holds across all the different specifications and
samples. It is not only statistically significant, but also economically relevant. If we focus on the main
specification (specification 6), we find that HRH articles increase the speed of reaction by 1.3 percentage
points or 10% relative to the mean in the case of raw returns. For market-adjusted and industry adjusted
returns, the effect is 0.8 and 0.9 percentage points, respectively.
One concern in this set-up is that the two article categories (i.e., HRH and HRL) do not contain
articles with the same informational content, and that the HRH articles are systematically more relevant.
To address this issue, we use the fact that RavenPack has back-filled the data up to February 2004 If the
two categories generally have different informational content, then there should be a difference in stock
price reaction before RavenPack went live. In Panel D, we report the results of this placebo test in the
time period where RavenPack was not yet released to investors (February 1, 2004 ‒ March 31, 2009). In
regressions 1, 3, and 5, we use the specification with daily fixed effects and minimal controls (like
regression 1 in Panels A to C). In regressions 2, 4, and 6, we use the specification with firm fixed effects
and full controls (like regression 6 in Panels A to C). In contrast to the results in Panels A to C for the

13
period when RavenPack was “live”, the placebo test does not show a statistically significant relation
between D(HRH) and the Speed of Reaction.
One remaining concern is that there might be a general trend in the difference of informational
content between HRH and HRL articles, and that this trend is driving our results rather than the causal
effect of RavenPack coverage on the market. To address this concern, we examine the degree of market
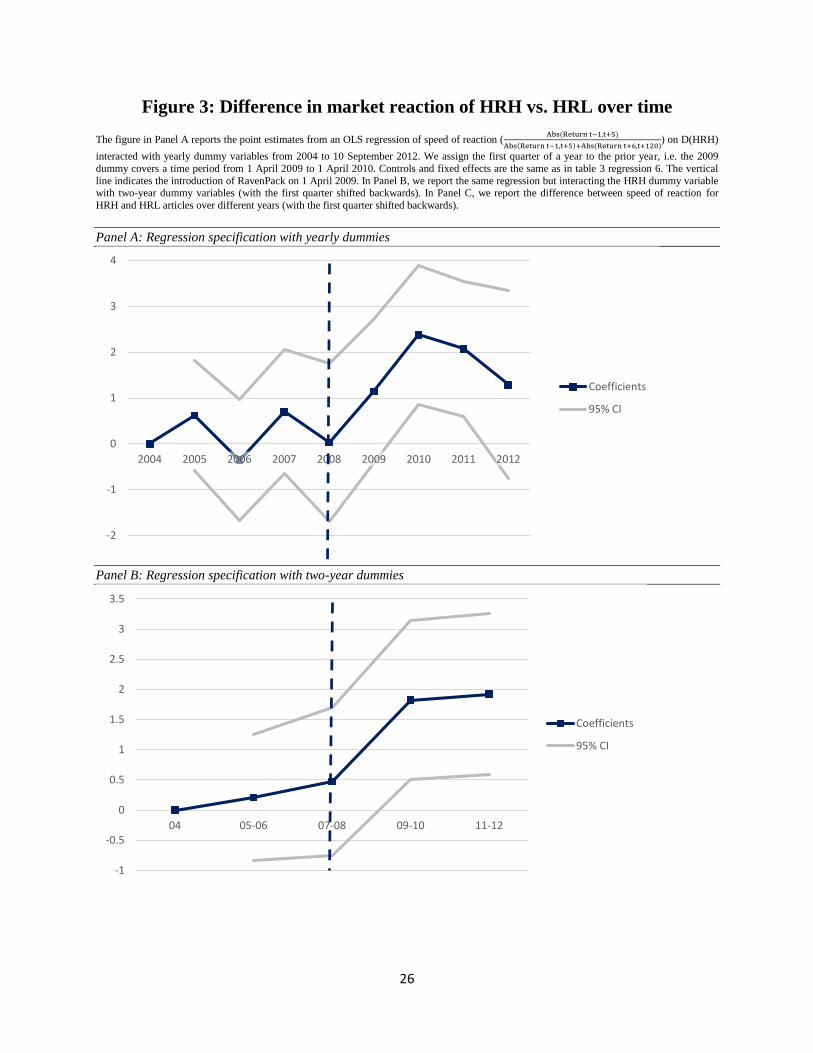
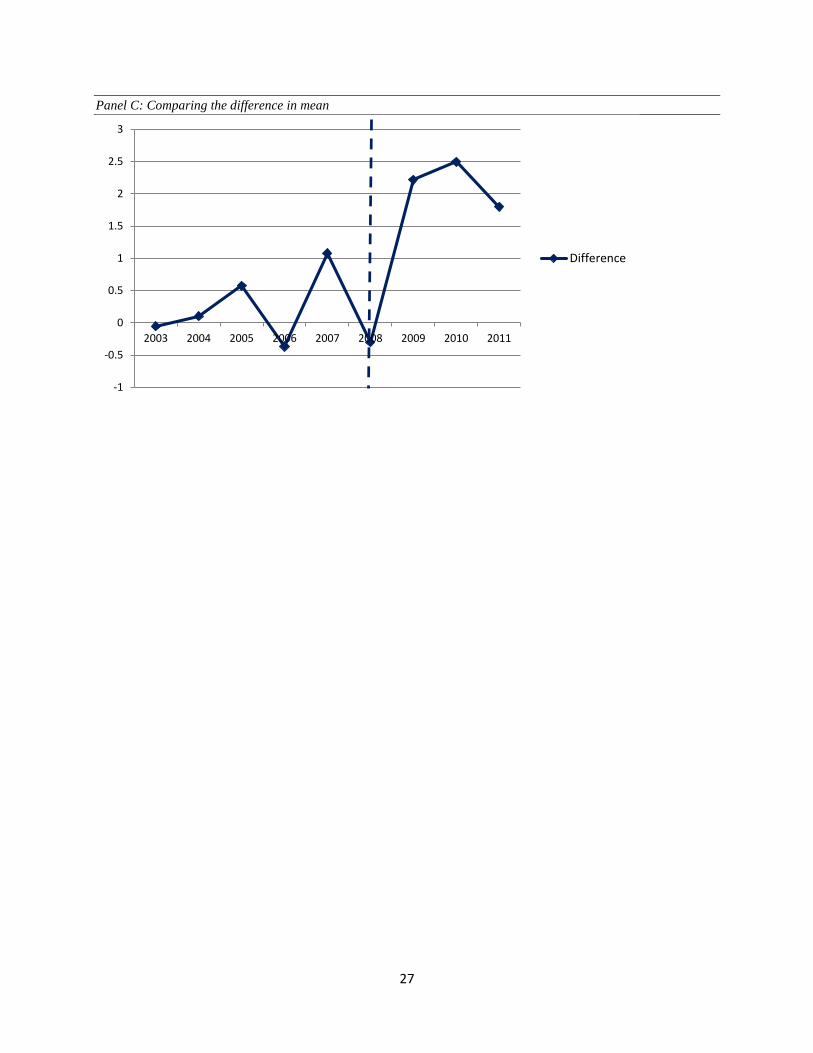
reaction to the news sentiment for different years before and after the introduction of RavenPack. To
implement this analysis, we follow Gormley and Matsa (2011) and plot in Figure 3 the point estimates of
a modified version of regression 6 from Panel A in Table 3. In this modified regression set-up, we allow
the effect of D(HRH) to vary by year. Controls and fixed effects are the same as in the main specification.
Because RavenPack went “live” in the second quarter of 2009, we assign the first quarter of every year to
the prior year. This way, years 2004 to 2008 were before the release of RavenPack, while years 2009 to
2011 were after the release of RavenPack. We report the plot for this specification with one-year dummy
variables in Panel A. In Panel B, we report the same regression but interacting D(HRH) with two-year
dummy variables (with the first quarter shifted backwards as described above). We report 95%
confidence intervals for the coefficients in both panels. In Panel C, we report the simple difference
between Speed of Reaction for HRH and HRL articles without any controls over different years (with the
first quarter shifted backwards).
It is evident in the plots that the release of RavenPack magnifies the reaction to differences in
versions. Before the introduction of RavenPack, the difference between HRH and HRL hovers around
zero and there is no obvious time trend. After the introduction of RavenPack, the difference is much
larger. This suggests the delivery of news analytics by RavenPack has an impact on the market that is
separate and distinct from the underlying informational content of the news. It also suggests that our
results are not driven by a spurious trend.
B.1. Trade Volume Reaction
We now investigate the effect of an article being covered in RavenPack on the market reaction measured
by turnover. We define Turnover Share as: 𝑇𝑢𝑟𝑛𝑜𝑣𝑒𝑟 𝑡−1,𝑡+5
𝑇𝑢𝑟𝑛𝑜𝑣𝑒𝑟 𝑡−1,𝑡+120. This is defined using the same intervals as
Speed of Reaction. It captures the amount of trade volume adjustment that is concentrated in the first 5
seconds after the news event. We regress Turnover Share on D(HRH) as well as control variables defined
as above. As in the previous case, we estimate a panel specification with, Relevance, Category and Hour
Fixed Effects, as well as alternatively Quarter, Weekday and Firm Fixed Effects or Date Fixed Effects.
All standard errors are clustered at the firm level.
14
We report the results in Table 4. In Panel A, we estimate our main specification during the period in
which RavenPack was live (Apr 1, 2009 – Sept 10, 2012). In Panel B, we estimate a placebo test in the
period in which RavenPack was not yet released to investors (Feb 1, 2004 – Mar 31, 2009). As in the case
of stock price speed of reaction in Table 3, we find a strong positive and significant relation between
Turnover Share and D(HRH). This result holds across all specifications. D(HRH) increases Turnover
Share by 0.5 percentage points or 9% relative to the mean. As was the case for Speed of Reaction, the
placebo test does not show any statistically significant effect on trade volume adjustment during the
period before RavenPack went live.
Overall, the combined results on stock price and trade volume reaction provide supporting evidence
for our hypothesis that the delivery of news analytics by RavenPack impacts the market in addition to
reaction to the information content of the news alone.
C. Stock Price Reaction – The Effect of Sentiment Direction
The previous section shows that market reaction to news is greater when it is “intermediated” by
RavenPack. We now investigate whether this effect is also directional. We regress stock returns measured
from 1 second before to 5 seconds after the article on D(HRH), Sentiment Direction and the interaction
between them, as well as a set of control variables. D(HRH) and the control variables are defined as
before. Sentiment Direction captures the sentiment of the article based on RavenPack sentiment indices. It
takes the value 1 for positive sentiment, 0 for neutral sentiment and −1 for negative sentiment. Sentiment
Direction is primarily based on Event Sentiment Score (ESS). If ESS is larger 50 it equals 1, if ESS is
smaller than 50, it equals −1. If ESS is missing or 50, we consult Composite Sentiment Score (CSS). If
CSS is greater than 50, Sentiment Direction equals 1, if CSS is smaller than 50 it equals −1, if CSS equals
50 it equals zero. We adopt the same econometric specification as before, but exclude any sentiment
related control variables as the effect of sentiment will be captured by Sentiment Direction.
We report the results in Table 5. In Panels A to C, we run our main specification during the period
when RavenPack was live (Apr 1, 2009 – Sept 10, 2012). The estimation in Panel A uses raw returns,
while market-adjusted returns and industry-adjusted returns are used in Panels B and C, respectively. We
focus on the interaction between D(HRH) and Sentiment Direction. The results show a positive and
significant relation between returns and the interaction between D(HRH) and positive sentiment. This
result holds across all the different specifications and samples. It is not only statistically significant, but
also economically relevant. If we focus on the main specification (specification 6), we find that articles
classified as HRH when sentiment is positive increase the return by 0.5 basis points or approximately
19.5% per day in the case of raw return. The economic magnitude is almost identical for market-adjusted
15
returns and industry-adjusted returns. As previously, the placebo test indicates there is not a statistically
significant effect on returns during the period before RavenPack was live. These results further confirm
the direct impact of the news analytics over and above the one of the underlying news.
III. Robustness Checks
A. Difference in Difference Specification
In this section, we consider some robustness checks. We begin by considering a difference-in-difference
analysis. Until now we have mainly focused on the significant effect of RavenPack on the stock market
during the period when it was live. The placebo tests in Section II showed no effect for the pre-
RavenPack period. However, it is possible that the placebo tests might not find significant results because
of weak power. Even if this is unlikely as the pre-RavenPack sample is longer than the sample period for
our main tests, we provide a robustness check for the placebo specification. We estimate a difference-in-
difference specification for our entire sample period (February 1, 2004 ‒ September 10, 2012).
We report the results in Table 6. In Panels A and B the dependent variables are Speed of Reaction and
Turnover Share, respectively. In both Panels A and B the explanatory variable of interest is the interaction
between D(HRH) and RavenPack Release. RavenPack Release is a dummy variable taking the value of 1
after the release of RavenPack on April 1, 2009, zero otherwise. In Panel C, the dependent variable is the
return from 1 second before to 5 seconds after the article. The explanatory variable of interest is the triple
interaction between D(HRH), RavenPack Release and Sentiment Direction, where Sentiment Direction is
defined as in Section II.C. In regressions 1 to 3, we include daily fixed effects. In regressions 4 to 6, we
add company fixed effects and replace the daily fixed effects with quarter fixed effects and weekday
(Monday-Friday) fixed effects. In regressions 2, 3, 4, and 5, we add fixed effects for the article category
(e.g. mergers and acquisitions), the relevance score (from 90 to 100) and the hour during the day in which
the article was released. In regressions 3 and 6, we add as additional controls absolute return, turnover and
volatility each for industry and market from t-1 to t+5 seconds around the article. In Panels A and B, we
also include those values for t-1 to t+120 seconds around the article. Firm controls in Panel B and Panel C
are the same as in Panel A, but are omitted for brevity. All the standard errors are clustered at the firm
level.
The results are consistent with our previous findings. They confirm that the effect of the difference
between HRH and HRL articles increases significantly after RavenPack went live. More specifically, the
results in Panels A and B show a strong positive and significant relation between both the Speed of
Reaction and the Turnover Share and the interaction between RavenPack Release and D(HRH). The
16
results in Panel C show an increase in the effect of Sentiment Direction on returns for articles classified as
HRH after RavenPack went live. These results confirm our previous findings that the misclassification by
RavenPack of the type and relevance of the news has an important effect on the market. This is not due to
spurious correlation as the effect is there only when the market was aware of it – i.e., RavenPack had been
released to the market. Before RavenPack was “live”, the misclassification did not affect market behavior.
B. Analysis of the Pre-RavenPack Period, Excluding the Financial Crisis
Our base sample for the Placebo test is Feb 2004 − Apr 2009. However, given that this period includes
the financial crisis, one might be worried that the fact that we do not find significance in the Placebo tests
is related to the financial crisis. To address this issue, we also conduct an additional Placebo test in which
we exclude the financial crisis and just focus on the period from Feb 1, 2004 to Dec 31, 2007. The new
test eliminates the confounding effects of the financial crisis and more directly compares the impact of
RavenPack on prices and trading across similar overall market conditions.
We report the results in Table 7. In Panel A, the dependent variable is Speed of Reaction. In Panel B,
the dependent variable is Turnover Share, and in Panel C the dependent variable is the return from 1
second before to 5 seconds after the article (measured in basis points). The explanatory variable of
interest is D(HRH) in Panels A and B, and the interaction between D(HRH) and Sentiment Direction in
Panel C. All the other variables, as well as the econometric specifications, are the same as before. Across
all the specifications and for all the different dependent variables there is no significant effect associated
with RavenPack articles classified as HRH. This confirms the previous Placebo findings and suggests that
our results are not due to spurious correlation, but are directly related to RavenPack having delivered its
news-related metrics to customers.
C. RavenPack v.1.0 versus RavenPack v.2.0
In our main specification, Old RavenPack included both RavenPack v.1.0 and RavenPack v.2.0. A
concern is that the difference in reaction before and after the release of RavenPack is driven by changing
from v.1.0 to v.2.0 in July 2011. Therefore, the next robustness check focuses only on v.1.0. We re-
estimate the same specifications as before, but include only the period when v.1.0 was live, i.e. April 1,
2009 to July 6, 2011. We report the results in Table 8. In Panel A the dependent variable is Speed of
Reaction, in Panel B the dependent variable is Turnover Share, and in Panel C the dependent variable is
the return from 1 second before to 5 seconds after the article (measured in basis points). The main
explanatory variables, as well as controls and fixed effects, are the same as used in Tables 3 and 4. All
specifications confirm the previous results.
17
D. Market Reaction to Low relevance articles Released as High relevance (LRH)
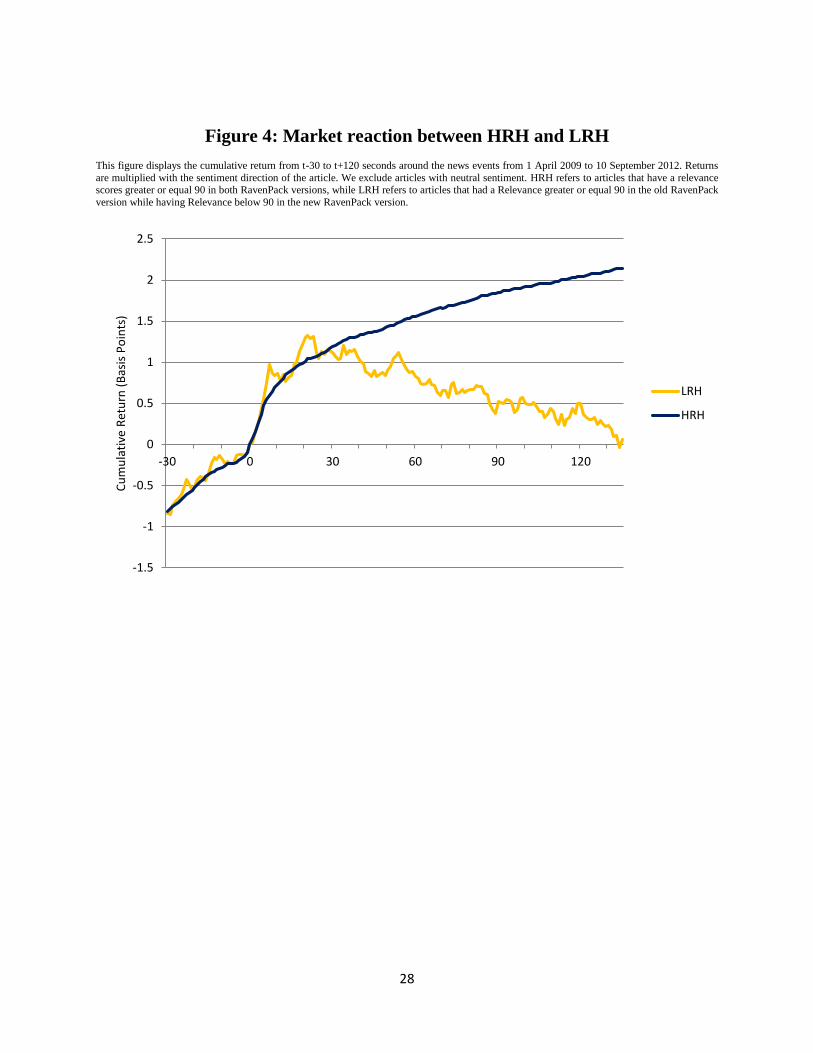
In Figure 4, we compare the market reaction to articles consistently released as relevant (HRH) with those
released as relevant, but having low relevance in New Ravenpack (LRH).14 We focus on the cumulative
return from t−30 to t+120 seconds around the news events. We multiply returns with the sentiment
direction to be able to combine positive and negative news in one analysis. Figure 4 shows that being
classified in Old RavenPack as relevant (LRH) causes a low relevance article to have a very similar short-
run price reaction as a relevant article (HRH) – the market appears to erroneously react to false positives.
However, after approximately 30 seconds – a reasonable time for a fast human trader to process the article
– the stock price reaction to LRH articles starts to mean revert. After approximately 2 minutes, the short-
run reaction to these articles has corrected. In contrast, articles classified as HRH have a longer-term
effect on price, lasting more than two minutes.
Although, as we argued in Section II, the appropriate test is a comparison between articles classified
as HRH and HRL, the evidence in Figure 4 suggests a comparison between articles classified as HRH and
LRH. We define True Article as a dummy variable equal to 1 if an article is consistently released as
relevant in both RavenPack versions (HRH) and equal to zero if it is a low relevance article that was
released as being highly relevant (LRH). This allows us to investigate how well the sentiment direction of
an article predicts the 5-second return reaction to an article depending on whether the article is truly a
relevant article or not. We regress the return from 1 second before to 5 seconds after the article on
Sentiment Direction, True Article, the interaction between True Article and Sentiment Direction and a set
of control variables. The other variables are defined as in the previous specifications.
We report the results in Table 9. In Panels A to C, we estimate our main specification during the time
in which RavenPack was “live” (Apr 1, 2009 – Sept 10, 2012). In Panel A the dependent variable is the
raw stock return; in Panels B and C the dependent variable is the market-adjusted and industry-adjusted
return, respectively. Control variables and fixed effects are the same as in the tables above.
In line with our expectations, the results show no difference in the stock price reaction. If anything,
LHR articles have a larger price reaction. One might be worried that LRH and HRH articles are generally
very similar. Therefore, we provide a test in Panel D where we repeat the analysis before the introduction
of RavenPack. Without the attention-boosting effect of RavenPack, HRH articles show a significantly
stronger market reaction than LRH articles. This suggests that RavenPack coverage makes the short run
14 More specifically, we exclude all the articles with neutral sentiment. HRH refers to articles that have been
released as highly relevant in both versions, i.e. that have a relevance scores greater or equal 90 in both RavenPack
versions, while LRH refers to articles that had a Relevance greater or equal 90 in the old RavenPack version while
having Relevance below 90 in the new RavenPack version.
18
reaction to an irrelevant article look like that of a relevant article. The economic effect based on
regression 6 is around 0.3 basis points (or 11.7% per day).
Overall, our robustness tests confirm our findings that RavenPack has an impact on the market that is
separate and distinct from the underlying informational content of the news. The findings are not due to
spurious correlation or other confounding effects.
Conclusion
We study how providers of media analytics affect the stock market and, in particular, how their existence
affects the stock market’s reaction to news. We consider a natural experiment based on differences in
classifications between different product versions of RavenPack, a major provider of news analytics for
algorithmic traders. Comparing the market reaction to similar news items depending on whether the news
has been released to customers or not, we are able to determine the causal effect of news analytics on
stock prices, irrespective of the informational content of the news. Specifically, we study articles that are
highly relevant according to the most recent version of Ravenpack. Among these articles, some were not
classified as relevant in the old version released to the market – i.e. they were either not at all associated
with the company (because the company was not identified), or the article was classified as having a low
relevance. We use these differences as a natural experiment to investigate the impact of high-frequency
media analytics on the financial markets.
Our findings show that providers of media analytics, such as RavenPack, can have a significant
impact on the market that is distinct and separate from the information contained in the news. The speed
of adjustment of stock prices and trade volume to news is faster if an article is consistently covered in
RavenPack. The market temporarily reacts to false positives, but then reverts quickly. The market
reaction to RavenPack is “directional” in that the sentiment indicator predicts the direction of the stock
price reaction. A series of econometric robustness checks (e.g., difference-in-difference specifications,
different samples, placebo tests) confirm the results.
Our findings have normative implications in terms of the recent regulatory debate on high-speed
information and the effects of algorithmic trading. They show that there are potentially distortionary price
effects induced by trading based on the provision of high frequency news analytics.
19
References
Amihud, Y., 2002. Illiquidity and Stock Returns: Cross-Section and Time-Series Effects. Journal of Financial
Markets 5, 31–56.
Baron, Matthew, Jonathan Brogaard and Andrei Kirilenko, 2012, The Trading Profits of High Frequency Traders,
Working Paper.
Boehmer, Ekkehart, Kingsley Fong, and Julie Wu 2012, International evidence on algorithmic trading, Working
Paper.
Boudoukh, Jacob, Ronen Feldman, Shimon Kogan and Matthew Richardson, 2012, Which News Moves Stock
Prices, Working Paper.
Brogaard, Jonathan, Terrence Hendershott, and Ryan Riordan 2012, High frequency trading and price discovery,
Working Paper.
Chan, W. S., 2003, Stock price reaction to news and no-news Drift and reversal after headlines, Journal of Financial
Economics, 702, 223-260.
Clark-Joseph, Adam D., 2013, Exploratory Trading, Working Paper.
Della Vigna, Stefano, and Ethan Kaplan, 2007, The Fox News effect Media bias and voting, Quarterly Journal of
Economics 122, 1187–1234.
DellaVigna, S., and Pollet, J., 2009, Investor Inattention, Firm Reaction, and Friday Earnings Announcements,
Journal of Finance, 64, 709-749.
Dougal, Casey, Joseph Engelberg, Diego Garcia and Christopher Parsons, 2011, Journalists and the Stock Market,
Review of Financial Studies, forthcoming.
Engelberg, Joseph and Parsons, Christopher A., 2011, The Causal Impact of Media in Financial Markets, Journal of
Finance.
Fang, Lily H. and Peress, Joel, 2009, Media coverage and the cross-section of stock returns, Journal of Finance, 64,
2023-2052.
Gerber, Alan, Dean Karlan, and Daniel Bergan, 2009, Does the media matter? A field experiment measuring the
effect of newspapers on voting behavior and political opinions, American Economic Journal Applied Economics, 1,
35–52.
Gormley, Todd A., and David A. Matsa, 2011, Growing Out of Trouble? Corporate Responses to Liability Risk,
Review of Financial Studies 24, 2781-2821.
Groß-Klußmann, Axel and Nikolaus Hautsch, 2011, When machines read the news: Using automated text analytics
to quantify high frequency news-implied market reactions, Journal of Empirical Finance, 18, 321-340.
Hasbrouck, Joel and Gideon Saar, 2013, Low-Latency Trading, Journal of Financial Markets, forthcoming.
Hendershott, Terrence and Ryan Riordan 2009, Algorithmic Trading and Information, Working Paper.
Huberman, Gur, and Tomer Regev, 2001, Contagious speculation and a cure for cancer A nonevent that made stock
prices soar, Journal of Finance, 56, 387–396.
Peress, Joel, 2011, The Impact of the Media in Financial Markets: Evidence from Newspaper Strikes, Journal of
Finance, forthcoming.
Riordan, Ryan, Andreas Storkenmaier, Martin Wagener and S. Sarah Zhang, 2013, Public information arrival: Price
discovery and liquidity in electronic limit order markets, Journal of Banking and Finance, 37, 1148-1159.
Tetlock, Paul, 2007, Giving content to investor sentiment The role of media in the stock market, Journal of Finance,
62, 1139–1168.
20
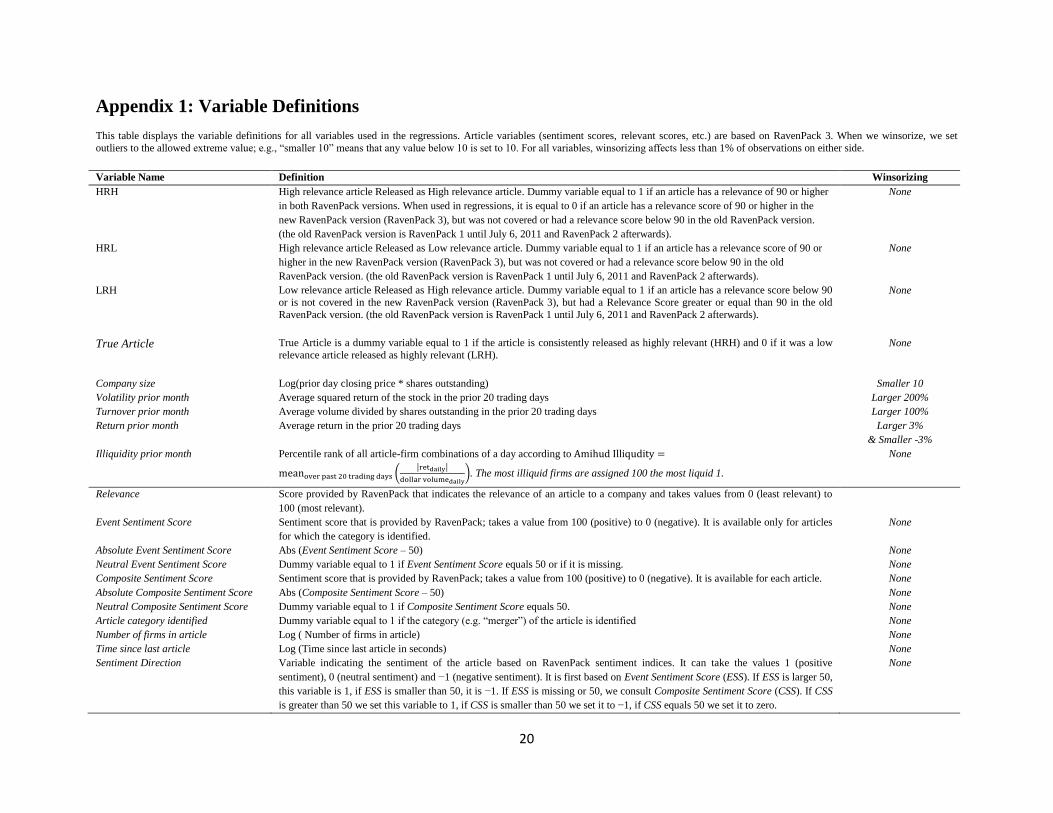
Appendix 1: Variable Definitions
This table displays the variable definitions for all variables used in the regressions. Article variables (sentiment scores, relevant scores, etc.) are based on RavenPack 3. When we winsorize, we set
outliers to the allowed extreme value; e.g., “smaller 10” means that any value below 10 is set to 10. For all variables, winsorizing affects less than 1% of observations on either side.
Variable Name Definition Winsorizing
HRH High relevance article Released as High relevance article. Dummy variable equal to 1 if an article has a relevance of 90 or higher
in both RavenPack versions. When used in regressions, it is equal to 0 if an article has a relevance score of 90 or higher in the
new RavenPack version (RavenPack 3), but was not covered or had a relevance score below 90 in the old RavenPack version.
(the old RavenPack version is RavenPack 1 until July 6, 2011 and RavenPack 2 afterwards).
None
HRL High relevance article Released as Low relevance article. Dummy variable equal to 1 if an article has a relevance score of 90 or
higher in the new RavenPack version (RavenPack 3), but was not covered or had a relevance score below 90 in the old
RavenPack version. (the old RavenPack version is RavenPack 1 until July 6, 2011 and RavenPack 2 afterwards).
None
LRH Low relevance article Released as High relevance article. Dummy variable equal to 1 if an article has a relevance score below 90
or is not covered in the new RavenPack version (RavenPack 3), but had a Relevance Score greater or equal than 90 in the old
RavenPack version. (the old RavenPack version is RavenPack 1 until July 6, 2011 and RavenPack 2 afterwards).
None
True Article True Article is a dummy variable equal to 1 if the article is consistently released as highly relevant (HRH) and 0 if it was a low
relevance article released as highly relevant (LRH). None
Company size Log(prior day closing price * shares outstanding) Smaller 10
Volatility prior month Average squared return of the stock in the prior 20 trading days Larger 200%
Turnover prior month Average volume divided by shares outstanding in the prior 20 trading days Larger 100%
Return prior month Average return in the prior 20 trading days Larger 3%
& Smaller -3%
Illiquidity prior month Percentile rank of all article-firm combinations of a day according to Amihud Illiqudity =
meanover past 20 trading days (|retdaily|
dollar volumedaily). The most illiquid firms are assigned 100 the most liquid 1.
None
Relevance Score provided by RavenPack that indicates the relevance of an article to a company and takes values from 0 (least relevant) to
100 (most relevant).
Event Sentiment Score Sentiment score that is provided by RavenPack; takes a value from 100 (positive) to 0 (negative). It is available only for articles
for which the category is identified.
None
Absolute Event Sentiment Score Abs (Event Sentiment Score – 50) None
Neutral Event Sentiment Score Dummy variable equal to 1 if Event Sentiment Score equals 50 or if it is missing. None
Composite Sentiment Score Sentiment score that is provided by RavenPack; takes a value from 100 (positive) to 0 (negative). It is available for each article. None
Absolute Composite Sentiment Score Abs (Composite Sentiment Score – 50) None
Neutral Composite Sentiment Score Dummy variable equal to 1 if Composite Sentiment Score equals 50. None
Article category identified Dummy variable equal to 1 if the category (e.g. “merger”) of the article is identified None
Number of firms in article Log ( Number of firms in article) None
Time since last article Log (Time since last article in seconds) None
Sentiment Direction Variable indicating the sentiment of the article based on RavenPack sentiment indices. It can take the values 1 (positive
sentiment), 0 (neutral sentiment) and −1 (negative sentiment). It is first based on Event Sentiment Score (ESS). If ESS is larger 50,
this variable is 1, if ESS is smaller than 50, it is −1. If ESS is missing or 50, we consult Composite Sentiment Score (CSS). If CSS
is greater than 50 we set this variable to 1, if CSS is smaller than 50 we set it to −1, if CSS equals 50 we set it to zero.
None
21
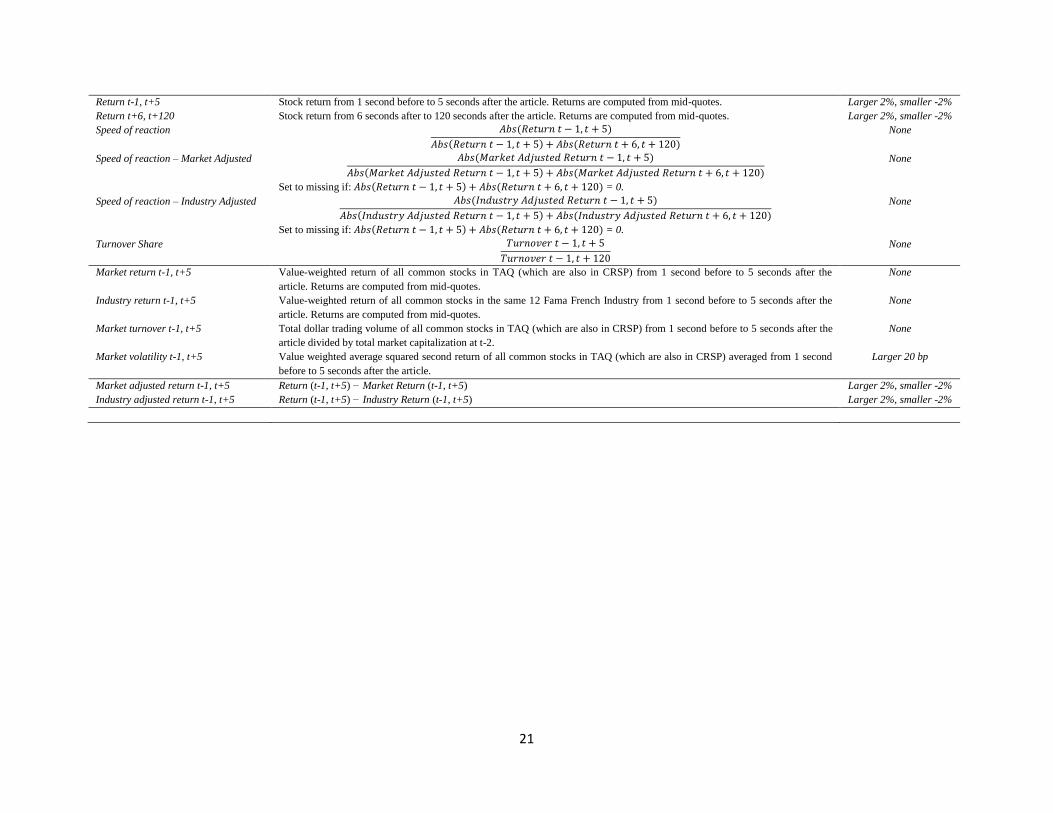
Return t-1, t+5 Stock return from 1 second before to 5 seconds after the article. Returns are computed from mid-quotes. Larger 2%, smaller -2%
Return t+6, t+120 Stock return from 6 seconds after to 120 seconds after the article. Returns are computed from mid-quotes. Larger 2%, smaller -2%
Speed of reaction 𝐴𝑏𝑠(𝑅𝑒𝑡𝑢𝑟𝑛 𝑡 − 1, 𝑡 + 5)
𝐴𝑏𝑠(𝑅𝑒𝑡𝑢𝑟𝑛 𝑡 − 1, 𝑡 + 5) + 𝐴𝑏𝑠(𝑅𝑒𝑡𝑢𝑟𝑛 𝑡 + 6, 𝑡 + 120)
None
Speed of reaction – Market Adjusted 𝐴𝑏𝑠(𝑀𝑎𝑟𝑘𝑒𝑡 𝐴𝑑𝑗𝑢𝑠𝑡𝑒𝑑 𝑅𝑒𝑡𝑢𝑟𝑛 𝑡 − 1, 𝑡 + 5)
𝐴𝑏𝑠(𝑀𝑎𝑟𝑘𝑒𝑡 𝐴𝑑𝑗𝑢𝑠𝑡𝑒𝑑 𝑅𝑒𝑡𝑢𝑟𝑛 𝑡 − 1, 𝑡 + 5) + 𝐴𝑏𝑠(𝑀𝑎𝑟𝑘𝑒𝑡 𝐴𝑑𝑗𝑢𝑠𝑡𝑒𝑑 𝑅𝑒𝑡𝑢𝑟𝑛 𝑡 + 6, 𝑡 + 120)
Set to missing if: 𝐴𝑏𝑠(𝑅𝑒𝑡𝑢𝑟𝑛 𝑡 − 1, 𝑡 + 5) + 𝐴𝑏𝑠(𝑅𝑒𝑡𝑢𝑟𝑛 𝑡 + 6, 𝑡 + 120) = 0.
None
Speed of reaction – Industry Adjusted 𝐴𝑏𝑠(𝐼𝑛𝑑𝑢𝑠𝑡𝑟𝑦 𝐴𝑑𝑗𝑢𝑠𝑡𝑒𝑑 𝑅𝑒𝑡𝑢𝑟𝑛 𝑡 − 1, 𝑡 + 5)
𝐴𝑏𝑠(𝐼𝑛𝑑𝑢𝑠𝑡𝑟𝑦 𝐴𝑑𝑗𝑢𝑠𝑡𝑒𝑑 𝑅𝑒𝑡𝑢𝑟𝑛 𝑡 − 1, 𝑡 + 5) + 𝐴𝑏𝑠(𝐼𝑛𝑑𝑢𝑠𝑡𝑟𝑦 𝐴𝑑𝑗𝑢𝑠𝑡𝑒𝑑 𝑅𝑒𝑡𝑢𝑟𝑛 𝑡 + 6, 𝑡 + 120)
Set to missing if: 𝐴𝑏𝑠(𝑅𝑒𝑡𝑢𝑟𝑛 𝑡 − 1, 𝑡 + 5) + 𝐴𝑏𝑠(𝑅𝑒𝑡𝑢𝑟𝑛 𝑡 + 6, 𝑡 + 120) = 0.
None
Turnover Share 𝑇𝑢𝑟𝑛𝑜𝑣𝑒𝑟 𝑡 − 1, 𝑡 + 5
𝑇𝑢𝑟𝑛𝑜𝑣𝑒𝑟 𝑡 − 1, 𝑡 + 120
None
Market return t-1, t+5 Value-weighted return of all common stocks in TAQ (which are also in CRSP) from 1 second before to 5 seconds after the
article. Returns are computed from mid-quotes.
None
Industry return t-1, t+5 Value-weighted return of all common stocks in the same 12 Fama French Industry from 1 second before to 5 seconds after the
article. Returns are computed from mid-quotes.
None
Market turnover t-1, t+5 Total dollar trading volume of all common stocks in TAQ (which are also in CRSP) from 1 second before to 5 seconds after the
article divided by total market capitalization at t-2.
None
Market volatility t-1, t+5 Value weighted average squared second return of all common stocks in TAQ (which are also in CRSP) averaged from 1 second
before to 5 seconds after the article.
Larger 20 bp
Market adjusted return t-1, t+5 Return (t-1, t+5) − Market Return (t-1, t+5) Larger 2%, smaller -2%
Industry adjusted return t-1, t+5 Return (t-1, t+5) − Industry Return (t-1, t+5) Larger 2%, smaller -2%

22
Appendix 2: Intraday Market and Industry Returns
We compute second-by-second value-weighted average returns, trading volume, and value weighted
average volatility for the market and for 12 industry indices (as defined by Fama and French.) In
constructing these indices, we use information from the CRSP daily file, the TAQ National Best Bid and
Offer (NBBO) file provided by WRDS for second-by-second quotes and the TAQ trades file. We link
TAQ to CRSP using ticker symbols. We include in our sample all stocks that are covered in CRSP and
TAQ and have share codes of 10 or 11 in CRSP. We assign stocks to industry indexes using CRSP SIC
codes (data item SICCD) with lists obtained from Ken French’s website. At the quote and trade level we
apply the following filters: We exclude all trades with zero size, negative prices, TAQ Correction Code
not equal to 0, and bid-ask quotes where the bid is above the ask. In addition, we exclude all quotes where
the bid-ask spread is larger than 30%.
Most stocks do not have quotes available for every second. Some stocks are relatively illiquid and only
have valid quotes every few minutes. To be able to compute the first return of the day, we need past
quotes. The closing quotes of the prior day are problematic in that (1) they often are not prices at which
market makers would actually be willing to trade, and (2) they are informationally “stale” as they do not
incorporate information released overnight. Therefore, we use the time from 9:00 to 9:35 as a burn-in
period and use the last valid bid-ask midquote of this time period as the initial price to compute the first
return. We exclude from the sample for that specific day all stocks that do not have a quote in this time
period. We also exclude stocks for which the midpoint of the initial quote is below $1 and for which this
initial quote has a bid ask spread of more than 10%.15 This way we insure that our index is not driven by
outliers due to large bid-ask spreads.
We compute value-weighted average returns for the market and the 12 Fama French industry indices by
computing the second-to-second change in aggregate market capitalization for the respective samples. We
compute a company’s market capitalization by multiplying the bid-ask midpoint by the shares outstanding
from CRSP.16 We use bid-ask midpoints rather than transaction prices to avoid bid-ask bounce. We
compute aggregate trading volume per second by summing the individual stock dollar trading volume per
second for all stocks in the respective samples. A stock’s trading volume is equal to number of shares
traded during the second multiplied by the transaction prices of the trades. We compute value-weighted
average volatility for the market and for the 12 Fama French industries based on squared second-by-
15 The difference between the cut-off for the initial spread (10%) and the general spread cut-off (30%) is intended.
We only want to include stocks for which a typical spread is below 10% and for these stocks we treat any quote with
a spread above 30% as an outlier that needs to be removed. 16 Since the index composition changes day to day, we are not able to compute an overnight return. This is no
problem as we are only interested in intra-day returns.

23
second returns. The value weights are based on the firm’s market capitalization at the end of the prior day
using the closing price and shares outstanding in CRSP. Individual stock returns used to compute value-
weighted average volatility are based on the second-by-second change in bid-ask midpoints. If there is no
quote for a second, the return is set to 0. If the return is larger than 10%, it is set to 10%. We verify that
all our filters affect only a small number of firms or quotes.
24
Figure 1: Market reaction by Relevance Score
This figure displays the cumulative return from t-30 to t+120 seconds around the news events from 1 April 2009 to 10 September 2012. Returns
are multiplied with the sentiment direction of the article. We exclude articles with neutral sentiment. Low Relevance refers to articles with a
Relevance Score below 90 in both RavenPack versions, while High Relevance refers to articles that have a Relevance Score greater or equal than 90 in both RavenPack versions.
Cumulative signed return
-1
-0.5
0
0.5
1
1.5
2
2.5
-30 0 30 60 90 120Cu
mu
lati
ve R
etu
rn (
Bas
is P
oin
ts)
Low Relevance
High Relevance
25
Figure 2: Difference in market reaction after RavenPack is live
The figure in Panel A displays the share of the total stock price reaction to news within the first 120 seconds after an article. We compare the
reaction to articles before (Feb 2004 – Mar 2009) and after RavenPack went live (April 2009 to 10 September 2012). Returns are multiplied with
the sentiment direction of the article. We exclude articles with neutral sentiment. We standardize the average cumulative return within each group by dividing it by the total average cumulative return for that group after 120 seconds. We only include articles that are consistently reported as
relevant in both versions (HRH). In Panel B, we display the difference between the two series from Panel A.
Panel A: Share of Stock Price Reaction before vs. after RavenPack is live
Panel B: Difference in Share of Stock Price Reaction before vs. after RavenPack is live
0.0%
10.0%
20.0%
30.0%
40.0%
50.0%
60.0%
70.0%
80.0%
90.0%
100.0%
0 10 20 30 40 50 60 70 80 90 100 110 120
Shar
e o
f St
ock
Pri
ce R
eact
ion
Before Ravenpack(Feb 2004 - Mar2009)
After Ravenpack(Apr 2009 - Aug2012)
-5.0%
-3.0%
-1.0%
1.0%
3.0%
5.0%
7.0%
9.0%
0 10 20 30 40 50 60 70 80 90 100 110 120
Shar
e o
f St
ock
Pri
ce R
eact
ion
Difference Aftervs. BeforeRavenpack
26
Figure 3: Difference in market reaction of HRH vs. HRL over time
The figure in Panel A reports the point estimates from an OLS regression of speed of reaction (Abs(Return t−1,t+5)
Abs(Return t−1,t+5)+Abs(Return t+6,t+120)) on D(HRH)
interacted with yearly dummy variables from 2004 to 10 September 2012. We assign the first quarter of a year to the prior year, i.e. the 2009
dummy covers a time period from 1 April 2009 to 1 April 2010. Controls and fixed effects are the same as in table 3 regression 6. The vertical
line indicates the introduction of RavenPack on 1 April 2009. In Panel B, we report the same regression but interacting the HRH dummy variable with two-year dummy variables (with the first quarter shifted backwards). In Panel C, we report the difference between speed of reaction for
HRH and HRL articles over different years (with the first quarter shifted backwards).
Panel A: Regression specification with yearly dummies
Panel B: Regression specification with two-year dummies
-2
-1
0
1
2
3
4
2004 2005 2006 2007 2008 2009 2010 2011 2012
Coefficients
95% CI
-1
-0.5
0
0.5
1
1.5
2
2.5
3
3.5
04 05-06 07-08 09-10 11-12
Coefficients
95% CI
27
Panel C: Comparing the difference in mean
-1
-0.5
0
0.5
1
1.5
2
2.5
3
2003 2004 2005 2006 2007 2008 2009 2010 2011
Difference
28
Figure 4: Market reaction between HRH and LRH
This figure displays the cumulative return from t-30 to t+120 seconds around the news events from 1 April 2009 to 10 September 2012. Returns
are multiplied with the sentiment direction of the article. We exclude articles with neutral sentiment. HRH refers to articles that have a relevance scores greater or equal 90 in both RavenPack versions, while LRH refers to articles that had a Relevance greater or equal 90 in the old RavenPack
version while having Relevance below 90 in the new RavenPack version.
-1.5
-1
-0.5
0
0.5
1
1.5
2
2.5
-30 0 30 60 90 120
Cu
mu
lati
ve R
etu
rn (
Bas
is P
oin
ts)
LRH
HRH
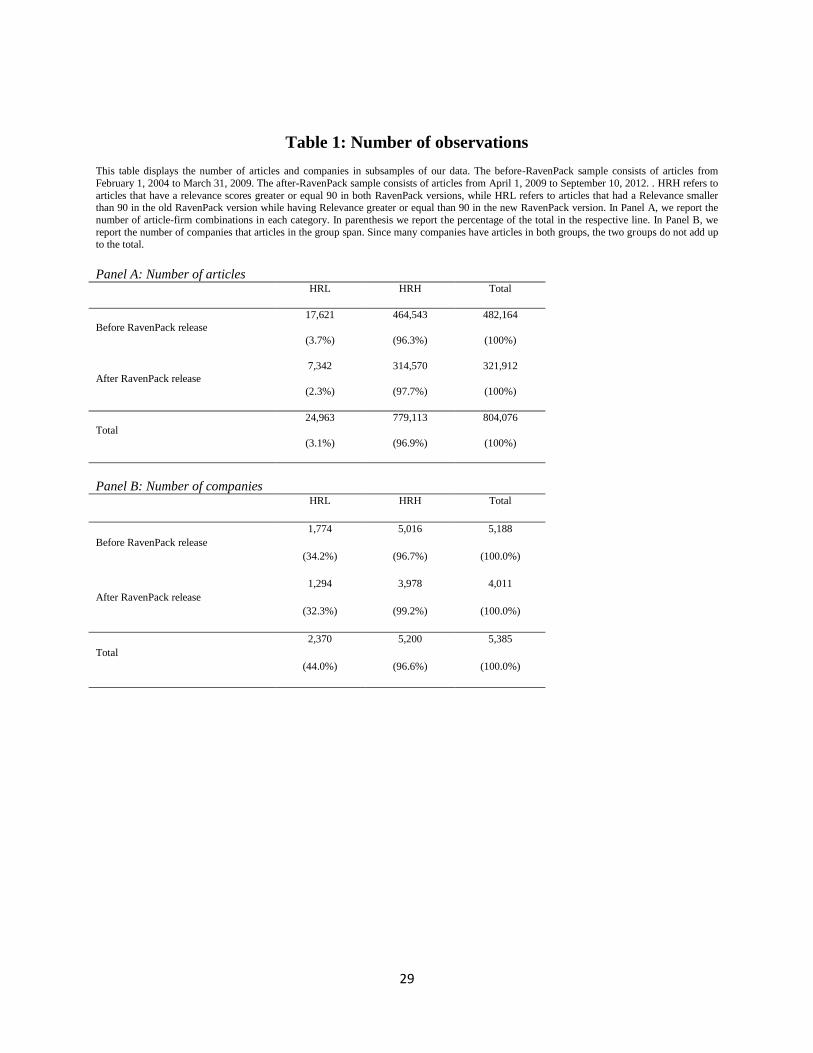
29
Table 1: Number of observations
This table displays the number of articles and companies in subsamples of our data. The before-RavenPack sample consists of articles from
February 1, 2004 to March 31, 2009. The after-RavenPack sample consists of articles from April 1, 2009 to September 10, 2012. . HRH refers to
articles that have a relevance scores greater or equal 90 in both RavenPack versions, while HRL refers to articles that had a Relevance smaller than 90 in the old RavenPack version while having Relevance greater or equal than 90 in the new RavenPack version. In Panel A, we report the
number of article-firm combinations in each category. In parenthesis we report the percentage of the total in the respective line. In Panel B, we
report the number of companies that articles in the group span. Since many companies have articles in both groups, the two groups do not add up to the total.
Panel A: Number of articles HRL HRH Total
Before RavenPack release
17,621 464,543 482,164
(3.7%) (96.3%) (100%)
After RavenPack release
7,342 314,570 321,912
(2.3%) (97.7%) (100%)
Total
24,963 779,113 804,076
(3.1%) (96.9%) (100%)
Panel B: Number of companies HRL HRH Total
Before RavenPack release
1,774 5,016 5,188
(34.2%) (96.7%) (100.0%)
After RavenPack release
1,294 3,978 4,011
(32.3%) (99.2%) (100.0%)
Total
2,370 5,200 5,385
(44.0%) (96.6%) (100.0%)
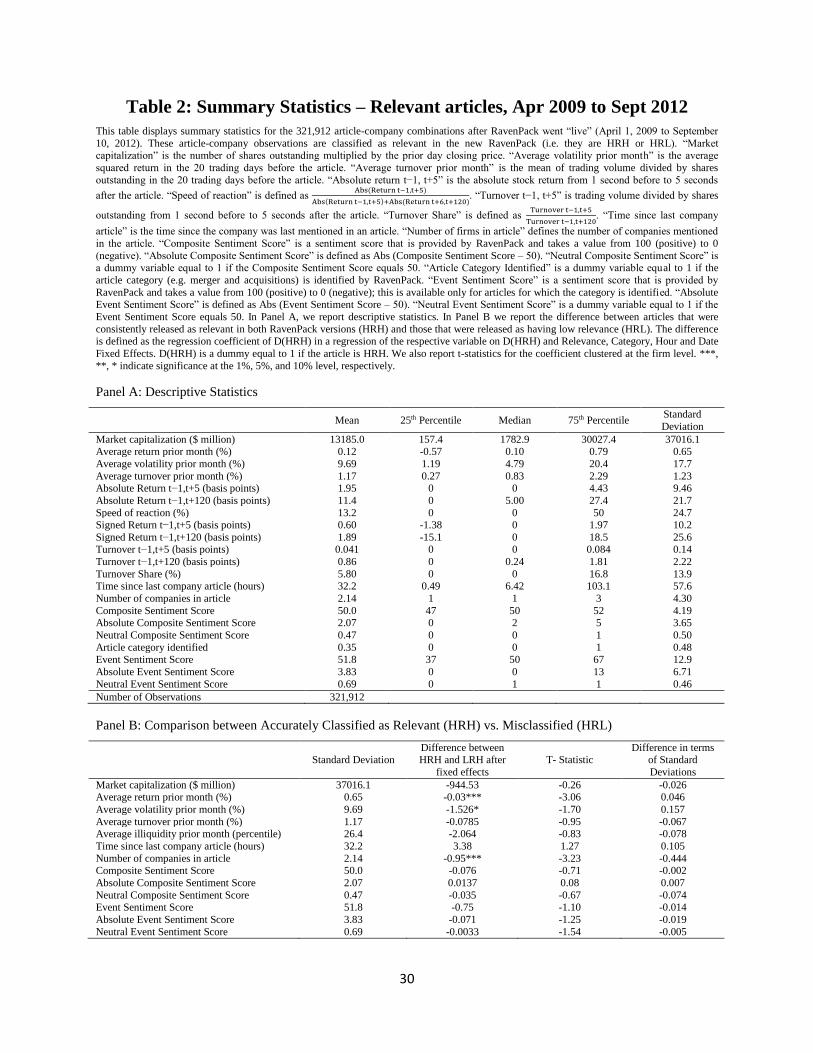
30
Table 2: Summary Statistics – Relevant articles, Apr 2009 to Sept 2012
This table displays summary statistics for the 321,912 article-company combinations after RavenPack went “live” (April 1, 2009 to September
10, 2012). These article-company observations are classified as relevant in the new RavenPack (i.e. they are HRH or HRL). “Market capitalization” is the number of shares outstanding multiplied by the prior day closing price. “Average volatility prior month” is the average
squared return in the 20 trading days before the article. “Average turnover prior month” is the mean of trading volume divided by shares
outstanding in the 20 trading days before the article. “Absolute return t−1, t+5” is the absolute stock return from 1 second before to 5 seconds
after the article. “Speed of reaction” is defined as Abs(Return t−1,t+5)
Abs(Return t−1,t+5)+Abs(Return t+6,t+120). “Turnover t−1, t+5” is trading volume divided by shares
outstanding from 1 second before to 5 seconds after the article. “Turnover Share” is defined as Turnover t−1,t+5
Turnover t−1,t+120. “Time since last company
article” is the time since the company was last mentioned in an article. “Number of firms in article” defines the number of companies mentioned
in the article. “Composite Sentiment Score” is a sentiment score that is provided by RavenPack and takes a value from 100 (positive) to 0
(negative). “Absolute Composite Sentiment Score” is defined as Abs (Composite Sentiment Score – 50). “Neutral Composite Sentiment Score” is a dummy variable equal to 1 if the Composite Sentiment Score equals 50. “Article Category Identified” is a dummy variable equal to 1 if the
article category (e.g. merger and acquisitions) is identified by RavenPack. “Event Sentiment Score” is a sentiment score that is provided by
RavenPack and takes a value from 100 (positive) to 0 (negative); this is available only for articles for which the category is identified. “Absolute Event Sentiment Score” is defined as Abs (Event Sentiment Score – 50). “Neutral Event Sentiment Score” is a dummy variable equal to 1 if the
Event Sentiment Score equals 50. In Panel A, we report descriptive statistics. In Panel B we report the difference between articles that were
consistently released as relevant in both RavenPack versions (HRH) and those that were released as having low relevance (HRL). The difference is defined as the regression coefficient of D(HRH) in a regression of the respective variable on D(HRH) and Relevance, Category, Hour and Date
Fixed Effects. D(HRH) is a dummy equal to 1 if the article is HRH. We also report t-statistics for the coefficient clustered at the firm level. ***,
**, * indicate significance at the 1%, 5%, and 10% level, respectively.
Panel A: Descriptive Statistics
Mean 25th Percentile Median 75th Percentile Standard
Deviation
Market capitalization ($ million) 13185.0 157.4 1782.9 30027.4 37016.1 Average return prior month (%) 0.12 -0.57 0.10 0.79 0.65
Average volatility prior month (%) 9.69 1.19 4.79 20.4 17.7
Average turnover prior month (%) 1.17 0.27 0.83 2.29 1.23 Absolute Return t−1,t+5 (basis points) 1.95 0 0 4.43 9.46
Absolute Return t−1,t+120 (basis points) 11.4 0 5.00 27.4 21.7
Speed of reaction (%) 13.2 0 0 50 24.7 Signed Return t−1,t+5 (basis points) 0.60 -1.38 0 1.97 10.2
Signed Return t−1,t+120 (basis points) 1.89 -15.1 0 18.5 25.6 Turnover t−1,t+5 (basis points) 0.041 0 0 0.084 0.14
Turnover t−1,t+120 (basis points) 0.86 0 0.24 1.81 2.22
Turnover Share (%) 5.80 0 0 16.8 13.9 Time since last company article (hours) 32.2 0.49 6.42 103.1 57.6
Number of companies in article 2.14 1 1 3 4.30
Composite Sentiment Score 50.0 47 50 52 4.19 Absolute Composite Sentiment Score 2.07 0 2 5 3.65
Neutral Composite Sentiment Score 0.47 0 0 1 0.50
Article category identified 0.35 0 0 1 0.48 Event Sentiment Score 51.8 37 50 67 12.9
Absolute Event Sentiment Score 3.83 0 0 13 6.71
Neutral Event Sentiment Score 0.69 0 1 1 0.46
Number of Observations 321,912
Panel B: Comparison between Accurately Classified as Relevant (HRH) vs. Misclassified (HRL)
Standard Deviation Difference between HRH and LRH after
fixed effects
T- Statistic Difference in terms
of Standard
Deviations
Market capitalization ($ million) 37016.1 -944.53 -0.26 -0.026 Average return prior month (%) 0.65 -0.03*** -3.06 0.046
Average volatility prior month (%) 9.69 -1.526* -1.70 0.157
Average turnover prior month (%) 1.17 -0.0785 -0.95 -0.067 Average illiquidity prior month (percentile) 26.4 -2.064 -0.83 -0.078
Time since last company article (hours) 32.2 3.38 1.27 0.105
Number of companies in article 2.14 -0.95*** -3.23 -0.444 Composite Sentiment Score 50.0 -0.076 -0.71 -0.002
Absolute Composite Sentiment Score 2.07 0.0137 0.08 0.007
Neutral Composite Sentiment Score 0.47 -0.035 -0.67 -0.074 Event Sentiment Score 51.8 -0.75 -1.10 -0.014
Absolute Event Sentiment Score 3.83 -0.071 -1.25 -0.019
Neutral Event Sentiment Score 0.69 -0.0033 -1.54 -0.005
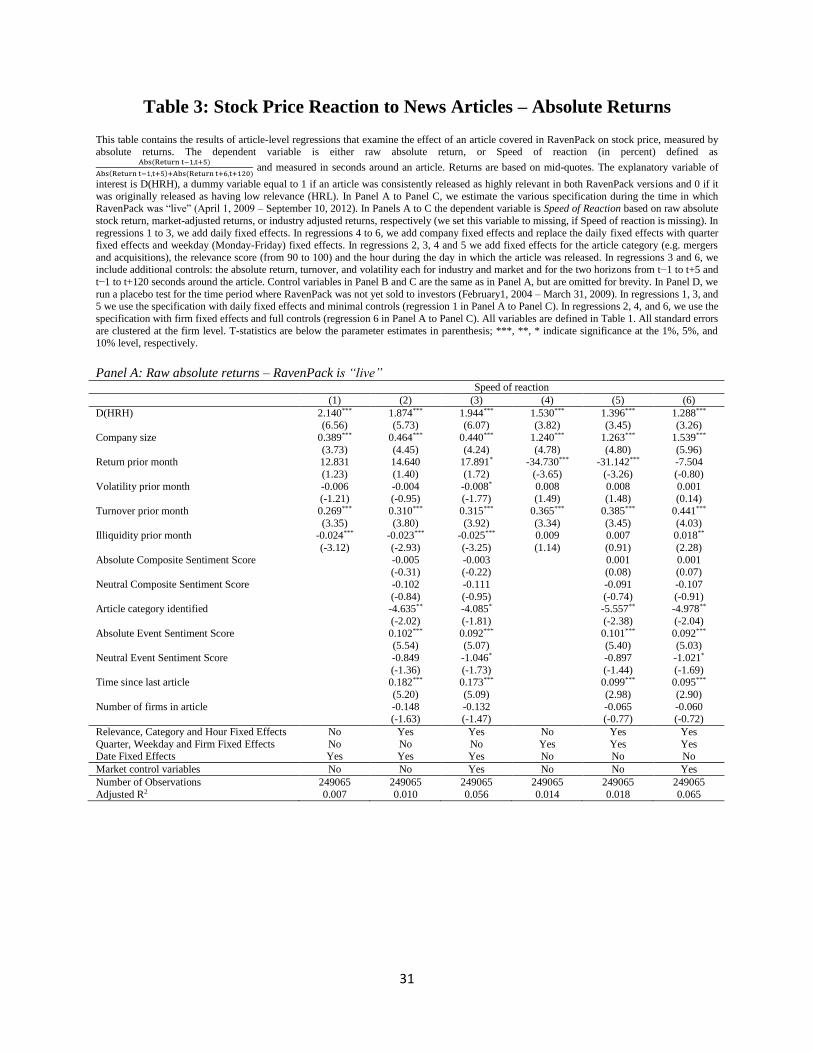
31
Table 3: Stock Price Reaction to News Articles – Absolute Returns
This table contains the results of article-level regressions that examine the effect of an article covered in RavenPack on stock price, measured by absolute returns. The dependent variable is either raw absolute return, or Speed of reaction (in percent) defined as
Abs(Return t−1,t+5)
Abs(Return t−1,t+5)+Abs(Return t+6,t+120) and measured in seconds around an article. Returns are based on mid-quotes. The explanatory variable of
interest is D(HRH), a dummy variable equal to 1 if an article was consistently released as highly relevant in both RavenPack versions and 0 if it
was originally released as having low relevance (HRL). In Panel A to Panel C, we estimate the various specification during the time in which RavenPack was “live” (April 1, 2009 – September 10, 2012). In Panels A to C the dependent variable is Speed of Reaction based on raw absolute
stock return, market-adjusted returns, or industry adjusted returns, respectively (we set this variable to missing, if Speed of reaction is missing). In
regressions 1 to 3, we add daily fixed effects. In regressions 4 to 6, we add company fixed effects and replace the daily fixed effects with quarter fixed effects and weekday (Monday-Friday) fixed effects. In regressions 2, 3, 4 and 5 we add fixed effects for the article category (e.g. mergers
and acquisitions), the relevance score (from 90 to 100) and the hour during the day in which the article was released. In regressions 3 and 6, we include additional controls: the absolute return, turnover, and volatility each for industry and market and for the two horizons from t−1 to t+5 and
t−1 to t+120 seconds around the article. Control variables in Panel B and C are the same as in Panel A, but are omitted for brevity. In Panel D, we
run a placebo test for the time period where RavenPack was not yet sold to investors (February1, 2004 – March 31, 2009). In regressions 1, 3, and 5 we use the specification with daily fixed effects and minimal controls (regression 1 in Panel A to Panel C). In regressions 2, 4, and 6, we use the
specification with firm fixed effects and full controls (regression 6 in Panel A to Panel C). All variables are defined in Table 1. All standard errors
are clustered at the firm level. T-statistics are below the parameter estimates in parenthesis; ***, **, * indicate significance at the 1%, 5%, and
10% level, respectively.
Panel A: Raw absolute returns – RavenPack is “live” Speed of reaction
(1) (2) (3) (4) (5) (6)
D(HRH) 2.140*** 1.874*** 1.944*** 1.530*** 1.396*** 1.288*** (6.56) (5.73) (6.07) (3.82) (3.45) (3.26)
Company size 0.389*** 0.464*** 0.440*** 1.240*** 1.263*** 1.539***
(3.73) (4.45) (4.24) (4.78) (4.80) (5.96) Return prior month 12.831 14.640 17.891* -34.730*** -31.142*** -7.504
(1.23) (1.40) (1.72) (-3.65) (-3.26) (-0.80)
Volatility prior month -0.006 -0.004 -0.008* 0.008 0.008 0.001 (-1.21) (-0.95) (-1.77) (1.49) (1.48) (0.14)
Turnover prior month 0.269*** 0.310*** 0.315*** 0.365*** 0.385*** 0.441***
(3.35) (3.80) (3.92) (3.34) (3.45) (4.03) Illiquidity prior month -0.024*** -0.023*** -0.025*** 0.009 0.007 0.018**
(-3.12) (-2.93) (-3.25) (1.14) (0.91) (2.28)
Absolute Composite Sentiment Score -0.005 -0.003 0.001 0.001
(-0.31) (-0.22) (0.08) (0.07)
Neutral Composite Sentiment Score -0.102 -0.111 -0.091 -0.107
(-0.84) (-0.95) (-0.74) (-0.91) Article category identified -4.635** -4.085* -5.557** -4.978**
(-2.02) (-1.81) (-2.38) (-2.04)
Absolute Event Sentiment Score 0.102*** 0.092*** 0.101*** 0.092*** (5.54) (5.07) (5.40) (5.03)
Neutral Event Sentiment Score -0.849 -1.046* -0.897 -1.021*
(-1.36) (-1.73) (-1.44) (-1.69) Time since last article 0.182*** 0.173*** 0.099*** 0.095***
(5.20) (5.09) (2.98) (2.90)
Number of firms in article -0.148 -0.132 -0.065 -0.060 (-1.63) (-1.47) (-0.77) (-0.72)
Relevance, Category and Hour Fixed Effects No Yes Yes No Yes Yes
Quarter, Weekday and Firm Fixed Effects No No No Yes Yes Yes Date Fixed Effects Yes Yes Yes No No No
Market control variables No No Yes No No Yes
Number of Observations 249065 249065 249065 249065 249065 249065
Adjusted R2 0.007 0.010 0.056 0.014 0.018 0.065
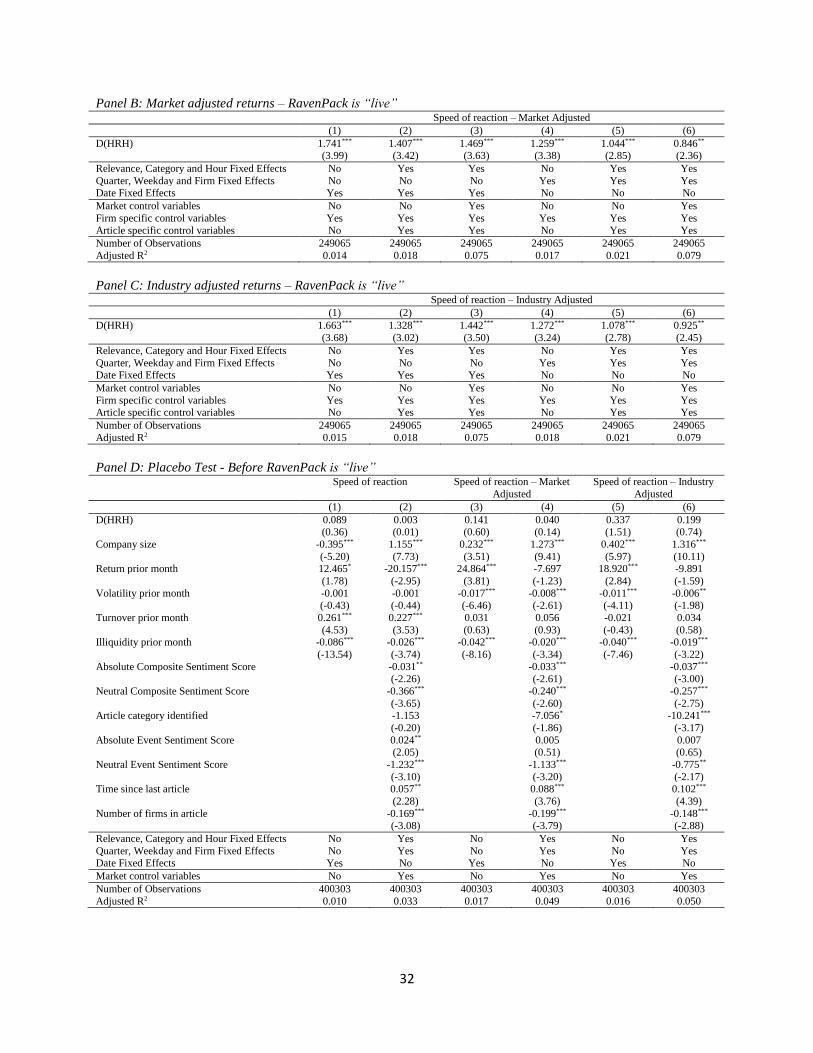
32
Panel B: Market adjusted returns – RavenPack is “live” Speed of reaction – Market Adjusted
(1) (2) (3) (4) (5) (6)
D(HRH) 1.741*** 1.407*** 1.469*** 1.259*** 1.044*** 0.846** (3.99) (3.42) (3.63) (3.38) (2.85) (2.36)
Relevance, Category and Hour Fixed Effects No Yes Yes No Yes Yes
Quarter, Weekday and Firm Fixed Effects No No No Yes Yes Yes Date Fixed Effects Yes Yes Yes No No No
Market control variables No No Yes No No Yes
Firm specific control variables Yes Yes Yes Yes Yes Yes
Article specific control variables No Yes Yes No Yes Yes
Number of Observations 249065 249065 249065 249065 249065 249065
Adjusted R2 0.014 0.018 0.075 0.017 0.021 0.079
Panel C: Industry adjusted returns – RavenPack is “live” Speed of reaction – Industry Adjusted
(1) (2) (3) (4) (5) (6)
D(HRH) 1.663*** 1.328*** 1.442*** 1.272*** 1.078*** 0.925**
(3.68) (3.02) (3.50) (3.24) (2.78) (2.45)
Relevance, Category and Hour Fixed Effects No Yes Yes No Yes Yes
Quarter, Weekday and Firm Fixed Effects No No No Yes Yes Yes Date Fixed Effects Yes Yes Yes No No No
Market control variables No No Yes No No Yes
Firm specific control variables Yes Yes Yes Yes Yes Yes Article specific control variables No Yes Yes No Yes Yes
Number of Observations 249065 249065 249065 249065 249065 249065
Adjusted R2 0.015 0.018 0.075 0.018 0.021 0.079
Panel D: Placebo Test - Before RavenPack is “live” Speed of reaction Speed of reaction – Market
Adjusted
Speed of reaction – Industry
Adjusted
(1) (2) (3) (4) (5) (6)
D(HRH) 0.089 0.003 0.141 0.040 0.337 0.199 (0.36) (0.01) (0.60) (0.14) (1.51) (0.74)
Company size -0.395*** 1.155*** 0.232*** 1.273*** 0.402*** 1.316***
(-5.20) (7.73) (3.51) (9.41) (5.97) (10.11) Return prior month 12.465* -20.157*** 24.864*** -7.697 18.920*** -9.891
(1.78) (-2.95) (3.81) (-1.23) (2.84) (-1.59)
Volatility prior month -0.001 -0.001 -0.017*** -0.008*** -0.011*** -0.006** (-0.43) (-0.44) (-6.46) (-2.61) (-4.11) (-1.98)
Turnover prior month 0.261*** 0.227*** 0.031 0.056 -0.021 0.034
(4.53) (3.53) (0.63) (0.93) (-0.43) (0.58) Illiquidity prior month -0.086*** -0.026*** -0.042*** -0.020*** -0.040*** -0.019***
(-13.54) (-3.74) (-8.16) (-3.34) (-7.46) (-3.22)
Absolute Composite Sentiment Score -0.031** -0.033*** -0.037*** (-2.26) (-2.61) (-3.00)
Neutral Composite Sentiment Score -0.366*** -0.240*** -0.257***
(-3.65) (-2.60) (-2.75) Article category identified -1.153 -7.056* -10.241***
(-0.20) (-1.86) (-3.17)
Absolute Event Sentiment Score 0.024** 0.005 0.007 (2.05) (0.51) (0.65)
Neutral Event Sentiment Score -1.232*** -1.133*** -0.775**
(-3.10) (-3.20) (-2.17) Time since last article 0.057** 0.088*** 0.102***
(2.28) (3.76) (4.39)
Number of firms in article -0.169*** -0.199*** -0.148*** (-3.08) (-3.79) (-2.88)
Relevance, Category and Hour Fixed Effects No Yes No Yes No Yes
Quarter, Weekday and Firm Fixed Effects No Yes No Yes No Yes Date Fixed Effects Yes No Yes No Yes No
Market control variables No Yes No Yes No Yes
Number of Observations 400303 400303 400303 400303 400303 400303
Adjusted R2 0.010 0.033 0.017 0.049 0.016 0.050
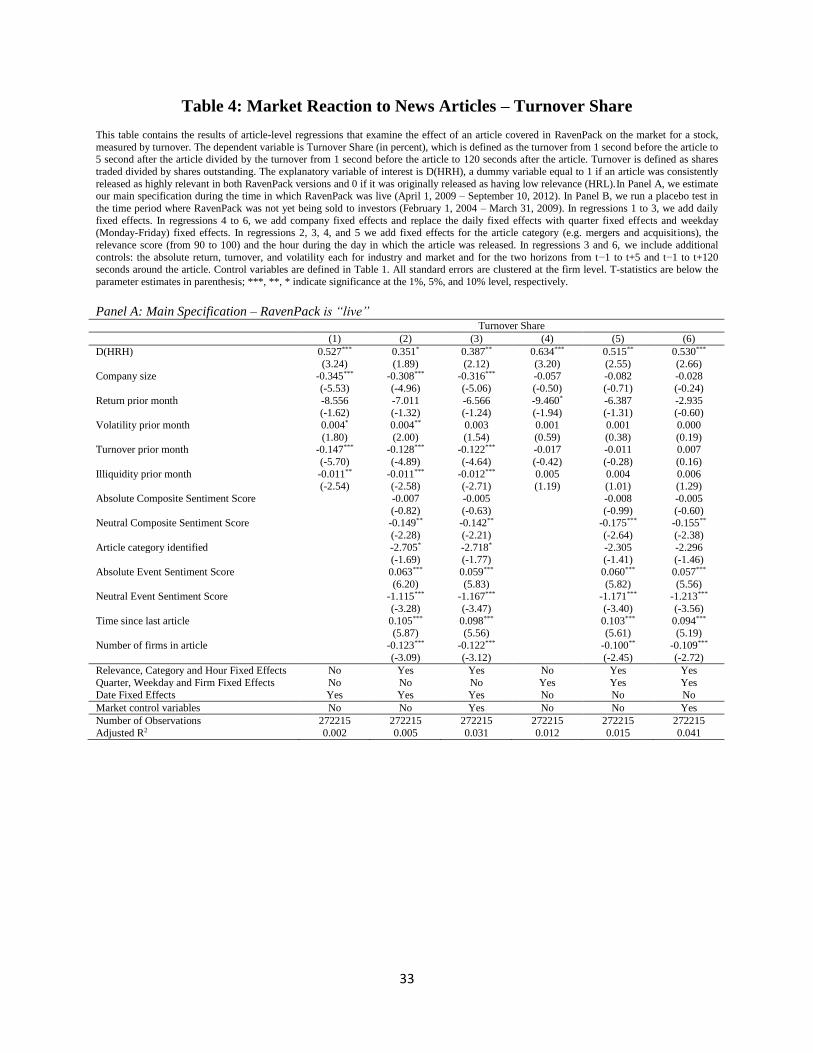
33
Table 4: Market Reaction to News Articles – Turnover Share
This table contains the results of article-level regressions that examine the effect of an article covered in RavenPack on the market for a stock,
measured by turnover. The dependent variable is Turnover Share (in percent), which is defined as the turnover from 1 second before the article to 5 second after the article divided by the turnover from 1 second before the article to 120 seconds after the article. Turnover is defined as shares
traded divided by shares outstanding. The explanatory variable of interest is D(HRH), a dummy variable equal to 1 if an article was consistently
released as highly relevant in both RavenPack versions and 0 if it was originally released as having low relevance (HRL).In Panel A, we estimate our main specification during the time in which RavenPack was live (April 1, 2009 – September 10, 2012). In Panel B, we run a placebo test in
the time period where RavenPack was not yet being sold to investors (February 1, 2004 – March 31, 2009). In regressions 1 to 3, we add daily
fixed effects. In regressions 4 to 6, we add company fixed effects and replace the daily fixed effects with quarter fixed effects and weekday (Monday-Friday) fixed effects. In regressions 2, 3, 4, and 5 we add fixed effects for the article category (e.g. mergers and acquisit ions), the
relevance score (from 90 to 100) and the hour during the day in which the article was released. In regressions 3 and 6, we include additional
controls: the absolute return, turnover, and volatility each for industry and market and for the two horizons from t−1 to t+5 and t−1 to t+120 seconds around the article. Control variables are defined in Table 1. All standard errors are clustered at the firm level. T-statistics are below the
parameter estimates in parenthesis; ***, **, * indicate significance at the 1%, 5%, and 10% level, respectively.
Panel A: Main Specification – RavenPack is “live” Turnover Share
(1) (2) (3) (4) (5) (6)
D(HRH) 0.527*** 0.351* 0.387** 0.634*** 0.515** 0.530***
(3.24) (1.89) (2.12) (3.20) (2.55) (2.66) Company size -0.345*** -0.308*** -0.316*** -0.057 -0.082 -0.028
(-5.53) (-4.96) (-5.06) (-0.50) (-0.71) (-0.24)
Return prior month -8.556 -7.011 -6.566 -9.460* -6.387 -2.935 (-1.62) (-1.32) (-1.24) (-1.94) (-1.31) (-0.60)
Volatility prior month 0.004* 0.004** 0.003 0.001 0.001 0.000
(1.80) (2.00) (1.54) (0.59) (0.38) (0.19) Turnover prior month -0.147*** -0.128*** -0.122*** -0.017 -0.011 0.007
(-5.70) (-4.89) (-4.64) (-0.42) (-0.28) (0.16)
Illiquidity prior month -0.011** -0.011*** -0.012*** 0.005 0.004 0.006 (-2.54) (-2.58) (-2.71) (1.19) (1.01) (1.29)
Absolute Composite Sentiment Score -0.007 -0.005 -0.008 -0.005
(-0.82) (-0.63) (-0.99) (-0.60) Neutral Composite Sentiment Score -0.149** -0.142** -0.175*** -0.155**
(-2.28) (-2.21) (-2.64) (-2.38)
Article category identified -2.705* -2.718* -2.305 -2.296 (-1.69) (-1.77) (-1.41) (-1.46)
Absolute Event Sentiment Score 0.063*** 0.059*** 0.060*** 0.057***
(6.20) (5.83) (5.82) (5.56) Neutral Event Sentiment Score -1.115*** -1.167*** -1.171*** -1.213***
(-3.28) (-3.47) (-3.40) (-3.56)
Time since last article 0.105*** 0.098*** 0.103*** 0.094*** (5.87) (5.56) (5.61) (5.19)
Number of firms in article -0.123*** -0.122*** -0.100** -0.109***
(-3.09) (-3.12) (-2.45) (-2.72)
Relevance, Category and Hour Fixed Effects No Yes Yes No Yes Yes
Quarter, Weekday and Firm Fixed Effects No No No Yes Yes Yes
Date Fixed Effects Yes Yes Yes No No No
Market control variables No No Yes No No Yes
Number of Observations 272215 272215 272215 272215 272215 272215
Adjusted R2 0.002 0.005 0.031 0.012 0.015 0.041
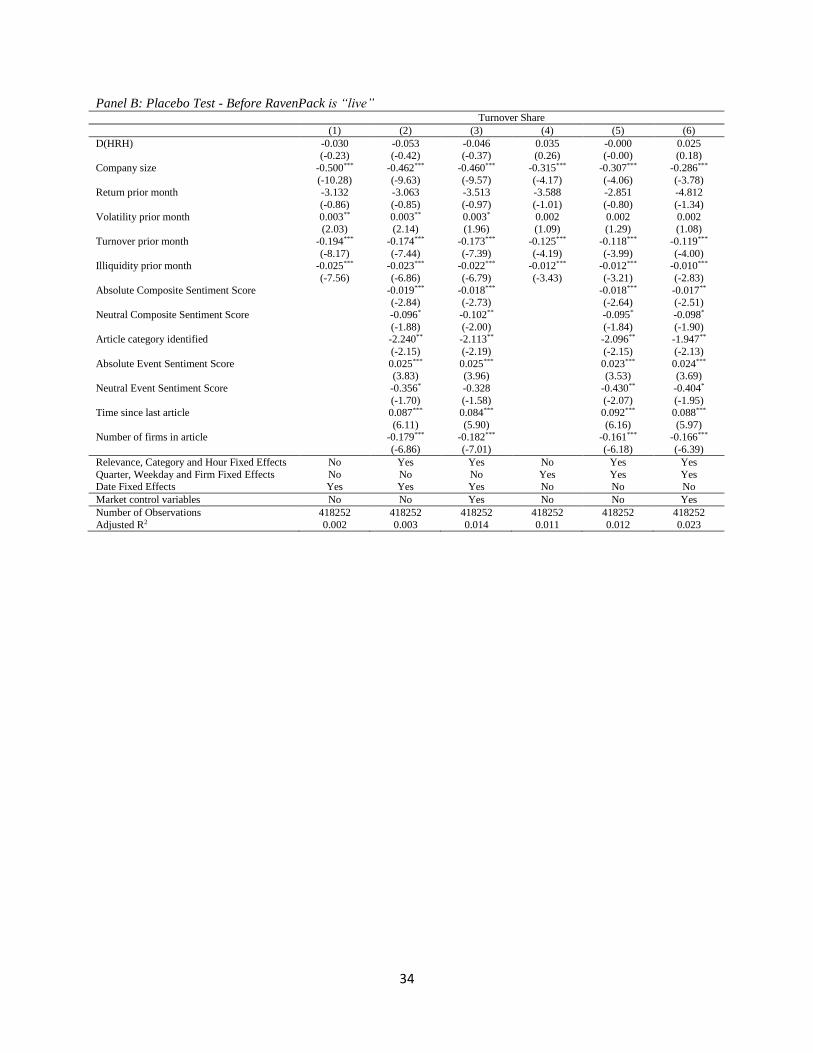
34
Panel B: Placebo Test - Before RavenPack is “live” Turnover Share
(1) (2) (3) (4) (5) (6)
D(HRH) -0.030 -0.053 -0.046 0.035 -0.000 0.025 (-0.23) (-0.42) (-0.37) (0.26) (-0.00) (0.18)
Company size -0.500*** -0.462*** -0.460*** -0.315*** -0.307*** -0.286***
(-10.28) (-9.63) (-9.57) (-4.17) (-4.06) (-3.78) Return prior month -3.132 -3.063 -3.513 -3.588 -2.851 -4.812
(-0.86) (-0.85) (-0.97) (-1.01) (-0.80) (-1.34)
Volatility prior month 0.003** 0.003** 0.003* 0.002 0.002 0.002 (2.03) (2.14) (1.96) (1.09) (1.29) (1.08)
Turnover prior month -0.194*** -0.174*** -0.173*** -0.125*** -0.118*** -0.119***
(-8.17) (-7.44) (-7.39) (-4.19) (-3.99) (-4.00) Illiquidity prior month -0.025*** -0.023*** -0.022*** -0.012*** -0.012*** -0.010***
(-7.56) (-6.86) (-6.79) (-3.43) (-3.21) (-2.83)
Absolute Composite Sentiment Score -0.019*** -0.018*** -0.018*** -0.017** (-2.84) (-2.73) (-2.64) (-2.51)
Neutral Composite Sentiment Score -0.096* -0.102** -0.095* -0.098*
(-1.88) (-2.00) (-1.84) (-1.90) Article category identified -2.240** -2.113** -2.096** -1.947**
(-2.15) (-2.19) (-2.15) (-2.13)
Absolute Event Sentiment Score 0.025*** 0.025*** 0.023*** 0.024*** (3.83) (3.96) (3.53) (3.69)
Neutral Event Sentiment Score -0.356* -0.328 -0.430** -0.404*
(-1.70) (-1.58) (-2.07) (-1.95) Time since last article 0.087*** 0.084*** 0.092*** 0.088***
(6.11) (5.90) (6.16) (5.97) Number of firms in article -0.179*** -0.182*** -0.161*** -0.166***
(-6.86) (-7.01) (-6.18) (-6.39)
Relevance, Category and Hour Fixed Effects No Yes Yes No Yes Yes
Quarter, Weekday and Firm Fixed Effects No No No Yes Yes Yes Date Fixed Effects Yes Yes Yes No No No
Market control variables No No Yes No No Yes
Number of Observations 418252 418252 418252 418252 418252 418252
Adjusted R2 0.002 0.003 0.014 0.011 0.012 0.023
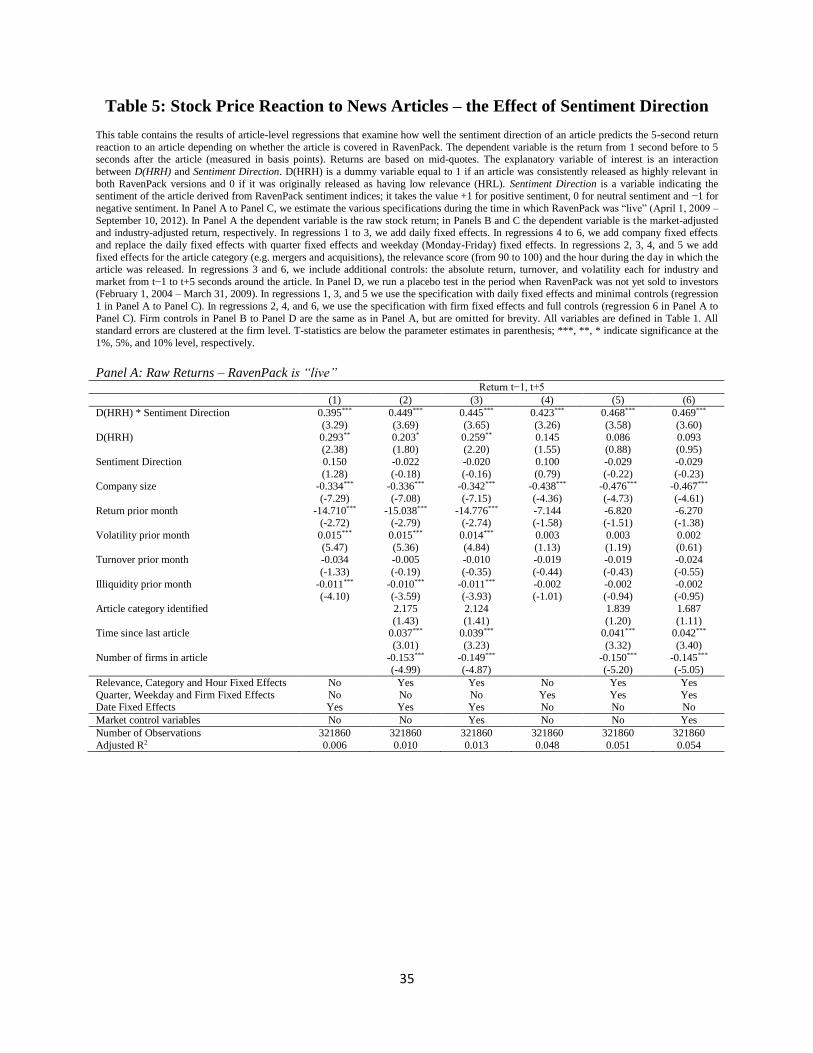
35
Table 5: Stock Price Reaction to News Articles – the Effect of Sentiment Direction
This table contains the results of article-level regressions that examine how well the sentiment direction of an article predicts the 5-second return
reaction to an article depending on whether the article is covered in RavenPack. The dependent variable is the return from 1 second before to 5 seconds after the article (measured in basis points). Returns are based on mid-quotes. The explanatory variable of interest is an interaction
between D(HRH) and Sentiment Direction. D(HRH) is a dummy variable equal to 1 if an article was consistently released as highly relevant in
both RavenPack versions and 0 if it was originally released as having low relevance (HRL). Sentiment Direction is a variable indicating the sentiment of the article derived from RavenPack sentiment indices; it takes the value +1 for positive sentiment, 0 for neutral sentiment and −1 for
negative sentiment. In Panel A to Panel C, we estimate the various specifications during the time in which RavenPack was “live” (April 1, 2009 –
September 10, 2012). In Panel A the dependent variable is the raw stock return; in Panels B and C the dependent variable is the market-adjusted and industry-adjusted return, respectively. In regressions 1 to 3, we add daily fixed effects. In regressions 4 to 6, we add company fixed effects
and replace the daily fixed effects with quarter fixed effects and weekday (Monday-Friday) fixed effects. In regressions 2, 3, 4, and 5 we add
fixed effects for the article category (e.g. mergers and acquisitions), the relevance score (from 90 to 100) and the hour during the day in which the article was released. In regressions 3 and 6, we include additional controls: the absolute return, turnover, and volatility each for industry and
market from t−1 to t+5 seconds around the article. In Panel D, we run a placebo test in the period when RavenPack was not yet sold to investors (February 1, 2004 – March 31, 2009). In regressions 1, 3, and 5 we use the specification with daily fixed effects and minimal controls (regression
1 in Panel A to Panel C). In regressions 2, 4, and 6, we use the specification with firm fixed effects and full controls (regression 6 in Panel A to
Panel C). Firm controls in Panel B to Panel D are the same as in Panel A, but are omitted for brevity. All variables are defined in Table 1. All standard errors are clustered at the firm level. T-statistics are below the parameter estimates in parenthesis; ***, **, * indicate significance at the
1%, 5%, and 10% level, respectively.
Panel A: Raw Returns – RavenPack is “live” Return t−1, t+5
(1) (2) (3) (4) (5) (6)
D(HRH) * Sentiment Direction 0.395*** 0.449*** 0.445*** 0.423*** 0.468*** 0.469***
(3.29) (3.69) (3.65) (3.26) (3.58) (3.60)
D(HRH) 0.293** 0.203* 0.259** 0.145 0.086 0.093 (2.38) (1.80) (2.20) (1.55) (0.88) (0.95)
Sentiment Direction 0.150 -0.022 -0.020 0.100 -0.029 -0.029
(1.28) (-0.18) (-0.16) (0.79) (-0.22) (-0.23) Company size -0.334*** -0.336*** -0.342*** -0.438*** -0.476*** -0.467***
(-7.29) (-7.08) (-7.15) (-4.36) (-4.73) (-4.61)
Return prior month -14.710*** -15.038*** -14.776*** -7.144 -6.820 -6.270 (-2.72) (-2.79) (-2.74) (-1.58) (-1.51) (-1.38)
Volatility prior month 0.015*** 0.015*** 0.014*** 0.003 0.003 0.002
(5.47) (5.36) (4.84) (1.13) (1.19) (0.61) Turnover prior month -0.034 -0.005 -0.010 -0.019 -0.019 -0.024
(-1.33) (-0.19) (-0.35) (-0.44) (-0.43) (-0.55)
Illiquidity prior month -0.011*** -0.010*** -0.011*** -0.002 -0.002 -0.002 (-4.10) (-3.59) (-3.93) (-1.01) (-0.94) (-0.95)
Article category identified 2.175 2.124 1.839 1.687
(1.43) (1.41) (1.20) (1.11) Time since last article 0.037*** 0.039*** 0.041*** 0.042***
(3.01) (3.23) (3.32) (3.40)
Number of firms in article -0.153*** -0.149*** -0.150*** -0.145*** (-4.99) (-4.87) (-5.20) (-5.05)
Relevance, Category and Hour Fixed Effects No Yes Yes No Yes Yes
Quarter, Weekday and Firm Fixed Effects No No No Yes Yes Yes Date Fixed Effects Yes Yes Yes No No No
Market control variables No No Yes No No Yes
Number of Observations 321860 321860 321860 321860 321860 321860
Adjusted R2 0.006 0.010 0.013 0.048 0.051 0.054
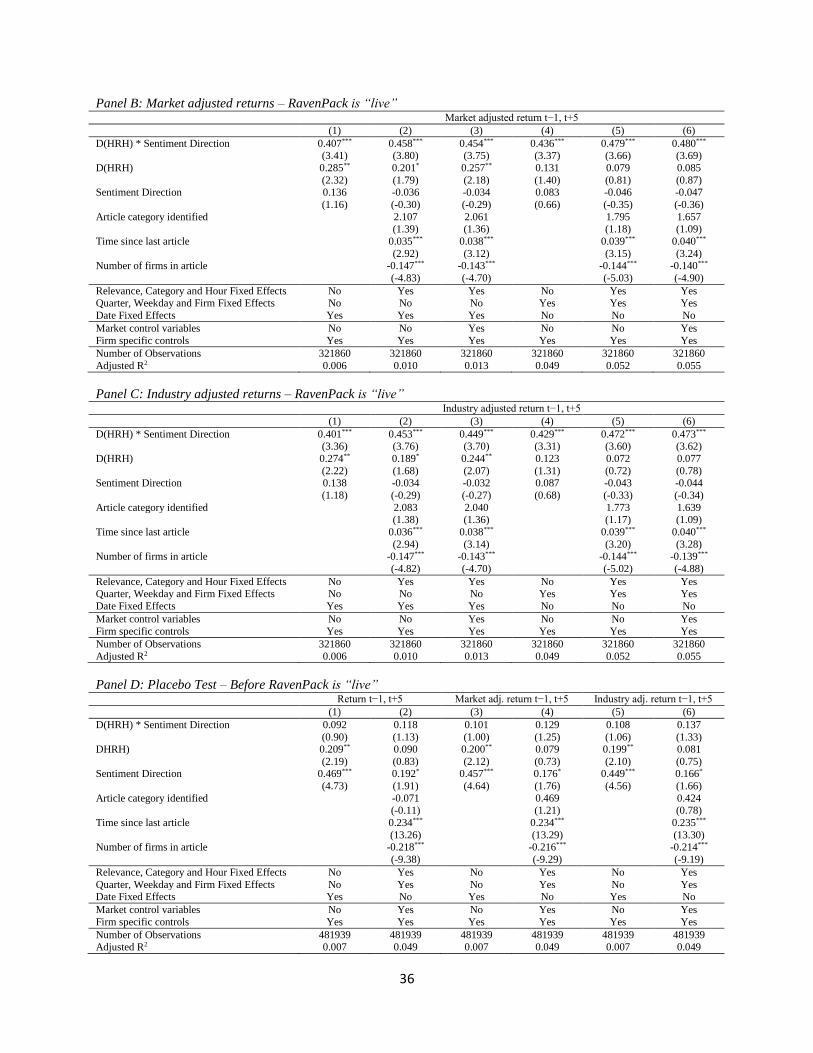
36
Panel B: Market adjusted returns – RavenPack is “live” Market adjusted return t−1, t+5
(1) (2) (3) (4) (5) (6)
D(HRH) * Sentiment Direction 0.407*** 0.458*** 0.454*** 0.436*** 0.479*** 0.480*** (3.41) (3.80) (3.75) (3.37) (3.66) (3.69)
D(HRH) 0.285** 0.201* 0.257** 0.131 0.079 0.085
(2.32) (1.79) (2.18) (1.40) (0.81) (0.87) Sentiment Direction 0.136 -0.036 -0.034 0.083 -0.046 -0.047
(1.16) (-0.30) (-0.29) (0.66) (-0.35) (-0.36)
Article category identified 2.107 2.061 1.795 1.657 (1.39) (1.36) (1.18) (1.09)
Time since last article 0.035*** 0.038*** 0.039*** 0.040***
(2.92) (3.12) (3.15) (3.24) Number of firms in article -0.147*** -0.143*** -0.144*** -0.140***
(-4.83) (-4.70) (-5.03) (-4.90)
Relevance, Category and Hour Fixed Effects No Yes Yes No Yes Yes Quarter, Weekday and Firm Fixed Effects No No No Yes Yes Yes
Date Fixed Effects Yes Yes Yes No No No
Market control variables No No Yes No No Yes
Firm specific controls Yes Yes Yes Yes Yes Yes
Number of Observations 321860 321860 321860 321860 321860 321860
Adjusted R2 0.006 0.010 0.013 0.049 0.052 0.055
Panel C: Industry adjusted returns – RavenPack is “live” Industry adjusted return t−1, t+5
(1) (2) (3) (4) (5) (6)
D(HRH) * Sentiment Direction 0.401*** 0.453*** 0.449*** 0.429*** 0.472*** 0.473*** (3.36) (3.76) (3.70) (3.31) (3.60) (3.62)
D(HRH) 0.274** 0.189* 0.244** 0.123 0.072 0.077
(2.22) (1.68) (2.07) (1.31) (0.72) (0.78) Sentiment Direction 0.138 -0.034 -0.032 0.087 -0.043 -0.044
(1.18) (-0.29) (-0.27) (0.68) (-0.33) (-0.34)
Article category identified 2.083 2.040 1.773 1.639 (1.38) (1.36) (1.17) (1.09)
Time since last article 0.036*** 0.038*** 0.039*** 0.040***
(2.94) (3.14) (3.20) (3.28) Number of firms in article -0.147*** -0.143*** -0.144*** -0.139***
(-4.82) (-4.70) (-5.02) (-4.88)
Relevance, Category and Hour Fixed Effects No Yes Yes No Yes Yes Quarter, Weekday and Firm Fixed Effects No No No Yes Yes Yes
Date Fixed Effects Yes Yes Yes No No No
Market control variables No No Yes No No Yes
Firm specific controls Yes Yes Yes Yes Yes Yes
Number of Observations 321860 321860 321860 321860 321860 321860
Adjusted R2 0.006 0.010 0.013 0.049 0.052 0.055
Panel D: Placebo Test – Before RavenPack is “live” Return t−1, t+5 Market adj. return t−1, t+5 Industry adj. return t−1, t+5
(1) (2) (3) (4) (5) (6)
D(HRH) * Sentiment Direction 0.092 0.118 0.101 0.129 0.108 0.137
(0.90) (1.13) (1.00) (1.25) (1.06) (1.33) DHRH) 0.209** 0.090 0.200** 0.079 0.199** 0.081
(2.19) (0.83) (2.12) (0.73) (2.10) (0.75) Sentiment Direction 0.469*** 0.192* 0.457*** 0.176* 0.449*** 0.166*
(4.73) (1.91) (4.64) (1.76) (4.56) (1.66)
Article category identified -0.071 0.469 0.424
(-0.11) (1.21) (0.78)
Time since last article 0.234*** 0.234*** 0.235***
(13.26) (13.29) (13.30) Number of firms in article -0.218*** -0.216*** -0.214***
(-9.38) (-9.29) (-9.19)
Relevance, Category and Hour Fixed Effects No Yes No Yes No Yes
Quarter, Weekday and Firm Fixed Effects No Yes No Yes No Yes Date Fixed Effects Yes No Yes No Yes No
Market control variables No Yes No Yes No Yes
Firm specific controls Yes Yes Yes Yes Yes Yes
Number of Observations 481939 481939 481939 481939 481939 481939 Adjusted R2 0.007 0.049 0.007 0.049 0.007 0.049
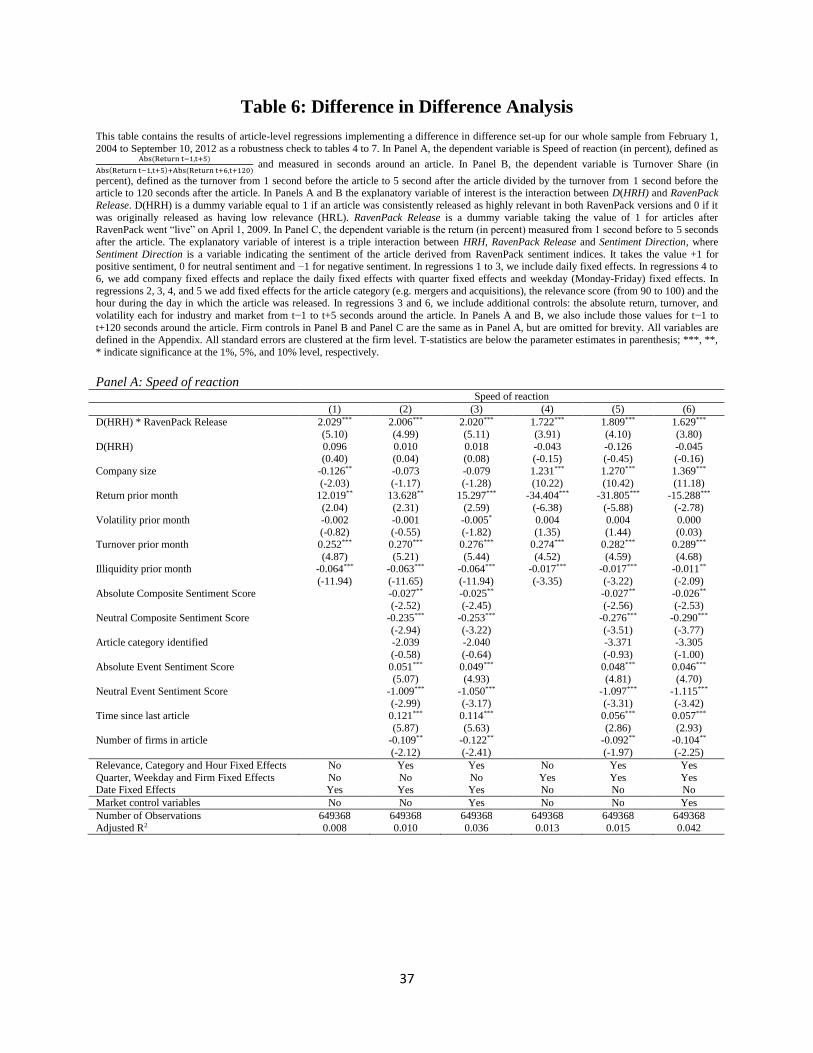
37
Table 6: Difference in Difference Analysis
This table contains the results of article-level regressions implementing a difference in difference set-up for our whole sample from February 1,
2004 to September 10, 2012 as a robustness check to tables 4 to 7. In Panel A, the dependent variable is Speed of reaction (in percent), defined as Abs(Return t−1,t+5)
Abs(Return t−1,t+5)+Abs(Return t+6,t+120) and measured in seconds around an article. In Panel B, the dependent variable is Turnover Share (in
percent), defined as the turnover from 1 second before the article to 5 second after the article divided by the turnover from 1 second before the article to 120 seconds after the article. In Panels A and B the explanatory variable of interest is the interaction between D(HRH) and RavenPack
Release. D(HRH) is a dummy variable equal to 1 if an article was consistently released as highly relevant in both RavenPack versions and 0 if it
was originally released as having low relevance (HRL). RavenPack Release is a dummy variable taking the value of 1 for articles after RavenPack went “live” on April 1, 2009. In Panel C, the dependent variable is the return (in percent) measured from 1 second before to 5 seconds
after the article. The explanatory variable of interest is a triple interaction between HRH, RavenPack Release and Sentiment Direction, where
Sentiment Direction is a variable indicating the sentiment of the article derived from RavenPack sentiment indices. It takes the value +1 for positive sentiment, 0 for neutral sentiment and −1 for negative sentiment. In regressions 1 to 3, we include daily fixed effects. In regressions 4 to
6, we add company fixed effects and replace the daily fixed effects with quarter fixed effects and weekday (Monday-Friday) fixed effects. In
regressions 2, 3, 4, and 5 we add fixed effects for the article category (e.g. mergers and acquisitions), the relevance score (from 90 to 100) and the hour during the day in which the article was released. In regressions 3 and 6, we include additional controls: the absolute return, turnover, and
volatility each for industry and market from t−1 to t+5 seconds around the article. In Panels A and B, we also include those values for t−1 to
t+120 seconds around the article. Firm controls in Panel B and Panel C are the same as in Panel A, but are omitted for brevity. All variables are defined in the Appendix. All standard errors are clustered at the firm level. T-statistics are below the parameter estimates in parenthesis; ***, **,
* indicate significance at the 1%, 5%, and 10% level, respectively.
Panel A: Speed of reaction Speed of reaction
(1) (2) (3) (4) (5) (6)
D(HRH) * RavenPack Release 2.029*** 2.006*** 2.020*** 1.722*** 1.809*** 1.629***
(5.10) (4.99) (5.11) (3.91) (4.10) (3.80)
D(HRH) 0.096 0.010 0.018 -0.043 -0.126 -0.045 (0.40) (0.04) (0.08) (-0.15) (-0.45) (-0.16)
Company size -0.126** -0.073 -0.079 1.231*** 1.270*** 1.369***
(-2.03) (-1.17) (-1.28) (10.22) (10.42) (11.18) Return prior month 12.019** 13.628** 15.297*** -34.404*** -31.805*** -15.288***
(2.04) (2.31) (2.59) (-6.38) (-5.88) (-2.78)
Volatility prior month -0.002 -0.001 -0.005* 0.004 0.004 0.000 (-0.82) (-0.55) (-1.82) (1.35) (1.44) (0.03)
Turnover prior month 0.252*** 0.270*** 0.276*** 0.274*** 0.282*** 0.289***
(4.87) (5.21) (5.44) (4.52) (4.59) (4.68) Illiquidity prior month -0.064*** -0.063*** -0.064*** -0.017*** -0.017*** -0.011**
(-11.94) (-11.65) (-11.94) (-3.35) (-3.22) (-2.09)
Absolute Composite Sentiment Score -0.027** -0.025** -0.027** -0.026** (-2.52) (-2.45) (-2.56) (-2.53)
Neutral Composite Sentiment Score -0.235*** -0.253*** -0.276*** -0.290***
(-2.94) (-3.22) (-3.51) (-3.77) Article category identified -2.039 -2.040 -3.371 -3.305
(-0.58) (-0.64) (-0.93) (-1.00)
Absolute Event Sentiment Score 0.051*** 0.049*** 0.048*** 0.046*** (5.07) (4.93) (4.81) (4.70)
Neutral Event Sentiment Score -1.009*** -1.050*** -1.097*** -1.115*** (-2.99) (-3.17) (-3.31) (-3.42)
Time since last article 0.121*** 0.114*** 0.056*** 0.057***
(5.87) (5.63) (2.86) (2.93) Number of firms in article -0.109** -0.122** -0.092** -0.104**
(-2.12) (-2.41) (-1.97) (-2.25)
Relevance, Category and Hour Fixed Effects No Yes Yes No Yes Yes
Quarter, Weekday and Firm Fixed Effects No No No Yes Yes Yes Date Fixed Effects Yes Yes Yes No No No
Market control variables No No Yes No No Yes
Number of Observations 649368 649368 649368 649368 649368 649368
Adjusted R2 0.008 0.010 0.036 0.013 0.015 0.042
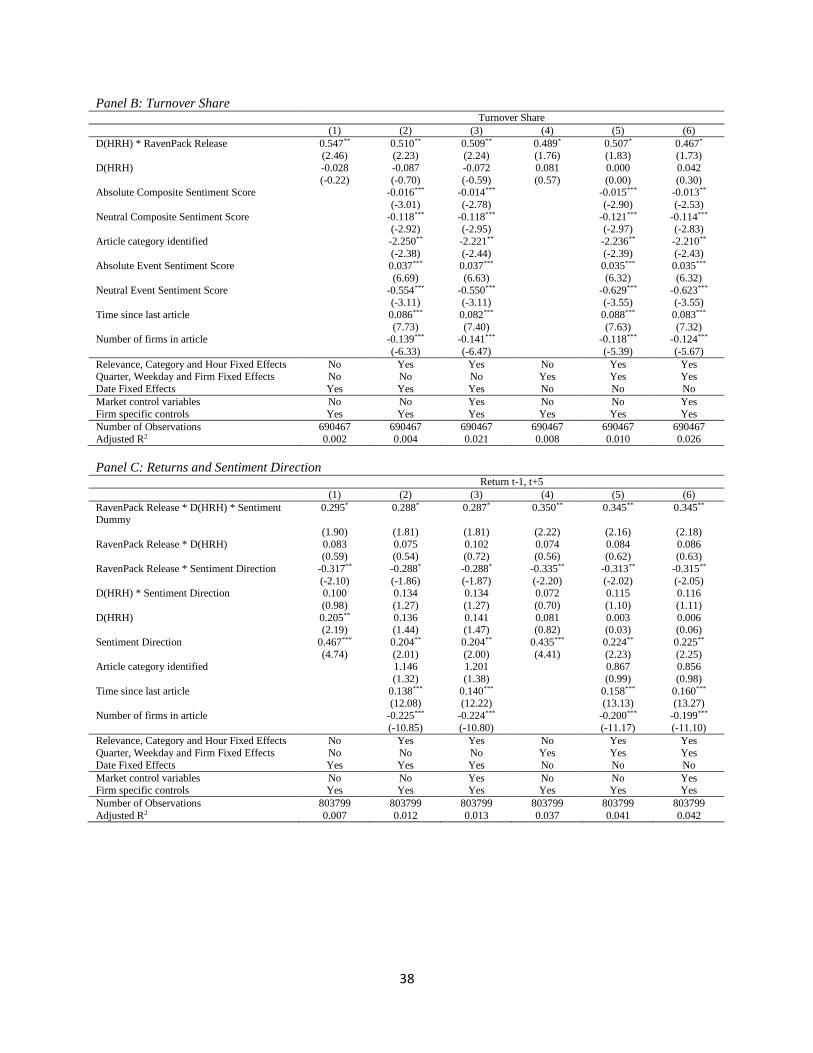
38
Panel B: Turnover Share Turnover Share
(1) (2) (3) (4) (5) (6)
D(HRH) * RavenPack Release 0.547** 0.510** 0.509** 0.489* 0.507* 0.467* (2.46) (2.23) (2.24) (1.76) (1.83) (1.73)
D(HRH) -0.028 -0.087 -0.072 0.081 0.000 0.042
(-0.22) (-0.70) (-0.59) (0.57) (0.00) (0.30) Absolute Composite Sentiment Score -0.016*** -0.014*** -0.015*** -0.013**
(-3.01) (-2.78) (-2.90) (-2.53)
Neutral Composite Sentiment Score -0.118*** -0.118*** -0.121*** -0.114*** (-2.92) (-2.95) (-2.97) (-2.83)
Article category identified -2.250** -2.221** -2.236** -2.210**
(-2.38) (-2.44) (-2.39) (-2.43) Absolute Event Sentiment Score 0.037*** 0.037*** 0.035*** 0.035***
(6.69) (6.63) (6.32) (6.32)
Neutral Event Sentiment Score -0.554*** -0.550*** -0.629*** -0.623*** (-3.11) (-3.11) (-3.55) (-3.55)
Time since last article 0.086*** 0.082*** 0.088*** 0.083***
(7.73) (7.40) (7.63) (7.32) Number of firms in article -0.139*** -0.141*** -0.118*** -0.124***
(-6.33) (-6.47) (-5.39) (-5.67)
Relevance, Category and Hour Fixed Effects No Yes Yes No Yes Yes Quarter, Weekday and Firm Fixed Effects No No No Yes Yes Yes
Date Fixed Effects Yes Yes Yes No No No
Market control variables No No Yes No No Yes
Firm specific controls Yes Yes Yes Yes Yes Yes
Number of Observations 690467 690467 690467 690467 690467 690467
Adjusted R2 0.002 0.004 0.021 0.008 0.010 0.026
Panel C: Returns and Sentiment Direction Return t-1, t+5
(1) (2) (3) (4) (5) (6)
RavenPack Release * D(HRH) * Sentiment Dummy
0.295* 0.288* 0.287* 0.350** 0.345** 0.345**
(1.90) (1.81) (1.81) (2.22) (2.16) (2.18)
RavenPack Release * D(HRH) 0.083 0.075 0.102 0.074 0.084 0.086 (0.59) (0.54) (0.72) (0.56) (0.62) (0.63)
RavenPack Release * Sentiment Direction -0.317** -0.288* -0.288* -0.335** -0.313** -0.315**
(-2.10) (-1.86) (-1.87) (-2.20) (-2.02) (-2.05) D(HRH) * Sentiment Direction 0.100 0.134 0.134 0.072 0.115 0.116
(0.98) (1.27) (1.27) (0.70) (1.10) (1.11)
D(HRH) 0.205** 0.136 0.141 0.081 0.003 0.006 (2.19) (1.44) (1.47) (0.82) (0.03) (0.06)
Sentiment Direction 0.467*** 0.204** 0.204** 0.435*** 0.224** 0.225**
(4.74) (2.01) (2.00) (4.41) (2.23) (2.25) Article category identified 1.146 1.201 0.867 0.856
(1.32) (1.38) (0.99) (0.98)
Time since last article 0.138*** 0.140*** 0.158*** 0.160*** (12.08) (12.22) (13.13) (13.27)
Number of firms in article -0.225*** -0.224*** -0.200*** -0.199***
(-10.85) (-10.80) (-11.17) (-11.10)
Relevance, Category and Hour Fixed Effects No Yes Yes No Yes Yes
Quarter, Weekday and Firm Fixed Effects No No No Yes Yes Yes
Date Fixed Effects Yes Yes Yes No No No
Market control variables No No Yes No No Yes Firm specific controls Yes Yes Yes Yes Yes Yes
Number of Observations 803799 803799 803799 803799 803799 803799
Adjusted R2 0.007 0.012 0.013 0.037 0.041 0.042
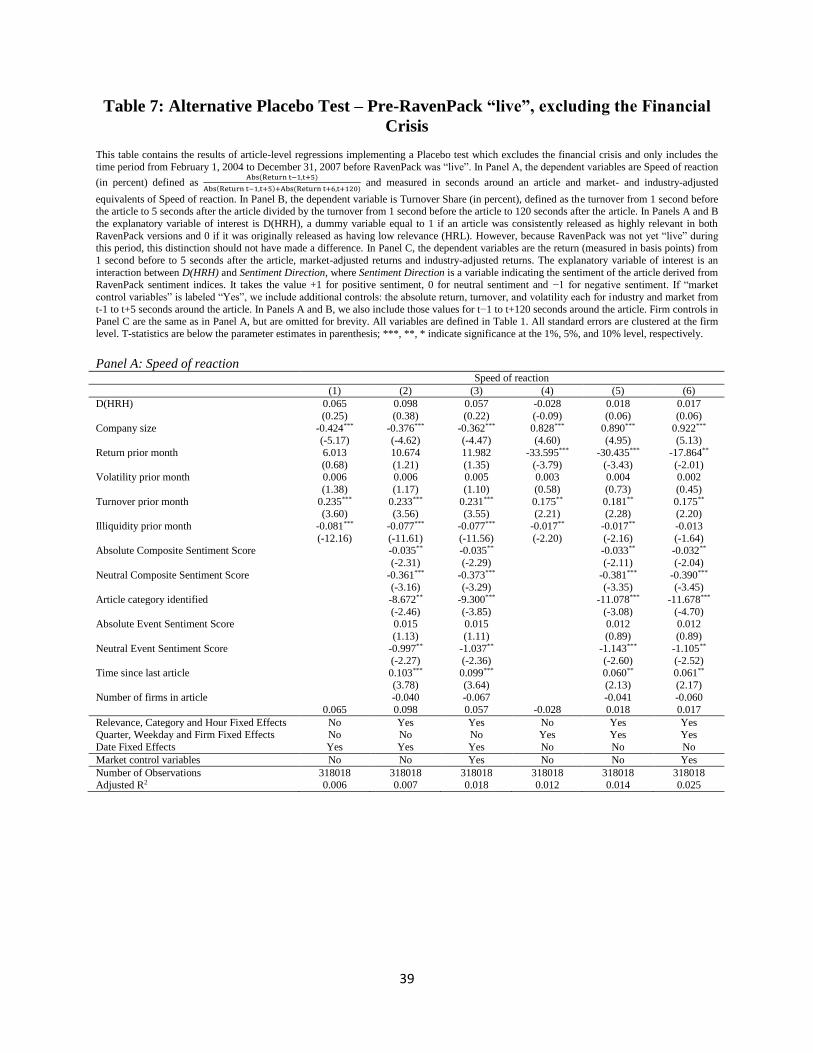
39
Table 7: Alternative Placebo Test – Pre-RavenPack “live”, excluding the Financial
Crisis
This table contains the results of article-level regressions implementing a Placebo test which excludes the financial crisis and only includes the
time period from February 1, 2004 to December 31, 2007 before RavenPack was “live”. In Panel A, the dependent variables are Speed of reaction
(in percent) defined as Abs(Return t−1,t+5)
Abs(Return t−1,t+5)+Abs(Return t+6,t+120) and measured in seconds around an article and market- and industry-adjusted
equivalents of Speed of reaction. In Panel B, the dependent variable is Turnover Share (in percent), defined as the turnover from 1 second before the article to 5 seconds after the article divided by the turnover from 1 second before the article to 120 seconds after the article. In Panels A and B
the explanatory variable of interest is D(HRH), a dummy variable equal to 1 if an article was consistently released as highly relevant in both
RavenPack versions and 0 if it was originally released as having low relevance (HRL). However, because RavenPack was not yet “live” during this period, this distinction should not have made a difference. In Panel C, the dependent variables are the return (measured in basis points) from
1 second before to 5 seconds after the article, market-adjusted returns and industry-adjusted returns. The explanatory variable of interest is an
interaction between D(HRH) and Sentiment Direction, where Sentiment Direction is a variable indicating the sentiment of the article derived from RavenPack sentiment indices. It takes the value +1 for positive sentiment, 0 for neutral sentiment and −1 for negative sentiment. If “market
control variables” is labeled “Yes”, we include additional controls: the absolute return, turnover, and volatility each for industry and market from
t-1 to t+5 seconds around the article. In Panels A and B, we also include those values for t−1 to t+120 seconds around the article. Firm controls in Panel C are the same as in Panel A, but are omitted for brevity. All variables are defined in Table 1. All standard errors are clustered at the firm
level. T-statistics are below the parameter estimates in parenthesis; ***, **, * indicate significance at the 1%, 5%, and 10% level, respectively.
Panel A: Speed of reaction Speed of reaction
(1) (2) (3) (4) (5) (6)
D(HRH) 0.065 0.098 0.057 -0.028 0.018 0.017
(0.25) (0.38) (0.22) (-0.09) (0.06) (0.06)
Company size -0.424*** -0.376*** -0.362*** 0.828*** 0.890*** 0.922*** (-5.17) (-4.62) (-4.47) (4.60) (4.95) (5.13)
Return prior month 6.013 10.674 11.982 -33.595*** -30.435*** -17.864**
(0.68) (1.21) (1.35) (-3.79) (-3.43) (-2.01) Volatility prior month 0.006 0.006 0.005 0.003 0.004 0.002
(1.38) (1.17) (1.10) (0.58) (0.73) (0.45)
Turnover prior month 0.235*** 0.233*** 0.231*** 0.175** 0.181** 0.175** (3.60) (3.56) (3.55) (2.21) (2.28) (2.20)
Illiquidity prior month -0.081*** -0.077*** -0.077*** -0.017** -0.017** -0.013
(-12.16) (-11.61) (-11.56) (-2.20) (-2.16) (-1.64) Absolute Composite Sentiment Score -0.035** -0.035** -0.033** -0.032**
(-2.31) (-2.29) (-2.11) (-2.04)
Neutral Composite Sentiment Score -0.361*** -0.373*** -0.381*** -0.390*** (-3.16) (-3.29) (-3.35) (-3.45)
Article category identified -8.672** -9.300*** -11.078*** -11.678***
(-2.46) (-3.85) (-3.08) (-4.70) Absolute Event Sentiment Score 0.015 0.015 0.012 0.012
(1.13) (1.11) (0.89) (0.89)
Neutral Event Sentiment Score -0.997** -1.037** -1.143*** -1.105** (-2.27) (-2.36) (-2.60) (-2.52)
Time since last article 0.103*** 0.099*** 0.060** 0.061** (3.78) (3.64) (2.13) (2.17)
Number of firms in article -0.040 -0.067 -0.041 -0.060
0.065 0.098 0.057 -0.028 0.018 0.017
Relevance, Category and Hour Fixed Effects No Yes Yes No Yes Yes Quarter, Weekday and Firm Fixed Effects No No No Yes Yes Yes
Date Fixed Effects Yes Yes Yes No No No
Market control variables No No Yes No No Yes
Number of Observations 318018 318018 318018 318018 318018 318018 Adjusted R2 0.006 0.007 0.018 0.012 0.014 0.025
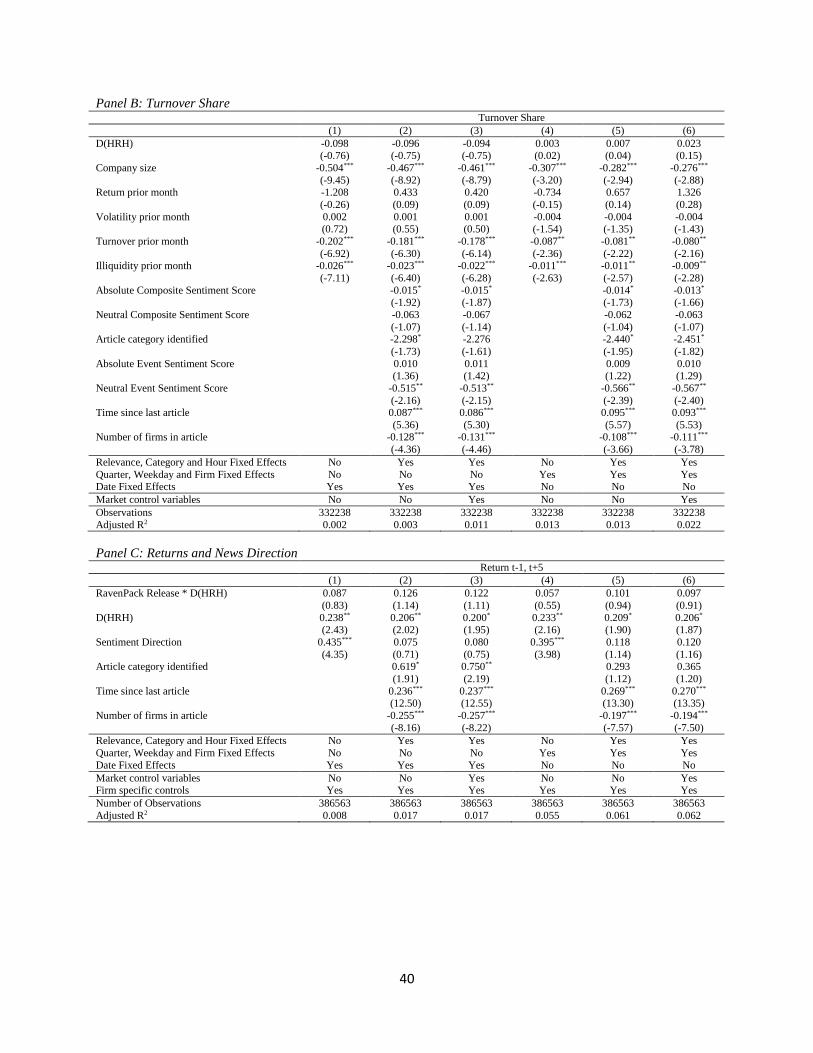
40
Panel B: Turnover Share Turnover Share
(1) (2) (3) (4) (5) (6)
D(HRH) -0.098 -0.096 -0.094 0.003 0.007 0.023 (-0.76) (-0.75) (-0.75) (0.02) (0.04) (0.15)
Company size -0.504*** -0.467*** -0.461*** -0.307*** -0.282*** -0.276***
(-9.45) (-8.92) (-8.79) (-3.20) (-2.94) (-2.88) Return prior month -1.208 0.433 0.420 -0.734 0.657 1.326
(-0.26) (0.09) (0.09) (-0.15) (0.14) (0.28)
Volatility prior month 0.002 0.001 0.001 -0.004 -0.004 -0.004 (0.72) (0.55) (0.50) (-1.54) (-1.35) (-1.43)
Turnover prior month -0.202*** -0.181*** -0.178*** -0.087** -0.081** -0.080**
(-6.92) (-6.30) (-6.14) (-2.36) (-2.22) (-2.16) Illiquidity prior month -0.026*** -0.023*** -0.022*** -0.011*** -0.011** -0.009**
(-7.11) (-6.40) (-6.28) (-2.63) (-2.57) (-2.28)
Absolute Composite Sentiment Score -0.015* -0.015* -0.014* -0.013* (-1.92) (-1.87) (-1.73) (-1.66)
Neutral Composite Sentiment Score -0.063 -0.067 -0.062 -0.063
(-1.07) (-1.14) (-1.04) (-1.07) Article category identified -2.298* -2.276 -2.440* -2.451*
(-1.73) (-1.61) (-1.95) (-1.82)
Absolute Event Sentiment Score 0.010 0.011 0.009 0.010 (1.36) (1.42) (1.22) (1.29)
Neutral Event Sentiment Score -0.515** -0.513** -0.566** -0.567**
(-2.16) (-2.15) (-2.39) (-2.40) Time since last article 0.087*** 0.086*** 0.095*** 0.093***
(5.36) (5.30) (5.57) (5.53) Number of firms in article -0.128*** -0.131*** -0.108*** -0.111***
(-4.36) (-4.46) (-3.66) (-3.78)
Relevance, Category and Hour Fixed Effects No Yes Yes No Yes Yes
Quarter, Weekday and Firm Fixed Effects No No No Yes Yes Yes Date Fixed Effects Yes Yes Yes No No No
Market control variables No No Yes No No Yes
Observations 332238 332238 332238 332238 332238 332238
Adjusted R2 0.002 0.003 0.011 0.013 0.013 0.022
Panel C: Returns and News Direction Return t-1, t+5
(1) (2) (3) (4) (5) (6)
RavenPack Release * D(HRH) 0.087 0.126 0.122 0.057 0.101 0.097
(0.83) (1.14) (1.11) (0.55) (0.94) (0.91)
D(HRH) 0.238** 0.206** 0.200* 0.233** 0.209* 0.206* (2.43) (2.02) (1.95) (2.16) (1.90) (1.87)
Sentiment Direction 0.435*** 0.075 0.080 0.395*** 0.118 0.120
(4.35) (0.71) (0.75) (3.98) (1.14) (1.16) Article category identified 0.619* 0.750** 0.293 0.365
(1.91) (2.19) (1.12) (1.20)
Time since last article 0.236*** 0.237*** 0.269*** 0.270*** (12.50) (12.55) (13.30) (13.35)
Number of firms in article -0.255*** -0.257*** -0.197*** -0.194***
(-8.16) (-8.22) (-7.57) (-7.50)
Relevance, Category and Hour Fixed Effects No Yes Yes No Yes Yes
Quarter, Weekday and Firm Fixed Effects No No No Yes Yes Yes
Date Fixed Effects Yes Yes Yes No No No
Market control variables No No Yes No No Yes Firm specific controls Yes Yes Yes Yes Yes Yes
Number of Observations 386563 386563 386563 386563 386563 386563
Adjusted R2 0.008 0.017 0.017 0.055 0.061 0.062
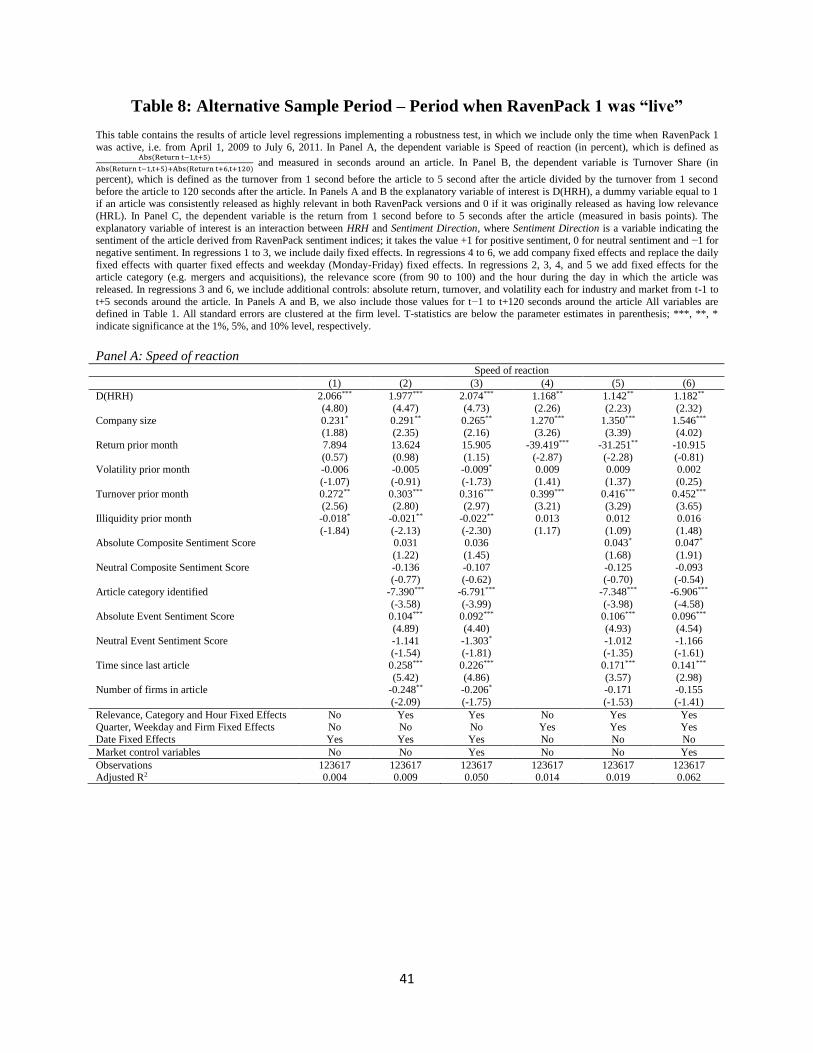
41
Table 8: Alternative Sample Period – Period when RavenPack 1 was “live”
This table contains the results of article level regressions implementing a robustness test, in which we include only the time when RavenPack 1
was active, i.e. from April 1, 2009 to July 6, 2011. In Panel A, the dependent variable is Speed of reaction (in percent), which is defined as Abs(Return t−1,t+5)
Abs(Return t−1,t+5)+Abs(Return t+6,t+120) and measured in seconds around an article. In Panel B, the dependent variable is Turnover Share (in
percent), which is defined as the turnover from 1 second before the article to 5 second after the article divided by the turnover from 1 second
before the article to 120 seconds after the article. In Panels A and B the explanatory variable of interest is D(HRH), a dummy variable equal to 1 if an article was consistently released as highly relevant in both RavenPack versions and 0 if it was originally released as having low relevance
(HRL). In Panel C, the dependent variable is the return from 1 second before to 5 seconds after the article (measured in basis points). The
explanatory variable of interest is an interaction between HRH and Sentiment Direction, where Sentiment Direction is a variable indicating the sentiment of the article derived from RavenPack sentiment indices; it takes the value +1 for positive sentiment, 0 for neutral sentiment and −1 for
negative sentiment. In regressions 1 to 3, we include daily fixed effects. In regressions 4 to 6, we add company fixed effects and replace the daily
fixed effects with quarter fixed effects and weekday (Monday-Friday) fixed effects. In regressions 2, 3, 4, and 5 we add fixed effects for the article category (e.g. mergers and acquisitions), the relevance score (from 90 to 100) and the hour during the day in which the article was
released. In regressions 3 and 6, we include additional controls: absolute return, turnover, and volatility each for industry and market from t-1 to
t+5 seconds around the article. In Panels A and B, we also include those values for t−1 to t+120 seconds around the article All variables are defined in Table 1. All standard errors are clustered at the firm level. T-statistics are below the parameter estimates in parenthesis; ***, **, *
indicate significance at the 1%, 5%, and 10% level, respectively.
Panel A: Speed of reaction Speed of reaction
(1) (2) (3) (4) (5) (6)
D(HRH) 2.066*** 1.977*** 2.074*** 1.168** 1.142** 1.182**
(4.80) (4.47) (4.73) (2.26) (2.23) (2.32)
Company size 0.231* 0.291** 0.265** 1.270*** 1.350*** 1.546*** (1.88) (2.35) (2.16) (3.26) (3.39) (4.02)
Return prior month 7.894 13.624 15.905 -39.419*** -31.251** -10.915
(0.57) (0.98) (1.15) (-2.87) (-2.28) (-0.81) Volatility prior month -0.006 -0.005 -0.009* 0.009 0.009 0.002
(-1.07) (-0.91) (-1.73) (1.41) (1.37) (0.25)
Turnover prior month 0.272** 0.303*** 0.316*** 0.399*** 0.416*** 0.452*** (2.56) (2.80) (2.97) (3.21) (3.29) (3.65)
Illiquidity prior month -0.018* -0.021** -0.022** 0.013 0.012 0.016
(-1.84) (-2.13) (-2.30) (1.17) (1.09) (1.48) Absolute Composite Sentiment Score 0.031 0.036 0.043* 0.047*
(1.22) (1.45) (1.68) (1.91)
Neutral Composite Sentiment Score -0.136 -0.107 -0.125 -0.093
(-0.77) (-0.62) (-0.70) (-0.54)
Article category identified -7.390*** -6.791*** -7.348*** -6.906***
(-3.58) (-3.99) (-3.98) (-4.58) Absolute Event Sentiment Score 0.104*** 0.092*** 0.106*** 0.096***
(4.89) (4.40) (4.93) (4.54)
Neutral Event Sentiment Score -1.141 -1.303* -1.012 -1.166 (-1.54) (-1.81) (-1.35) (-1.61)
Time since last article 0.258*** 0.226*** 0.171*** 0.141***
(5.42) (4.86) (3.57) (2.98) Number of firms in article -0.248** -0.206* -0.171 -0.155
(-2.09) (-1.75) (-1.53) (-1.41)
Relevance, Category and Hour Fixed Effects No Yes Yes No Yes Yes Quarter, Weekday and Firm Fixed Effects No No No Yes Yes Yes
Date Fixed Effects Yes Yes Yes No No No
Market control variables No No Yes No No Yes
Observations 123617 123617 123617 123617 123617 123617 Adjusted R2 0.004 0.009 0.050 0.014 0.019 0.062
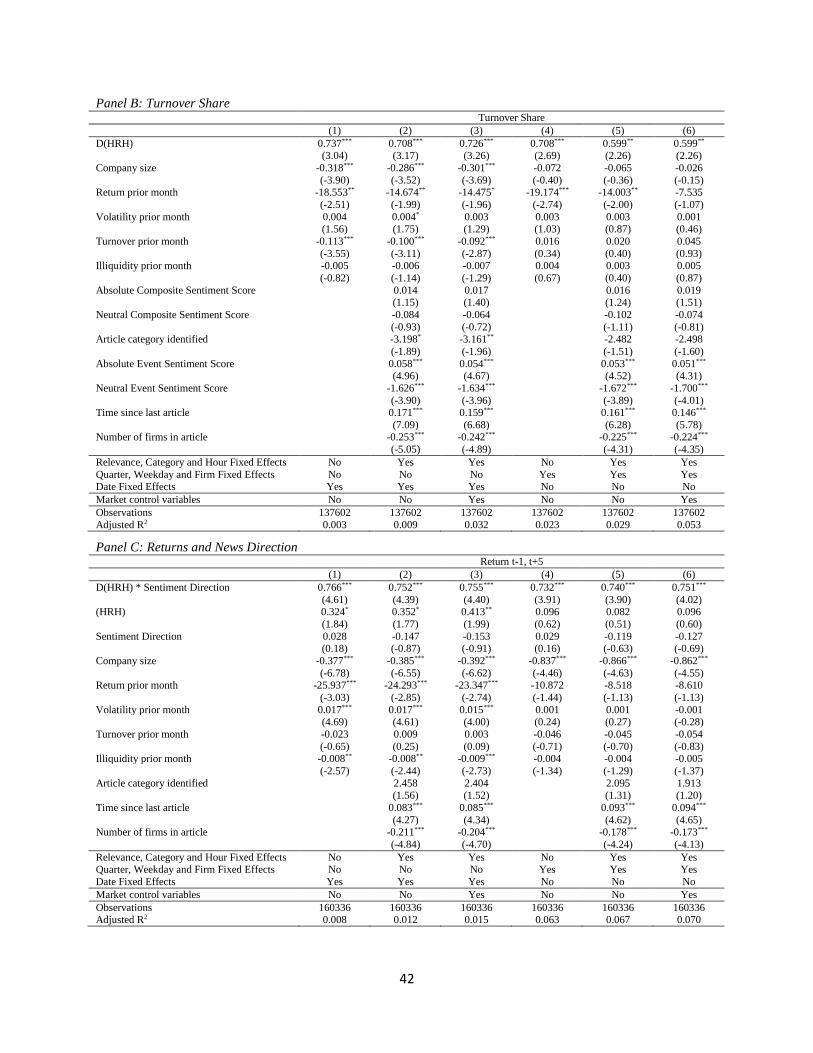
42
Panel B: Turnover Share Turnover Share
(1) (2) (3) (4) (5) (6)
D(HRH) 0.737*** 0.708*** 0.726*** 0.708*** 0.599** 0.599** (3.04) (3.17) (3.26) (2.69) (2.26) (2.26)
Company size -0.318*** -0.286*** -0.301*** -0.072 -0.065 -0.026
(-3.90) (-3.52) (-3.69) (-0.40) (-0.36) (-0.15) Return prior month -18.553** -14.674** -14.475* -19.174*** -14.003** -7.535
(-2.51) (-1.99) (-1.96) (-2.74) (-2.00) (-1.07)
Volatility prior month 0.004 0.004* 0.003 0.003 0.003 0.001 (1.56) (1.75) (1.29) (1.03) (0.87) (0.46)
Turnover prior month -0.113*** -0.100*** -0.092*** 0.016 0.020 0.045
(-3.55) (-3.11) (-2.87) (0.34) (0.40) (0.93) Illiquidity prior month -0.005 -0.006 -0.007 0.004 0.003 0.005
(-0.82) (-1.14) (-1.29) (0.67) (0.40) (0.87)
Absolute Composite Sentiment Score 0.014 0.017 0.016 0.019 (1.15) (1.40) (1.24) (1.51)
Neutral Composite Sentiment Score -0.084 -0.064 -0.102 -0.074
(-0.93) (-0.72) (-1.11) (-0.81) Article category identified -3.198* -3.161** -2.482 -2.498
(-1.89) (-1.96) (-1.51) (-1.60)
Absolute Event Sentiment Score 0.058*** 0.054*** 0.053*** 0.051*** (4.96) (4.67) (4.52) (4.31)
Neutral Event Sentiment Score -1.626*** -1.634*** -1.672*** -1.700***
(-3.90) (-3.96) (-3.89) (-4.01) Time since last article 0.171*** 0.159*** 0.161*** 0.146***
(7.09) (6.68) (6.28) (5.78) Number of firms in article -0.253*** -0.242*** -0.225*** -0.224***
(-5.05) (-4.89) (-4.31) (-4.35)
Relevance, Category and Hour Fixed Effects No Yes Yes No Yes Yes
Quarter, Weekday and Firm Fixed Effects No No No Yes Yes Yes Date Fixed Effects Yes Yes Yes No No No
Market control variables No No Yes No No Yes
Observations 137602 137602 137602 137602 137602 137602
Adjusted R2 0.003 0.009 0.032 0.023 0.029 0.053
Panel C: Returns and News Direction Return t-1, t+5
(1) (2) (3) (4) (5) (6)
D(HRH) * Sentiment Direction 0.766*** 0.752*** 0.755*** 0.732*** 0.740*** 0.751***
(4.61) (4.39) (4.40) (3.91) (3.90) (4.02) (HRH) 0.324* 0.352* 0.413** 0.096 0.082 0.096
(1.84) (1.77) (1.99) (0.62) (0.51) (0.60)
Sentiment Direction 0.028 -0.147 -0.153 0.029 -0.119 -0.127 (0.18) (-0.87) (-0.91) (0.16) (-0.63) (-0.69)
Company size -0.377*** -0.385*** -0.392*** -0.837*** -0.866*** -0.862***
(-6.78) (-6.55) (-6.62) (-4.46) (-4.63) (-4.55) Return prior month -25.937*** -24.293*** -23.347*** -10.872 -8.518 -8.610
(-3.03) (-2.85) (-2.74) (-1.44) (-1.13) (-1.13)
Volatility prior month 0.017*** 0.017*** 0.015*** 0.001 0.001 -0.001 (4.69) (4.61) (4.00) (0.24) (0.27) (-0.28)
Turnover prior month -0.023 0.009 0.003 -0.046 -0.045 -0.054
(-0.65) (0.25) (0.09) (-0.71) (-0.70) (-0.83) Illiquidity prior month -0.008** -0.008** -0.009*** -0.004 -0.004 -0.005
(-2.57) (-2.44) (-2.73) (-1.34) (-1.29) (-1.37)
Article category identified 2.458 2.404 2.095 1.913 (1.56) (1.52) (1.31) (1.20)
Time since last article 0.083*** 0.085*** 0.093*** 0.094***
(4.27) (4.34) (4.62) (4.65) Number of firms in article -0.211*** -0.204*** -0.178*** -0.173***
(-4.84) (-4.70) (-4.24) (-4.13)
Relevance, Category and Hour Fixed Effects No Yes Yes No Yes Yes Quarter, Weekday and Firm Fixed Effects No No No Yes Yes Yes
Date Fixed Effects Yes Yes Yes No No No
Market control variables No No Yes No No Yes
Observations 160336 160336 160336 160336 160336 160336 Adjusted R2 0.008 0.012 0.015 0.063 0.067 0.070
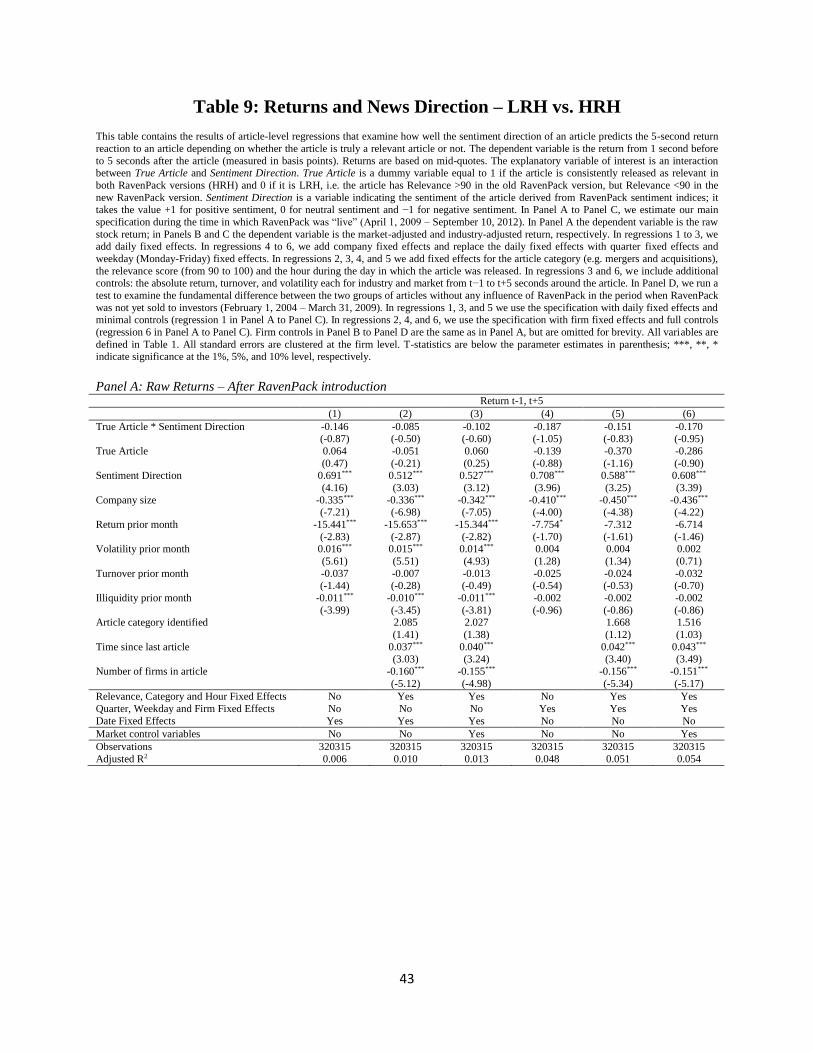
43
Table 9: Returns and News Direction – LRH vs. HRH
This table contains the results of article-level regressions that examine how well the sentiment direction of an article predicts the 5-second return
reaction to an article depending on whether the article is truly a relevant article or not. The dependent variable is the return from 1 second before
to 5 seconds after the article (measured in basis points). Returns are based on mid-quotes. The explanatory variable of interest is an interaction between True Article and Sentiment Direction. True Article is a dummy variable equal to 1 if the article is consistently released as relevant in
both RavenPack versions (HRH) and 0 if it is LRH, i.e. the article has Relevance >90 in the old RavenPack version, but Relevance <90 in the
new RavenPack version. Sentiment Direction is a variable indicating the sentiment of the article derived from RavenPack sentiment indices; it takes the value +1 for positive sentiment, 0 for neutral sentiment and −1 for negative sentiment. In Panel A to Panel C, we estimate our main
specification during the time in which RavenPack was “live” (April 1, 2009 – September 10, 2012). In Panel A the dependent variable is the raw
stock return; in Panels B and C the dependent variable is the market-adjusted and industry-adjusted return, respectively. In regressions 1 to 3, we add daily fixed effects. In regressions 4 to 6, we add company fixed effects and replace the daily fixed effects with quarter fixed effects and
weekday (Monday-Friday) fixed effects. In regressions 2, 3, 4, and 5 we add fixed effects for the article category (e.g. mergers and acquisitions),
the relevance score (from 90 to 100) and the hour during the day in which the article was released. In regressions 3 and 6, we include additional controls: the absolute return, turnover, and volatility each for industry and market from t−1 to t+5 seconds around the article. In Panel D, we run a
test to examine the fundamental difference between the two groups of articles without any influence of RavenPack in the period when RavenPack
was not yet sold to investors (February 1, 2004 – March 31, 2009). In regressions 1, 3, and 5 we use the specification with daily fixed effects and minimal controls (regression 1 in Panel A to Panel C). In regressions 2, 4, and 6, we use the specification with firm fixed effects and full controls
(regression 6 in Panel A to Panel C). Firm controls in Panel B to Panel D are the same as in Panel A, but are omitted for brevity. All variables are
defined in Table 1. All standard errors are clustered at the firm level. T-statistics are below the parameter estimates in parenthesis; ***, **, * indicate significance at the 1%, 5%, and 10% level, respectively.
Panel A: Raw Returns – After RavenPack introduction Return t-1, t+5
(1) (2) (3) (4) (5) (6)
True Article * Sentiment Direction -0.146 -0.085 -0.102 -0.187 -0.151 -0.170 (-0.87) (-0.50) (-0.60) (-1.05) (-0.83) (-0.95)
True Article 0.064 -0.051 0.060 -0.139 -0.370 -0.286
(0.47) (-0.21) (0.25) (-0.88) (-1.16) (-0.90) Sentiment Direction 0.691*** 0.512*** 0.527*** 0.708*** 0.588*** 0.608***
(4.16) (3.03) (3.12) (3.96) (3.25) (3.39)
Company size -0.335*** -0.336*** -0.342*** -0.410*** -0.450*** -0.436*** (-7.21) (-6.98) (-7.05) (-4.00) (-4.38) (-4.22)
Return prior month -15.441*** -15.653*** -15.344*** -7.754* -7.312 -6.714
(-2.83) (-2.87) (-2.82) (-1.70) (-1.61) (-1.46) Volatility prior month 0.016*** 0.015*** 0.014*** 0.004 0.004 0.002
(5.61) (5.51) (4.93) (1.28) (1.34) (0.71)
Turnover prior month -0.037 -0.007 -0.013 -0.025 -0.024 -0.032 (-1.44) (-0.28) (-0.49) (-0.54) (-0.53) (-0.70)
Illiquidity prior month -0.011*** -0.010*** -0.011*** -0.002 -0.002 -0.002
(-3.99) (-3.45) (-3.81) (-0.96) (-0.86) (-0.86) Article category identified 2.085 2.027 1.668 1.516
(1.41) (1.38) (1.12) (1.03)
Time since last article 0.037*** 0.040*** 0.042*** 0.043*** (3.03) (3.24) (3.40) (3.49)
Number of firms in article -0.160*** -0.155*** -0.156*** -0.151***
(-5.12) (-4.98) (-5.34) (-5.17)
Relevance, Category and Hour Fixed Effects No Yes Yes No Yes Yes
Quarter, Weekday and Firm Fixed Effects No No No Yes Yes Yes
Date Fixed Effects Yes Yes Yes No No No
Market control variables No No Yes No No Yes
Observations 320315 320315 320315 320315 320315 320315
Adjusted R2 0.006 0.010 0.013 0.048 0.051 0.054
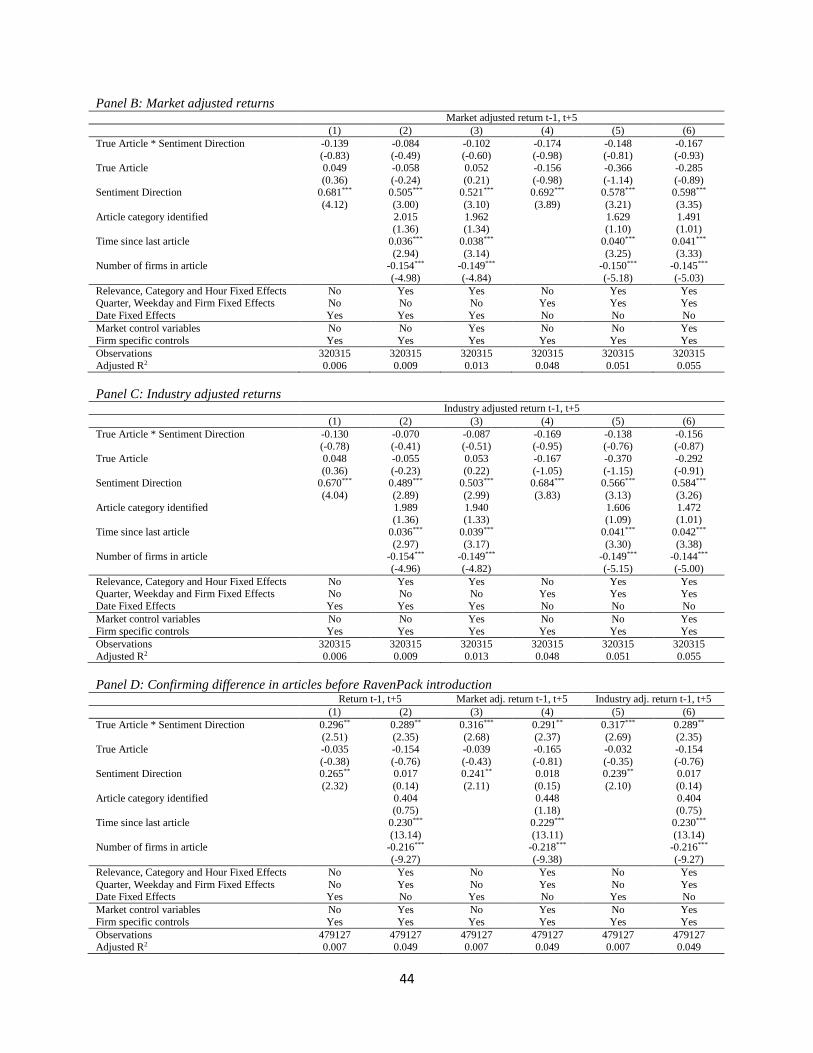
44
Panel B: Market adjusted returns Market adjusted return t-1, t+5
(1) (2) (3) (4) (5) (6)
True Article * Sentiment Direction -0.139 -0.084 -0.102 -0.174 -0.148 -0.167 (-0.83) (-0.49) (-0.60) (-0.98) (-0.81) (-0.93)
True Article 0.049 -0.058 0.052 -0.156 -0.366 -0.285
(0.36) (-0.24) (0.21) (-0.98) (-1.14) (-0.89) Sentiment Direction 0.681*** 0.505*** 0.521*** 0.692*** 0.578*** 0.598***
(4.12) (3.00) (3.10) (3.89) (3.21) (3.35)
Article category identified 2.015 1.962 1.629 1.491 (1.36) (1.34) (1.10) (1.01)
Time since last article 0.036*** 0.038*** 0.040*** 0.041***
(2.94) (3.14) (3.25) (3.33) Number of firms in article -0.154*** -0.149*** -0.150*** -0.145***
(-4.98) (-4.84) (-5.18) (-5.03)
Relevance, Category and Hour Fixed Effects No Yes Yes No Yes Yes Quarter, Weekday and Firm Fixed Effects No No No Yes Yes Yes
Date Fixed Effects Yes Yes Yes No No No
Market control variables No No Yes No No Yes
Firm specific controls Yes Yes Yes Yes Yes Yes
Observations 320315 320315 320315 320315 320315 320315
Adjusted R2 0.006 0.009 0.013 0.048 0.051 0.055
Panel C: Industry adjusted returns Industry adjusted return t-1, t+5
(1) (2) (3) (4) (5) (6)
True Article * Sentiment Direction -0.130 -0.070 -0.087 -0.169 -0.138 -0.156 (-0.78) (-0.41) (-0.51) (-0.95) (-0.76) (-0.87)
True Article 0.048 -0.055 0.053 -0.167 -0.370 -0.292
(0.36) (-0.23) (0.22) (-1.05) (-1.15) (-0.91) Sentiment Direction 0.670*** 0.489*** 0.503*** 0.684*** 0.566*** 0.584***
(4.04) (2.89) (2.99) (3.83) (3.13) (3.26)
Article category identified 1.989 1.940 1.606 1.472 (1.36) (1.33) (1.09) (1.01)
Time since last article 0.036*** 0.039*** 0.041*** 0.042***
(2.97) (3.17) (3.30) (3.38) Number of firms in article -0.154*** -0.149*** -0.149*** -0.144***
(-4.96) (-4.82) (-5.15) (-5.00)
Relevance, Category and Hour Fixed Effects No Yes Yes No Yes Yes Quarter, Weekday and Firm Fixed Effects No No No Yes Yes Yes
Date Fixed Effects Yes Yes Yes No No No
Market control variables No No Yes No No Yes
Firm specific controls Yes Yes Yes Yes Yes Yes
Observations 320315 320315 320315 320315 320315 320315
Adjusted R2 0.006 0.009 0.013 0.048 0.051 0.055
Panel D: Confirming difference in articles before RavenPack introduction Return t-1, t+5 Market adj. return t-1, t+5 Industry adj. return t-1, t+5
(1) (2) (3) (4) (5) (6)
True Article * Sentiment Direction 0.296** 0.289** 0.316*** 0.291** 0.317*** 0.289**
(2.51) (2.35) (2.68) (2.37) (2.69) (2.35) True Article -0.035 -0.154 -0.039 -0.165 -0.032 -0.154
(-0.38) (-0.76) (-0.43) (-0.81) (-0.35) (-0.76) Sentiment Direction 0.265** 0.017 0.241** 0.018 0.239** 0.017
(2.32) (0.14) (2.11) (0.15) (2.10) (0.14)
Article category identified 0.404 0.448 0.404
(0.75) (1.18) (0.75)
Time since last article 0.230*** 0.229*** 0.230***
(13.14) (13.11) (13.14) Number of firms in article -0.216*** -0.218*** -0.216***
(-9.27) (-9.38) (-9.27)
Relevance, Category and Hour Fixed Effects No Yes No Yes No Yes
Quarter, Weekday and Firm Fixed Effects No Yes No Yes No Yes Date Fixed Effects Yes No Yes No Yes No
Market control variables No Yes No Yes No Yes
Firm specific controls Yes Yes Yes Yes Yes Yes
Observations 479127 479127 479127 479127 479127 479127 Adjusted R2 0.007 0.049 0.007 0.049 0.007 0.049

45