Embed Size (px)
Citation preview

Medi-Cal Dental Services Rate Review
July 1, 2015
Submitted by the California Department of Health Care Services
In Fulfillment of the Requirements of Welfare & Institutions Code §14079

2
Table of Contents
Introduction ..................................................................................................................... 3
Scope of Rate Review ..................................................................................................... 3
Methodology .................................................................................................................... 4
Background ..................................................................................................................... 4
Medi-Cal Dental Reimbursements Rates Compared to Other Medicaid Programs ......... 6
Geographical Comparison of Medi-Cal Reimbursement Rates to Commercial Rates .... 6
FFS Medi-Cal Beneficiary Population Characteristics ..................................................... 6
Aid Code Groups ............................................................................................................. 6
Provider Network ............................................................................................................. 8
Ongoing Program Improvement ...................................................................................... 8
Appendix 1 – CDT Procedure Code Description ......................................................... 9
Appendix 2- SFY 2012-2013, Percentage of 25 Most Utilized Denti-Cal Procedures Reimbursement Rate Comparison............................................................................. 10
Appendix 3- SFY 2013-2014, Percentage of 25 Most Utilized Denti-Cal Procedures Reimbursement Rates Compared to Others .............................................................. 12
Appendix 4 – SFY 2012-2013, Average Percentage Denti-Cal Pays of Regional Commercial Rates ..................................................................................................... 14
Appendix 5 – SFY 2013-2014, Average Percentage Denti-Cal Pays of Regional Commercial Rates ..................................................................................................... 15
Appendix 6 – 2014 Total Population .......................................................................... 16
Appendix 7 – 2014 Averages by Dental Plan Model (Child) ...................................... 17
Appendix 8 – 2014 Averages by Dental Plan Model (Adult) ...................................... 18
Appendix 9 – 2014 Total Reimbursement by Aid Code Group (Child) ....................... 19
Appendix 10 – 2014 Total Count of Service Units by Aid Code Group (Child) .......... 20
Appendix 11 – 2014 Total Count of Claims by Aid Code Group (Child)..................... 21
Appendix 12 – 2014 Total Reimbursement by Aid Code Group (Adult) ..................... 22
Appendix 13 – Total Count of Service Units by Aid Code Group (Adult) ................... 23
Appendix 14 – 2014 Total Count of Claim by Aid Code Group (Adult) ...................... 24
Appendix 15 – California Geographic Rating Areas................................................... 25
Appendix 16 – Total Children’s Enrollment in the Medi-Cal Program ........................ 26
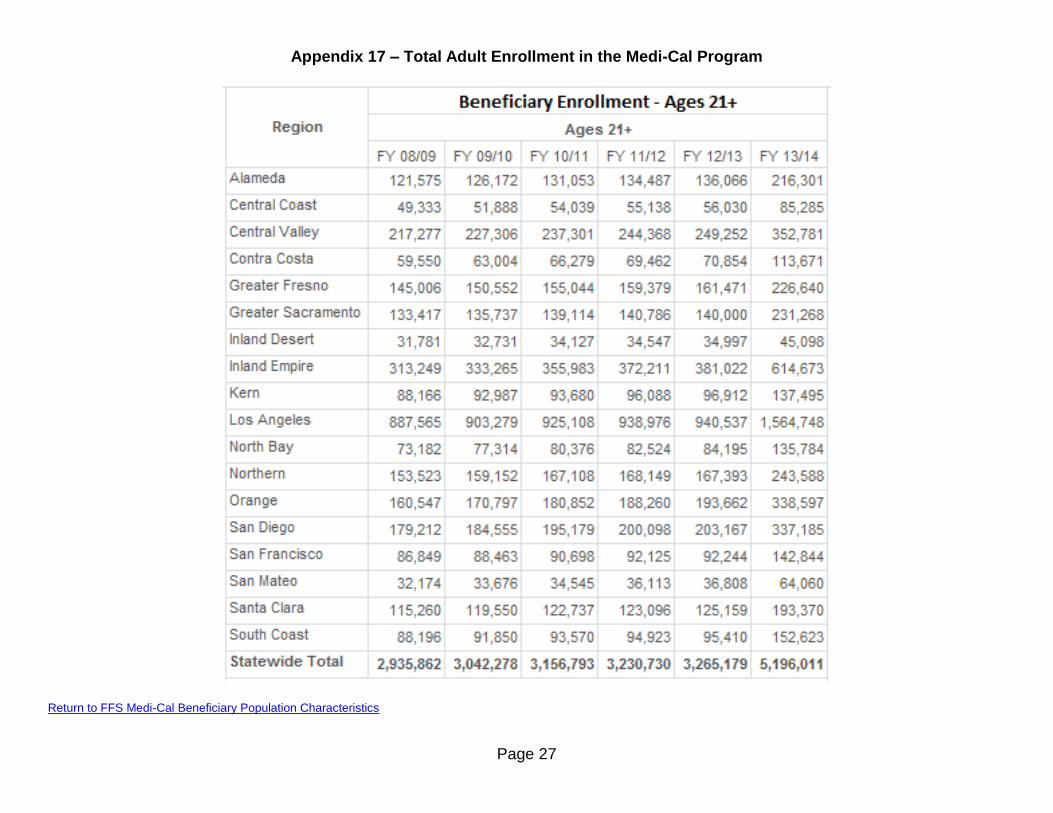
Appendix 17 – Total Adult Enrollment in the Medi-Cal Program ................................ 27
Appendix 18 – Dental Provider Enrollment & Referral List Numbers ......................... 28
Introduction The Department of Health Care Services (DHCS) pursuant to Welfare & Institutions (W&I) Code §14079, must annually review reimbursement levels for Medi-Cal Dental Services (Denti-Cal). To undertake this analysis, DHCS compared reimbursement rates of the top 25 most utilized Denti-Cal Fee-For-Service (FFS) procedures, with other comparable states’ Medicaid Programs, in addition to the commercial rates from five different geographic regions around the nation. Scope of Rate Review While W&I Code §14079 requires DHCS to review Medi-Cal reimbursement levels for dentists, and to periodically revise such rates to ensure “reasonable access” for Medi-Cal beneficiaries, it is important to note that several significant developments have occurred in the field of rates and access in the 23 years since it was last amended. Most significantly, the courts themselves have recognized that a reimbursement rate’s relationship to access is an exceedingly complicated, multi-faceted analysis. In Managed Pharmacy Care v. Sebelius1, the Ninth Circuit noted that discretion should be afforded to the federal government’s review of DHCS rates, in large part, relying on a comprehensive 82-page access monitoring plan which identified 23 different measures that DHCS will study on a recurring basis to ensure the State Plan Amendment (SPA) [that, in this case, reduced rates by 10 percent] do not negatively affect beneficiary access. These measures address the three categories of factors MACPAC [the federal Medicaid and CHIP Payment and Access Commission] identified as affecting access: beneficiary data, provider availability data, and service utilization data. The Ninth Circuit concluded: “The [federal] agency appropriately considered the State’s monitoring plan.”2 Consistent with this federal regulatory theme, just a few months ago, the United States Supreme Court confirmed that the complex analysis, which applies to rate setting means that Medicaid rate challenges, do not allow a private right of action or claim upon which legal relief can be granted. Given these recent legal actions, DHCS must reiterate that a reimbursement rate and its relationship to beneficiary access is not a strict or linear one. Instead, there are a multitude of factors that must be considered and addressed when ensuring appropriate access to covered services.
1 Managed Pharmacy Care v. Sebelius, 716 F.3d 1235, 1249 (9th Cir. 2013)
2 Managed Pharmacy Care, at p. 1250
Page 4
Methodology Denti-Cal is provided through two delivery systems: Dental Managed Care (DMC) and Denti-Cal FFS. DMC ensures the provision of all medically necessary dental services through DMC plan enrolled providers. DMC plans receive a monthly per member, per month capitation rate. The capitation rates are actuarially sound based upon data from Denti-Cal FFS. Denti-Cal FFS provides services through providers enrolled by DHCS’ current Fiscal Intermediary (FI) Delta Dental. FFS providers are paid according to a Schedule of Maximum Allowances (SMA), which denotes the maximum dollar amount payable for each dental benefit of Denti-Cal. The SMA is defined in the FFS Manual of Criteria (MOC) in accordance with W&I Code §14105.05. Throughout this review, these payments may also be referenced as reimbursement and/or payment rates. Adjustments to the MOC are established through the state agency’s adoption of regulations specified in California Code of Regulations (CCR) §51501. These payment rates are periodically modified, and within the last 25 years, several adjustments of the payment rates have occurred. This rate review compares the SMA to other states’ Medicaid reimbursement rates, in addition to commercial reimbursement rates. In order for providers to bill Denti-Cal, they use Current Dental Terminology (CDT) codes, which are developed by the American Dental Association (ADA) as the standard coding system to document and communicate accurate information about dental treatment procedures and services. Throughout this document “CDT codes” will be used synonymously with “procedure codes.” This review will examine the most recent data available, covering state fiscal years (SFY) 2012-2013 and 2013-2014. The most recent SFY were chosen to review the current rates of reimbursement to dentists and the reasonable access of services for Medi-Cal beneficiaries, which includes previously transitioned populations into Medi-Cal. Background Denti-Cal offers a range of dental services to eligible beneficiaries. The array of services includes: diagnostic, preventive, restorative, and endodontic services; periodontics; removable and fixed prosthodontics; maxillofacial prosthetics; implant services; oral and maxillofacial surgery; and orthodontic and adjunctive services. The appropriateness of many of these dental benefits depends on a beneficiary’s eligibility, medical conditions, and age. Eligible children currently receive full scope benefits while eligible adults receive a modified benefit package, which includes preventive, diagnostic, and restorative services. Full scope services for adults were eliminated on July 1, 2009, but a modified adult dental benefit was restored in May 2014, in accordance with California’s Alternative Benefit Plan, SPA CA-14-018.

Page 5
Over the years, Denti-Cal FFS rates have fluctuated, sometimes significantly, by way of actions taken by both the courts and the Legislature. Some of the most notable examples are:
In response to a federal court lawsuit from the 1990’s, Clark v. Kizer/Coye, Denti-Cal FFS rates were increased to 40-55 percent of average billing rates in 1991, and later increased to 80 percent of average billing rates by an additional court order in 1992;
In 2000, pursuant to budget action, Medi-Cal implemented a rate increase of 6.8 percent for dental services and added two regular cleanings and two dental exams to the scope of covered benefits for all beneficiaries (May 2000 Estimate; November 2000 Estimate);
Directives pursuant to Assembly Bill (AB) 1762 (Chapter 230, Statutes of 2003), effective January 1, 2004, reduced all Denti-Cal FFS rates by five percent3;
On July 1, 2008, pursuant to ABX 3 5, DHCS implemented a ten percent provider payment reduction, which continued until August 18, 2008, at which time the federal district court issued an injunction to halt the application of the payment reduction to certain providers, including dentists;
o On September 9, 2008, DHCS ceased applying the ten percent provider payment reduction to Denti-Cal providers, retroactive to the date of the injunction.4
On August 1, 2013, pursuant to AB 97 (Chapter 3, Statutes of 2011), DHCS announced implementation of a ten percent provider payment reduction, beginning October 1, 2013. The reduction was retroactive for services performed on or after June 1, 20115;
Since November 5, 2013, pursuant to the Budget Act of 2013, the ten percent provider payment reduction has been modified to be prospective only for dental service providers, thus eliminating the need for retroactive payment recoupment; and
Effective December 1, 2013, DHCS exempted dental pediatric surgery centers from the provider payment reduction imposed by AB 97.
The rates in this report reflect the provider rate reductions implemented pursuant to AB 97; however, the Budget Act of 2015 includes restoration of the provider payment reductions for dental and applicable ancillary services, increasing rates for most dental services by up to ten percent effective July 1, 2015.
3 California Medi-Cal Dental. Denti-Cal Bulletin. November 2003.
Retrieved from http://www.denti-cal.ca.gov/provsrvcs/bulletins/Volume19_33.pdf 4 California Medi-Cal Dental. Denti-Cal Bulletin. October 2008.
Retrieved from http://www.denti-cal.ca.gov/provsrvcs/bulletins/Volume_24_Number_38.pdf 5 California Medi-Cal Dental. Denti-Cal Bulletin. August 2013.
Retrieved from http://www.denti-cal.ca.gov/provsrvcs/bulletins/Volume_29_Number_15.pdf
Page 6
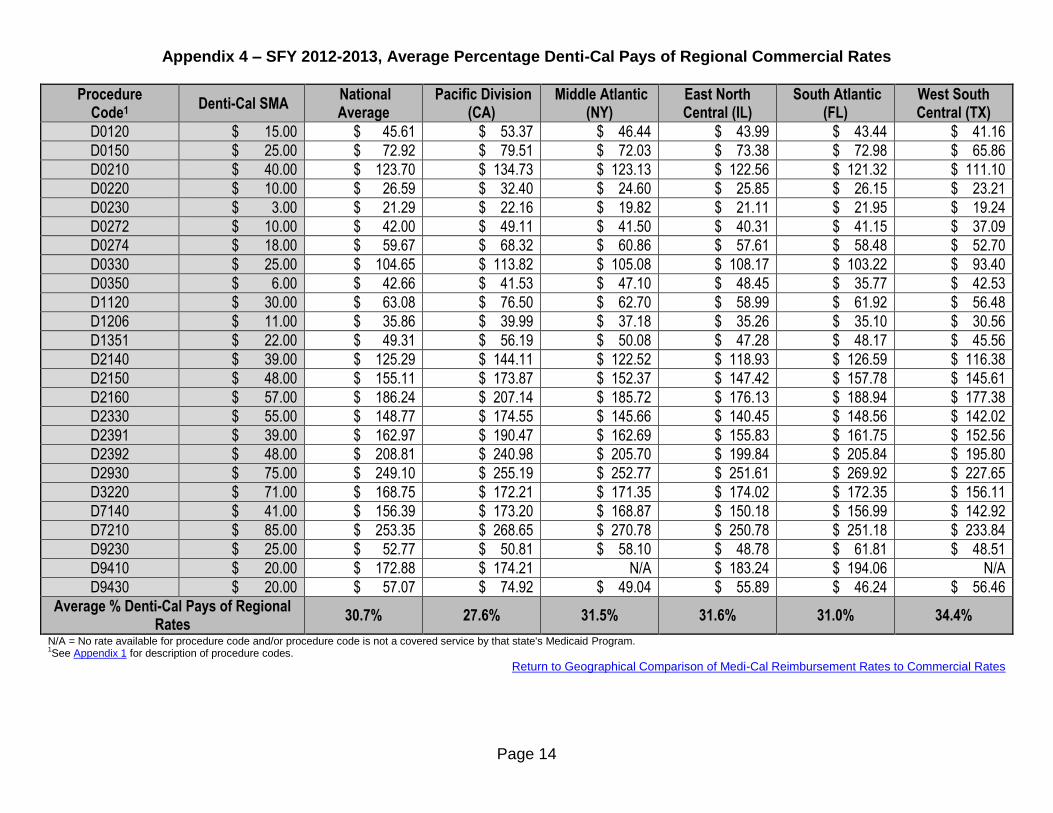
Medi-Cal Dental Reimbursements Rates Compared to Other Medicaid Programs DHCS compared the reimbursement rates of Denti-Cal FFS’ 25 most utilized procedure codes Appendix 1 CDT Procedure Code Description to the same 25 procedure codes from other states’ Medicaid dental fee schedules. These 25 procedures made up approximately 85 percent of billed procedures in FY 2012-13 and FY 2013-14. California’s SMA for Denti-Cal FFS pays an average of 86.1 percent of Florida’s Medicaid Program’s dental fee schedule6, 65.5 percent of Texas’7, 75.4 percent of New York’s8, and 129.2 percent of Illinois’ Medicaid Program’s dental fee index9. Appendix 2 FY 2012-13 and Appendix 3 FY 2013-14 Geographical Comparison of Medi-Cal Reimbursement Rates to Commercial Rates Prevailing customary dental charges within California were compared to Denti-Cal FFS rates using the ADA’s 2013 Survey of Dental Fees for General Practitioners10. DHCS compared the average payment rate of the same 25 most utilized procedure codes with five different geographical regions as represented in Appendix 4 and Appendix 5. The Pacific Division, which includes the State of California, was selected to represent the prevailing customary dental charges within California and the Pacific Region. FFS Medi-Cal Beneficiary Population Characteristics In order to examine the characteristics of the FFS Medi-Cal beneficiary population, DHCS stratified Medi-Cal beneficiaries with three months or more of continuous eligibility by aid code group and age group (children/adults) for calendar year (CY) 2014.
Aid Code Groups Appendix 6 – 2014 Total Population Appendix 7 – 2014 Averages by Dental Plan Model (Child) Appendix 8 – 2014 Averages by Dental Plan Model (Adult) Appendix 9 – 2014 Total Reimbursement by Aid Code Group (Child) Appendix 10 – 2014 Total Count of Service Units by Aid Code Group (Child) Appendix 11 – 2014 Total Count of Claims by Aid Code Group (Child) Appendix 12 – 2014 Total Reimbursement by Aid Code Group (Adult) Appendix 13 – Total Count of Service Units by Aid Code Group (Adult) Appendix 14 – 2014 Total Count of Claim by Aid Code Group (Adult)
6 Florida Medicaid Dental Fee Schedule. January 2013.
Retrieved from http://www.med-quest.us/pdfs/provider%20memos/medicaid%20fee%20schedule.pdf 7 Texas Medicaid Dental Fee Schedule. April 2015.
Retrieved from http://public.tmhp.com/FeeSchedules/StaticFeeSchedule/FeeSchedules.aspx 8 New York Medicaid Dental Fee Schedule.
Retrieved from https://www.emedny.org/ProviderManuals/Dental/index.aspx 9Illinois Medicaid Dental Fee Schedule. May 2015.
Retrieved from https://www2.illinois.gov/hfs/SiteCollectionDocuments/DentalFeeSchedule050115.pdf 10
2013 Survey of Dental Fees. Retrieved from http://success.ada.org/en/practice/operations/financial-management/2013-survey-of-dental-fees

Page 7
In 2014, Denti-Cal reimbursed dental providers approximately $1.1 billion for approximately 42 million claims across all aid code groups for nearly 14 million beneficiaries. This total is a combined sum of DMC and FFS Providers. The distribution of services and reimbursement between the adult and child populations of both DMC and FFS is displayed in Appendix 6. For both the adult and child populations, the majority of beneficiary claims fall under FFS, and combined make up approximately 94 percent of the total beneficiary population. Additionally, the child FFS population accounts for approximately 70 percent of the 2014 total claims, with the adult FFS population accounting for approximately 24 percent of the total claims. DHCS stratified beneficiary enrollment by children (ages 0-20) and adults (ages 21+) and examined the results over the last six SFY. In addition, data was compared by region using California Geographic Rating Areas established by the Centers for Medicare and Medicaid Services (CMS). While CMS split Los Angeles into two regions based on zip codes, DHCS was unable to do so at this time. A list of the regions and the county(s) included within each region can be located in Appendix 15. Beneficiary enrollment numbers include the number of unduplicated beneficiaries, who had full scope benefits, no share of cost, and three months or more of continuous eligibility in the measurement year. Children (Ages 0-20) Data illustrates statewide enrollment for children has increased since FY 2008-09, particularly between FY 2011-12 and FY 2012-13, during the Healthy Families Program (HFP) transition to Medi-Cal11 of 2013. Unduplicated numbers of enrolled children with full scope benefits, no share of cost, and at least three months of continuous eligibility during the measurement year for FY 2008-09 through FY 2013-14, is detailed in Appendix 16. In FY 2008-09, 3,687,103 children were eligible, compared to 5,150,250 in FY 2013-14, demonstrating a 39.7 percent increase in unduplicated numbers of enrolled eligible children since FY 2008-09. Adults (21+) Data illustrates statewide enrollment for adults has increased steadily since FY 2008-09. Between FY 2012-13 and FY 2013-14, the percentage increase of enrollment for adults jumped by over 55 percent statewide, due in large part to the Affordable Care Act (ACA) – beginning January 2014, Medi-Cal expanded to cover low-income, childless adults. Since the ACA expansion, Medi-Cal’s total beneficiary population increased from 7.6 million FY 2012-13, to approximately 10 million in FY 2013-2014. The number of unduplicated adults enrolled with full scope benefits, no share of cost, and at least three months of continuous eligibility during the measurement year for FY 2008-09 through FY 2013-14, is detailed in Appendix 17. There were 2,935,862 eligible adults in FY 2008-2009, compared to 5,196,011 in FY 2013-14, demonstrating a 77 percent increase of unduplicated enrolled eligible adults since FY 2008-2009.
11
HFP Transition to Medi-Cal pursuant to AB 1494 (Chapter 28, Statutes of 2012), as amended by AB 1468 (Chapter 438, Statutes
of 2012)

Page 8
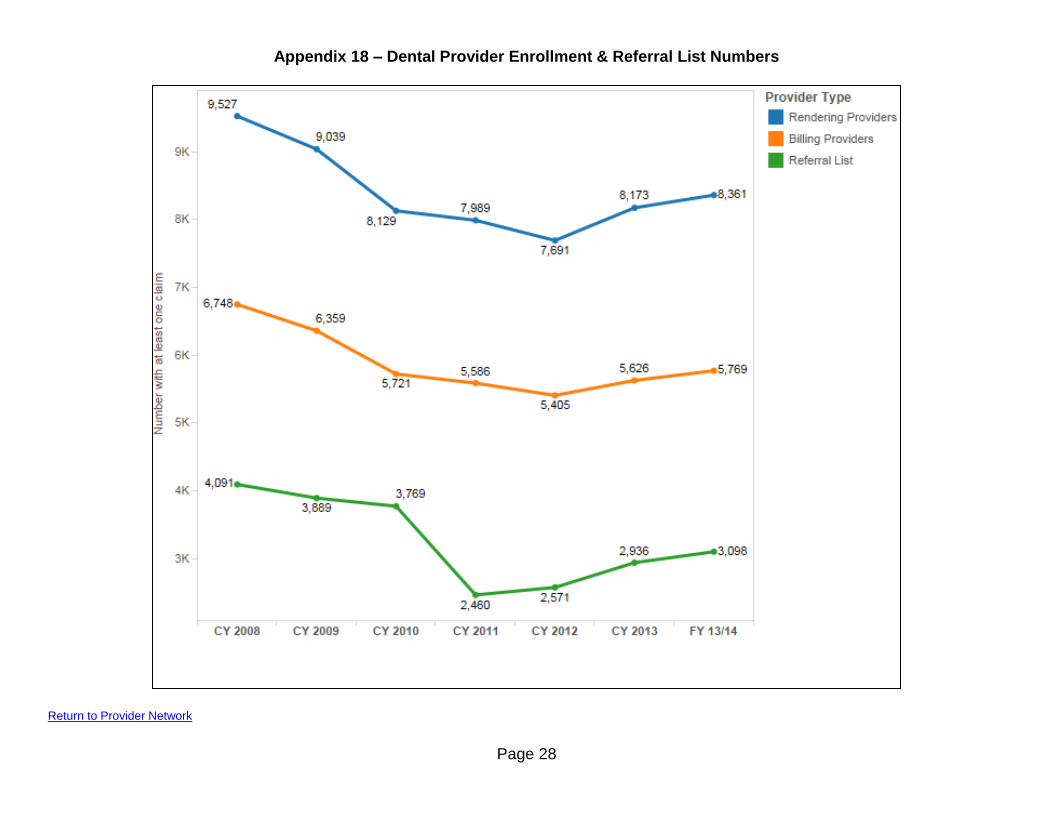
Provider Network Rendering providers are defined as those who perform the dental services, and billing providers are the provider’s office location where the dental service was provided. The number of both provider types in the Denti-Cal FFS network with at least one paid claim for the measurement year for CY 2008 through CY 2013, and FY 2013-14, is illustrated in Appendix 18. In addition, the line graph in Appendix 18 shows the number of providers on the referral list for the aforementioned years. Data shows a 12.6 percent decrease in rendering providers and 14.5 percent decrease in billing providers since 2008. Additionally, since 2008, the number of providers on the referral list has decreased by 24.2 percent. Note that the number of providers in each of the three noted categories increased between CY 2013 and FY 2013-14. Ongoing Program Improvement Below are a few of the actions DHCS has made in an ongoing effort to continuously improve utilization for beneficiaries, who are entitled to timely and quality services as well as efforts to expand the network of dental providers:
Monitor beneficiary utilization for children and adults, specifically identifying children/adults, who have not seen a dentist;
Develop and implement targeted and focused beneficiary and provider outreach plans with the FI;
Enroll hygienist/para-professionals;
Direct the FI to contract with additional providers, such as mobile vans, in areas where there are limited numbers of providers; and
Establish a new category to capture the number of beneficiaries reporting difficulty in accessing dental appointments.
o Effective September 2013, DHCS started to monitor provider enrollment and disenrollment information to help assess access to care.
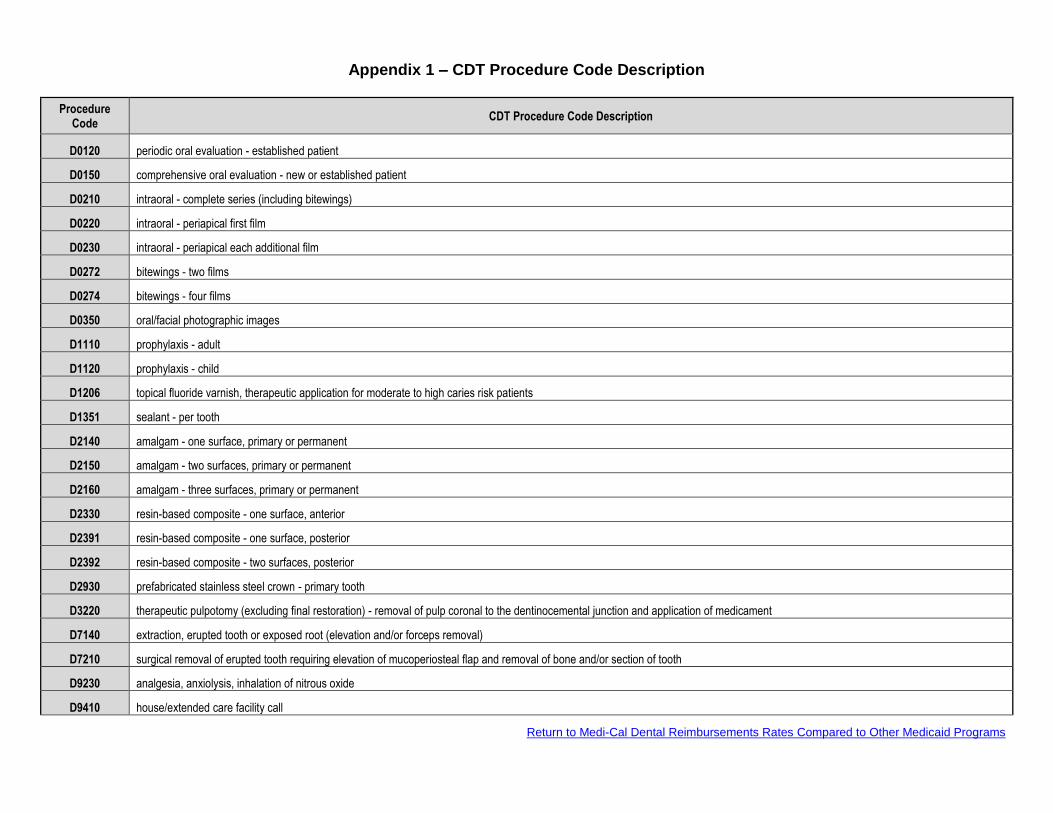
Appendix 1 – CDT Procedure Code Description
Procedure Code
CDT Procedure Code Description
D0120 periodic oral evaluation - established patient
D0150 comprehensive oral evaluation - new or established patient
D0210 intraoral - complete series (including bitewings)
D0220 intraoral - periapical first film
D0230 intraoral - periapical each additional film
D0272 bitewings - two films
D0274 bitewings - four films
D0350 oral/facial photographic images
D1110 prophylaxis - adult
D1120 prophylaxis - child
D1206 topical fluoride varnish, therapeutic application for moderate to high caries risk patients
D1351 sealant - per tooth
D2140 amalgam - one surface, primary or permanent
D2150 amalgam - two surfaces, primary or permanent
D2160 amalgam - three surfaces, primary or permanent
D2330 resin-based composite - one surface, anterior
D2391 resin-based composite - one surface, posterior
D2392 resin-based composite - two surfaces, posterior
D2930 prefabricated stainless steel crown - primary tooth
D3220 therapeutic pulpotomy (excluding final restoration) - removal of pulp coronal to the dentinocemental junction and application of medicament
D7140 extraction, erupted tooth or exposed root (elevation and/or forceps removal)
D7210 surgical removal of erupted tooth requiring elevation of mucoperiosteal flap and removal of bone and/or section of tooth
D9230 analgesia, anxiolysis, inhalation of nitrous oxide
D9410 house/extended care facility call
Return to Medi-Cal Dental Reimbursements Rates Compared to Other Medicaid Programs

Page 10
Appendix 2- SFY 2012-2013, Percentage of 25 Most Utilized Denti-Cal Procedures Reimbursement Rate Comparison
Procedure Code1 SMA
New York Reimbursement
Rates and % Denti-Cal Pays
Illinois Reimbursement Rates and % Denti-Cal Pays
Florida Reimbursement Rates and % Denti-Cal Pays
Texas Reimbursement Rates and % Denti-Cal
Pays
D0120 $ 15.00 $ 25.00 60.0% $ 28.00 53.6% $ 29.12 51.5% $ 28.85 52.0%
D0150 $ 25.00 $ 30.00 83.3% $ 17.52 142.7% $ 29.12 85.9% $ 35.32 70.8%
D0210 $ 40.00 $ 50.00 80.0% $ 25.06 159.6% $ 58.24 68.7% $ 70.64 56.6%
D0220 $ 10.00 $ 8.00 125.0% $ 4.66 214.6% $ 10.92 91.6% $ 12.56 79.6%
D0230 $ 3.00 $ 5.00 60.0% $ 3.16 94.9% $ 6.76 44.4% $ 11.51 26.1%
D0272 $ 10.00 $ 14.00 71.4% $ 7.83 127.7% $ 18.93 52.8% $ 23.38 42.8%
D0274 $ 18.00 $ 24.00 75.0% $ 14.07 127.9% $ 25.48 70.6% $ 34.61 52.0%
D0330 $ 25.00 $ 35.00 71.4% $ 18.81 132.9% $ 47.32 52.8% $ 63.78 39.2%
D0350 $ 6.00 $ 12.00 50.0% N/A N/A $ 26.00 23.1% $ 18.38 32.6%
D1120 $ 30.00 $ 43.00 69.8% $ 41.00 73.2% $ 26.00 115.4% $ 36.75 81.6%
D1206 $ 11.00 $ 30.00 36.7% $ 26.00 42.3% $ 4.16 264.4% $ 14.70 74.8%
D1351 $ 22.00 $ 35.00 62.9% $ 36.00 61.1% $ 24.32 90.5% $ 28.24 77.9%
D2140 $ 39.00 $ 50.00 78.0% $ 25.68 151.9% N/A N/A $ 64.41 60.5%
D2150 $ 48.00 $ 67.00 71.6% $ 40.08 119.8% N/A N/A $ 85.71 56.0%
D2160 $ 57.00 $ 82.00 69.5% $ 48.33 117.9% N/A N/A $ 109.19 52.2%
D2330 $ 55.00 $ 50.00 110.0% $ 28.80 191.0% N/A N/A $ 77.75 70.7%
D2391 $ 39.00 $ 50.00 78.0% $ 25.68 151.9% N/A N/A $ 82.40 47.3%
D2392 $ 48.00 $ 67.00 71.6% $ 40.08 119.8% N/A N/A $ 108.00 44.4%
D2930 $ 75.00 $ 116.00 64.7% $ 61.11 122.7% $ 74.36 100.9% $ 152.94 49.0%

Page 11
Procedure Code1 SMA
New York Reimbursement
Rates and % Denti-Cal Pays
Illinois Reimbursement Rates and % Denti-Cal Pays
Florida Reimbursement Rates and % Denti-Cal Pays
Texas Reimbursement Rates and % Denti-Cal
Pays
D3220 $ 71.00 $ 87.00 81.6% $ 43.87 161.8% $ 67.60 105.0% $ 86.20 82.4%
D7140 $ 41.00 $ 50.00 82.0% $ 32.57 125.9% N/A N/A $ 65.70 62.4%
D7210 $ 85.00 $ 85.00 100.0% $ 47.79 177.9% $ 145.60 58.4% $ 100.75 84.4%
D9230 $ 25.00 N/A N/A $ 21.65 115.5% $ 55.99 44.7% $ 27.81 89.9%
D9410 $ 20.00 $ 50.00 40.0% N/A N/A N/A N/A $ 24.50 81.6%
D9430 $ 20.00 $ 20.00 100.0% N/A N/A N/A N/A $ 14.70 136.1%
Average % Denti-Cal Pays of Other States' Medicaid
Rates 74.7% 126.7% 82.5% 64.1%
N/A = No rate available for procedure code/procedure code is not a covered service by that state's Medicaid Program. 1See Appendix 1 for description of procedure codes.
Return to Medi-Cal Dental Reimbursements Rates Compared to Other Medicaid Programs

Page 12
Appendix 3- SFY 2013-2014, Percentage of 25 Most Utilized Denti-Cal Procedures Reimbursement Rates Compared to Others
Procedure Code1 SMA
New York Reimbursement Rates and % Denti-Cal
Pays
Illinois Reimbursement Rates and % Denti-Cal
Pays
Florida Reimbursement Rates and % Denti-Cal Pays
Texas Reimbursement
Rates and % Denti-Cal Pays
D0120 $ 15.00 $ 25.00 60.0% $ 28.00 53.6% $ 29.12 51.5% $ 28.85 52.0%
D0150 $ 25.00 $ 30.00 83.3% $ 17.52 142.7% $ 29.12 85.9% $ 35.32 70.8%
D0210 $ 40.00 $ 50.00 80.0% $ 25.06 159.6% $ 58.24 68.7% $ 70.64 56.6%
D0220 $ 10.00 $ 8.00 125.0% $ 4.66 214.6% $ 10.92 91.6% $ 12.56 79.6%
D0230 $ 3.00 $ 5.00 60.0% $ 3.16 94.9% $ 6.76 44.4% $ 11.51 26.1%
D0272 $ 10.00 $ 14.00 71.4% $ 7.83 127.7% $ 18.93 52.8% $ 23.38 42.8%
D0274 $ 18.00 $ 24.00 75.0% $ 14.07 127.9% $ 25.48 70.6% $ 34.61 52.0%
D0350 $ 6.00 $ 12.00 50.0% N/A N/A $ 26.00 23.1% $ 18.38 32.6%
D1110 $ 40.00 $ 45.00 88.9% $ 21.15 189.1% $ 36.40 109.9% $ 54.88 72.9%
D1120 $ 30.00 $ 43.00 69.8% $ 41.00 73.2% $ 26.00 115.4% $ 36.75 81.6%
D1206 $ 11.00 $ 30.00 36.7% $ 26.00 42.3% $ 4.16 264.4% $ 14.70 74.8%
D1351 $ 22.00 $ 35.00 62.9% $ 36.00 61.1% $ 24.32 90.5% $ 28.24 77.9%
D2140 $ 39.00 $ 50.00 78.0% $ 25.68 151.9% N/A N/A $ 64.41 60.5%
D2150 $ 48.00 $ 67.00 71.6% $ 40.08 119.8% N/A N/A $ 85.71 56.0%
D2160 $ 57.00 $ 82.00 69.5% $ 48.33 117.9% N/A N/A $ 109.19 52.2%
D2330 $ 55.00 $ 50.00 110.0% $ 28.80 191.0% N/A N/A $ 77.75 70.7%
D2391 $ 39.00 $ 50.00 78.0% $ 25.68 151.9% N/A N/A $ 82.40 47.3%
D2392 $ 48.00 $ 67.00 71.6% $ 40.08 119.8% N/A N/A $ 108.00 44.4%
D2930 $ 75.00 $ 116.00 64.7% $ 61.11 122.7% $ 74.36 100.9% $ 152.94 49.0%

Page 13
Procedure Code1 SMA
New York Reimbursement Rates and % Denti-Cal
Pays
Illinois Reimbursement Rates and % Denti-Cal
Pays
Florida Reimbursement Rates and % Denti-Cal Pays
Texas Reimbursement
Rates and % Denti-Cal Pays
D3220 $ 71.00 $ 87.00 81.6% $ 43.87 161.8% $ 67.60 105.0% $ 86.20 82.4%
D7140 $ 41.00 $ 50.00 82.0% $ 32.57 125.9% N/A N/A $ 65.70 62.4%
D7210 $ 85.00 $ 85.00 100.0% $ 47.79 177.9% $ 145.60 58.4% $ 100.75 84.4%
D9230 $ 25.00 N/A N/A $ 21.65 115.5% $ 55.99 44.7% $ 27.81 89.9%
D9410 $ 20.00 $ 50.00 40.0% N/A N/A N/A N/A $ 24.50 81.6%
D9430 $ 20.00 $ 20.00 100.0% N/A N/A N/A N/A $ 14.70 136.1%
Average % Denti-Cal Pays of Other States' Medicaid
Rates 75.4% 129.2% 86.1% 65.5%
N/A = No rate available for procedure code/procedure code is not a covered service by that state's Medicaid Program. 1See Appendix 1 for description of procedure codes.
Return to Medi-Cal Dental Reimbursements Rates Compared to Other Medicaid Programs
Page 14
Appendix 4 – SFY 2012-2013, Average Percentage Denti-Cal Pays of Regional Commercial Rates
Procedure Code1
Denti-Cal SMA National Average
Pacific Division (CA)
Middle Atlantic (NY)
East North Central (IL)
South Atlantic (FL)
West South Central (TX)
D0120 $ 15.00 $ 45.61 $ 53.37 $ 46.44 $ 43.99 $ 43.44 $ 41.16
D0150 $ 25.00 $ 72.92 $ 79.51 $ 72.03 $ 73.38 $ 72.98 $ 65.86
D0210 $ 40.00 $ 123.70 $ 134.73 $ 123.13 $ 122.56 $ 121.32 $ 111.10
D0220 $ 10.00 $ 26.59 $ 32.40 $ 24.60 $ 25.85 $ 26.15 $ 23.21
D0230 $ 3.00 $ 21.29 $ 22.16 $ 19.82 $ 21.11 $ 21.95 $ 19.24
D0272 $ 10.00 $ 42.00 $ 49.11 $ 41.50 $ 40.31 $ 41.15 $ 37.09
D0274 $ 18.00 $ 59.67 $ 68.32 $ 60.86 $ 57.61 $ 58.48 $ 52.70
D0330 $ 25.00 $ 104.65 $ 113.82 $ 105.08 $ 108.17 $ 103.22 $ 93.40
D0350 $ 6.00 $ 42.66 $ 41.53 $ 47.10 $ 48.45 $ 35.77 $ 42.53
D1120 $ 30.00 $ 63.08 $ 76.50 $ 62.70 $ 58.99 $ 61.92 $ 56.48
D1206 $ 11.00 $ 35.86 $ 39.99 $ 37.18 $ 35.26 $ 35.10 $ 30.56
D1351 $ 22.00 $ 49.31 $ 56.19 $ 50.08 $ 47.28 $ 48.17 $ 45.56
D2140 $ 39.00 $ 125.29 $ 144.11 $ 122.52 $ 118.93 $ 126.59 $ 116.38
D2150 $ 48.00 $ 155.11 $ 173.87 $ 152.37 $ 147.42 $ 157.78 $ 145.61
D2160 $ 57.00 $ 186.24 $ 207.14 $ 185.72 $ 176.13 $ 188.94 $ 177.38
D2330 $ 55.00 $ 148.77 $ 174.55 $ 145.66 $ 140.45 $ 148.56 $ 142.02
D2391 $ 39.00 $ 162.97 $ 190.47 $ 162.69 $ 155.83 $ 161.75 $ 152.56
D2392 $ 48.00 $ 208.81 $ 240.98 $ 205.70 $ 199.84 $ 205.84 $ 195.80
D2930 $ 75.00 $ 249.10 $ 255.19 $ 252.77 $ 251.61 $ 269.92 $ 227.65
D3220 $ 71.00 $ 168.75 $ 172.21 $ 171.35 $ 174.02 $ 172.35 $ 156.11
D7140 $ 41.00 $ 156.39 $ 173.20 $ 168.87 $ 150.18 $ 156.99 $ 142.92
D7210 $ 85.00 $ 253.35 $ 268.65 $ 270.78 $ 250.78 $ 251.18 $ 233.84
D9230 $ 25.00 $ 52.77 $ 50.81 $ 58.10 $ 48.78 $ 61.81 $ 48.51
D9410 $ 20.00 $ 172.88 $ 174.21 N/A $ 183.24 $ 194.06 N/A
D9430 $ 20.00 $ 57.07 $ 74.92 $ 49.04 $ 55.89 $ 46.24 $ 56.46
Average % Denti-Cal Pays of Regional Rates
30.7% 27.6% 31.5% 31.6% 31.0% 34.4%
N/A = No rate available for procedure code and/or procedure code is not a covered service by that state's Medicaid Program. 1See Appendix 1 for description of procedure codes.
Return to Geographical Comparison of Medi-Cal Reimbursement Rates to Commercial Rates

Page 15
Appendix 5 – SFY 2013-2014, Average Percentage Denti-Cal Pays of Regional Commercial Rates
Procedure Code1 Denti-Cal
SMA National Average
Pacific Division (CA)
Middle Atlantic (NY)
East North Central (IL)
South Atlantic (FL)
West South Central (TX)
D0120 $ 15.00 $ 45.61 $ 53.37 $ 46.44 $ 43.99 $ 43.44 $ 41.16
D0150 $ 25.00 $ 72.92 $ 79.51 $ 72.03 $ 73.38 $ 72.98 $ 65.86
D0210 $ 40.00 $ 123.70 $ 134.73 $ 123.13 $ 122.56 $ 121.32 $ 111.10
D0220 $ 10.00 $ 26.59 $ 32.40 $ 24.60 $ 25.85 $ 26.15 $ 23.21
D0230 $ 3.00 $ 21.29 $ 22.16 $ 19.82 $ 21.11 $ 21.95 $ 19.24
D0272 $ 10.00 $ 42.00 $ 49.11 $ 41.50 $ 40.31 $ 41.15 $ 37.09
D0274 $ 18.00 $ 59.67 $ 68.32 $ 60.86 $ 57.61 $ 58.48 $ 52.70
D0350 $ 6.00 $ 42.66 $ 41.53 $ 47.10 $ 48.45 $ 35.77 $ 42.53
D1110 $ 40.00 $ 85.38 $ 101.81 $ 86.97 $ 79.37 $ 83.32 $ 76.38
D1120 $ 30.00 $ 63.08 $ 76.50 $ 62.70 $ 58.99 $ 61.92 $ 56.48
D1206 $ 11.00 $ 35.86 $ 39.99 $ 37.18 $ 35.26 $ 35.10 $ 30.56
D1351 $ 22.00 $ 49.31 $ 56.19 $ 50.08 $ 47.28 $ 48.17 $ 45.56
D2140 $ 39.00 $ 125.29 $ 144.11 $ 122.52 $ 118.93 $ 126.59 $ 116.38
D2150 $ 48.00 $ 155.11 $ 173.87 $ 152.37 $ 147.42 $ 157.78 $ 145.61
D2160 $ 57.00 $ 186.24 $ 207.14 $ 185.72 $ 176.13 $ 188.94 $ 177.38
D2330 $ 55.00 $ 148.77 $ 174.55 $ 145.66 $ 140.45 $ 148.56 $ 142.02
D2391 $ 39.00 $ 162.97 $ 190.47 $ 162.69 $ 155.83 $ 161.75 $ 152.56
D2392 $ 48.00 $ 208.81 $ 240.98 $ 205.70 $ 199.84 $ 205.84 $ 195.80
D2930 $ 75.00 $ 249.10 $ 255.19 $ 252.77 $ 251.61 $ 269.92 $ 227.65
D3220 $ 71.00 $ 168.75 $ 172.21 $ 171.35 $ 174.02 $ 172.35 $ 156.11
D7140 $ 41.00 $ 156.39 $ 173.20 $ 168.87 $ 150.18 $ 156.99 $ 142.92
D7210 $ 85.00 $ 253.35 $ 268.65 $ 270.78 $ 250.78 $ 251.18 $ 233.84
D9230 $ 25.00 $ 52.77 $ 50.81 $ 58.10 $ 48.78 $ 61.81 $ 48.51
D9410 $ 20.00 $ 172.88 $ 174.21 N/A $ 183.24 $ 194.06 N/A
D9430 $ 20.00 $ 57.07 $ 74.92 $ 49.04 $ 55.89 $ 46.24 $ 56.46
Average % Denti-Cal Pays of Regional Rates
31.7% 28.3% 32.4% 32.7% 31.9% 35.5%
N/A = No rate available for procedure code and/or procedure code is not a covered service by that state's Medicaid Program. 1See Appendix 1 for description of procedure codes.
Return to Geographical Comparison of Medi-Cal Reimbursement Rates to Commercial Rates

Page 16
Appendix 6 – 2014 Total Population
2014 Adult Population Child Population
Total Population DMC FFS DMC FFS
Total Reimbursement $2,536,466 $416,707,255 $11,737,377 $670,928,656 $1,101,909,754
Total Count of Beneficiaries 212,378 6,269,714 553,317 6,704,952 13,740,361
Total Service units 687,193 9,102,441 3,040,756 28,230,966 41,061,356
Total Claim Count 438,983 10,310,497 1,574,653 29,736,425 42,060,558
Average Service Units Per Beneficiary 3 1 5 4 3
Average Count of Claims Per Beneficiary 2 2 3 4 3
Average Reimbursement Per Beneficiary $12 $66 $21 $100 $80
Average Reimbursement Per Service unit
$4 $46 $4 $24 $27
Average Reimbursement Per Claim $6 $40 $7 $23 $26
*See Appendices 7-14 for breakdown by Aid Code Group
Return to FFS Medi-Cal Beneficiary Population Characteristics

Page 17
Appendix 7 – 2014 Averages by Dental Plan Model (Child)
DMC (Child)
FFS (Child)
Average Reimbursement Per
Beneficiary
Average Service Units
Per Beneficiary
Averaged Claim Count
Per Beneficiary
Average Reimbursement Per Beneficiary
Average Service Units
Per Beneficiary
Averaged Claim Count
Per Beneficiary
133% Poverty $66 93 59 Pub Assist Blind/Disabled $176 226 245
Pub Assist Families $65 324 214 Med Needy Families $163 185 206
Med Indigent Children $59 98 70 HFP Transition $155 193 218
Pub Assist Blind/Disabled $53 108 92 100% Poverty $147 168 187
Med Needy Families $52 177 139 Pub Assist Families $146 169 185
LIHP $29 86 61 133% Poverty $128 146 164
HFP Transition $28 134 97 Med Indigent Children $87 112 125
Med Needy Blind/Disabled $20 7 5 LIHP $77 89 98
Refugee/Entrant $17 5 4 Med Needy Blind/Disabled $70 98 113
CHDP $9 1 1 IRCA/OBRA Aliens $66 29 30
IRCA/OBRA Aliens $8 0 0 Refugee/Entrant $51 41 47
100% Poverty $6 63 28 CHDP $28 26 29
Income Disregard Infant $5 4 2 Medical Inmate/Parolee $26 6 8
Grand Total $45 1,101 772 CHIP $24 10 10
Income Disregard Infant $10 5 6
Income Disregard Preg Woman $9 4 5
Presumptive Eligible $4 1 1
Med Needy Aged $0 - -
Tuberculosis $0 - -
BCCTP $0 - -
Med Indigent Adults $0 - -
Grand Total $94 1,508 1,676
Return to Aid Code Groups

Page 18
Appendix 8 – 2014 Averages by Dental Plan Model (Adult)
DMC (Adult)
FFS (Adult)
Average Reimbursement Per Beneficiary
Average Service
Units Per Beneficiary
Averaged Claim Count
Per Beneficiary
Average
Reimbursement Per Beneficiary
Average Service
Units Per Beneficiary
Averaged Claim Count
Per Beneficiary
Income Disregard Preg Woman $110 1 1 HFP Transition $409 332 362
LIHP $92 670 484 Med Needy Blind/Disabled $152 103 115
Med Indigent Children $85 22 15 Pub Assist Blind/Disabled $148 98 110
Med Indigent Adults $18 4 4 Med Needy Aged $125 106 112
BCCTP $15 7 5 Pub Assist Aged $106 67 74
Med Needy Families $15 133 71 Med Needy Families $96 64 74
Pub Assist Blind/Disabled $11 174 112 BCCTP $76 46 49
Refugee/Entrant $8 11 8 LIHP $73 48 62
Med Needy Aged $8 25 9 Pub Assist Families $69 48 55
Med Needy Blind/Disabled $5 31 29 Refugee/Entrant $52 40 40
Pub Assist Families $4 37 32 Med Indigent Children $51 40 46
Pub Assist Aged $1 6 10 Income Disregard Preg Woman $26 9 13
HFP Transition $0 - - Special Treatment Program $24 2 2
100% Poverty $0 - - 100% Poverty $23 7 7
Grand Total $23 1,121 779 Med Indigent Adults $23 20 24
IRCA/OBRA Aliens $19 3 3
CHDP $17 25 28
Medical Inmate/Parolee $14 2 2
Presumptive Eligible $2 2 3
Tuberculosis $0 0 0
Unknown $0 - -
Income Disregard Infant $0 - -
133% Poverty $0 - -
Grand Total $77 1,063 1,183
Return to Aid Code Groups

Page 19
Appendix 9 – 2014 Total Reimbursement by Aid Code Group (Child)
Dental Plan Model: DMC (Child) Dental Plan Model: FFS (Child)
Aid Code Group Reimbursement Aid Code Group Reimbursement
Med Needy Families $4,046,021 Med Needy Families $248,099,055
Pub Assist Families $2,899,134 Pub Assist Families $164,946,917
HFP Transition $2,392,285 HFP Transition $94,451,425
LIHP $1,096,063 LIHP $76,921,728
133% Poverty $446,221 100% Poverty $25,531,794
100% Poverty $403,247 133% Poverty $20,722,435
Pub Assist Blind/Disabled $323,554 Pub Assist Blind/Disabled $19,954,590
Med Indigent Children $98,365 Med Indigent Children $13,657,960
Med Needy Blind/Disabled $25,200 CHDP $5,066,708
Income Disregard Infant $6,751 Med Needy Blind/Disabled $771,524
Refugee/Entrant $502 Income Disregard Infant $748,226
IRCA/OBRA Aliens $25 Refugee/Entrant $30,014
CHDP $9 IRCA/OBRA Aliens $14,829
Grand Total $11,737,377 Income Disregard Preg Woman $11,040
Medical Inmate/Parolee $152
Presumptive Eligible $141
CHIP $118
Grand Total $670,928,656 Return to Aid Code Groups

Page 20
Appendix 10 – 2014 Total Count of Service Units by Aid Code Group (Child)
Dental Plan Model: DMC (Child)
Dental Plan Model: FFS (Child)
Aid Code Group Count of Service Units Aid Code Group Count of Service Units
Med Needy Families 1,062,233 Med Needy Families 10,497,065
HFP Transition 749,680 Pub Assist Families 7,218,058
Pub Assist Families 695,854 HFP Transition 4,018,471
LIHP 230,722 LIHP 2,992,104
100% Poverty 130,390 100% Poverty 1,106,393
133% Poverty 70,995 Pub Assist Blind/Disabled 846,695
Pub Assist Blind/Disabled 68,437 133% Poverty 760,170
Med Indigent Children 28,127 Med Indigent Children 598,549
Med Needy Blind/Disabled 2,253 CHDP 143,166
Income Disregard Infant 2,011 Med Needy Blind/Disabled 35,564
Refugee/Entrant 52 Income Disregard Infant 13,464
CHDP 1 Refugee/Entrant 729
IRCA/OBRA Aliens 1 IRCA/OBRA Aliens 336
Grand Total 3,040,756 Income Disregard Preg Woman 178
Medical Inmate/Parolee 13
CHIP 10
Presumptive Eligible 1
Grand Total 28,230,966 Return to Aid Code Groups

Page 21
Appendix 11 – 2014 Total Count of Claims by Aid Code Group (Child)
Dental Plan Model: DMC (Child)
Dental Plan Model: FFS (Child)
Aid Code Group Count of Claims Units Med Needy Families 10,963,319
Med Needy Families 531,953 Pub Assist Families 7,496,287
HFP Transition 393,610 HFP Transition 4,299,604
Pub Assist Families 361,597 LIHP 3,274,479
LIHP 131,565 100% Poverty 1,158,076
100% Poverty 66,272 Pub Assist Blind/Disabled 883,175
133% Poverty 37,173 133% Poverty 811,076
Pub Assist Blind/Disabled 35,744 Med Indigent Children 642,286
Med Indigent Children 14,245 CHDP 152,590
Med Needy Blind/Disabled 1,565 Med Needy Blind/Disabled 39,103
Income Disregard Infant 879 Income Disregard Infant 14,970
Refugee/Entrant 48 Refugee/Entrant 823
CHDP 1 IRCA/OBRA Aliens 338
IRCA/OBRA Aliens 1 Income Disregard Preg Woman 258
Grand Total 1,574,653 Medical Inmate/Parolee 30
CHIP 10
Presumptive Eligible 1
Grand Total 29,736,425 Return to Aid Code Groups

Page 22
Appendix 12 – 2014 Total Reimbursement by Aid Code Group (Adult)
Dental Plan Model: DMC (Adult)
Dental Plan Model: FFS (Adult)
Aid Code Group Total Reimbursement Aid Code Group Total Reimbursement
LIHP $1,051,695 LIHP $141,156,082
Pub Assist Blind/Disabled $503,288 Pub Assist Blind/Disabled $91,186,414
Med Needy Families $490,586 Med Needy Families $66,822,879
Pub Assist Families $259,226 Med Needy Aged $34,758,989
Med Needy Aged $77,550 Pub Assist Aged $32,431,018
Med Needy Blind/Disabled $68,844 Pub Assist Families $25,898,047
Pub Assist Aged $57,425 Med Needy Blind/Disabled $21,934,181
Med Indigent Children $22,764 Med Indigent Children $1,277,410
Refugee/Entrant $3,054 BCCTP $707,592
BCCTP $1,279 Income Disregard Preg Woman $249,549
Med Indigent Adults $536 Refugee/Entrant $210,127
Income Disregard Preg Woman $220 Med Indigent Adults $49,625
Grand Total $2,536,466 HFP Transition $14,148
IRCA/OBRA Aliens $4,999
CHDP $3,433
Special Treatment Program $901
Presumptive Eligible $782
100% Poverty $733
Tuberculosis $211
Medical Inmate/Parolee $135
Grand Total $416,707,255
LIHP $141,156,082 Return to Aid Code Groups

Page 23
Appendix 13 – Total Count of Service Units by Aid Code Group (Adult)
Dental Plan Model: DMC (Adult)
Dental Plan Model: FFS (Adult)
Aid Code Group Total Reimbursement Aid Code Group Total Reimbursement
LIHP $286,306 LIHP $2,983,333
Med Needy Families $157,472 Pub Assist Blind/Disabled $1,826,049
Pub Assist Blind/Disabled $110,067 Med Needy Families $1,640,836
Pub Assist Families $77,421 Med Needy Aged $782,059
Med Needy Aged $21,302 Pub Assist Aged $719,013
Med Needy Blind/Disabled $16,790 Pub Assist Families $659,154
Pub Assist Aged $14,075 Med Needy Blind/Disabled $434,331
Med Indigent Children $2,218 Med Indigent Children $34,129
Refugee/Entrant $1,012 BCCTP $12,749
BCCTP $ 484 Refugee/Entrant $6,224
Med Indigent Adults $45 Income Disregard Preg Woman $2,481
Income Disregard Preg Woman $1 Med Indigent Adults $1,096
Grand Total $687,193 HFP Transition $699
CHDP $166
IRCA/OBRA Aliens $58
100% Poverty $28
Presumptive Eligible $26
Tuberculosis $4
Special Treatment Program $3
Medical Inmate/Parolee $3
Grand Total $9,102,441 Return to Aid Code Groups

Page 24
Appendix 14 – 2014 Total Count of Claim by Aid Code Group (Adult)
Dental Plan Model: DMC (Adult)
Dental Plan Model: FFS (Adult)
Aid Code Group Total Reimbursement Aid Code Group Total Reimbursement
LIHP $184,067 LIHP $3,858,691
Med Needy Families $96,554 Pub Assist Blind/Disabled $1,931,433
Pub Assist Blind/Disabled $73,350 Med Needy Families $1,774,895
Pub Assist Families $47,742 Med Needy Aged $781,975
Med Needy Aged $13,951 Pub Assist Aged $739,670
Med Needy Blind/Disabled $11,146 Pub Assist Families $716,219
Pub Assist Aged $9,612 Med Needy Blind/Disabled $445,714
Med Indigent Children $1,449 Med Indigent Children $36,340
Refugee/Entrant $778 BCCTP $13,595
BCCTP $288 Refugee/Entrant $6,706
Med Indigent Adults $45 Income Disregard Preg Woman $2,901
Income Disregard Preg Woman $1 Med Indigent Adults $1,227
Grand Total $438,983 HFP Transition $752
CHDP $242
IRCA/OBRA Aliens $58
Presumptive Eligible $39
100% Poverty $28
Tuberculosis $6
Special Treatment Program $3
Medical Inmate/Parolee $3
Grand Total $10,310,497 Return to Aid Code Groups

Page 25
Appendix 15 – California Geographic Rating Areas Return to FFS Medi-Cal Beneficiary Population Characteristics
Alameda Region: Alameda Central Coast Region: Monterey, San Benito, Santa Cruz Central Valley Region: Mariposa, Merced, San Joaquin, Stanislaus, Tulare Contra Costa Region: Contra Costa Greater Fresno Region: Fresno, Kings, Madera Greater Sacramento Region: El Dorado, Placer, Sacramento, Yolo Inland Desert Region: Imperial, Inyo, Mono Inland Empire Region: Riverside, San Bernardino Kern Region: Kern Los Angeles Region: Los Angeles North Bay Region: Marin, Napa, Solano, Sonoma Northern Region: Alpine, Amador, Butte, Calaveras, Colusa, Del Norte, Glenn, Humboldt, Lake, Lassen, Mendocino, Modoc, Nevada, Plumas, Shasta, Sierra, Siskiyou, Sutter, Tehama, Trinity, Tuolumne, Yuba Orange Region: Orange San Diego Region: San Diego San Francisco Region: San Francisco San Mateo Region: San Mateo Santa Clara Region: Santa Clara South Coast Region: San Luis Obispo, Santa Barbara, Ventura

Page 26
Appendix 16 – Total Children’s Enrollment in the Medi-Cal Program
Return to FFS Medi-Cal Beneficiary Population Characteristics
Page 27
Appendix 17 – Total Adult Enrollment in the Medi-Cal Program
Return to FFS Medi-Cal Beneficiary Population Characteristics
Page 28
Appendix 18 – Dental Provider Enrollment & Referral List Numbers
Return to Provider Network