Embed Size (px)
Citation preview

ColoradoMarijuanaEnforcementDivision:2017AnnualUpdate
1 | P a g e
MED2017AnnualUpdateMikeHartman
StateLicensingAuthorityExecutiveDirector,ColoradoDepartmentofRevenueHeidiHumphreys
DeputyExecutiveDirector,ColoradoDepartmentofRevenue
JimBurack
Director,MarijuanaEnforcementDivision
KyleLambert
DeputyDirector,Analysis&PlanningSectionMarijuanaEnforcementDivision
May 17, 2018

ColoradoMarijuanaEnforcementDivision:2017AnnualUpdate
2 | P a g e
2017 New Business Licenses Issued (Table 1)
*The Division has adopted the term “Adult Use” in place of using “Retail” to describe the over 21 year old commercial marijuana market authorized by the voters
approved Amendment 64 initiative in 2012.
Licensing DataNew Business Licensing
•Adult Use* licenses accounted for 77% of thenew business licenses issued in 2017. Adult UseCultivations alone accounted for 38% of the newbusiness licenses issued in 2017.
Occupational Licenses• An average of 1,440 new occupational licenses were issued per month. In 2017, the number of active occupational licenses increased by 20%. On average only 32% of occupational licenses are renewed.
Table 1: New Business Licenses Issued in 2017
Medical Center 15
Medical Cultivation 38
Medical Infused‐Product Manufacturer (MIPs) 30
Medical Testing Facility 1
Medical Transporter 4
Total Medical 88 Adult Use Store 72
Adult Use Cultivation 144
Adult Use Infused‐Product Manufacturer (MIPs) 66
Adult Use Testing Facility 1
Adult Use Transporter 5
Total Adult Use 288 Total All 376
0
20
40
60
80
100
120
140
Medical
Adult Use

ColoradoMarijuanaEnforcementDivision:2017AnnualUpdate
3 | P a g e
2017 Local Jurisdictions Reporting Marijuana Licensing Status as of December 31, 2017
Medical and Adult Use Adult Use Only
Medical Only Banned
Hayden
Dinosaur
Palisade
De Beque
Mancos
Cortez
Log Lane Village
Sedgwick
Rocky Ford
Trinidad

ColoradoMarijuanaEnforcementDivision:2017AnnualUpdate
4 | P a g e
Table 2: Month‐End Business and Establishment License Totals by Type Jan Feb Mar Apr May Jun Jul Aug Sep Oct Nov Dec
Medical Marijuana Businesses Centers 524 523 519 518 513 509 507 508 509 507 507 506 Cultivation Operations 782 781 775 772 770 765 759 759 763 759 759 759 Infused Product 249 249 250 249 251 256 255 255 255 253 251 254 Testing Facilities 14 14 14 14 15 14 14 13 13 12 12 12 Total Medical Licenses 1,569 1,567 1,558 1,553 1,549 1,544 1,535 1,535 1,540 1,531 1,529 1,531
Adult Use Marijuana Establishments Stores 463 473 480 478 491 492 498 501 501 504 506 509 Cultivation Facilities 631 641 659 665 684 692 701 700 700 703 707 720 Product Manufacturing 246 247 254 257 263 271 273 274 271 270 276 279 Testing Facilities 13 13 13 13 14 13 13 13 13 13 12 12 Total Adult Use Licenses 1,353 1,374 1,406 1,413 1,452 1,468 1,485 1,488 1,485 1,490 1,501 1,520
Total Medical and Adult Use 2,922 2,941 2,964 2,966 3,001 3,012 3,020 3,023 3,025 3,021 3,030 3,051
2017 Monthly Medical Business & Adult Use Establishment License Totals (Table 2)
0
200
400
600
800
1,000
1,200
1,400
1,600
1,800
Jan Feb Mar Apr May Jun Jul Aug Sep Oct Nov Dec
Medical
Adult Use

ColoradoMarijuanaEnforcementDivision:2017AnnualUpdate
5 | P a g e
Table 3: Month‐End Occupational License Totals *All Occupational Licenses are issued and renewed for a two year period.
Jan Feb Mar Apr May Jun Jul Aug Sep Oct Nov Dec Total Key Licenses Issued 355 305 401 439 422 316 326 333 337 447 347 338 4,366 Support Licenses Issued 870 1,030 1,139 1,173 1,195 1,142 1,047 1,127 1,066 1,114 1,057 963 12,923 Total New Occupational Licenses Issued 1,225 1,335 1,540 1,612 1,617 1,458 1,373 1,460 1,403 1,561 1,404 1,301 17,289
Key Licenses Renewed 124 133 168 118 146 167 185 156 174 202 192 213 1,978 Support Licenses Renewed 193 136 205 167 167 190 177 158 173 184 155 170 2,075 Total Occupational Licenses Renewed 317 269 373 285 313 357 362 314 347 386 347 383 4,053
Key Licenses Expired 125 112 163 141 135 142 137 195 139 168 179 213 1,849 Support Licenses Expired 548 438 573 539 536 528 538 801 553 658 472 686 6,870 Total Occupational Licenses Expired 673 550 736 680 671 670 675 996 692 826 651 899 8,719
Percentage of Occupational Licenses Renewed
32.02% 32.84% 33.63% 29.53% 31.81% 34.76% 34.91% 23.97% 33.40% 31.85% 34.77% 29.88% 31.73%
Total Active Occupational Licenses (On the last day)
31,256 31,856 32,417 33,121 33,664 34,459 34,963 35,427 35,940 36,463 37,758 37,580
2017 Monthly Totals For Occupational Licenses Issued, Renewed, and Expired (Table 3)
0
200
400
600
800
1,000
1,200
1,400
1,600
1,800
Jan Feb Mar Apr May Jun Jul Aug Sep Oct Nov Dec
Issued
Renewed
Expired

ColoradoMarijuanaEnforcementDivision:2017AnnualUpdate
6 | P a g e
AverageLifeCycleofaMarijuanaPlantHarvestedin2017was132Days
Table 4: Monthly Average of Marijuana Plants Cultivated Jan Feb Mar Apr May Jun Jul Aug Sep Oct Nov Dec Average Medical Cultivated Plants
328,711 317,237 310,306 299,324 299,250 301,787 305,930 308,368 311,011 306,748 305,713 305,063
Average Adult Use Cultivated Plants
519,589 545,033 566,958 585,927 617,215 667,296 705,867 725,945 732,202 696,170 670,058 669,044
Combined Average Cultivated Plants
848,300 862,270 877,264 885,251 916,465 969,083 1,011,797 1,034,313 1,043,213 1,002,918 975,771 974,107
Cultivated Plants2016 vs 2017 Monthly Average
•On average, there were an additional 121,197 plants cultivated per month in 2017 compared to 2016. This calculates to a 14.6% annual growth rate in the number of plants being cultivated.
Plants by County•Denver County's share of the total plants in the state has fallen from 62% in January, 2017 to 57% in December, 2017.
• Pueblo County; known to have many outdoor cultivations, saw a 154% increase in cultivated plants from January, 2017 to August, 2017.
Immature
24 Days
Vegetative
55 Days
Flowering
53 Days

ColoradoMarijuanaEnforcementDivision:2017AnnualUpdate
7 | P a g e
Table5:Month‐EndTotalPlantCountbyCounty(orGroupofCounties) Jan Feb Mar Apr May Jun Jul Aug Sep Oct Nov Dec A Denver 532,696 532,184 527,656 531,491 536,438 541,551 543,098 542,360 552,897 552,645 547,704 555,465
B Pueblo 61,788 64,735 72,153 82,314 115,046 140,031 152,387 156,763 152,178 101,776 92,678 93,403
C El Paso 66,446 67,820 67,625 66,559 68,613 70,158 71,997 73,790 75,529 76,693 77,247 77,667
D Boulder 65,513 66,080 67,766 68,336 66,660 66,595 67,621 69,395 70,707 70,312 68,205 67,085
E
Conejos, Costilla, Crowley, Huerfano, Las Animas, Saguache
13,697 15,678 17,357 17,505 25,892 31,565 33,460 36,914 36,595 24,971 27,934 28,525
FGarfield, Mesa, Routt
26,311 27,604 28,890 31,564 30,425 30,375 32,082 32,216 33,419 35,608 35,230 36,327
GEagle, Grand, Pitkin, Summit
12,906 12,910 13,189 13,817 13,182 22,414 22,035 22,931 21,842 17,238 17,806 17,919
HChaffee, Fremont, Lake
15,603 16,533 14,745 15,705 18,565 22,344 23,879 24,994 24,067 20,984 21,994 21,222
I Adams, Arapahoe 15,627 17,198 20,059 19,016 19,174 18,711 21,822 20,516 21,391 20,561 21,695 21,952
J Larimer 13,119 13,470 13,667 13,843 13,654 14,382 13,878 13,855 13,176 12,928 12,730 12,387
KClear Creek, Gilpin, Jefferson
10,579 10,062 9,847 9,825 9,949 9,549 9,658 9,749 7,563 8,426 8,085 8,491
L
Archuleta, La Plata, Montezuma, San Juan
10,026 9,466 8,778 8,292 9,135 8,332 9,251 10,550 11,450 13,359 13,071 11,804
MMorgan, Sedgwick, Weld
8,304 8,493 8,447 7,667 8,286 7,803 9,231 9,222 8,565 8,445 9,386 11,025
NGunnison, Montrose, Ouray, San Miguel
4,919 4,847 5,668 6,411 6,899 6,770 6,215 6,328 5,517 4,193 4,957 5,549
O Park, Teller 4,887 5,105 4,700 4,440 4,024 4,876 4,896 6,541 6,519 5,200 5,228 5,217
Total Plants 862,421 872,185 880,547 896,785 945,942 995,456 1,021,510 1,036,124 1,041,415 973,339 963,950 974,038
% Change in Total Plants Per Month
N/A 1.13% 0.96% 1.84% 5.48% 5.23% 2.62% 1.43% 0.51% (6.54%) (0.96%) 1.05%

ColoradoMarijuanaEnforcementDivision:2017AnnualUpdate
8 | P a g e
2017 Month‐End Total Plant Count by County (or Group of Counties) (Table 5)
0
200,000
400,000
600,000
800,000
1,000,000
1,200,000
Jan Feb Mar Apr May Jun Jul Aug Sep Oct Nov Dec
O
N
M
L
K
J
I
H
G
F
E
D
C
B
A
ColoradoMarijuanaEnforcementDivision:2017AnnualUpdate
9 | P a g e
Table6:PoundsofUsableMarijuanabyCategoryin2017Category Adult Use (lbs.) Medical (lbs.) Total (lbs.)
Bud / Flower 329,870 226,138 556,008 Shake / Trim 208,070 113,912 321,982
Wet Whole Plant 74,393 46,639 121,031 Total 612,333 386,689 999,022
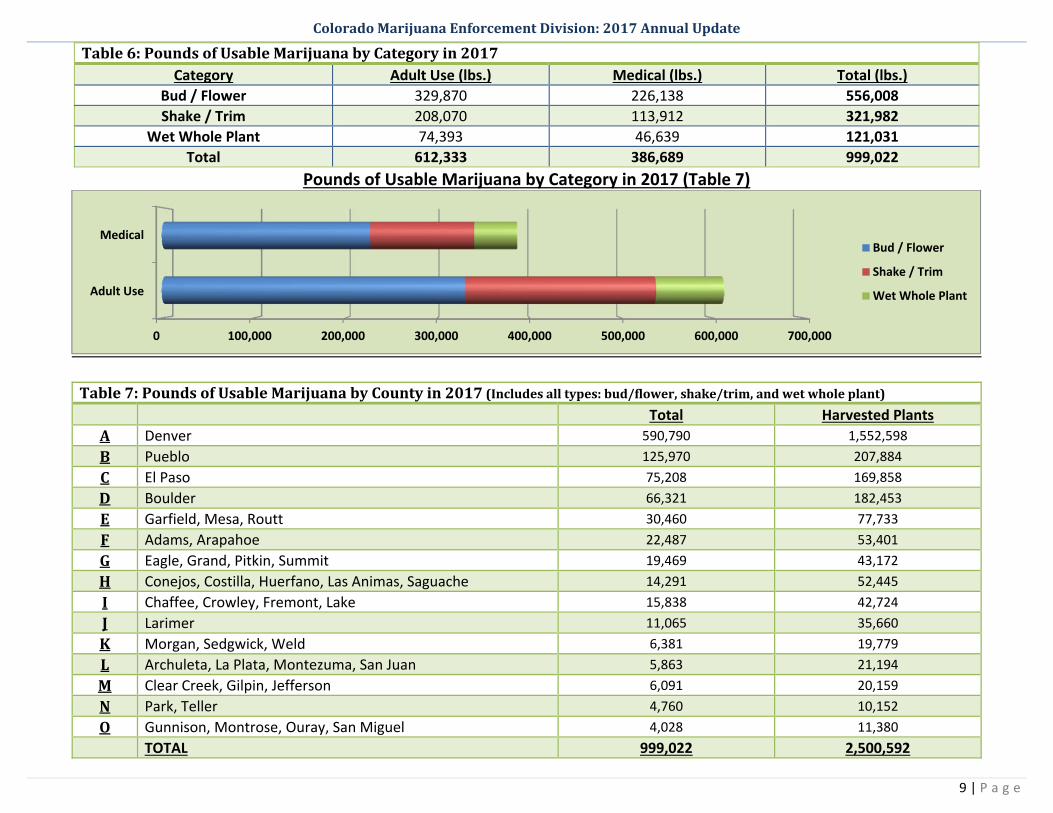
Pounds of Usable Marijuana by Category in 2017 (Table 7)
Table7:PoundsofUsableMarijuanabyCountyin2017(Includesalltypes:bud/flower,shake/trim,andwetwholeplant) Total Harvested Plants A Denver 590,790 1,552,598
B Pueblo 125,970 207,884
C El Paso 75,208 169,858
D Boulder 66,321 182,453
E Garfield, Mesa, Routt 30,460 77,733
F Adams, Arapahoe 22,487 53,401
G Eagle, Grand, Pitkin, Summit 19,469 43,172
H Conejos, Costilla, Huerfano, Las Animas, Saguache 14,291 52,445
I Chaffee, Crowley, Fremont, Lake 15,838 42,724
J Larimer 11,065 35,660
K Morgan, Sedgwick, Weld 6,381 19,779
L Archuleta, La Plata, Montezuma, San Juan 5,863 21,194
M Clear Creek, Gilpin, Jefferson 6,091 20,159
N Park, Teller 4,760 10,152
O Gunnison, Montrose, Ouray, San Miguel 4,028 11,380
TOTAL 999,022 2,500,592
0 100,000 200,000 300,000 400,000 500,000 600,000 700,000
Adult Use
MedicalBud / Flower
Shake / Trim
Wet Whole Plant

ColoradoMarijuanaEnforcementDivision:2017AnnualUpdate
10 | P a g e
Table 8: Pounds of Flower/Bud Sold Monthly in 2017
Jan Feb Mar Apr May Jun Jul Aug Sep Oct Nov Dec Total
Medical 12,628 12,356 15,837 16,994 15,229 14,843 16,224 15,672 15,169 13,701 12,293 12,048 172,994
Adult Use 16,611 16,648 19,890 19,475 19,089 19,725 20,998 21,509 21,847 20,780 20,015 21,562 238,149
Total 29,239 29,004 35,727 36,469 34,318 34,568 37,222 37,181 37,016 34,481 32,308 33,610 411,143
2017 Monthly Totals for Pounds of Flower/Bud Sold to Consumers (Table 8)
Volume Sold to ConsumersFlower Sales
•The margin between Adult Use flower sales and Medical flower sales increased from 24% in January, 2017 to 44% in December, 2017.
Edible and Concentrates• Units sold of Medical edibles dropped 14%, while units sold of Adult Use edibles increased 29% from 2016 to 2017.
• 477% more concentrate units were sold in the Adult Use market compared to Medical in 2017.
0
5,000
10,000
15,000
20,000
25,000
Jan Feb Mar Apr May Jun Jul Aug Sep Oct Nov Dec
Medical
Adult Use

ColoradoMarijuanaEnforcementDivision:2017AnnualUpdate
11 | P a g e
Table 9: Units of Edibles Sold Monthly in 2017 Jan Feb Mar Apr May Jun Jul Aug Sep Oct Nov Dec Total Medical 134,660 134,892 164,571 168,169 160,252 154,130 156,275 149,656 146,528 155,772 155,045 171,148 1,851,098
Adult Use 632,212 635,771 814,593 716,336 724,069 806,701 918,464 882,136 834,703 766,020 707,064 857,260 9,295,329
Total 766,872 770,663 979,164 884,505 884,321 960,831 1,074,739 1,031,792 981,231 921,792 862,109 1,028,408 11,146,427
2017 Monthly Total Units of Edibles Sold to Consumers (Table 9)
Table 10: Units of Non‐Edible Infused Products Sold Monthly in 2017
Jan Feb Mar Apr May Jun Jul Aug Sep Oct Nov Dec Total Medical 16,488 17,583 19,122 25,645 16,961 15,842 16,755 16,988 16,583 16,263 15,639 16,954 210,823 Adult Use 53,606 54,075 68,499 60,703 64,714 72,648 83,123 83,098 80,598 73,894 69,024 79,664 843,646 Total 70,094 71,658 87,621 86,348 81,675 88,490 99,878 100,086 97,181 90,157 84,663 96,618 1,054,469
2017 Monthly Total Units of Non‐Edibles Sold to Consumers (Table 10)
0
200,000
400,000
600,000
800,000
1,000,000
Jan Feb Mar Apr May Jun Jul Aug Sep Oct Nov Dec
Medical
Adult Use
0
20,000
40,000
60,000
80,000
100,000
Jan Feb Mar Apr May Jun Jul Aug Sep Oct Nov Dec
Medical
Adult Use

ColoradoMarijuanaEnforcementDivision:2017AnnualUpdate
12 | P a g e
Table 11: Pounds of Concentrate Sold Monthly in 2017
Jan Feb Mar Apr May Jun Jul Aug Sep Oct Nov Dec Total Medical 966 1,024 1,155 1,151 1,200 1,073 1,259 1,249 1,266 1,309 1,206 1,234 14,092
Adult Use 851 880 1,069 1,083 1,058 1,090 1,223 1,267 1,289 1,297 1,293 1,398 13,798
Total 1,817 1,904 2,224 2,234 2,258 2,163 2,482 2,516 2,555 2,606 2,499 2,632 27,890
2017 Monthly Total Pounds of Concentrate Sold to Consumers (Table 11)
Table 12: Units of Concentrates Sold Monthly in 2017
Jan Feb Mar Apr May Jun Jul Aug Sep Oct Nov Dec Total Medical 43,175 42,804 56,616 59,199 61,307 61,810 71,474 73,265 74,770 77,950 82,145 81,935 786,450
Adult Use 192,984 201,952 256,870 247,581 261,476 300,363 379,087 386,669 422,580 357,510 355,002 411,073 3,773,147
Total 236,159 244,756 313,486 306,780 322,783 362,173 450,561 459,934 497,350 435,460 437,147 493,008 4,559,597
2017 Monthly Units of Concentrate Sold to Consumers (Table 12)
0200400600800
1,0001,2001,400
Jan Feb Mar Apr May Jun Jul Aug Sep Oct Nov Dec
Medical
Adult Use
0
100,000
200,000
300,000
400,000
500,000
Jan Feb Mar Apr May Jun Jul Aug Sep Oct Nov Dec
Medical
Adult Use

ColoradoMarijuanaEnforcementDivision:2017AnnualUpdate
13 | P a g e
Table 13: Retail Marijuana Potency and Homogeneity Testing in 2017 (The term “package” refers to a single test batch submitted to a Testing Facility) Jan Feb Mar Apr May Jun Jul Aug Sep Oct Nov Dec Total
Flower and Shake/Trim Packages Tested (Potency)
3,825 3,495 4,564 3,928 4,571 4,277 3,745 4,500 3,979 4,886 4,293 4,333 50,396
Infused Edible Packages Tested (Potency)
590 531 559 520 599 784 574 760 768 892 541 626 7,744
Infused Edible Packages Tested (Homogeneity)
317 350 327 269 375 534 434 488 465 522 312 387 4,780
Infused Non‐edible Packages Tested (Potency)
173 179 206 189 162 198 203 235 230 227 214 186 2,402
Concentrate Packages Tested (Potency)
4,593 4,463 5,517 5,105 5,020 5,316 4,902 5,739 5,183 5,781 5,739 5,361 62,719
Table 14: Retail Marijuana Contaminant Testing in 2017 (The term “package” refers to a single test batch submitted to a Testing Facility) Jan Feb Mar Apr May Jun Jul Aug Sep Oct Nov Dec Total Flower and Shake/Trim Packages Tested (Microbial Contaminants)
3,236 3,193 3,854 3,336 3,746 3,483 3,470 3,440 3,526 3,915 3,488 3,453 42,140
Infused Edible Packages Tested (Microbial Contaminants)
408 331 374 333 380 419 398 431 418 518 307 334 4,651
Infused Non‐edible Packages Tested (Microbial Contaminants)
73 89 61 62 67 77 82 78 78 102 72 54 895
Concentrate Packages Tested (Microbial Contaminants)
253 363 417 417 440 422 319 329 417 477 409 312 4,575
Concentrate Packages Tested (Residual Solvent Contaminants)
1,818 1,365 1,743 1,188 1,352 1,517 1,171 1,328 1,302 1,534 1,519 1,276 17,113
Testing DataFlower and Trim Microbial Contaminant Testing
•42,140 individual packages of retail marijuana flower/trim were submitted for microbial contaminant testing.
All Other Tests•Total number of individual packages submitted for all other mandatory retail tests were 104,879 packages.

ColoradoMarijuanaEnforcementDivision:2017AnnualUpdate
14 | P a g e
Table 15: Retail Marijuana Testing Results in 2017 (Percentage of Packages That Passed Testing)
Jan Feb Mar Apr May Jun Jul Aug Sep Oct Nov Dec Total Infused Edible Potency Results
88.3% 88.5% 90.9% 91.5% 90.7% 87.0% 91.6% 90.8% 87.0% 86.7% 90.9% 88.7% 89.4%
Infused Edible Homogeneity Results
100% 99.1% 98.8% 99.4% 99.7% 97.9% 99.8% 98.8% 95.9% 98.3% 99.0% 98.4% 98.8%
Flower and Shake/Trim Microbial Contaminant Results
92.1% 92.5% 94.0% 90.8% 91.2% 92.5% 92.0% 89.3% 88.5% 84.5% 85.1% 84.4% 89.7%
Infused Edible Microbial Contaminant Results
99.5% 99.7% 99.7% 99.7% 100% 100% 100% 100% 99.8% 100% 100% 100% 99.9%
Infused Non‐edible Microbial Contaminant Results
100% 100% 100% 100% 100% 100% 100% 100% 100% 100% 100% 100% 100%
Concentrate Microbial Contaminant Results
98.5% 97.8% 98.3% 98.1% 99.5% 99.1% 98.7% 99.4% 98.8% 97.9% 98.0% 98.4% 98.5%
Concentrate Residual Solvent Contaminant Results
100% 99.8% 99.5% 99.4% 99.7% 99.3% 98.9% 98.3% 99.2% 99.2% 99.0% 99.8% 99.3%
2017 Total Testing Results by Test Type (Tables 13‐15)
0
5,000
10,000
15,000
20,000
25,000
30,000
35,000
40,000
45,000
Potency: Edible Homogeneity:Edible
Residual Solvent:Concentrate
Microbial: Flower Microbial: Edible
Total Failed Samples
Total Passed Samples

ColoradoMarijuanaEnforcementDivision:2017AnnualUpdate
15 | P a g e
Table16:InvestigationsConductedbyMEDin2017
InvestigationType Total Number of Investigations
BusinessBackgroundInvestigation 463
IndividualBackgroundInvestigation 606
RenewalInvestigation 3,960
ChangeofOwnershipInvestigation 575
ChangeofLocationInvestigation 69
ModificationofPremisesInvestigation 516
ChangeofTradeNameInvestigation 110
Non‐QualifiedSalesCheckInvestigation(%ofChecksPassed) 264 (95.1%)
TargetedComplianceInspections 672
RegulatoryandCriminalInvestigation 1,148
Investigation InformationNon‐Qualified Sales Checks
•The percentage of Non‐Qualified Sales Checks (underage purchases) passed by licensees has risen to 95.1% in 2017 from 94% in 2016.
Administrative Actions•Of the 210 Administrative Actions issued against business licenses, 89 were for Adult Use licenses and 121 were for Medical licenses.

ColoradoMarijuanaEnforcementDivision:2017AnnualUpdate
16 | P a g e
Table 17: Administrative Actions Issued by the State Licensing Authority in 2017
Medical Centers
Medical Cultivations
Medical MIPs
Adult Use
Stores Adult Use Cultivations
Adult Use Product
Manufacturers
Adult Use Testing Facilities
Owners or Occupational Badge Holder
Total Licenses Affected
Assurance of Voluntary Compliance 3 4 1 0 0 1 0 11 20 Denial 2 4 2 2 2 2 0 79 93 Summary Suspension 2 17 5 2 12 4 0 33 75 Order to Show Cause 1 3 0 6 2 0 0 21 33 Stipulation, Agreement, and Order 28 44 5 28 23 3 2 103 236 Totals 36 72 13 38 39 10 2 247 457
2017 Administrative Actions Issued (Table 18)
2093
75
33
236Assurance of Voluntary Compliance
Denial
Summary Suspension
Order to Show Cause
Stipulation, Ageement and Order