Embed Size (px)
Citation preview
HAL Id: hal-02433846https://hal.archives-ouvertes.fr/hal-02433846
Submitted on 28 Oct 2020
HAL is a multi-disciplinary open accessarchive for the deposit and dissemination of sci-entific research documents, whether they are pub-lished or not. The documents may come fromteaching and research institutions in France orabroad, or from public or private research centers.
L’archive ouverte pluridisciplinaire HAL, estdestinée au dépôt et à la diffusion de documentsscientifiques de niveau recherche, publiés ou non,émanant des établissements d’enseignement et derecherche français ou étrangers, des laboratoirespublics ou privés.
Distributed under a Creative Commons Attribution - NonCommercial - NoDerivatives| 4.0International License
Mechanistic modeling of the thermal-hydraulics inpolydispersed flow film boiling in LOCA conditions
A.V.S. Oliveira, J.D. Peña Carrillo, Alexandre Labergue, T. Glantz, MichelGradeck
To cite this version:A.V.S. Oliveira, J.D. Peña Carrillo, Alexandre Labergue, T. Glantz, Michel Gradeck. Mechanisticmodeling of the thermal-hydraulics in polydispersed flow film boiling in LOCA conditions. NuclearEngineering and Design, Elsevier, 2020, 357, pp.110388. �10.1016/j.nucengdes.2019.110388�. �hal-02433846�
Mechanistic modeling of the thermal-hydraulics in polydispersed flow film boilingin LOCA conditions
A.V.S. Oliveiraa’b’*, J.D. Pena Carrilloa,b, A. Laberguea, T. Glantzb, M. Gradecka
aLEMTA, UMR CNRS 7563, Université de Lorraine, Vandoeuvre-Lès-Nancy 54505, France bIRSN, PSN/SEMIA/LIMAR, B.P. 3, 13115 Saint Paul-Lez-Durance, France
Abstract
Much effort has been devoted by the nuclear community to develop mechanistic models to predict the heat dissipation
of fuel rods during a loss of coolant accident (LOCA). However, there is still the challenge to find correlations that
accurately predict the rates of heat transfer corresponding to each involved phenomena and gather them all in a single
physical model. Looking for improving thermal-hydraulics calculations in LOCA conditions, this work introduces a
novel mechanistic model implemented in a new code named NECTAR to calculate heat and mass transfer phenomena
and droplets dynamics in a polydispersed flow film boiling. The simulation results are compared with experimental
measurements using three different geometries that represent the cladding ballooning at sub-channel scale. NECTAR
can predict with great accuracy the heat dissipation by the internal steam-droplets flow with less than 8% mean
deviation for all the test cases. The droplets characteristics downstream of the heated tube are also well predicted
by NECTAR. In a detailed analysis of each heat transfer process, we found that wall-to-steam convection plays the
major role in the internal heat dissipation, followed by the heat removed by the droplets impact onto the wall in spite
of the very low volume fraction of droplets. Moreover, droplets impact and steam-to-droplets convection are also the
main responsible for the droplets evaporation. Finally, considering the droplets diameter polydispersed distribution
into thermal-hydraulics calculations (instead of a single mean diameter) has an effect only for higher volume fractions
of droplets.
Keywords:
NECTAR, LOCA, Thermal-hydraulics, Mechanistic model, Polydispersed distribution
Nomenclature
Greek letters w
a volume fraction $
e emissivity p
n order of the moment a
Y surface tension aSB
p log-normal mean Tb
* Corresponding authorEmail address: [email protected] (A.V.S. Oliveira)
coalescence and breakup term
rate of heat flow
density
log-normal standard deviation
Stephan-Boltzmann constant
blockage ratio
A heat flux Re Reynolds number
■& drag coefficient correction S moment
Roman letters T temperature
m mass flow rate t time
A cross-sectional area u axial velocity
ai interfacial area concentration We Weber number
B Spalding factor z axial position
Bi Biot number Subscripts
C drag coefficient 32 Sauter mean diameter
cp specific heat b blockage
D diameter (tube) c convection
d diameter (droplets) d droplets
E energy ev evaporation
ff friction factor ext external
G change in droplets diameter imp droplets impact onto the wall
g acceleration of gravity int internal
h heat transfer coefficient j bin number
h;s heat of vaporization loss heat losses
L length low bin’s lower limit
m mass R residence period
n density of droplets r radiation
Nu Nusselt number s steam
P droplets diameter distribution t tube
Pr Prandtl number up bin’s upper limit
r radial direction w wall
1. Introduction
Detailing the heat transfer phenomena during the reflooding phase of a loss of coolant accident (LOCA) is still a
challenging task although much effort has been devoted to this subject in the last two decades [1]. Multidimensional
thermal-hydraulics and advanced mechanistic physical models are highly studied by the nuclear community to improve
5 the safety of reactor cores, in both experimental and numerical approaches [2-8]. This dedication is justified by the
complex conjugated phenomena taking place during the reflooding phase in a LOCA.
2
Figure 1 shows the different heat transfer processes and fluid dynamics characteristics depending on the position
in the fuel rods from the quenching front. Nucleate boiling is the main heat transfer path on rods immersed in water.
Meanwhile, immediately downstream of the quenching front, the fuel rods are firstly cooled down by a dispersed
10 steam-droplets two-phase flow. Early during reflood when the water level is low, there is no liquid entrainment
and the generated droplets are evaporated in the length of the fuel rods bundle [9, 10], leading to heat transfer by
convection with superheated steam. Since the two-phase flow plays an important role in the heat dissipation of the
upper part in the nuclear core, evaluating the rate of heat transfer in this region is essential. However, this is also
a difficult exercise because of the many different processes taking place. Examples are: turbulent flow; droplets
15 formation at the quenching front and their later coalescence and fragmentation in the steam flow; droplets impact
onto heated walls; radiative heat transfer; and geometrical effects due to the fuel claddings ballooning and burst.
Only a thorough mechanistic model can accurately predict the heat dissipation and the coolability of the fuel rods
and, by consequence, give confidence in nuclear safety in LOCA conditions.
Figure 1: Heat and mass transfer phenomena during LOCA.
Several authors have already proposed different mechanistic models for the post-dryout heat transfer with an
20 internal steam-droplets flow. One of the firsts was proposed by Sun et al. [11], where they considered convection
and radiation between the three participants (wall, steam and droplets) but without droplets impact onto the wall.
Guo and Mishima [12] later included more phenomena in the calculations, like droplet impact onto heated walls and
evaporation using a mean droplet diameter, and evaluated the importance of each heat transfer path in the cooling
of the heated wall. Meholic et al. [13] presented a 2-D model where, for instance, they analyzed the effect of the
25 droplet size and wall temperature on the impact of the droplet onto the wall. More recent examples are available in
the literature, including one-dimensional modeling [14] and the use of a computational fluid dynamics code [15].
However, accurate physical models are still a challenge to describe the thermal-hydraulics during the cooling phase
in LOCA conditions. Thus, the Institut de Radioprotection et de Sûrete Nucléaire (IRSN), in France, launched the
project PERFROI [16]. One objective among others is to increase the understanding of the thermal hydraulic
30 phenomena during the cooling phase to better predict the coolability of a nuclear core, especially with ballooning
3
of claddings. With this perspective, this work présents a new code called NECTAR 1 using a mechanistic model
that estimates both the heat dissipation by the internal steam-droplets flow in LOCA conditions and the droplets
characteristics (diameter and velocity) in a polydispersed distribution. We compare the results of this code with
experimental data obtained from COLIBRI 2, an experimental rig dedicated to the thorough investigation of the
35 thermal-hydraulics during the cooling of a vertical pipe with an internal mist flow. We also compare the predictive
capacity of NECTAR with IRSN’s code DRACCAR, which is a 3D multiphysics simulation tool to investigate,
among other problems, the thermal-mechanical and thermal-hydraulics of a nuclear core during LOCA transients.
Detailed information concerning the code DRACCAR is available in a two-part paper with a general description of
the modeling [2] and its simulation capability [3].
40 2. COLIBRI: experimental apparatus
As the objective of this paper is to introduce the thermal-hydraulics modeling with NECTAR, the presentation
of the experimental apparatus dedicated to its validation is herein summarized. The detailed information regarding
the test bench and measurement techniques is available in previous works [17, 18].
Figure 2 presents a schematic illustration of COLIBRI. The test section, made of Inconel-625, is divided into
45 three parts. Parts I and III are fixed tubes with an internal diameter of 11.78 mm and a thickness of 0.57 mm, which
is representative of a fluid sub-channel in a Pressurized Water Reactor (PWR). The supply systems of droplets and
steam converge at the mixer upstream of Part I to provide the dispersed two-phase flow to the test section. Part
II is heated by Joule effect with the aid of a direct-current power source and is removable to allow testing different
blockage ratios Tb by reducing the tube internal diameter Dint. The blockage ratio is calculated by:
Tb 1Di n
0.01178 y
2(1)
50 and indicates the constriction level in Part II, being 0% if the internal diameter is 11.78 mm (as in Parts I and III)
and 100% if it is zero.
Upstream and downstream of Part II, there are optical windows for measurements of the droplets axial velocity
(the z-component) and diameter using a typical phase-Doppler analyzer (PDA) and of the mean droplets temperature
using three-color laser induced fluorescence (3cLIF) thermometry. One great advantage of 3cLIF is the capability of
55 correcting the droplet size effect on the temperature measurement, as described in Labergue et al [19]. Meanwhile,
we used infrared thermometry (IRT) to measure the temperature profile of the external surface of Part II during the
cooling phase.
Table 1 shows the Part II geometries we tested to analyze the blockage ratio effect on the cooling process and to
validate the code NECTAR. We should note that the wall thickness at the constriction of the tube is different for
60 each configuration to ensure that we would have Part II with similar masses and, by consequence, similar thermal
inertia. This allows us to evaluate separately the blockage ratio effect on the thermal-hydraulics of the cooling phase,
although in a real LOCA condition the cladding becomes thinner with the ballooning, reducing its linear thermal
1New Experimental Code for Thermal-hydraulic Analysis in a Representative geometry2COoLIng of Blockage Region Inside a PWR Reactor
4
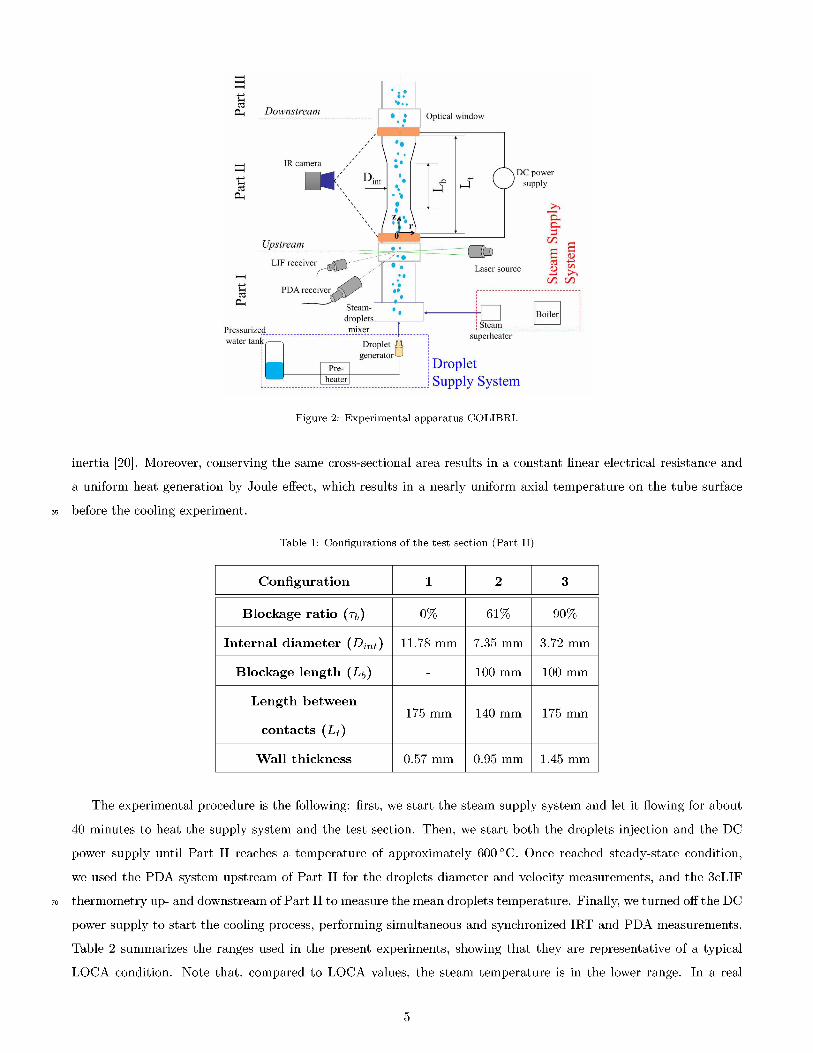
Figure 2: Experimental apparatus COLIBRI.
inertia [20]. Moreover, conserving the same cross-sectional area results in a constant linear electrical résistance and
a uniform heat generation by Joule effect, which results in a nearly uniform axial temperature on the tube surface
es before the cooling experiment.
Table 1: Configurations of the test section (Part II)
Configuration 1 2 3
Blockage ratio (t&) 0% 61% 90%
Internai diameter (Dint) 11.78 mm 7.35 mm 3.72 mm
Blockage length (Lb) - 100 mm 100 mm
Length between175 mm 140 mm 175 mm
contacts (Lt )
Wall thickness 0.57 mm 0.95 mm 1.45 mm
The experimental procedure is the following: first, we start the steam supply system and let it flowing for about
40 minutes to heat the supply system and the test section. Then, we start both the droplets injection and the DC
power supply until Part II reaches a temperature of approximately 600 0C. Once reached steady-state condition,
we used the PDA system upstream of Part II for the droplets diameter and velocity measurements, and the 3cLIF
70 thermometry up- and downstream of Part II to measure the mean droplets temperature. Finally, we turned off the DC
power supply to start the cooling process, performing simultaneous and synchronized IRT and PDA measurements.
Table 2 summarizes the ranges used in the present experiments, showing that they are representative of a typical
LOCA condition. Note that, compared to LOCA values, the steam temperature is in the lower range. In a real
5
scénario, steam températures slightly higher than saturation is représentative of the near field, the région close to
75 the quenching front [9].
Table 2: Typical values during LOCA and those obtained with COLIBRI upstream of Part II
ParameterTypical LOCA
values [6, 7, 9, 21]
COLIBRI
(upstream of Part II)
Droplets diameter (dd) 50 pm - 1000 pm 5 pm - 300 pm
Droplets axial velocity (ud) 4 m/s - 16 m/s 13 m/s - 16 m/s
Volume fraction of droplets (ad) 10-2 - 10-4 « 10-4
Steam temperature (Ts) Up to 800 ° C 160 °C - 170 °C
Wall temperature (Tw ) 300 °C - 1200 °C 300 °C - 600 °C
Using the spatial-temporal decrease of the tube temperature Tw measured with the IRT and considering azimuthal
symmetry, we can estimate the heat dissipation by the internal two-phase flow pint with the following energy balance
equation:
Pint(z7 t)AtPw cp,w\ dTW (z7 ')
nDint ) dtD ext Dint
Ploss (z7 t) (2)
where At, pw, cpw, Dint, and Dext are, respectively, the cross-sectional area, the density, the specific heat capacity,
80 the internal diameter, and the external diameter of the test section, while ploss is the sum of the heat losses to the
ambient by radiation and convection.
The experimental uncertainties either found by error propagation and repetitive measurements are:
• Wall temperature (IRT): ±5°C;
• Internal heat flux (Eq. 2): ±10%;
• Droplets velocity (PDA): ±5%;
• Droplets diameter (PDA): ±10%;
• Droplets temperature (3cLIF): ±5 °C.
3. NECTAR: code présentation
3.1. General description and hypothèses
90 Guo and Mishima [12] presented in their work a simplified mechanistic approach to estimate the heat and mass
transfer processes taking place in a dispersed flow film boiling. Following their strategy, NECTAR considers the
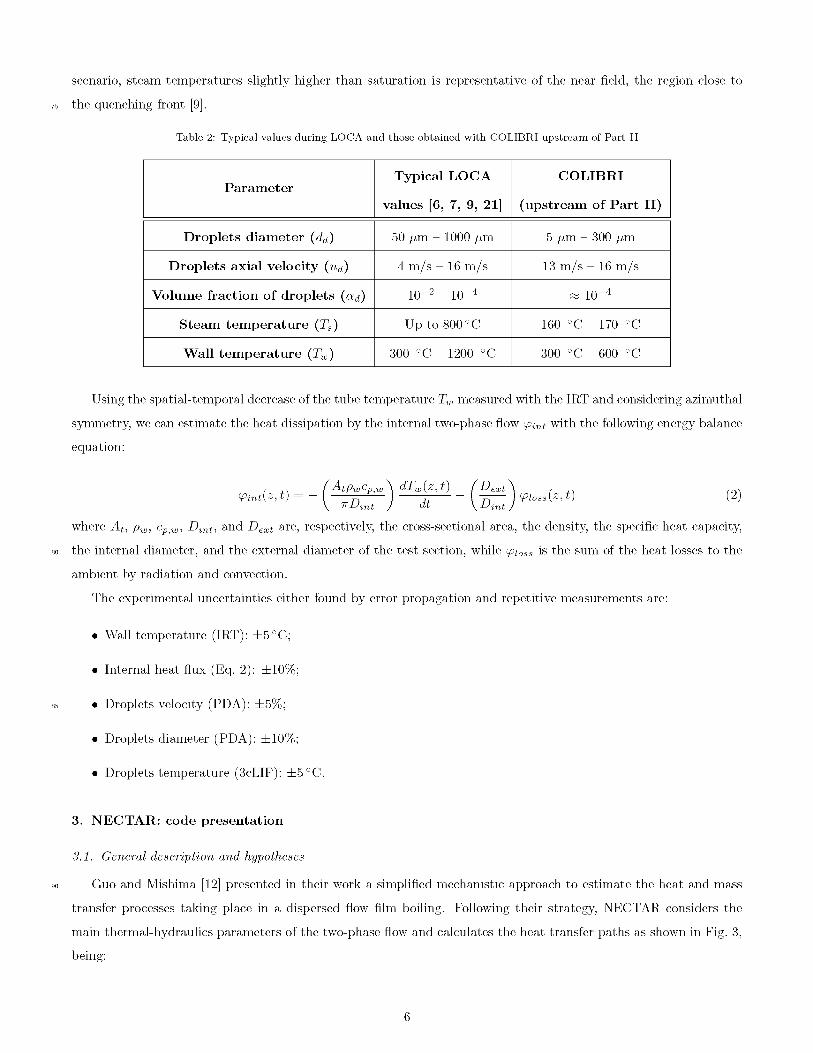
main thermal-hydraulics parameters of the two-phase flow and calculates the heat transfer paths as shown in Fig. 3,
being:
6
95
100
• &c,ws : wall-to-steam convection;
• $r,ws : wall-to-steam radiation;
• $c,sd: steam-to-droplets convection;
• &r,sd: steam-to-droplets radiation;
• &r,wd: wall-to-droplets radiation;
• &imp,wd: wall-to-droplets direct impact;
• and mev : evaporation rate of droplets.
Figure 3: Heat transfer paths considered in NECTAR, as proposed by Guo and Mishima [12].
Although NECTAR estimates all the heat transfer paths and they all affect the thermal-hydraulics of the cooling
process, we should notice that only $c,ws, $r,ws, $r,wd, and &imp,wd directly contributes to the wall heat dissipation
$int, which means:
^int — ^c,ws + ^r,ws + ^r,wd + ^imp,wd (3)
The general hypotheses made in NECTAR are the following:
105
110
1. 1-D (axial) two-fluid model (steam and droplets) in thermal and dynamic non-equilibrium;
2. Droplets are spherical and at saturation temperature, as experimentally verified [17];
3. No droplets coalescence, although droplets breakup is considered;
4. No wall separation of the dynamic boundary layer due to geometrical expansions (in the case of deformed
tubes);
5. The wall is thermally thin (Bi ^ 1 for all the experiences), hence there is no temperature gradient in the radial
direction of the tube;
6. Wall rewetting is not considered, hence the code is only valid for the Leidenfrost regime.
Although it seems similar to the model proposed by Guo and Mishima, NECTAR adopts different methods and
correlations, as we explain throughout the next sections.
7
115 3.2. Conservation équations
The droplets diameter decreases along the flow because of évaporation and, consequently, there is an increase in
the mass of steam. This process is described by a mass conservation equation as follows:
dmsdt m ev (4)
where dms/dt is the rate of change in the mass of steam and mev is the evaporation rate of the droplets.
The main forces acting on the droplets are weight and drag by the steam. Other forces like lift, added mass,
120 and near-wall evaporation are neglected in the present model. Hence, the momentum conservation equation in the
z-direction (axial) for the droplets is:
pduddud 3 dCd Ps (ud us ) |ud us 1 + (ps pd) 9 (5)dz 4dd 1 + B
where p, u and d are, in this order, density, axial velocity and diameter. The subscripts s and d stand for steam
and droplets, respectively. The drag coefficient Cd is calculated with Morsi’s correlation as a function of the droplets
Reynolds number [22] and it is reduced by the factor 1/(1 + B) (B being the thermal Spalding factor [23]) due
125 to the droplets evaporation. Furthermore, d is a coefficient that considers the influence of the droplet volumetric
concentration ad in the calculation of Cd, expressed by:
d1
1 — 6.55ad(6)
Finally, energy balance equations are applied on every differential element dz to evaluate the change in the steam
temperature and the evaporated mass along the tube length. Considering the heat exchange on the steam presented
in Fig. 3, we can find the following equation for the steam temperature downstream of a differential element at z:
Ts (z + dz)[^c,ws + ^r,ws Tc,sd Tr,sd] + m s (z)cp,sTs(z)
[m s(z) + Pt (z)] CP,s (7)
Similarly, an energy balance equation is also necessary to estimate the evaporated mass of droplets at a differential
element at z (Fig. 3), so:130
m evTe
hisTc,sd + Tr,sd + Tr,wd + Timp,wd
his(8)
where Tev represents the sum of all the rates of heat transfer on the droplets and his the heat of vaporization of
water.
3.3. Empirical corrélations
135 To estimate the rates of heat transfer present in Eqs. 3, 7 and 8, we used empirical correlations available in the
literature. Table 3 presents the ones used in NECTAR.
Two heat transfer paths are calculated differently from the model by Guo and Mishima [12]. The first is for the
wall-to-steam convection (Tc,ws), which has lots of correlations available in the literature. We chose the Gnielinski’s
correlation because it presented great match with our experimental data with a steam monophasic flow, as we
140 present in the results section. The second different one is the heat dissipation by droplets impact onto the heated
8
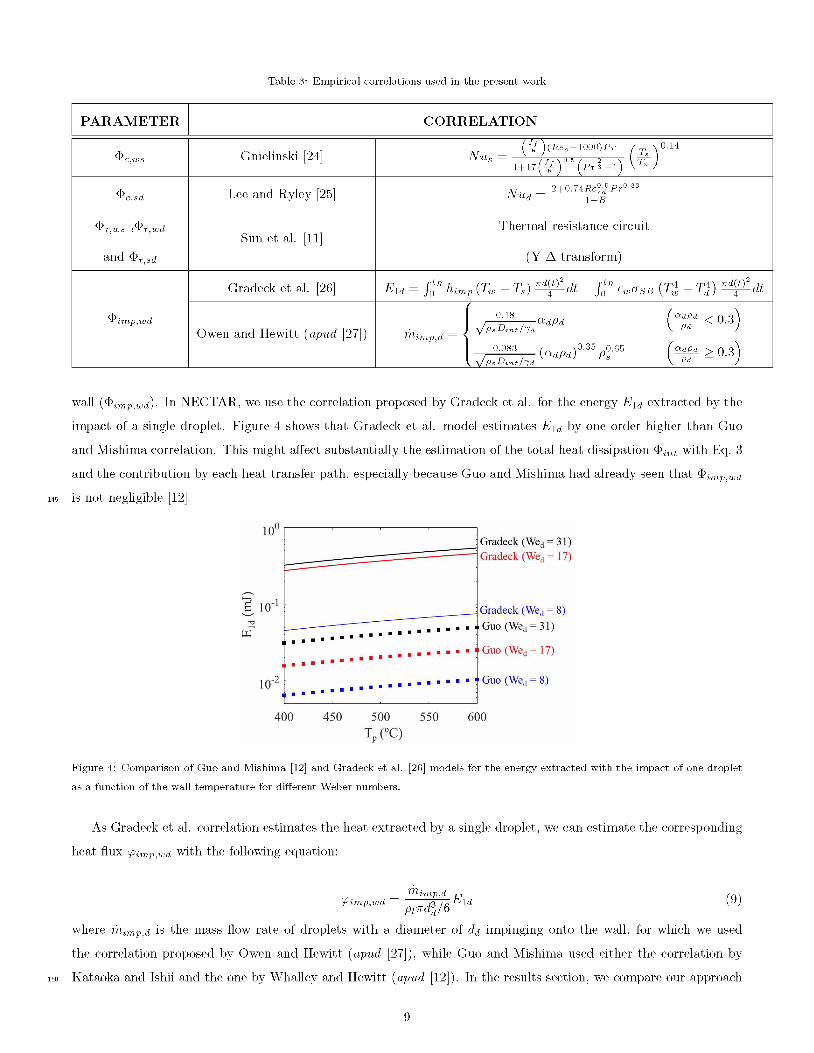
Table 3: Empirical corrélations used in the présent work
PARAMETER CORRELATION
^ c,ws Gnielinski [24]N (f) (Res —1000) Pr f T ^O.M
S _ 1+17 ( f f>r 2-1) W
^c,sd Lee and Ryley [25] Nud _ 2+°.74R+S|Pr°'33
^r,ws ,^r,wd
and $r,sd
Sun et al. [11]Thermal resistance circuit
(Y-A transform)
^imp,wd
Gradeck et al. [26] E1d = f°tR himp (Tw - Ts) ^dt + f°tR £wasB (TS - Tj) ^dt
Owen and Hewitt (apud [27])\ rJ°^ adPd fadPd < 0.3^
m _ J \JPsDint/1d V Pd Jimismp,d \ 1 ADnk ‘“'Pd >°'35 p°'65 (”PPd s 0'3)
wall (Timp,wd). In NECTAR, we use the corrélation proposed by Gradeck et al. for the energy E1d extracted by the
impact of a single droplet. Figure 4 shows that Gradeck et al. model estimates E1d by one order higher than Guo
and Mishima correlation. This might affect substantially the estimation of the total heat dissipation Tint with Eq. 3
and the contribution by each heat transfer path, especially because Guo and Mishima had already seen that Timp,wd
145 is not negligible [12].
Figure 4: Comparison of Guo and Mishima [12] and Gradeck et al. [26] models for the energy extracted with the impact of one droplet
as a function of the wall temperature for different Weber numbers.
As Gradeck et al. correlation estimates the heat extracted by a single droplet, we can estimate the corresponding
heat flux <fimp,wd with the following equation:
_ mimp,dVimp’wd _ p;ndd/6 1 d (9)
where mimp,d is the mass flow rate of droplets with a diameter of dd impinging onto the wall, for which we used
the correlation proposed by Owen and Hewitt (apud [27]), while Guo and Mishima used either the correlation by
150 Kataoka and Ishii and the one by Whalley and Hewitt (apud [12]). In the results section, we compare our approach
9
to Guo and Mishima’s for the droplet impact heat transfer.
3.4. Transport équations for the droplets évolution
We used the following equation based on the moment density approach [28-30] to describe the volumetric evolution
of the dispersed phase along the z-axis:
d [Sv(z)ud,n (z)] dz
nSv-i(z)Gv-i(z) + (z) (10)
155 The first term in the right of Eq. 10 regards the change in the droplets volume by evaporation, while the second
term (wd) regards the droplets coalescence and breakup, which is set as wd = 0 in NECTAR. We used a different
approach to consider droplets breakup in our code, which is presented in section 3.6. For Sd, ud,d and Gd, Morel et
al. [29] provides the following expressions:
Sn (z) = n(z) P(dd,z)dPddddJ 0
ud,n (z)
Gn (z)
fQ° P(dd, z)ud(dd, z)dddddf0° P (dd, z)dd ddd
f0° P (dd, z)G(dd, z)dd ddd
(11)
(12)
(13)JO0 P (dd, z)dd ddd
being Sd(z) the moment of order n, P(dd,z) and ud(dd,z), respectively, the droplets diameter and velocity distri-
160 butions at the axial position z, and G(d, z) the distribution of the change in the droplets diameter (ddd/dt) due to
evaporation.
Finally, we obtain Sd for n = 0,1, 2, 3 and, for any sort of distribution of the droplets diameter and velocity,
we can estimate volumetric characteristics of the dispersed phase (the density of droplets n, the interfacial area
concentration ai, and the volume fraction ad) along the z-direction with the following equations:
n(z) = So(z) (14)
i(z) = nS2(z) (15)a
®d(z) = nS3(z)/6 (16)
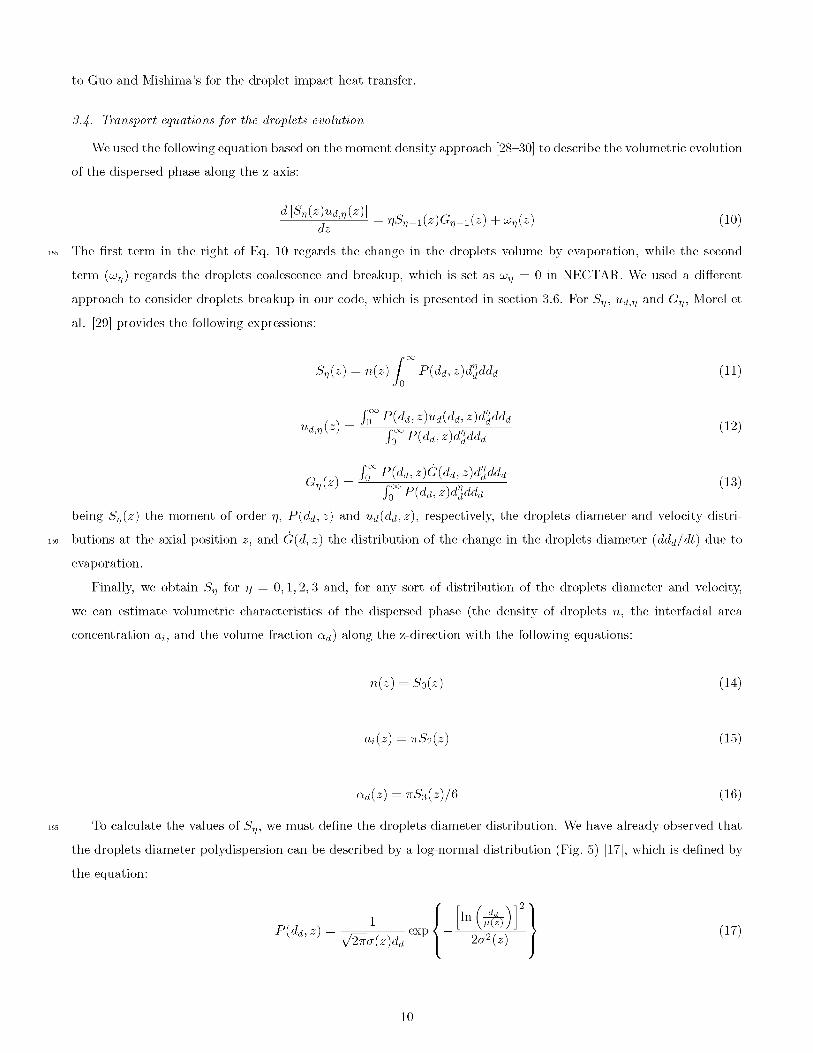
165 To calculate the values of Sd, we must define the droplets diameter distribution. We have already observed that
the droplets diameter polydispersion can be described by a log-normal distribution (Fig. 5) [17], which is defined by
the equation:
P (dd ,z) 1V2na(z)dd exp
2
2a2 (z)(17)
10
where ^ is the mean diameter and a is the standard déviation of the log-normal distribution. Hence, applying Eq. 17
to Eq. 11, we find:
6ad n-33 exp
a (n2 — 9)
2(18)
Figure 5: Log-normal distribution fitting experimental data for the droplets diameter (PDA measurements upstream of the heated tube
with a not-deformed tube)
170 Inversely, the log-normal parameters ^ and a can be calculated with the first and second moments (S 1 and S2):
a ln6adS 1
nS2 (19)
6«d 5 2^ exp (—2a (20)
3.5. Discretization of the log-normal distribution
This is already evident that the mechanistic models implemented in NECTAR depends substantially on the
droplets diameter distribution, either for the conservation equations and for the transport equations of the dispersed
phase. One usual approach that was used, for instance, by Guo and Mishima [12] is to consider a mean diameter
175 that is representative of all the droplets. The Sauter mean diameter ^32 is a popular choice because it conserves
the droplets mean volume-to-surface ratio. In NECTAR, we chose a more realistic approach by conserving the
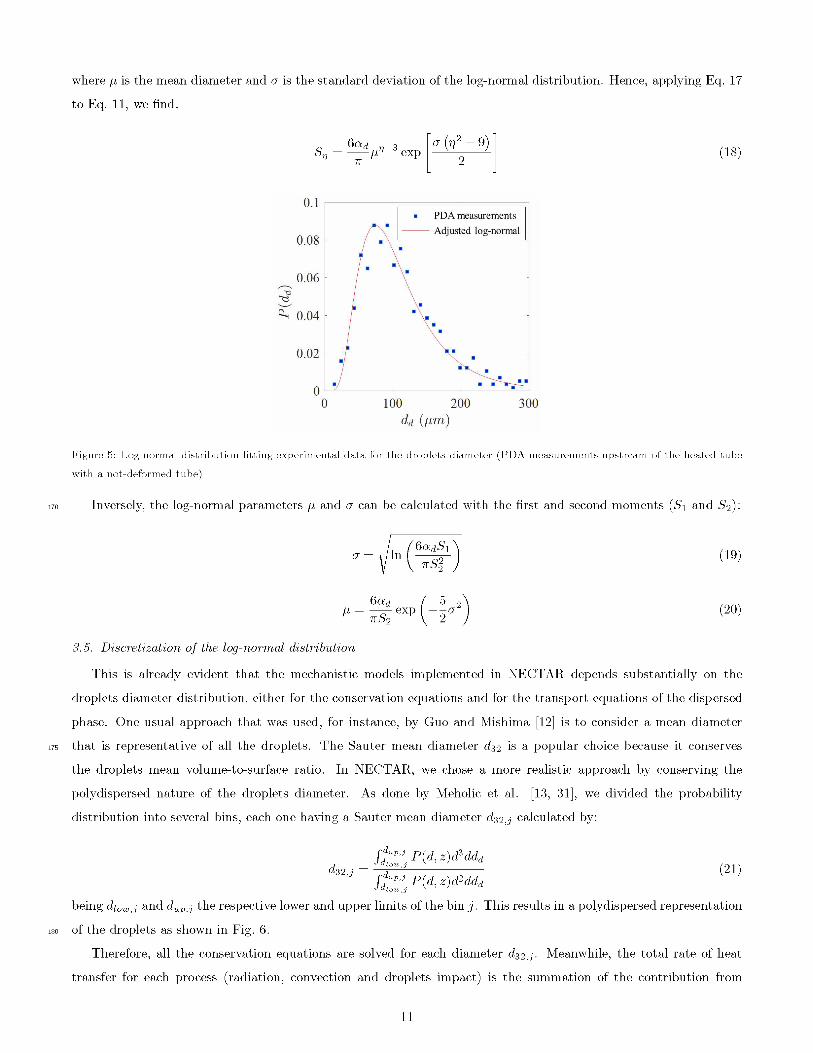
polydispersed nature of the droplets diameter. As done by Meholic et al. [13, 31], we divided the probability
distribution into several bins, each one having a Sauter mean diameter d32,j calculated by:
d32,j —Jdd::;jp (d,z)d3ddâ
tfZ P(d,z)d2ddd
(21)
being diowj and dup,j the respective lower and upper limits of the bin j. This results in a polydispersed representation
180 of the droplets as shown in Fig. 6.
Therefore, all the conservation equations are solved for each diameter d32,j. Meanwhile, the total rate of heat
transfer for each process (radiation, convection and droplets impact) is the summation of the contribution from
11
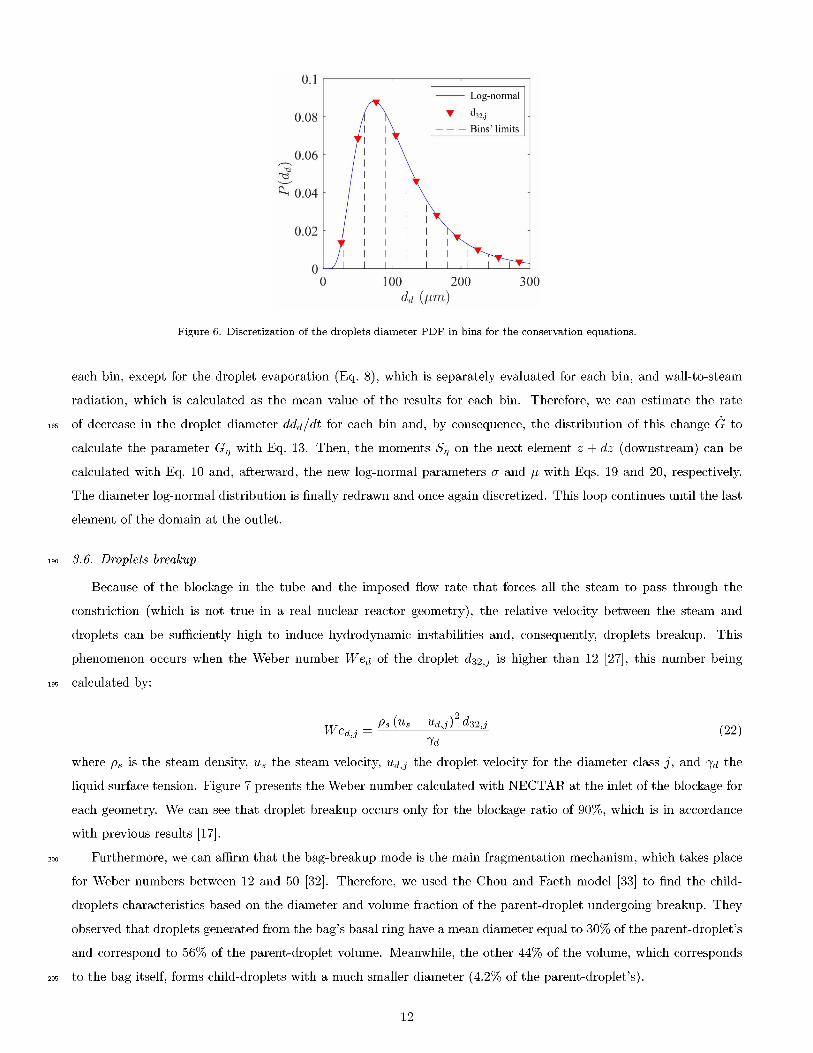
Figure 6: Discretization of the droplets diameter PDF in bins for the conservation équations.
each bin, except for the droplet évaporation (Eq. 8), which is separately evaluated for each bin, and wall-to-steam
radiation, which is calculated as the mean value of the results for each bin. Therefore, we can estimate the rate
iss of decrease in the droplet diameter ddd/dt for each bin and, by consequence, the distribution of this change G to
calculate the parameter Gn with Eq. 13. Then, the moments Sn on the next element z + dz (downstream) can be
calculated with Eq. 10 and, afterward, the new log-normal parameters a and p with Eqs. 19 and 20, respectively.
The diameter log-normal distribution is finally redrawn and once again discretized. This loop continues until the last
element of the domain at the outlet.
190 3.6. Droplets breakup
Because of the blockage in the tube and the imposed flow rate that forces all the steam to pass through the
constriction (which is not true in a real nuclear reactor geometry), the relative velocity between the steam and
droplets can be sufficiently high to induce hydrodynamic instabilities and, consequently, droplets breakup. This
phenomenon occurs when the Weber number Wed of the droplet d32,j is higher than 12 [27], this number being
195 calculated by:
Wed,j =P s (us ud,j) d32,j
Yd(22)
where ps is the steam density, us the steam velocity, ud,j the droplet velocity for the diameter class j, and Yd the
liquid surface tension. Figure 7 presents the Weber number calculated with NECTAR at the inlet of the blockage for
each geometry. We can see that droplet breakup occurs only for the blockage ratio of 90%, which is in accordance
with previous results [17].
200 Furthermore, we can affirm that the bag-breakup mode is the main fragmentation mechanism, which takes place
for Weber numbers between 12 and 50 [32]. Therefore, we used the Chou and Faeth model [33] to find the child-
droplets characteristics based on the diameter and volume fraction of the parent-droplet undergoing breakup. They
observed that droplets generated from the bag’s basal ring have a mean diameter equal to 30% of the parent-droplet’s
and correspond to 56% of the parent-droplet volume. Meanwhile, the other 44% of the volume, which corresponds
2os to the bag itself, forms child-droplets with a much smaller diameter (4.2% of the parent-droplet’s).
12
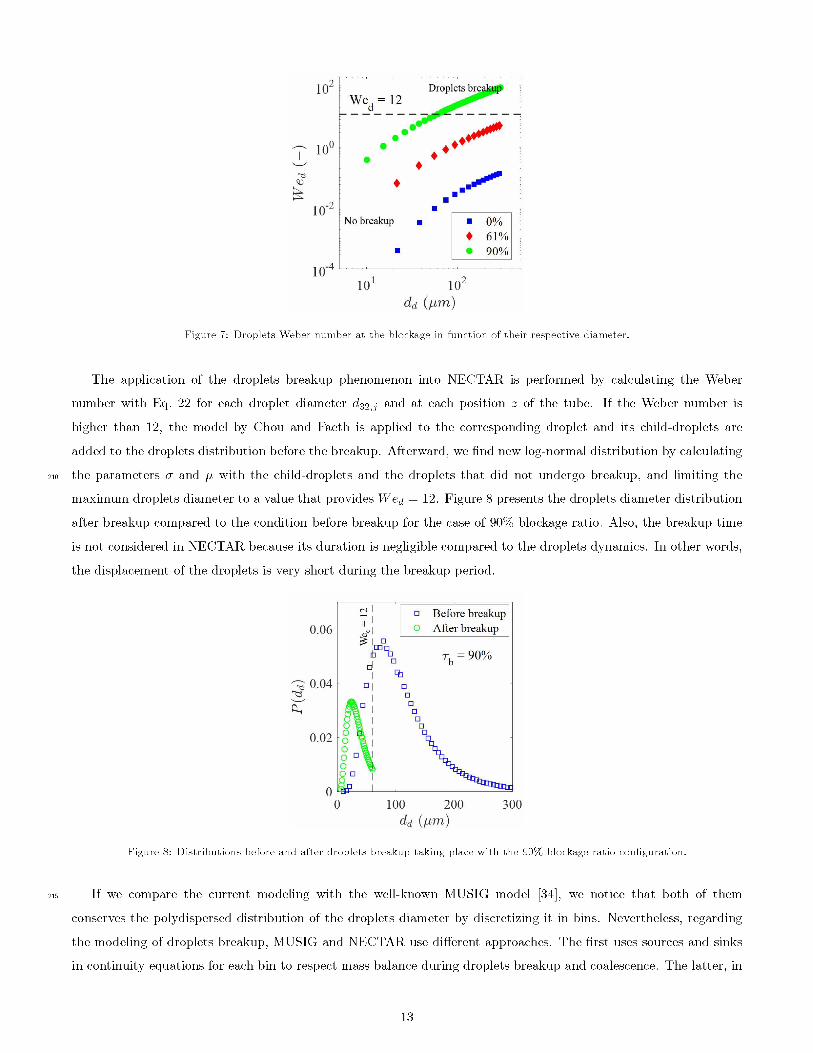
Figure 7: Droplets Weber number at the blockage in function of their respective diameter.
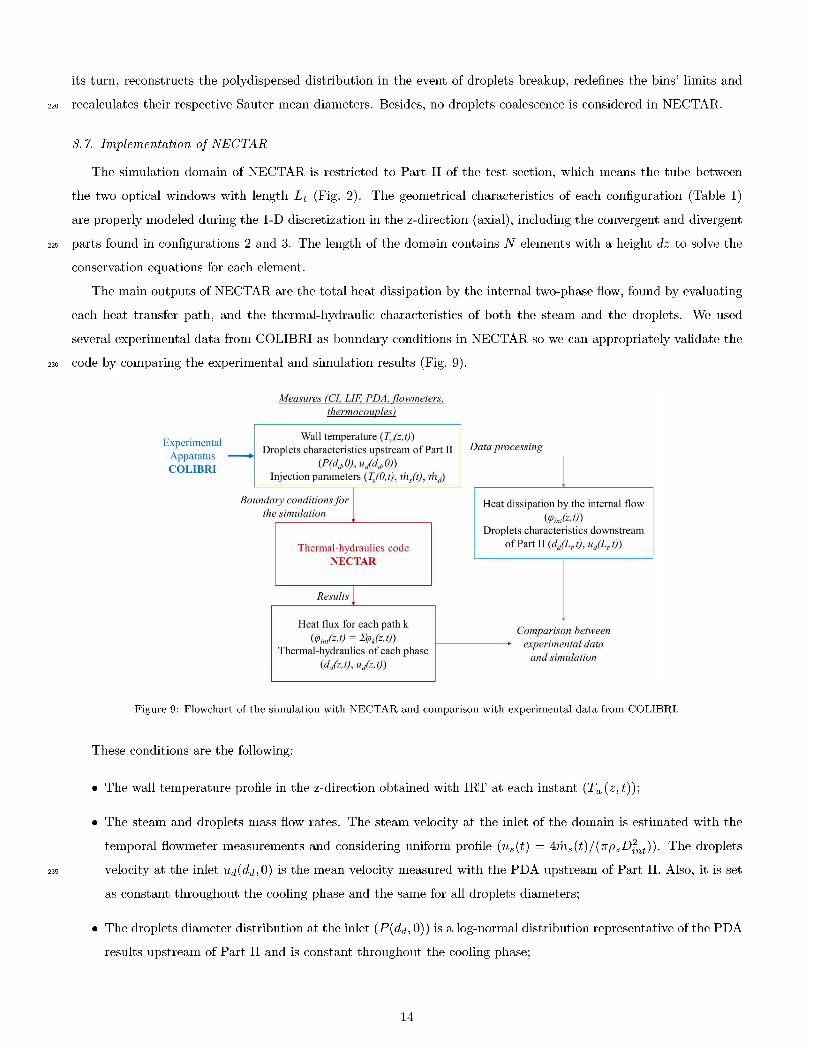
The application of the droplets breakup phenomenon into NECTAR is performed by calculating the Weber
number with Eq. 22 for each droplet diameter d^j and at each position z of the tube. If the Weber number is
higher than 12, the model by Chou and Faeth is applied to the corresponding droplet and its child-droplets are
added to the droplets distribution before the breakup. Afterward, we find new log-normal distribution by calculating
210 the parameters a and ^ with the child-droplets and the droplets that did not undergo breakup, and limiting the
maximum droplets diameter to a value that provides Wed = 12. Figure 8 presents the droplets diameter distribution
after breakup compared to the condition before breakup for the case of 90% blockage ratio. Also, the breakup time
is not considered in NECTAR because its duration is negligible compared to the droplets dynamics. In other words,
the displacement of the droplets is very short during the breakup period.
Figure 8: Distributions before and after droplets breakup taking place with the 90% blockage ratio configuration.
215 If we compare the current modeling with the well-known MUSIG model [34], we notice that both of them
conserves the polydispersed distribution of the droplets diameter by discretizing it in bins. Nevertheless, regarding
the modeling of droplets breakup, MUSIG and NECTAR use different approaches. The first uses sources and sinks
in continuity equations for each bin to respect mass balance during droplets breakup and coalescence. The latter, in
13
its turn, reconstructs the polydispersed distribution in the event of droplets breakup, redefines the bins’ limits and
220 recalculates their respective Sauter mean diameters. Besides, no droplets coalescence is considered in NECTAR.
3.7. Implémentation of NECTAR
The simulation domain of NECTAR is restricted to Part II of the test section, which means the tube between
the two optical windows with length Lt (Fig. 2). The geometrical characteristics of each configuration (Table 1)
are properly modeled during the 1-D discretization in the z-direction (axial), including the convergent and divergent
225 parts found in configurations 2 and 3. The length of the domain contains N elements with a height dz to solve the
conservation equations for each element.
The main outputs of NECTAR are the total heat dissipation by the internal two-phase flow, found by evaluating
each heat transfer path, and the thermal-hydraulic characteristics of both the steam and the droplets. We used
several experimental data from COLIBRI as boundary conditions in NECTAR so we can appropriately validate the
230 code by comparing the experimental and simulation results (Fig. 9).
Figure 9: Flowchart of the simulation with NECTAR and comparison with experimental data from COLIBRI.
These conditions are the following:
• The wall temperature profile in the z-direction obtained with IRT at each instant (Tw(z,t));
• The steam and droplets mass flow rates. The steam velocity at the inlet of the domain is estimated with the
temporal flowmeter measurements and considering uniform profile (us(t) = 4ms(t)/(npsD2nt)). The droplets
235 velocity at the inlet Ud(dd, 0) is the mean velocity measured with the PDA upstream of Part II. Also, it is set
as constant throughout the cooling phase and the same for all droplets diameters;
• The droplets diameter distribution at the inlet (P(dd, 0)) is a log-normal distribution representative of the PDA
results upstream of Part II and is constant throughout the cooling phase;
14
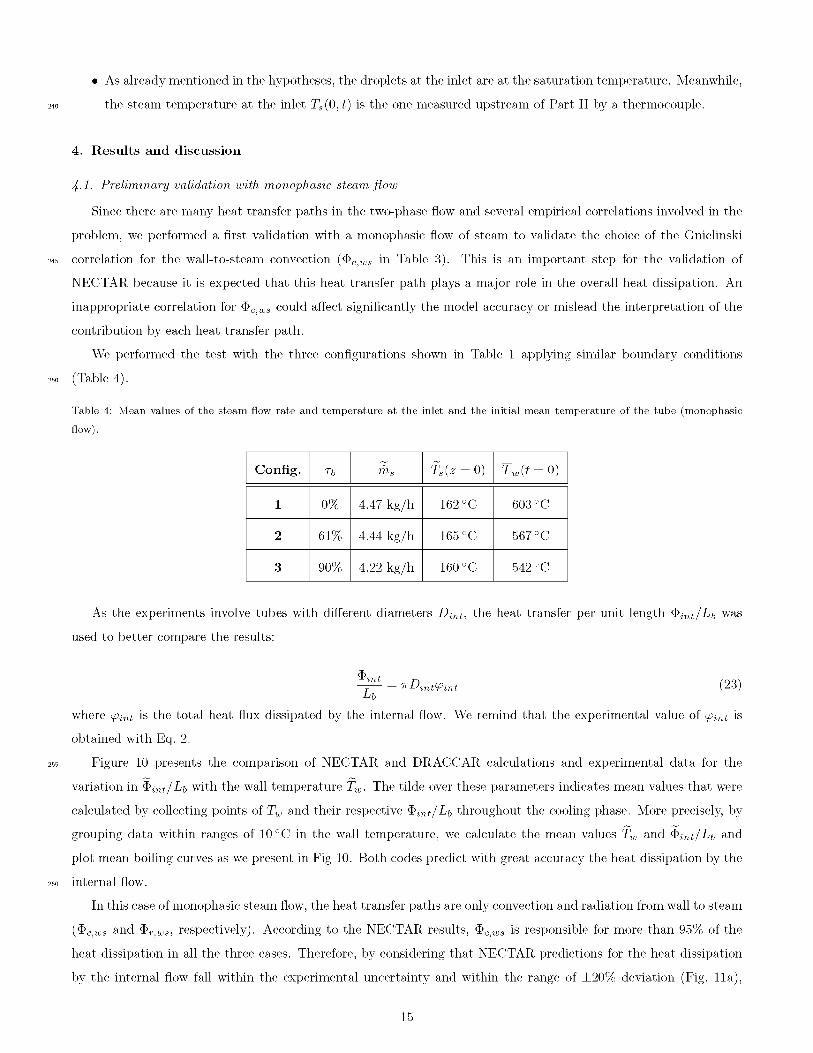
• As already mentioned in the hypothèses, the droplets at the inlet are at the saturation température. Meanwhile,
240 the steam temperature at the inlet Ts(0,t) is the one measured upstream of Part II by a thermocouple.
4. Results and discussion
4.1. Preliminary validation with monophasic steam flow
Since there are many heat transfer paths in the two-phase flow and several empirical correlations involved in the
problem, we performed a first validation with a monophasic flow of steam to validate the choice of the Gnielinski
245 correlation for the wall-to-steam convection (Tc,ws in Table 3). This is an important step for the validation of
NECTAR because it is expected that this heat transfer path plays a major role in the overall heat dissipation. An
inappropriate correlation for Tc,ws could affect significantly the model accuracy or mislead the interpretation of the
contribution by each heat transfer path.
We performed the test with the three configurations shown in Table 1 applying similar boundary conditions
250 (Table 4).
Table 4: Mean values of the steam flow rate and temperature at the inlet and the initial mean temperature of the tube (monophasic
flow).
Config. Tb m s Ts(z = 0) T w (t = 0)
1 0% 4.47 kg/h 162 °C 603 °C
2 61% 4.44 kg/h 165 °C 567 °C
3 90% 4.22 kg/h 160 °C 542 °C
As the experiments involve tubes with different diameters Dint, the heat transfer per unit length Tint/Lb was
used to better compare the results:
TLb
nDintPint (23)
where y>int is the total heat flux dissipated by the internal flow. We remind that the experimental value of y>int is
obtained with Eq. 2.
255 Figure 10 presents the comparison of NECTAR and DRACCAR calculations and experimental data for the
variation in Tint/Lb with the wall temperature Tw. The tilde over these parameters indicates mean values that were
calculated by collecting points of Tw and their respective Tint/Lb throughout the cooling phase. More precisely, by
grouping data within ranges of 10 °C in the wall temperature, we calculate the mean values Tw and Tint/Lb and
plot mean boiling curves as we present in Fig 10. Both codes predict with great accuracy the heat dissipation by the
260 internal flow.
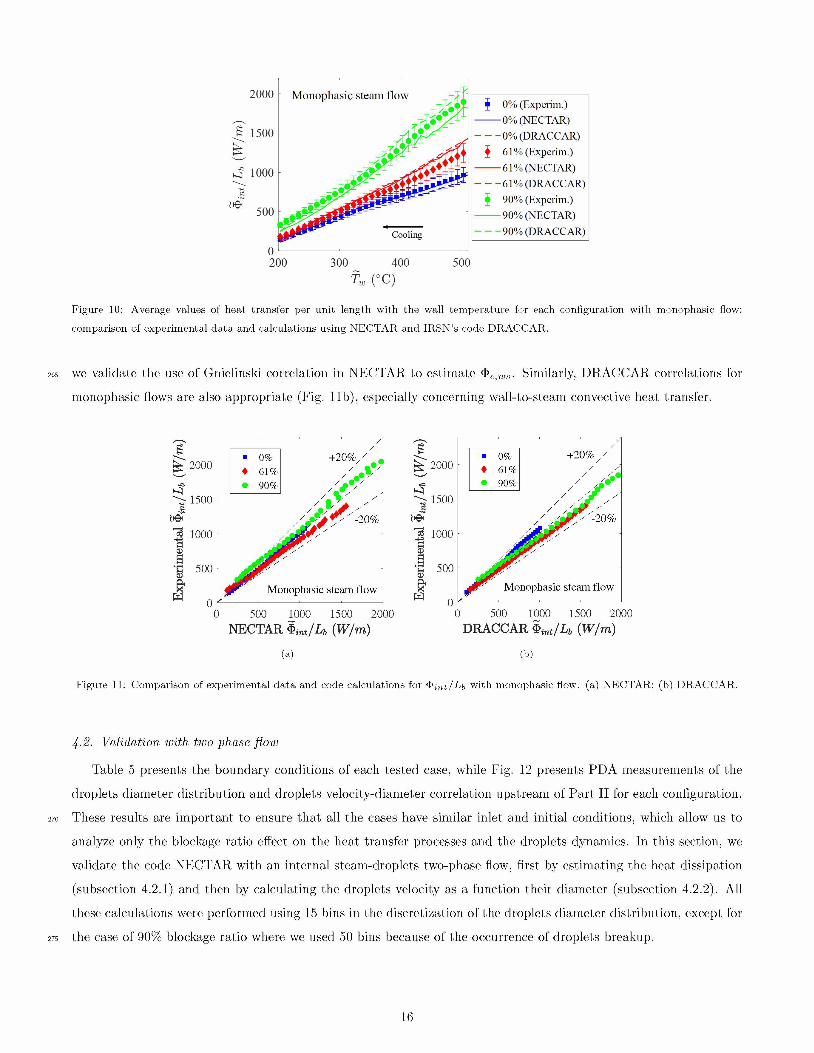
In this case of monophasic steam flow, the heat transfer paths are only convection and radiation from wall to steam
(Tc,ws and Tr,ws, respectively). According to the NECTAR results, Tc,ws is responsible for more than 95% of the
heat dissipation in all the three cases. Therefore, by considering that NECTAR predictions for the heat dissipation
by the internal flow fall within the experimental uncertainty and within the range of ±20% deviation (Fig. 11a),
15
Tw (°C)
■ 0% (Experim.)------- 0% (NECTAR)------- 0% (DRACCAR)
J 61% (Experim.)
------- 61% (NECTAR)------- 61% (DRACCAR)
$ 90% (Experim.)
— 90% (NECTAR)- -90% (DRACCAR)
Figure 10: Average values of heat transfer per unit length with the wall température for each configuration with monophasic flow:
comparison of experimental data and calculations using NECTAR and IRSN’s code DRACCAR.
265 we validate the use of Gnielinski corrélation in NECTAR to estimate Tc,ws. Similarly, DRACCAR corrélations for
monophasic flows are also appropriate (Fig. 11b), especially concerning wall-to-steam convective heat transfer.
2000
-O^1
1500e
1000fl03
50003&w
(a) (b)
Figure 11: Comparison of experimental data and code calculations for T;„t/Lb with monophasic flow. (a) NECTAR; (b) DRACCAR.
0
4-2. Validation with two-phase flow
Table 5 presents the boundary conditions of each tested case, while Fig. 12 presents PDA measurements of the
droplets diameter distribution and droplets velocity-diameter correlation upstream of Part II for each configuration.
270 These results are important to ensure that all the cases have similar inlet and initial conditions, which allow us to
analyze only the blockage ratio effect on the heat transfer processes and the droplets dynamics. In this section, we
validate the code NECTAR with an internal steam-droplets two-phase flow, first by estimating the heat dissipation
(subsection 4.2.1) and then by calculating the droplets velocity as a function their diameter (subsection 4.2.2). All
these calculations were performed using 15 bins in the discretization of the droplets diameter distribution, except for
275 the case of 90% blockage ratio where we used 50 bins because of the occurrence of droplets breakup.
16
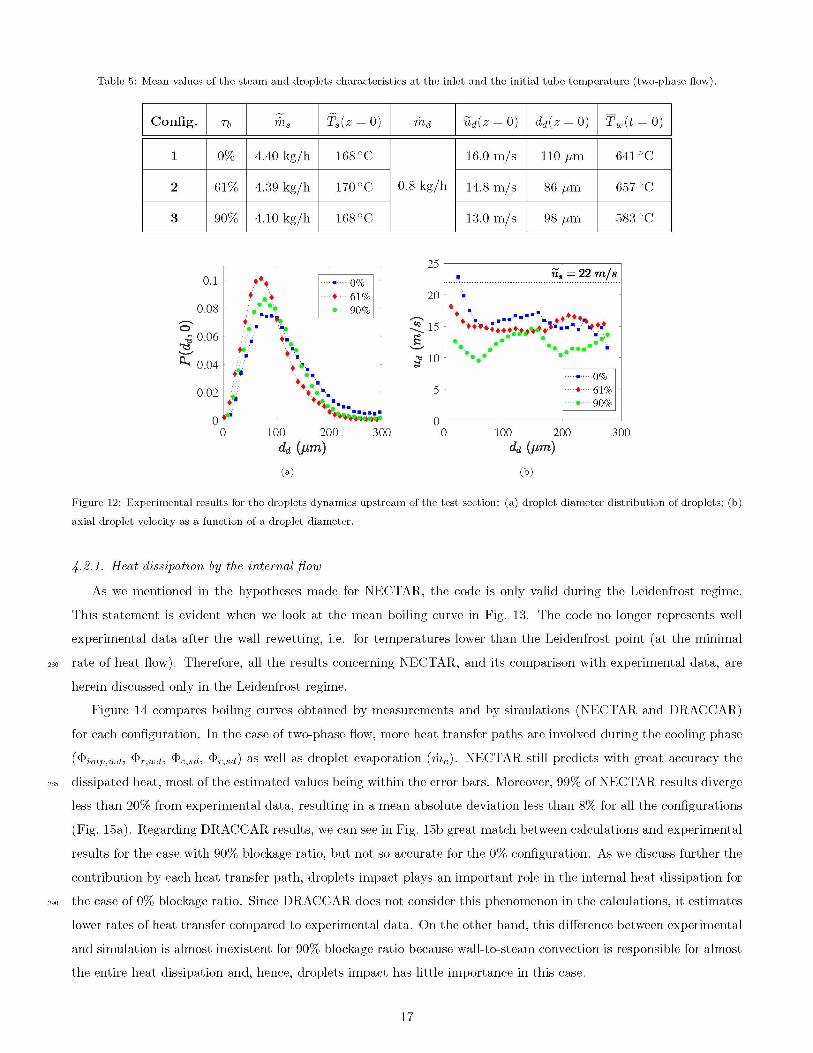
Table 5: Mean values of the steam and droplets characteristics at the inlet and the initial tube température (two-phase flow).
Config. Tb m s Ts(z = 0) m d ùd(z = 0) dd(z = 0) T w (t = 0)
1 0% 4.40 kg/h 168 °C 16.0 m/s 110 pm 641 °C
2 61% 4.39 kg/h 170 °C 0.8 kg/h 14.8 m/s 86 pm 657 °C
3 90% 4.10 kg/h 168 °C 13.0 m/s 98 pm 583 °C
0 100 200 300dd (jim)
25
20
15
1°
5
00 100 200 300
dd {imi)
■ tig = 22 m/s
' ■«
V ,••••* ■ *..« ••
É O £
♦ 61%• 90%
(a) (b)
Figure 12: Experimental results for the droplets dynamics upstream of the test section: (a) droplet diameter distribution of droplets; (b)
axial droplet velocity as a function of a droplet diameter.
4-2.1. Heat dissipation by the internai flow
As we mentioned in the hypothèses made for NECTAR, the code is only valid during the Leidenfrost regime.
This statement is evident when we look at the mean boiling curve in Fig. 13. The code no longer represents well
experimental data after the wall rewetting, i.e. for temperatures lower than the Leidenfrost point (at the minimal
280 rate of heat flow). Therefore, all the results concerning NECTAR, and its comparison with experimental data, are
herein discussed only in the Leidenfrost regime.
Figure 14 compares boiling curves obtained by measurements and by simulations (NECTAR and DRACCAR)
for each configuration. In the case of two-phase flow, more heat transfer paths are involved during the cooling phase
(Timp,wd, Tr,wd, Tc,sd, Tr,sd) as well as droplet evaporation (me). NECTAR still predicts with great accuracy the
285 dissipated heat, most of the estimated values being within the error bars. Moreover, 99% of NECTAR results diverge
less than 20% from experimental data, resulting in a mean absolute deviation less than 8% for all the configurations
(Fig. 15a). Regarding DRACCAR results, we can see in Fig. 15b great match between calculations and experimental
results for the case with 90% blockage ratio, but not so accurate for the 0% configuration. As we discuss further the
contribution by each heat transfer path, droplets impact plays an important role in the internal heat dissipation for
290 the case of 0% blockage ratio. Since DRACCAR does not consider this phenomenon in the calculations, it estimates
lower rates of heat transfer compared to experimental data. On the other hand, this difference between experimental
and simulation is almost inexistent for 90% blockage ratio because wall-to-steam convection is responsible for almost
the entire heat dissipation and, hence, droplets impact has little importance in this case.
17

Figure 13: Code validity example with a two-phase steam-droplets flow and 0% blockage ratio.
| 0% (Experim.)
--------0% (NECTAR)
--------0% (DRACCAR)£ 61% (Experim.)
--------61% (NECTAR)--------61% (DRACCAR)
• 90% (Experim.)
— 90% (NECTAR)
• -90% (DRACCAR)
300 400_ 500 600Tw (°C)
Figure 14: Average values of heat transfer per unit length with the wall temperature for each configuration with steam-droplets two-phase
flow: comparison of experimental data and calculations using NECTAR and IRSN’s code DRACCAR.
NECTAR §int/Lb (W/m) DRACCAR $int/Lb (W/m)
(a) (b)
Figure 15: Comparison of experimental data and code calculations for &int/Lb with steam-droplets two-phase flow. (a) NECTAR; (b)
DRACCAR.
18
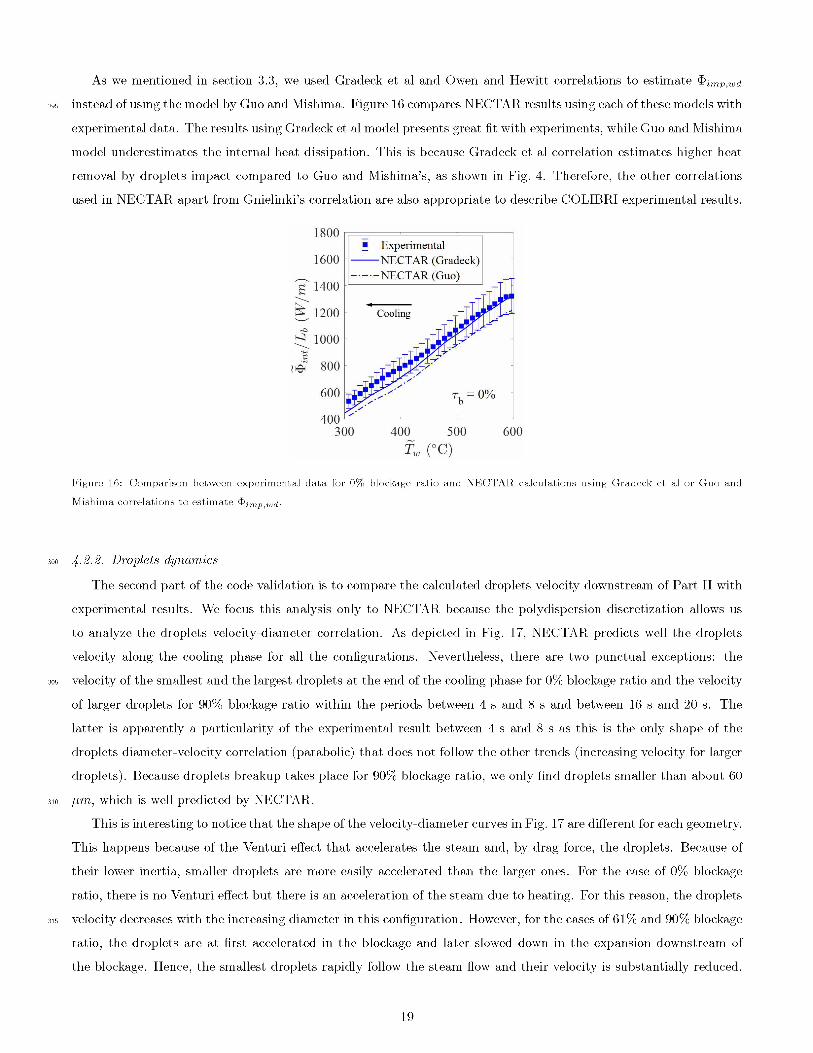
As we mentioned in section 3.3, we used Gradeck et al and Owen and Hewitt corrélations to estimate &imp,wd
295 instead of using the model by Guo and Mishima. Figure 16 compares NECTAR results using each of these models with
experimental data. The results using Gradeck et al model presents great fit with experiments, while Guo and Mishima
model underestimates the internal heat dissipation. This is because Gradeck et al correlation estimates higher heat
removal by droplets impact compared to Guo and Mishima’s, as shown in Fig. 4. Therefore, the other correlations
used in NECTAR apart from Gnielinki’s correlation are also appropriate to describe COLIBRI experimental results.
Figure 16: Comparison between experimental data for 0% blockage ratio and NECTAR calculations using Gradeck et al or Guo and
Mishima correlations to estimate &imp,wd-
300
305
310
315
4-2.2. Droplets dynamics
The second part of the code validation is to compare the calculated droplets velocity downstream of Part II with
experimental results. We focus this analysis only to NECTAR because the polydispersion discretization allows us
to analyze the droplets velocity-diameter correlation. As depicted in Fig. 17, NECTAR predicts well the droplets
velocity along the cooling phase for all the configurations. Nevertheless, there are two punctual exceptions: the
velocity of the smallest and the largest droplets at the end of the cooling phase for 0% blockage ratio and the velocity
of larger droplets for 90% blockage ratio within the periods between 4 s and 8 s and between 16 s and 20 s. The
latter is apparently a particularity of the experimental result between 4 s and 8 s as this is the only shape of the
droplets diameter-velocity correlation (parabolic) that does not follow the other trends (increasing velocity for larger
droplets). Because droplets breakup takes place for 90% blockage ratio, we only find droplets smaller than about 60
^m, which is well predicted by NECTAR.
This is interesting to notice that the shape of the velocity-diameter curves in Fig. 17 are different for each geometry.
This happens because of the Venturi effect that accelerates the steam and, by drag force, the droplets. Because of
their lower inertia, smaller droplets are more easily accelerated than the larger ones. For the case of 0% blockage
ratio, there is no Venturi effect but there is an acceleration of the steam due to heating. For this reason, the droplets
velocity decreases with the increasing diameter in this configuration. However, for the cases of 61% and 90% blockage
ratio, the droplets are at first accelerated in the blockage and later slowed down in the expansion downstream of
the blockage. Hence, the smallest droplets rapidly follow the steam flow and their velocity is substantially reduced.
19
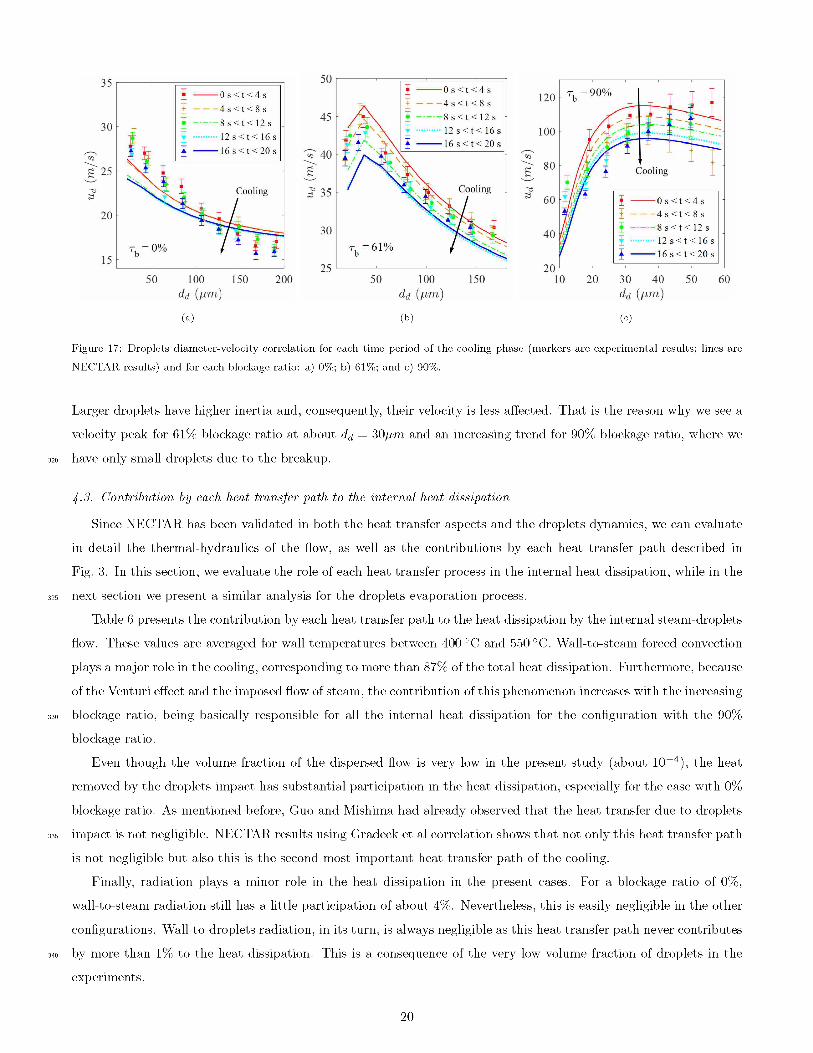
Figure 17: Droplets diameter-velocity corrélation for each time period of the cooling phase (markers are experimental results; lines are
NECTAR results) and for each blockage ratio: a) 0%; b) 61%; and c) 90%.
Larger droplets have higher inertia and, consequently, their velocity is less affected. That is the reason why we see a
velocity peak for 61% blockage ratio at about dd = 30pm and an increasing trend for 90% blockage ratio, where we
320 have only small droplets due to the breakup.
4.3. Contribution by each heat transfer path to the internai heat dissipation
Since NECTAR has been validated in both the heat transfer aspects and the droplets dynamics, we can evaluate
in detail the thermal-hydraulics of the flow, as well as the contributions by each heat transfer path described in
Fig. 3. In this section, we evaluate the role of each heat transfer process in the internal heat dissipation, while in the
325 next section we present a similar analysis for the droplets evaporation process.
Table 6 presents the contribution by each heat transfer path to the heat dissipation by the internal steam-droplets
flow. These values are averaged for wall temperatures between 400 0C and 550 0C. Wall-to-steam forced convection
plays a major role in the cooling, corresponding to more than 87% of the total heat dissipation. Furthermore, because
of the Venturi effect and the imposed flow of steam, the contribution of this phenomenon increases with the increasing
330 blockage ratio, being basically responsible for all the internal heat dissipation for the configuration with the 90%
blockage ratio.
Even though the volume fraction of the dispersed flow is very low in the present study (about 10-4), the heat
removed by the droplets impact has substantial participation in the heat dissipation, especially for the case with 0%
blockage ratio. As mentioned before, Guo and Mishima had already observed that the heat transfer due to droplets
335 impact is not negligible. NECTAR results using Gradeck et al correlation shows that not only this heat transfer path
is not negligible but also this is the second most important heat transfer path of the cooling.
Finally, radiation plays a minor role in the heat dissipation in the present cases. For a blockage ratio of 0%,
wall-to-steam radiation still has a little participation of about 4%. Nevertheless, this is easily negligible in the other
configurations. Wall-to-droplets radiation, in its turn, is always negligible as this heat transfer path never contributes
340 by more than 1% to the heat dissipation. This is a consequence of the very low volume fraction of droplets in the
experiments.
20

Table 6: Average contribution by each heat transfer path to the internai heat dissipation for each configuration (400 0C < Tw < 550 0C).
Heat dissipation
0h? Tb = 61% Tb = 90%
^ c,ws 87.7% 92.1% 97.2%
^ imp,wd 8.1% 6.1% 2.2%
^ r,ws 3.7% 1.5% 0.4%
^ r,wd 0.5% 0.3% 0.2%
int (Summation) 100% 100% 100%
4.4. Contribution by each heat transfer path to the droplets évaporation
Figure 18 présents the fraction of the droplets mass that evaporates after passing through the heated tube.
As expected, the droplets evaporation rate decreases with lower wall temperatures. We found similar values of
345 evaporated mass with the 0% and 61% blockage ratio configurations. However, we can observe a substantial increase
in the evaporated mass for 90% blockage ratio because of the Venturi effect together with the droplets breakup that
increases substantially the droplets surface-to-volume ratio. This means steam-to-droplets convection is enhanced,
leading to higher rates of evaporation.
Figure 18: Relative evaporated mass of droplets in function of the wall temperature for each configuration.
This analysis is confirmed when looking at Table 7 that presents the average contribution by each heat transfer
350 path to the droplets evaporation (400 0C < Tw < 550 0C). For all the cases, droplets impact onto the wall plays an
important role on the droplets evaporation, corresponding to nearly 60% for the cases with 0% and 61% blockage ratio
and to 40% for the configuration with 90% blockage ratio. Steam-to-droplets convection is the other heat transfer
path having significant contribution. This happens especially for the case of 90% blockage ratio because of droplets
break-up and the acceleration of the steam phase due to the Venturi effect. Next, there is a small contribution of
355 3% to 4% by the wall-to-droplets radiative heat transfer. Finally, steam-to-droplets radiation is practically zero and
can easily be neglected for the tested cases.
21
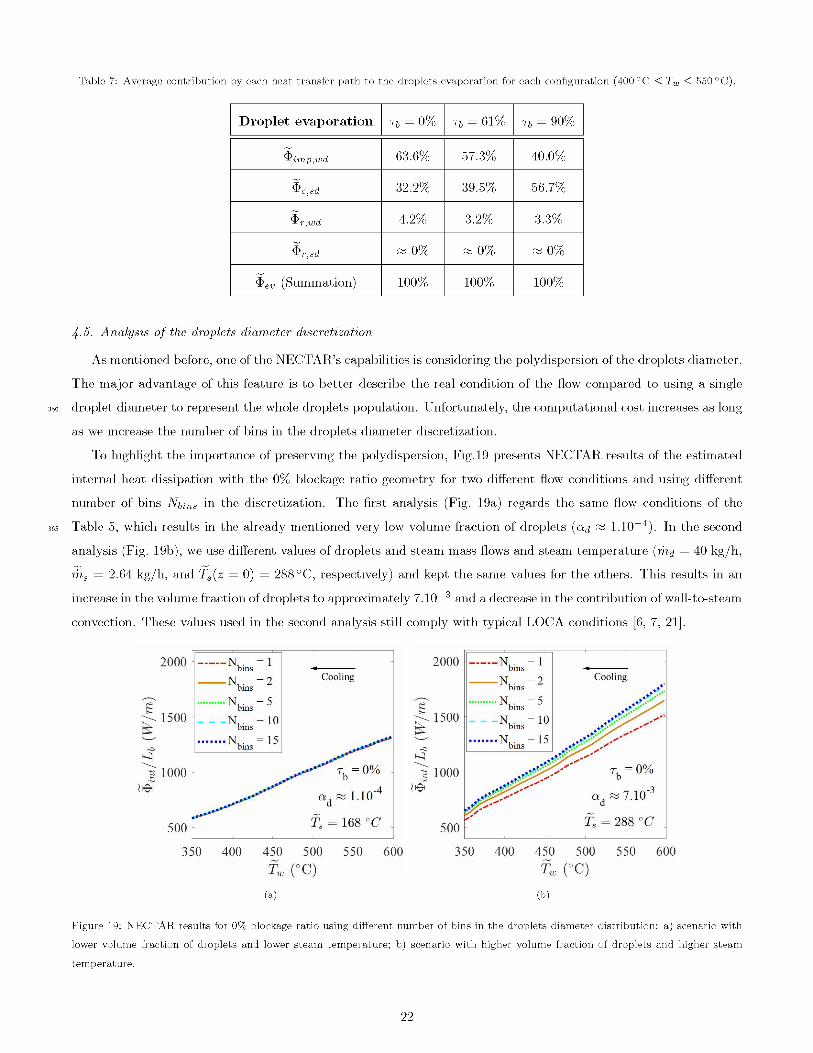
Table 7: Average contribution by each heat transfer path to the droplets évaporation for each configuration (400 °C < Tw < 550 °C).
Droplet évaporation Tb = 0% Tb = 61% Tb = 90%
^ imp,wd 63.6% 57.3% 40.0%
T c,sd 32.2% 39.5% 56.7%
T r,wd 4.2% 3.2% 3.3%
T r,sd « 0% « 0% « 0%
Tev (Summation) 100% 100% 100%
4.5. Analysis of the droplets diameter discretization
As mentioned before, one of the NECTAR’s capabilities is considering the polydispersion of the droplets diameter.
The major advantage of this feature is to better describe the real condition of the flow compared to using a single
360 droplet diameter to represent the whole droplets population. Unfortunately, the computational cost increases as long
as we increase the number of bins in the droplets diameter discretization.
To highlight the importance of preserving the polydispersion, Fig.19 presents NECTAR results of the estimated
internal heat dissipation with the 0% blockage ratio geometry for two different flow conditions and using different
number of bins Nbins in the discretization. The first analysis (Fig. 19a) regards the same flow conditions of the
365 Table 5, which results in the already mentioned very low volume fraction of droplets (ad « 1.10-4). In the second
analysis (Fig. 19b), we use different values of droplets and steam mass flows and steam temperature (md = 40 kg/h,
ms = 2.64 kg/h, and Ts(z = 0) = 288°C, respectively) and kept the same values for the others. This results in an
increase in the volume fraction of droplets to approximately 7.10-3 and a decrease in the contribution of wall-to-steam
convection. These values used in the second analysis still comply with typical LOCA conditions [6, 7, 21].
Figure 19: NECTAR results for 0% blockage ratio using different number of bins in the droplets diameter distribution: a) scenario with
lower volume fraction of droplets and lower steam temperature; b) scenario with higher volume fraction of droplets and higher steam
temperature.
22
370 Figure 19a shows that NECTAR calculations with 1 bin and 15 bins are virtually the same, so there is no advantage
in using the polydispersed distribution to estimate the internal heat dissipation with low volume fraction scenario. In
contrast, the polydispersion discretization becomes important in the second case with high volume fraction and higher
steam temperature (Figure 19b). For instance, the mean différence between the estimated internal heat dissipation
using 1 and 15 bins is about 14%. Indeed, this is related to the more important role played by the droplets in the
375 second case. Direct impact of droplets and wall-to-droplets radiation, for example, correspond respectively to 22.4%
and 23.8% of the internal heat dissipation in the second scenario, while in the first they contribute to only 8.1% and
0.5% (Table 6). Meanwhile, the contribution by wall-to-steam convection decreases from 87.7% to 50.8%. Hence,
keeping the polydispersion distribution of the droplets diameter is important when the droplets contribution to the
thermal-hydraulics of the flow is more significant.
380 5. Conclusions
The present work introduces a new code named NECTAR to estimate the heat dissipation by an internal poly
dispersed flow film boiling in LOCA conditions at sub-channel scale. The simulation results are compared with
experiments performed with the test apparatus COLIBRI, which was specially built to provide data to validate
thermal-hydraulics mechanistic models. NECTAR considers six heat transfer paths between wall, steam and droplets,
385 as well as mass transfer due to droplets evaporation. Furthermore, NECTAR uses different correlations from the
model by Guo and Mishima and considers a polydispersed distribution of the droplets diameter and droplets breakup.
The main findings of this work are:
390
• NECTAR predicts with great accuracy the heat dissipation by an internal steam-droplets two-phase flow, with
a mean deviation of less than 8% from experimental data, which indicates that all the chosen correlations are
appropriate to describe the heat transfer exchanges;
• NECTAR also predicts well the droplets velocity downstream of the heated tube in function of the droplets
diameter;
• Because of the very low volume fraction of droplets in the test cases (about 10-4) and the imposed flow of steam
to the blockage, wall-to-steam convective heat transfer plays the major role among the heat transfer paths. It
395 corresponds to approximately 90% of the internal heat dissipation for the cases of 0% and 61% blockage ratio
and to 97% of the heat dissipation for 90% blockage ratio;
• Despite the very low volume fraction of droplets in the flow, droplets impact onto the heated wall has substantial
participation in the heat removal and cannot be neglected in thermal-hydraulics calculations;
• Moreover, droplets impact and steam-to-droplets convection are responsible for more than 95% of the heat
400 targeted to the droplets evaporation;
• Finally, because of the low volume fraction of droplets and the large contribution by the wall-to-steam con-
vective heat transfer, the discretization of the droplets diameters did not affect NECTAR calculations for the
heat dissipation. Nevertheless, in a simulation with high volume fraction and a higher steam temperature
23
(hence lower contribution by the wall-to-steam convection), the polydispersed distribution approach provides
405 significantly different results compared to the monodisperse diameter calculations.
The present findings are important for the improvement of computational codes by analyzing important features
to be considered in mechanistic modeling. For instance, it is intended to implement in IRSN’s code DRACCAR
the equations used in NECTAR for heat dissipation by droplets impact, which might serve as well for others like
CATHARE and TRACE. In a further work, the implementation of the diameter polydispersed distribution is also
410 desired, although this step must still be validated with more experimental data with higher droplets volume fractions.
6. Acknowledgments
This work is completed within the framework of RSNR Project PERFROI from a French State aid managed by
the French National Research Agency under the program of Investments for the Future carrying the reference n°
ANR-11-RSNR-0017.
References
[1] C.-H. Song, Some issues and challenges in advanced thermal-hydraulic safety research, Nuclear Technology
196 (3) (2016) 421-445. doi:https://doi.org/10.13182/NT16-91 .
[2] T. Glantz, T. Taurines, S. Belon, O. D. Luze, G. Guillard, F. Jacq, Draccar: A multi-physics code for
computational analysis of multi-rod ballooning, coolability and fuel relocation during loca transients. part
two: Overview of modeling capabilities for loca, Nuclear Engineering and Design 339 (2018) 202 - 214.
doi:https://doi.org/10.1016/j.nucengdes.2018.08.031.
[3] T. Glantz, T. Taurines, O. D. Luze, S. Belon, G. Guillard, F. Jacq, Draccar: A multi-physics code for
computational analysis of multi-rod ballooning, coolability and fuel relocation during loca transients. part
one: General modeling description, Nuclear Engineering and Design 339 (2018) 269 - 285. doi:https: //doi.org/10.1016/j.nucengdes.2018.06.022.
[4] Y. Jin, F. R. Beck, B. R. Lowery, D. J. Miller, F. B. Cheung, S. M. Bajorek, K. Tien, C. L. Hoxie, Experimental
study of droplet sizes across a spacer grid location under various reflood conditions, Experimental Thermal and
Fluid Science 94 (February 2017)(2018) 246-257. doi:https://doi.org/10.1016/j.expthermflusci.2018. 02.017.
[5] Z. Hozer, I. Nagy, M. Kunstar, P. Szabo, N. Ver, R. Farkas, I. Trosztel, A. Vimi, Experimental investigation of
the coolability of blocked hexagonal bundles, Nuclear Engineering and Design 317 (2017) 51 - 58. doi:https: //doi.org/10.1016/j.nucengdes.2017.03.030.
[6] P. Ruyer, N. Seiler, B. Biton, F. Lelong, F. Secondi, D. Baalbaki, M. Gradeck, Two-phase flow across a par-
tially damaged core during the reflood phase of a loca, Nuclear Engineering and Design 264 (2013) 187 - 194,
sI:NURETH-14. doi:https://doi.org/10.1016/j.nucengdes.2013.02.026.
415
420
425
430
435
24
[7] K. Kim, B. J. Kim, H. S. Choi, S. K. Moon, C. H. Song, Effect of a blockage length on the coolability during
reflood in a 2 x 2 rod bundle with a 90% partially blocked region, Nuclear Engineering and Design 312 (2017)
248-255. doi:https://doi.org/10.1016/j.nucengdes.2016.08.031.
[8] H. K. Cho, K. Y. Choi, S. Cho, C.-H. Song, Experimental observation of the droplet size change across a wet grid
440 spacer in a 6x6 rod bundle, Nuclear Engineering and Design 241 (12) (2011) 4649 - 4656, the 18th International
Conference on Nuclear Engineering (ICONE-18). doi:https://doi.org/10.1016/j.nucengdes.2011.03.042.
[9] Y. Jin, F.-B. Cheung, S. M. Bajorek, K. Tien, C. L. Hoxie, Investigation of the thermal-hydraulic non-equilibrium
in a 7x7 rod bundle during reflood, International Journal of Heat and Mass Transfer 127 (2018) 266 - 279.
doi:https://doi.org/10.1016/j.ijheatmasstransfer.2018.08.011.
445 [10] USNRC, Compendium of ECCS research for realistic LOCA analysis, NUREG-1230, Tech. rep., US Nuclear
Regulatory Commission, Washington, DC (1988).
[11] K. H. Sun, J. M. Gonzales-Santalo, C. L. Tien, Calculation of Combined Radiation and Convection Heat
Transfer in Rod Bundles Under Emergency Cooling Conditions, Journal of Heat Transfer 98 (3) (1976) 414-420.
doi:https://doi.org/10.1115/1.3450569.
450 [12] Y. Guo, K. Mishima, A non-equilibrium mechanistic heat transfer model for post-dryout dispersed flow
regime, Experimental Thermal and Fluid Science 26 (6-7) (2002) 861-869. doi:https://doi.org/10.1016/ S0894-1777(02)00195-4.
[13] M. J. Meholic, D. L. Aumiller, F. B. Cheung, A comprehensive, mechanistic heat transfer modeling package
for dispersed flow film boiling - Part 1 - Development, Nuclear Engineering and Design 291 (2015) 295-301.
455 doi:https://doi.org/10.1016/j.nucengdes.2015.07.013.
[14] Y.-J. Wang, C. Pan, A one-dimensional semi-empirical model considering transition boiling effect for dispersed
flow film boiling, Nuclear Engineering and Design 316 (2017) 99 - 111. doi:https://doi.org/10.1016/j. nucengdes.2017.03.004.
[15] H. Anglart, H. Li, G. Niewinski, Mechanistic modelling of dryout and post-dryout heat transfer, Energy 161
460 (2018) 352 - 360. doi:https://doi.org/10.1016/j.energy.2018.07.011.
[16] G. Repetto, C. Dominguez, B. Durville, S. Carnemolla, D. Campello, C. Tardif, M. Gradeck, The R&D PER-
FROI project on thermal mechanical and thermal hydraulics behaviors of a fuel rod assembly during a loss of
coolant accident, International Topical Meeting on Nuclear Reactor Thermal Hydraulics 2015, NURETH 2015
1 (2015) 1-14.
465 [17] J. D. Pena Carrillo, A. V. S. Oliveira, A. Labergue, T. Glantz, M. Gradeck, Experimental thermal hydraulics
study of the blockage ratio effect during the cooling of a vertical tube with an internal steam-droplets flow,
International Journal of Heat and Mass Transfer 140 (2019) 648 - 659. doi:https://doi.org/10.1016/j. ijheatmasstransfer.2019.06.012.
25
[18] J. D. Pena Carrillo, Etude expérimentale du transfert paroi/fluide dans le cas d’un écoulement vertical
470 vapeur/gouttes dans une geometrie tubulaire, Ph.D. thesis, Universite de Lorraine (2018).
URL https://tel.archives-ouvertes.fr/tel-01984680
[19] A. Labergue, A. Delconte, G. Castanet, F. Lemoine, Study of the droplet size effect coupled with the laser light
scattering in sprays for two-color lif thermometry measurements, Experiments in Fluids 52 (5) (2012) 1121-1132.
doi:https://doi.org/10.1007/s00348-011-1242-8.
475 [20] C. Grandjean, Coolability of blocked regions in a rod bundle after ballooning under LOCA conditions: Main
findings from a review of past experimental programmes, Nuclear Engineering and Design 237 (15) (2007) 1872
- 1886. doi:https://doi.org/10.1016/j.nucengdes.2007.02.022.
[21] R. Lee, J. Reyes, K. Almenas, Size and number density change of droplet populations above a quench front
during reflood, International Journal of Heat and Mass Transfer 27 (4) (1984) 573 - 585. doi:https://doi. org/10.1016/0017-9310(84)90030-9 .
[22] B. Oesterle, Ecoulements multiphasiques : des fondements aux methodes d’ingenierie, Lavoisier, 2006.
[23] M. Yuen, L. Chen, Heat-transfer measurements of evaporating liquid droplets, International Journal of Heat
and Mass Transfer 21 (5) (1978) 537 - 542. doi:https://doi.org/10.1016/0017-9310(78)90049-2 .
[24] V. Gnielinski, New equations for heat and mass transfer in the turbulent flow in pipes and channels, International
Chemical Engineering 16 (2) (1976) 359 - 368.
[25] K. Lee, D. J. Ryley, The evaporation of water droplets in superheated steam, Journal of Heat Transfer 90 (4)
(1968) 445 - 451. doi:https://doi.org/10.1115/1.3597540.
[26] M. Gradeck, N. Seiler, P. Ruyer, D. Maillet, Heat transfer for leidenfrost drops bouncing onto a hot surface, Ex
perimental Thermal and Fluid Science 47 (2013) 14-25. doi:https://doi.org/10.1016/j.expthermflusci. 2012.10.023.
480
485
490
[27] N. I. Kolev, Multiphase Flow Dynamics, 4th Edition, Vol. 2, Springer, Berlin, 2011.
[28] P. Ruyer, Modelisation de la polydispersion en taille : Methode des moments applique aux ecoulements adia
batiques a bulles, Technical report, IRSN (2008).
[29] C. Morel, P. Ruyer, N. Seiler, J. M. Lavieville, Comparison of several models for multi-size bubbly flows on an
495 adiabatic experiment, International Journal of Multiphase Flow 36 (1) (2010) 25 - 39. doi:https://doi.org/10.1016/j.ijmultiphaseflow.2009.09.003.
[30] C. Morel, Mathematical Modeling of Disperse Two-Phase Flows, Vol. 114, Springer International Publishing,
2015. doi:https://doi.org/10.1007/978-3-319-20104-7.
[31] M. J. Meholic, D. L. Aumiller, F. B. Cheung, A comprehensive, mechanistic heat transfer modeling package
500 for dispersed flow film boiling - part 2 - implementation and assessment, Nuclear Engineering and Design 291
(2015) 302-311. doi:https://doi.org/10.1016/j.nucengdes.2015.07.014.
26
[32] M. Pilch, C. Erdman, Use of breakup time data and velocity history data to predict the maximum size of stable
fragments for acceleration-induced breakup of a liquid drop, International Journal of Multiphase Flow 13 (6)
(1987) 741 -757. doi:https://doi.org/10.1016/0301-9322(87)90063-2 .
505 [33] W.-H. Chou, G. Faeth, Temporal properties of secondary drop breakup in the bag breakup regime, International
Journal of Multiphase Flow 24 (6) (1998) 889 - 912. doi:https://doi.org/10.1016/S0301-9322(98)00015-9 .
[34] E. Krepper, D. Lucas, T. Frank, H.-M. Prasser, P. J. Zwart, The inhomogeneous musig model for the simulation
of polydispersed flows, Nuclear Engineering and Design 238 (7) (2008) 1690 - 1702. doi:https://doi.org/10. 1016/j.nucengdes.2008.01.004.
27