Embed Size (px)
Citation preview

Mechanisms of Sill and Dyke Intrusion
Simon Alien Kattenhorn
Submitted in fulfillment of the requirements for the degree of Masters of Science
in the Department of Geology and Applied Geology
University of Natal (Durban) ,
1994

PREFACE
This thesisdocuments the researchdone by the said author,and is the author'sown original work,unlessspecifically
indicatedto the contraryin the text
i

ABSTRACT
Mechanisms of sill and dyke intrusionrequirean understanding of fracture growth,stress distributions andintensities, dilation,intrusionrates, hydraulicpressure,host-rockeffects,en echelon fracturearrays,and flowdirection. The methods of previousstudieshave been appliedto natural sill and dyke examplesof the Karoo IgneousProvince in northernNatal .
An en echelonarray of Jurassicdolerite sills occurs withinPermianEcca sedimentsalong the Mhlatuze River,westof Empangeni. Doleriteemplacementoccurredas two intrusivephases. The first phase resulted in thick,
. coarse-grained doleritesills. The secondphaseproducedrelativelythinner, fme-grained sills. The intrusion of fmegraineddolerite into older sills is demonstrated by abrupt variations in the whole-rock and mineralgeochemistryprofiles across the sills. Syn-crystallisation effects such as crystal settlingand fractionation, and post-crystallisationhydrothermal activity is also manifested in the mineralogical and geochemical changesacross the sills. The finegraineddoleriteis associated with xenolithic doleritewhichrepresents a contaminated magmapropagation frontofthe fine-grained dolerite. The higherviscosityof the xenolithic doleritehinderedpropagation, and was thus overtakenand engulfedby the main magmapulse.
Consistent sinistral offsettingof sill segments is interpretedto be the result of a fingered sill periphery intrudingan en echelonfracturearray. Dilationof individualsegments, or fingers, occurredsimultaneously. Subsequentinteraction of near-tipstressesinducedinwardly propagating curvatureof adjacentsegmentsin the array.Resultantlinkagehas produceda stepped-sill geometry; sill propagation and flow directions were orthogonal to the plane oflinkage.
The flow direction is confirmed by shapepreferred-orientations of acicularmineralgrainswithin the chilledmarginsof the sills, indicating the directionof flow to be perpendicular to the plane of the en echelonarray, andparallel to strike directionsof offset surfaces that link adjacent sill segments.
Multipledyke intrusionis examinedat an outcropof the Rooi Rand Dyke Swarm, along the Pongola River.Individual intrusive episodesare identifiable on the basis of chill-zonerelationships. The patternalong the PongolaRiver suggeststhat youngerintrusiveepisodesfrequently intrudethroughthe centresof older dykes.A threedimensional analysisof en echelondykeletsegmentsallowsa re-construction of the dilationhistory,and providesanexplanation for the development of blunt-ended intrusion segments. Mineralgeochemistry anomalies arounddyketips suggestspossiblefacilitation of incipient fracturevia decreasesin mineralstrengthsmanifested by geochemicalchanges. A statistical digital analysis of micro-phenocryst orientations within chilled dyke margins is shown toprovidea viable methodto ascertain magmaflow directions withindykes, and may thus be a useful tool for futureinvestigations. .
ii

CONTENTS
1. Introduction 1
2. Fracture Mechanics and Geological Applications 3
2.1 Introduction 3
2.2 Navier-Coulomb Criterion 3
2.3 Griffith Theory 4
2.4 Fracture Propagation 7
2.4.1 Single cracks 7
2.4.2 Multiple cracks 8
2.5 Effect of Hydraulic Pressure 9
2.6 The Stress Intensity Factor 10
2.7 Crack Modes 13
3. An Analysis of Planar Intrusions 14
3.1 Introduction 14
3.2 Propagation 14
3.2.1 Process Zone 14
3.2.2 Intrusion Parameters 16
3.2.3 Effect of Planar Discontinuities 17
3.2.4 Driving Pressure 17
3.2.5 Fluid Effects at a Propagating Tip 18
3.3 Morphology 19
3.4 Dykes 20
3.4.1 Initiation 20
3.4.2 Propagation 22
3.4.3 Rate of Intrusion 24
3.4.4 Dyke Swarms 24
iii

3.5 Sills
3.5.1 Initiation
3.5.2 Intrusive Mechanisms
3.5.3 Host Rock Effects
3.6 Stress Analysis
3.6.1 Intrusion Modes
3.6.2 Stress Conditions around Propagating Tips
3.6.3 Interference from Adjacent Intrusions
3.7 En Echelon Geometries
3.7.1 Morphology
3.7.2 Shear Failure
3.7.3 Linkage of En Echelon Cracks
3.7.4 Flow Directions
3.7.5 Paleostress Interpretation
3.8 Dilation
4. Sill Intrusion Near Empangeni
4.1 Introduction
4.2 Locality
4.3 Local Geology
4.3.1 EccaGroup
4.3.2 Dolerite Sills
4.3.3 Faulting
4.4 Dolerite Petrography
4.4.1 Coarse-grained Dolerite
4.4.2 Fine-grained Dolerite
4.4.3 Xenolithic Dolerite
4.4.4 Pyrite
4.4.5 Amygdales
4.5 Sills in the Dolerite Quarry
4.6 Flow Direction
4.7 Mechanics ofIntrusion
4.7.1 Fingered En Echelon Sills: Discussion
4.7.2 Sill Linkage
iv
25
25
27
27
28
28
29
30
32
32
33
34
35
35
36
37
37
38
38
38
41
43
44
44
45
46
48
49
49
55
61
61
64

4.8 Discussion and Intrusion Reconstruction
4.9 Application of Fracture Mechanics Equations
4.10 Dolerite Geochemistry
4.10.1 Mineral Geochemistry
4.10.2 Whole-rock Geochemical Evaluation
4.10.3 Mineral Control on Whole-rock Geochemical Variations
4.10.4 Basalt Discrimination Diagrams
4.10.5 Geochemical Evaluation Discussion
5. Dilation and Magma Flow in Dykes
5.1 Introduction
5.2 Rooi Rand Dyke Swarm
5.3 Mechanics of Multiple Dyke Intrusion
5.4 Dilation History of an En Echelon Dyke
5.4.1 En Echelon Dyke Development
5.4.2 Blunt-Ended Offset Segments: Dilation Reconstruction
5.4.3 Effect of Dilation On Host Rock Minerals
5.5 Chemical Controls on Fracture Development
5.5.1 Fracture of Plagioclase
5.5.2 Fracture of Pyroxene
5.5.3 Discussion
5.6 Dynamics of Magma Flow in a Thin Fissure
5.6.1 Introduction
5.6.2 Magma Flow Effects in a Thin Fissure
5.6.3 Flow Direction Determination from Digital Analysis
6. Discussion and Conclusions
v
66
70
73
73
80
87
89
90
92
92
92
93
96
96
99
101
102
103
104
105
105
105
106
110
114

Acknowledgements
Appendices
Appendix 1 : Symbolsand Defmitions
Appendix 2 : Petrographic Descriptions
Appendix 3: Microprobe Analyses (Empangeni Dolerites)
Appendix 4 : DykeTip MineralMicroprobe Data
Appendix 5 : VidasMacroand User Command Functions
Appendix 6 : DigitalAnalysisData
References
vi
118
120
126
135
138
140
116
149

1
1. INTRODUCTION
The Karoo Igneous Province constitutes one of the largest continental flood basalt provinces in the world
(Duncan, 1987). The lava remnants cover a surface area of approximately 140.000 km2• principally in the
Stormberg mountains of the eastern Cape Province. the Drakensberg mountains of Lesotho and Natal. the Lebombo
mountains of northern Natal. Swaziland and the eastern Transvaal. the Nuanetsi region of Zimbabwe. and the
Etendeka area of northern Namibia (Duncan, 1987). A consistent KlAr age of 193 ±5 m.y. (Fitch and Miller. 1984)
for basalt lavas marks the flood basalt event as contemporaneous with the breakup of eastern Gondwana during the
Jurassic.
Flood basalt volcanism was thus associated with a period of continent-wide crustal tension. This resulted in
large-scale fracturing of the crust and extensive dolerite dyke and sill intrusion across Southern Africa, with total
thicknesses exceeding total sediment thicknesses in some of the deeper parts of the Karoo basin (Brink. 1983).
South Africa thus hosts much potential for the study of the mechanisms by which dykes and sills form.
In this thesis, detailed studies are described for dolerite sills along the Mhlatuze River. near Empangeni, and the
Rooi Rand Dyke Swarm along the Pongola River, both sites situated in northern Natal.
An en echelon array of dolerite sills occurs within Ecca sediments along the Mhlatuze River, west of Empangeni.
Consistent offsetting of sill segments is interpreted to "be the result of a fingered sill periphery intruding an en
echelon fracture array. Dilation of individual segments, or fingers, occurred simultaneously, with later linkage that
resulted in a number of linkage-related features such as bent and rotated bridges. and a stepped-sill geometry. The
classic interpretation of propagating sills stepping upwards towards the surface is thus abandoned in the interpretation
of this sill array. Evidence provided by magma flow-induced phenocryst alignment is also presented.
The Rooi Rand Dyke Swarm outcrop along the Pongola River provides an excellent opportunity for the study of
such intrusion features. Much of the investigation of this location is focussed on the determination of age
relationships, intrusion mechanics, and to a greater extent an interpretation of magma flow direction and
characteristics. The method of digital analysis has been applied to the determination of phenocryst orientation trends.
producing successful results that give an indication of magma flow direction.

2
SWA/ NAMIBIA
Etend.lea
) Karoo lava outcrop
/' limits of Central" area-' where known
_ . . _International boundary
?., ...........
o!
Figure 1.1. Distribution of mafic lavas of the Karoo Igneous Province (after Marsh and Eales , 1984). Fieldlocations at Empangeni and Pongola in northern KwaZulu-Natal are shown.
The majority of the work in this thesis stems from previous work on the mechanics of intrusion by authors such
as Jaeger and Cook (1969), Pollard (1969, 1973, 1976, 1978, 1987), Nicholson and Pollard (1985) and
Gudmundsson (1983, 1984, 1990), amongst others. This, in turn, followed on from the breakthroughs made
throughout this century in the field of fracture mechanics by authors such as Inglis (1913), Griffith (1924), Hubbert
and Willis (1957), Irwin (1958), Murrell (1963, 1964) , Jaeger (1967) and Kanninen and Popelar (1985), amongst
others. Such has been the scale of development in the application of fracture mechanics principals to geology, that a
detailed synopsis of these developments has been deemed necessary as an important introduction to the investigation
undertaken in this thesis. The next two chapters thus deal exclusively with these developments, and provide a
detailed account of the theories pertaining to the mechanisms of igneous intrusion, and the basic principles of
fracture mechanics from which they were derived Many of the premises of these two chapters will be applied to the
field studies from northern Natal, indicating the extent of applicability and introducing methods by which existing
principles may be tried and, if necessary, contested.

32. FRACTURE MECHANICS AND GEOLOGICAL APPLICATIONS
2.1 Introduction
The mechanisms by which dykes and sills develop and propagate are best understood through basic fracture
mechanics. The mechanism of fracture initiation and growth in engineering materials may frequently be applied to
the situation of a crack in the Earth's crust, taking into account the effects of magma pressure, local and regional
stress conditions, as well as host rock properties. Kanninen and Popelar (1985) define fracture mechanics as "an
engineeringdiscipline that quantifies the conditionsunder which a load-bearingbody can fail due to the enlargement
of a dominant crack contained in that body." Developments in the field of fracture mechanics will be reviewed in
this chapter, with emphasis on the geological applicability. Appendix 1 defines the symbols and nomenclature as
well as defming principal stresses.
2.2 Navier-Coulomb Criterion
The Navier-Coulomb criterion for brittle failure considers the concept of shear failure in a material, as described
by Price (1975). A surface will undergo shear failure when the shear stress acting on the surface is sufficiently large
to overcome the cohesive strength of the material in addition to the frictional resistance to movement. The failure
criterion may beexpressedas
't = S + /-liO'n (2.1)
where 't is the shear stress acting on the shear surface, S is the cohesive strength, lJ.i is the coefficient of internal
friction, and O'n is the stress acting normal to the surface.
Robson and Barr (1964) used the Navier-Coulomb criterion to generate a graph of O'lc versus 0'3c' showing
regions of tensile failure, shear failure and no failure (Figure 2.1). The criterion for shear failure versus tensile
failure is that O'lc= 2.169 TO (line 1 in Figure 2.1) where TO is the uniaxial tensile strength of the material.
A useful application of the Navier-Coulomb criterion is the prediction of the angle T that a shear plane will have
with respect to the maximum principal stress (Price and Cosgrove, 1990)
2e= 900 - 4>i (2.2)
where 4>i is the slope of the Mohr failure envelope. The Navier-Coulomb criterion provides some fundamental
relationships between failure and stress conditions within a material; however, there are certain irregularities in its
geological applications, as mentioned by Roberts (1970). As mean stress (O'lc + 0'3c)/2 increases with depth, the

4stress difference (ale - a3c) required for shear failure becomes very large. Furthermore, TO has a value of0.5 kbar or
less , thus restricting tensile failure to the uppermost parts of the crust. This is contrary to the fact that known
dilational intrusions extend down to an upper mantle source. These discrepancies resulted in the need for a different
approach to the concept of fracture in a solid. Such was the Griffith Theory of crack propagation.
No failure
Tensilefailure
1I
Shear failure
Figure 2.1. A (j1c versus (j3c diagram representing failure criteria based on the Navier-Coulomb criterion ofbrittle fracture. Here , (j1c is the maximum'compressive principal stress, and (j3c'is the minimum compressive
principal stress (from Robson and Barr , 1964).
2.3 Griffith Theory
The Griffith Theory of crack propagation differs from the Navier-Coulomb criterion in that the solution for the
state of stress in a material takes into account the effect of cracks and microscopic flaws. Inglis (1913) considered an
elastic plate containing an elliptical hole with major axis 2a and minor axis 2b (Figure 2.2A). Assuming a uniform
uniaxial regional tensile stress a r 1 acts in the plane of the plate at right angles to the major axis, and far from the
hole, Inglis (1913) noted that a tensile stress acts at the point A (Figure 2.2A) at the tip of the elliptical hole. If the
hole is not near the edge of the plate, and the material is not strained beyond its elastic limit, the value of this locala
tensile stress a 11 is
(2.3)

A
I~
~
b
B
5
.L
Figure 2.2. A: An ellipticaljlaw in an elastic plate, according to the elastic model of lnglis (1913). The regionaluniaxial tensile strength cl'1 produces a local tensile stress (jl a1 at the jlaw tip (A). Dimensions of the flaw aremajor axis 2a and minor axis 2b. B: Stress conditions around a crack in an elastic plate. The crack tip has radiusofcurvature p (from Pollard, 1987).
Inglis (1913) further indicated that the stress at the tip of any slender hole (Figure 2.2B) may be approximated by
the relation
(2.4)
where p is the radius of curvature at the end of the hole. For the crack to begin propagating, the tensile strength Ta
of the material must equal the stress at the crack tip, crIal. At this point, therefore, the regional stress loading the
plate would be
(2.5)
Griffith (1924) adopted a similar approach to Inglis, but with emphasis on energy considerations. From atomic
bonding theory, the theoretical tensile strength of an ideal brittle solid is T ... EIIO, where E is Young's modulus.
The vast discrepancy between theoretical and observed material tensile strengths was ascribed by Griffith (1924) to
intense local stress concentrations at the tips of microscopic elliptical flaws. Solution of the stress concentration
around an elliptical crack set in a two-dimensional, thin plate subject to a tensile stress aT (Figure 2.3A) suggests
that crack propagation development occurs when the tensile stress at the tip equals the atomic bonding strength.

6
This occurs when
(1T= [2AEhra] 1/2 (2.6)
where A is the surface energy of the flaw and 2a is the length of the major axis of the elliptical flaw. Griffith (1924)
obtained values for the critical stress (sT) which were in good agreement with measured tensile strength values for
large specimens of glass. The propagation of flaws in a plate subject to biaxial compression was also considered
(Figure 2.3B). .
Local tensilestress zone
Local tensile " "stress zone ~ ~:, ,
,'~\• I
, I- ~
A
r or
Appliedtensilestress
//
B
,
'''~' r"I I, ,..... _,
°lc
//
Figure 2.3. "Griffith" elliptical flaws under conditions of A: uniaxiai tensile stress (aT) and B: biaxial
compressive stress (Price and Cosgrove, 1990).
Griffith (1924) assumed that randomly oriented. elliptical microflaws were spaced on the plate in such a manner
that the stress field associated with each flaw was independent of that of any neighbouring flaw. It was shown for a
fracture oriented oblique to the applied stresses that there exists a tensile zone at the tip having a maximum when
(2.7)
where e is the angle between the long axis of the flaw and the minimum principal tensile stress. (13. Furthermore.
provided that (11 * (13 and (3(11 + (13) < O. the tensile stress at the tip reaches the critical value Ofpropagation
initiation when
(2.8)
where T is the tensile strength. and (11 and (13 are positive when the stresses are tensile (Griffith, 1924). Equation

7
(2.8) indicates a non-linear relationship between the stresses, and can be expressed as a Mohr envelope (Murrell,
1958) with the equation
(2.9)
2.4 Fracture Propagation
2.4.1 Single cracks
Griffith (1924) considered fracture propagation in terms of energy conservation, with emphasis on fracture surface
energies. For the situation of an elliptical hole in an elastic plate subject to a uniform tension (Figure 2.2A), the
strain energy of the elastic solid, UE, is
(2.10)
where J.1 is the elastic shear modulus and v is Poisson's ratio. The potential energy of the crack surface, US, may be
related to the surface energy per unit area y by
Us =4a y (2.11)
where 2a is the length of the crack surface. In order for there to be a total conservation of energy, the increase in
surface energy of a growing crack must beaccompanied by a net decrease in the potential energy of the loading device
and the elastic solid. Griffith (1924) thus calculated the remote stress loading the plate to be
[4 ]1/2crT _ 'YJ.1
1 - 1ta(I- u)(2.12)
in order for fracture propagation to commence. A fracture may propagate under conditions of tension or
compression. Where tension is the dominant force, the fracture lengthens in a plane perpendicular to the tensile
stress (Price, 1975). Under compression, however, a fracture will only propagate along the regions of maximum
tensile stress, such as those illustrated in Figure 2.3B. Brace and Bombolakis (1963) simulated Griffith crack -*,--behaviour, using an elliptical hole cut into a sheet of photoelastic material, and revealed that fractures propagate
along a curved trajectory. Experiments on glass showed the fractures curving into parallelism with the direction of
principal compression before ceasing to propagate.
Ingraffea and Ko (1981), working on fracture parameters for rock, considered cracks oriented with their long axes

8at an angle e to the maximum compressive stress alc' as in Figure 2.3B. It was found that the cracks behave
like elliptical holes for e~ 450 • when fracture propagation initiation occurs near the ellipse tip. For e> 450 • the
cracks are a poorer approximation to an ellipse. and in extensively microflawed material such as rock, the area over
which the tensile stress concentration acts increases rapidly with T. At the same time, however, the stress gradient
within this widening region undergoes a significant decrease. Under such conditions, failure tends to becontrolled by
slight local material weaknesses such as grain boundaries or intracrystalline defects.
2,4.2 Multiple cracks
For an elastic solid containing a number of cracks, certain approximations can be made to explain macro-failure.
Griffith (1924) showed that each crack can beconsidered to be isolated from its nearest neighbour (Figure 2.4).
Griffith (1924) showed that if a r1 and ar3 satisfy the conditions 3ar1 + ar3 > 0 (where a r1 and ar3 are positive
when the stresses are tensile) , then the critical crack will be perpendicular to a r1. The tip will be under greatest
tension, with a magnitude given by equation 2.3. If, however, 3ar1 + ar3 < 0, the critical crack will be oblique to
ar1.
r
t t CY) t~
<, x I \I 2 I -.<,
\ /-/
\r
'Xl \ crI-~ / /' -.
/ ,/ \\-,
\ "- / -,~ --- / - / -..
t ,~
Figure 2.4. The Griffith model for an elastic solid containing a number of non-interacting cracks . Themaximum tensile stress is a'"1 and the minimum tensile stress is a'"3 (from Pollard. 1987).
Stresses at the point of rupture can be expressed in terms of the uniaxial tensile strength, Tu, of the material.
because at the point of rupture, a r1 = Tu ' Adapting (2.4), the local stress at the crack tip at the initiation of
propagation is then (Pollard, 1987):

9
(2.13)
(compareto equation 2.4). It must be noted that Tu is a bulk property of the material undergoingrupture, whereas
the term Ta as used in equation 2.5, is a local property of the material at the crack tip. In summary, the two
conditions of failureare thusgoverned by the criteria
or 1=Tu
(or1 _Or3)2 + 8Tu (or1+ or3) = 0
for 30r1 + or3 > 0
for 30r1 + or3 < 0
(2.14a)
(2.14b)
Equation2.14b follows from equation2.8. The abovecriteriaare convenientin that they obviate the need for the
crackdimensions.
2.5 Effect of Hydraulic Pressure
Thus far, all hypothetical loading stresses proposed in the formulation of the fracture propagationcriteria have
been consideredas being tensile, with arias the maximum tensile stress. Other authors (eg. Roering, 1968; Lajtai,
1969;Hancock, 1972)have foundpreferencewith the use of compressive regional stresses (olc maximum and 03c
minimum) to demonstrate the mechanisms of fracture propagation in the geological context. This is acceptable
considering the fact that any sub-surface fracture within the crust wouldordinarily be subject to conditions of tri-axial *'compression, rather than tension. In the context of this investigation, which will be dealing with features such as
igneousdykes and sills, it must, however, be remembered that the fractures involved would be subject to the added
effect of an internal hydrostatic, or perhaps magmatic, pressure. This would lead to an overall state of localised
tension aroundsucha fracture.
The conceptof "effective stress"was introduced by Anderson (1938). In order to take into accountthe hydrostatic
pressureP, actingon the internalboundaries of a dilating fracture, Andersonexpressedthe resultantstress conditions
acting on the externalboundariesof the fracture as Ox - P (wherea is compressive and x =1,2 or 3). Prior to this,
Stevens (1911) recognisedthe need to take internal magma pressure P into account when consideringan intruding
dyke. This would entail replacing or 1 with (P - Sh), termed the driving pressure, in equation 2.5, where Sh is the
regional minimum compressivestress (Le. Sh =-or1)' The same applies to equation 2.12, except that the relevant
elastic moduli would be those applicable to a volume of the Earth's crust with dimensions several times the dyke
length.
Roberts (1970) adopted the Griffith theory approach, as treated by Ode (1960) and Jaeger (1962, 1967), which
correctedfor the use of effective stresses. A 0lc versus03c plot (Figure2.5) shows that the zone of tensile failure
of a rock is much larger than that predictedby the Navier-Coulomb theory (Figure2.1).
10
failure
Figure 2.5. A (11 c versus (13c diagram representing failure criteria based on the Griffith theory of brittlefailure . modified by Roberts (1970). As with Figure 2.2. (11 c is the maximum compressive principal stress. and(13c is the minimum compressive principal stress.
The method of revising the Griffith Theory to take hydrostatic pressure P into account was promoted by Murrell
(1963. 1964) and has been termed the Griffith-Murrell theory of fracture (Roberts, 1970). The revised criterion for
tensile failure versus shear failure is thus 3crlc + cr3c =4P. Furthermore, magma will only intrude into an
extending crack if the internal hydrostatic pressure P is greater than the component of compressive stress normal to::Y:·
the crack. This theory allows brittle failure to occur in the region of no failure (Figure 2.5) if the internal pressure is
sufficiently large. The internal pressure must, however, exceed the normal stress by an amount equal to the uniaxial
tensile strength Tu (Roberts, 1970). This model allows failure to occur to much greater depths than the Navier-
Coulomb criteria of Robson and Barr (1964), and is thus directly applicable to situations such as dyke swarms that
extend down to a mantle source.
Jaeger and Cook (1969) adapted the criteria of (2.14) to include the effect of magma pressure P in an extending
crack. The value of P is added to the remote principal stresses crr1 and crr3 in the equations of (2.14).
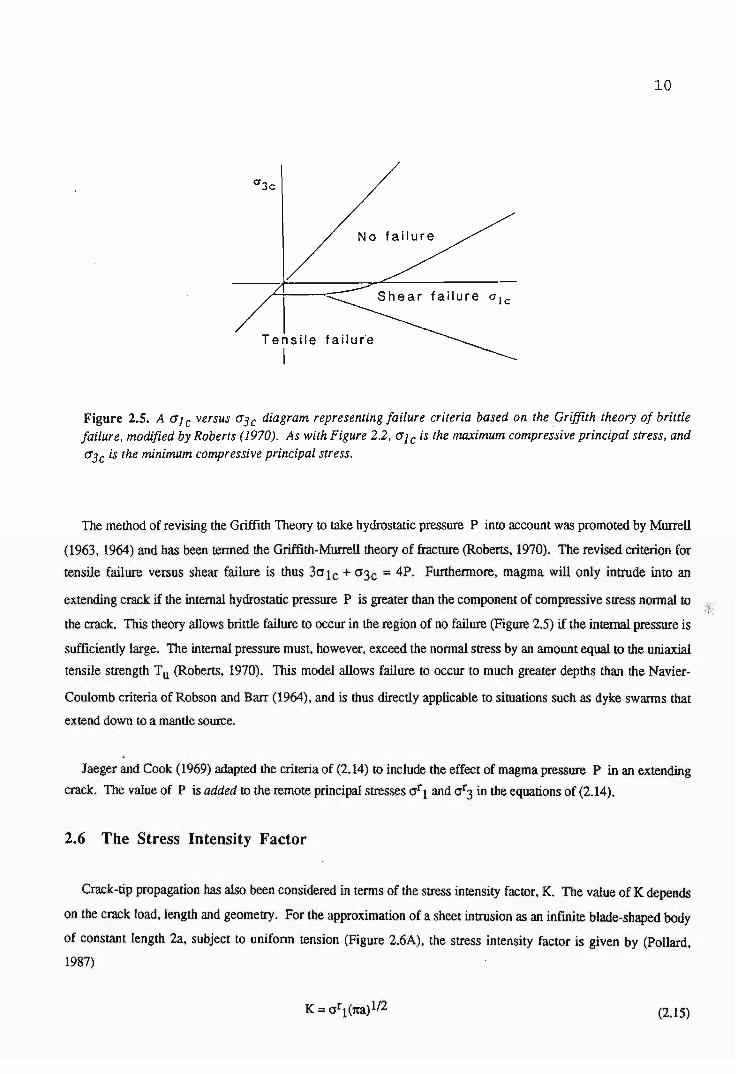
2.6 The Stress Intensity Factor
Crack-tip propagation has also been considered in terms of the stress intensity factor, K. The value of K depends
on the crack load, length and geometry. For the approximation of a sheet intrusion as an infmite blade-shaped body
of constant length 2a, subject to uniform tension (Figure 2.6A), the stress intensity factor is given by (Pollard,
1987)
(2.15)

11
Similarly, for the approximation of a penny-shaped crack of diameter2a (Figure 2.6B), the stress intensity factor
becomes(2.16)
The sphereof influence. K, around the crack tip is termedthe K-dominant region (Figure2.7).
A B+- X --+ +- X -+-1 1r r
0"1 /X 3 ~ /X 3
+-T
-+ +- T -+-
a aX I Xl 11+- .!. +-
blade shape,uniform drh'!ng
pressure
penny shape,uniform drl·tlng
pressure
Figure 2.6. Idealized crack geometries as (A) a blade-shape with constant length 2a, and (B) a penny-shape withdiameter 2a (from Pollard, 1987).

12
Figure 2.7. The K-dominant region, r, (R < r < D) around the tip of a crack of length 2a. The region where r<R is dominated by inelastic processes, and is termed the process zone (Pollard, 1987).
Crack propagation correlates with the stress intensity factor reaching a critical value Kc, called the fracture
toughness. Kc is a property of the material dependent upon parameters such as loading rate, temperature, pressure,
and chemical environment (Pollard, 1987). Via the process of stress corrosion, slow crack growth may occur for
values of the stress intensity factor less than Kc (Spence and Turcotte, 1985), however, generally crack propagation
willonly commence once the applied tension has reached
(2.17)
As before, (P - Sh) may be substituted for a r1 in the case of a magma-filled crack. Comparing with previous
discussion, the form of (2.17) is not far different from Irwin's (1913) relation in terms of tensile strength (equation
2.5), or Griffith 's (1924) energy balance considerations (equation 2.12). Clifton et al. (1976) have determined the
fracture toughness values for a number of sedimentary rocks, such as sandstone (Kc = 0.57-1.46 MN m-3/2),
siltstone (Kc =1.04-1.37 MN m-3/2) and shale (Kc =0.87-1.29 MN m-3/2). Changes in Kc values as a result of
pressure changes are documented for Indiana limestone by Schmidt and Huddle (1977).
Spence and Turcotte (1985) investigate crack propagation as applied to magma-filled cracks. Assuming a high
viscosity magma being injected at a rate sufficiently slow such that the flow is laminar, if the intruded medium is
brittle (Kc « 1), the propagation of the fracture is limited by the viscosity of the magma and not the fracture1\~
toughness of the medium. If, therefore, magma is being injected into a pre-existing crack or joint, the fracture
toughness may be approximated as being zero, and the dynamics of the system is a function of the magma viscosity.

13
2.7 Crack Modes
Cracks may be categorized into three types or modes, according to the relative displacement of opposing crack
faces (Irwin, 1958). As demonstrated in Figure 2.8, mode I cracks involve only an opening displacement in the XI
direction, perpendicular to the long axis of the crack; effectively a case of pure shear. Mode II cracks undergo a
relative shear displacement perpendicular to the crack periphery, in the x2 direction. Mode ill cracks include an x3
relative shear displacement, parallel to the crack periphery. This classification is relevant because each mode has
associated with it a characteristic stress field in the K-dominant region, thus resulting in morphologically different
propagation mechanisms and features for each mode.
\periphery
Figure 2.8. Modes of crack propagation in relation to the relative displacement of opposing crack faces. Puremode I opening displacements involve no relative shear motion . Relative shear displacements are perpendicular tothe crack periphery for mode Il cracks. and parallel to the periphery for mode /ll cracks (Pollard. 1987).

143. AN ANALYSIS OF PLANAR INTRUSIONS
3.1 Introduction
Chapter 2 considered the genesis and development of fractures in brittle rock. As the fractures open, they may
serve as conduits for hydrothermal or magmatic fluids. Planar magmatic ("sheet") intrusions in the lithosphere occur
as dykes and sills. Dykes are frequently steeply inclined to vertical and are usually discordant with the intruded host
material. For instance, in sedimentary rocks, dykes cut across the sedimentary bedding planes and enclosed
sedimentary units. Sills are the compliment of dykes in that they are concordant sheet intrusions, frequently
horizontal in undeformed host rocks . Dykes may act as feeders for sills at correspondingly higher crustallevels.
Other hypabyssal intrusion features include pipes, phacoliths, laccoliths, lopoliths and diapirs (eg. Price and
Cosgrove, 1990); however, this review will relate specifically to dykes and sills.
Examination of sheet intrusions is important as it allows inferences to be made regarding the state of stress at the
time of intrusion. This chapter will approach the implications of this. as well as elucidating the mechanisms of
intrusion, propagation and dilation, and the resultant features.
3.2 Propagation
3.2.1 Process Zone
Fracture propagation initiation has been examined in Chapter 2 in terms of the interplay between local and
regional stresses, and other factors such as material tensile strengths, fracture toughness, and internal magma
pressures. The K-dominant region and process zone were illustrated (Figure 2.5) and the mathematical formulae
applicable to fracture propagation in the process zone were presented.
The inelastic process zone is the circular region about the tip of a propagating sheet intrusion within which
small-scale fracturing of the host rock occurs in accordance with the stress configuration about the tip. The size of
the process zone depends upon the grain-scale structure of the host rock (Peck et al., 1985b), although the radius R
may beapproximated by (Pollard. 1987)
[ ]
2R-~ (P-S)
- 2 (Tu +S) (3.1)
where P is the internal magma pressure, S is the regional compressive stress acting perpendicular to the intrusion,
Tu is the tensile strength of the rock, and a is the half-length of the intrusion. From equation (3.1) it can be seen
that the lengthening of a sheet intrusion results in a larger process zone. Conversely, longer sheet intrusions
produce failure zones for smaller values of magma pressure and/or differences in remote stresses than shorter

15
intrusions (Rogers and Bird, 1987).
Poll~d (1987) documents the various mechanisms that operate within the process zone of a dyke (Figure 3.1).
These include dyke-parallel jointing, conjugate faulting along shear surfaces, and opening and sliding along planar
discontinuities such as bedding planes.
Figure 3.1. Fracture mechanisms within the process zone. Features produced include dyke-parallel fracturing,conjugate faulting along shear surfaces , and opening and sliding along planar mechanical discontinuities such asbedding planes (Pollard, 1987).
The production of dyke-parallel fractures about the tip is manifested in the region of the process zone subject to
tension, and is thus termed extension fracturing (Pollard. 1973). Apart from the extension of the main, magma-filled
fracture, dyke-parallel microfractures also form on either side of the central axis (Figure 3.2). This may occur in
such a way so as to produce a conjugate-patterned set of dyke-parallel fractures on either side of the main fracture.
The dyke-parallel fractures are concentrated close to the tip of the intrusion, decreasing in concentration and
increasing in separation further away from the main fracture. As the main fracture extends, the microfractures
become juxtaposed against the intrusion as dyke-parallel joints (eg. Delaney et al., 1986: Ransome, 1991).

16
processzone
,Conjugate fault development along shear surfaces ahead of the tip, or
brittle faulting (Pollard, 1973), occurs at about 30° to the minimum
tensile stress, ar3' and in regions of moderate confining pressure (4
-Skrn depth). Intrusion of magma along these shear surfaces would
ordinarily not occur, but is possible for sufficiently high magma1- ....
Figure 3.2. Production of dyke-parallel fractures in the process zone.For increasing distances away from the main fracture. the fracturesdecrease in number and become more widely spaced. As the mainfracture extends. the fractures remain alongside the intrusion as dykeparallel joints (Pollard. 1987).
pressures (Roberts, 1970).
Sheet intrusion propagation is greatly facilitated by microfracture development in the process zone, as it allows
extension to occur for very small values of (P - S). Propagation is inhibited by decreasing magma pressure, which
may be caused by a deficient supply, crystallisation, viscous drag, or rheological variations (Pollard, 1973, 1987).
3.2.2 Intrusion Parameters
The emplacement of sheet intrusions is heavily dependent upon the regional stress configuration. Magma-filled
fractures, and thus the associated process zone microfractures, are oriented in a plane perpendicular to the maximum
regional tensile stress. Variability in the state of stress across a region being intruded would, therefore, result in a
concomitant variation in the attitude of the resultant dykes or sills (Pollard, 1987). If the maximum tensile stress is
only fractionally greater than one or both other stresses, the orientation of the intrusion will be less specifically
defined by the regional state of stress.
An exception to the above conditions may arise when magma intrudes a pre-existing fracture. If the fracture is
not oriented perpendicular to the least compressive regional stress direction, then dilation will only occur if the
magma pressure exceeds the normal compressive stress resolved on the fracture plane (Pollard, 1987). The
probability of a pre-existing fracture being intruded may be deduced from Figure 3.3, which plots the stress intensity
ratio Rsi versus the angle a between the least compressive regional stress Sh (_or1 =Sh) and the normal to the
fracture. The stress intensity ratio is given by Delaney et al. (1986) as
(3.2)
where SH is the compressive stress orthogonal to Sh in two dimensions (see Figure 3.3), and Pm is the internal
magma pressure after dilation. When applied to dyke emplacement, SH is the maximum compressive regional
stress, ale (where ale =-or3).
'2m Jams of."'v aiontalic;, can be dikSed
17
E~uf+ •
Irem
-, :~
~; Joirt:J <,X2
~: SH
-2 ~~:~~i!;~~~~t~..:...:.:.:::.:.: ....-80 o
Angle a • degrees
eo
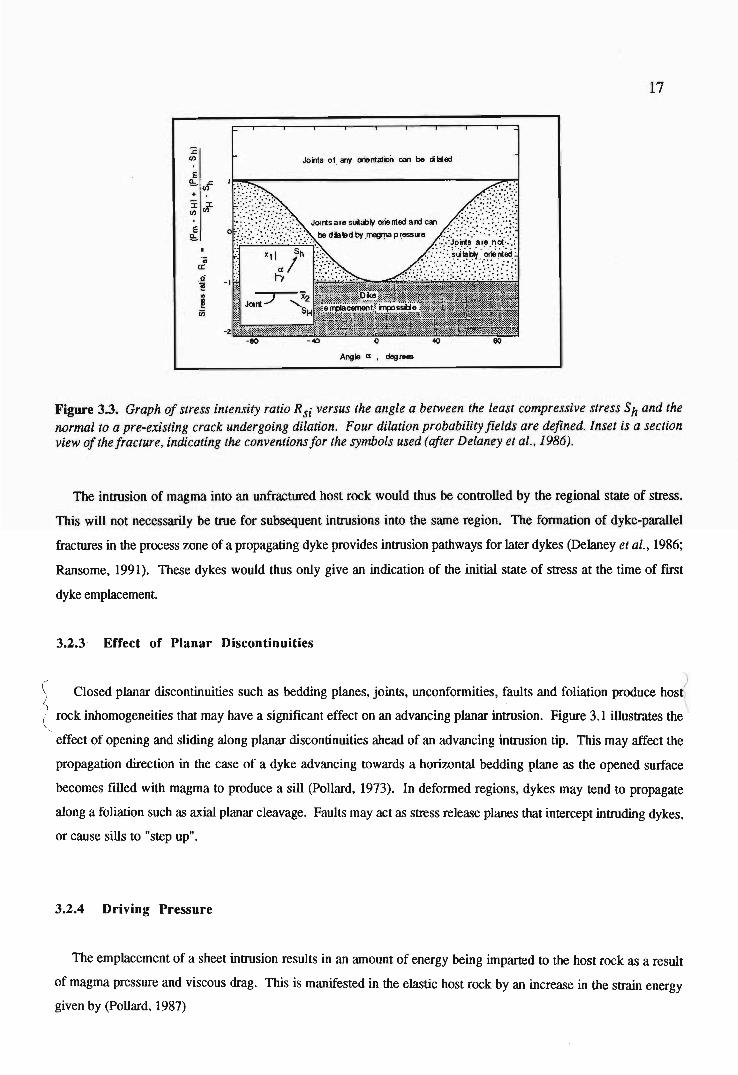
Figure 3.3. Graphof stress intensityratio Rsi versus the angle a between the least compressive stress Sh and thenormal to a pre-existing crack undergoing dilation. Four dilation probability fields are defined. Inset is a sectionviewof thefracture. indicating the conventions for the symbols used(after Delaney et al.•1986).
The intrusion of magma into an unfractured host rock would thus be controlled by the regional state of stress.
This will not necessarily be true for subsequent intrusions into the same region. The formation of dyke-parallel
fractures in the process zone of a propagating dyke provides intrusion pathways for later dykes (Delaney et al., 1986;
Ransome, 1991). These dykes would thus only give an indication of the initial state of stress at the time of first
dyke emplacement
3.2.3 Effect of Planar Discontinuities
) Closed planar discontinuities such as bedding planes, joints, unconformities , faults and foliation produce host{
( rock inhomogeneities that may have a significant effect on an advancing planar intrusion. Figure 3.1 illustrates the '.
effect of opening and sliding along planar discontinuities ahead of an advancing intrusion tip. This may affect the
propagation direction in the case of a dyke advancing towards a horizontal bedding plane as the opened surface
becomes filled with magma to produce a sill (Pollard, 1973). In deformed regions, dykes may tend to propagate
along a foliation such as axial planar cleavage. Faults may act as stress release planes that intercept intruding dykes,
or cause sills to "step up".
3.2.4 Driving Pressure
The emplacement of a sheet intrusion results in an amount of energy being imparted to the host rock as a result
of magma pressure and viscous drag. This is manifested in the elastic host rock by an increase in the strain energy
given by (Pollard, 1987)

2 2[I-U]UE =n:a (P-S) 2~
18
(3.3)
where (P - S) is termed the driving pressure, as introduced in section 2.5. It can be observed that equation (3.3) is
equivalent to (2.10), regarding Griffith's (1924) examination of an elastic plate containing a slender hole, but with
the maximum regional tensile strength arl replaced by the driving pressure. Numerical solutions for (3.3) may be
obtained using the approximation (Pollard, 1987)
! = --,-(P_-_S"",-)I ~/(1- o)
(3.4)
where t/l is the thickness-to-length ratio of the sheet intrusion, and w(1-u) is termed the host rock stiffness. The
length 1 is the equivalent of the long axis dimension 2a (section 2.3) . Knowing the elas tic shear modulus J.L and
Poisson's ratio u, (P - S) may be approximated by (3.4) and then substituted into (3.3) to calculate the strain energy
imparted to the host rock.
The driving pressure should not be confused with the injection pressure, which is that part of the internal pressure
ofa magma required to overcome viscosity effects (Bradley, 1965).
3.2.5. Fluid Effects at a Propagating Tip
Thus far, fracture propagation and magma intrusion has been surveyed in terms of energy, stress and pressure
considerations. Another parameter which should be taken into account is the presence of fluids around the tip of a
propagating sheet intrusion. The manner in which these fluids occur is two-fold: either within the extension
fracture ahead of the magma, or as pore fluids within the host rock that is being intruded.
The presence of a low-viscosity, high-velocity volatile phase associated with an intruding magma, may advance
in the extension fracture ahead of the magma (Bradley, 1965; Currie and Ferguson, 1970; Pollard, 1973). This fluid
may serve to increase the local pore pressure in the host rock surrounding the tip (Hubbert and Willis, 1957), which
in turn, may decrease the fracture toughness.
( The transfer of heat into a relatively cold rock hosting a mafic intrusion would result in a local thennoelastic1( change in the host rock stress. A consequent pore fluid expansion produces an ,elevated pore pressure at a rate )
sufficient to influence the factors governing host rock fracture (Delaney, 1982; Delaney et al.; 1986). Rogers and
Bird (1987) ascribe the presence of interstitial pore fluids to a concomitant increase in the size of the process zone
around the intrusion tip.
An additional fluid effect is the impact that the fluid may have on the chemical environment surrounding the tip.

19Weakening of the host rock via chemical alteration may play an important role in the mechanism by which an
intrusion propagates.
3.3 Morphology
Measurements of thickness tl at various distances 11 from the termination of a sheet intrusion exposed in
cross-section indicate that most sheet intrusions approximate to an elliptical shape. This elliptical model is defined
by the relation (Pollard, 1973)
[2]V2t: =2 l~ -C~ ) (3.5)
where t and 1 are the true thickness and length respectively, as shown in Figure 3.4. The ellipticity of sheet
intrusions in cross-section has been frequently documented (eg. Pollard et al., 1975; Pollard, 1976; Pollard and
Muller, 1976; Ransome, 1991) and is accurate along the entire length Ip of the intrusion in the third dimension as
long as Ip > 21(Pollard, 1976).
.8
tt .6~
t
.2
o .1 .2 .5
Figure 3.4. Elliptical model of a sheet intrusion in cross-section. Contacts with an elliptical form will plot onor near the curved line defined in equation 35. Values of t1 and 11 are measured away from the tip of the intrusion(Pollard. 1973).
A simple mathematical formulation of open fracture ellipticity may be obtained in a paper by Gudmundsson
(1983).
Deviations from ellipticity may be induced where gradients in internal magma pressure or regional stress exist
(Pollard, 1976). Intrusions may thus be produced with unusual shapes such as dumbbell, diamond, tear-drop or
forms with greater lateral heterogeneity. These result from the intrusion being thinner in regions where there is less
internal pressure or alternatively, a greater external stress. Variations would also be produced by changes in host
rock ductility along the length of the intrusion (Pollard and Muller, 1976). Logically, the greater the length-to-

20thickness ratio of a sheet intrusion, the greater the likelihood of a deviation from the elliptical model that would be
expectedto occur.
Smaller-scale features of sheet intrusion that occur as irregularities to the smoothness of the contacts include
steps, horns, bridges, buds.fingers and cusps (Figure 3.5). Steps occur obliquely or perpendicular to the principal
plane of the contacts and result from the coalescence of slightly out-of-planeadjacent intrusions. Steps may also be
termed offsets (Bussell, 1989). Horns are thin off-shoots of the intrusion that protrude into the host rock along the
outside edges of offsets, and are also termedflanges or apophyses.
I \fingers
horn
I
cusp
brid
Figure 3.5. Small-scale features ofplanar intrusions as described in the text.
Bridges are blocks of host rock protruding into an intrusion at points of offsetting. On occasion, the bridges
may be detachedfrom the host rock. Buds are localized widenedportionsof sheet intrusions that form by brecciation
and stoping of the host rock (Delaneyand Pollard, 1981)and may serve to locally channelize magma flow. Fingers
(or segments) are isolated planar intrusions that occur in groups of two or more, either along a common plane or
slightly offset from each other. Cusps mark positions where adjacentfingers have coalesced in the same plane, and
may be associatedwith wedgesof deformed host rock (Pollardet al., 1975).
3.4 Dykes
3.4.1 Initiation
The inception of a dyke propagating vertically away from a crustal primary magma chamber is dictated by the
interplay between the internal magma pressure and the verticalstress. In Figure 3.6, a dyke containing magma with

21density Pm is being intrudedvertically into crustal rocks with an averagedensity Pr. AdaptingPrice and Cosgrove's
(1990) evaluation of such a condition, in order for the dyke to begin propagating, the magma pressure at depth zm
must at least equal the verticalstress 0z' where zm =zl + z2. This equates to the statement that at depth zm,
(3.10)
(where Pm is the magmatic pressure in the primary magma chamber) thus predicting a near isotropic state of stress
at depth zm'
Figure 3.6. Definition of symbols used in text to predict theconditions ofdyke emplacement in the crust(Price and Cosgrove,1990).
When the dyke has reached the pointA (depth zl), the magma
pressure PA at the top of the intrusion is given by
fz,
pr
(3.11)
...-Dyke
assuming the magma is at rest. The vertical stress at point A is
Oz =Prgzl' The excess of magmatic pressure over geostatic
pressure (in other words, the driving pressure) at point A is thus
(3.12)
This is known as the buoyancy equation and demonstrates the importance of relative densities insofar as magma
intrusionis concerned. Intrusion will be greatly inhibitedwhere the densitydifference betweenmagmaand host rock
is small, and is unlikely when Pr < Pm'
The applicability of (3.12) is limited to the condition of an immobile intrusion. While the magma is still
flowing, viscousdrag against the conduit walls must be overcome. A certain amountof the magmaticpressure must
therefore be utilised to counteractviscosity effects (Le. injection pressure). Equation (3.12) thus overestimates the
excess magmatic pressure to some extent Limitationsare also provided by the onset of crystallisation,as this will
inducedensityand viscosity variations.
When both sides of the buoyancy equation equate to zero, dyke propagation ceases until a driving pressure is re
established. Alternatively, depending on the stress configuration, dyke emplacement may give way to sill
production.

22If PA» O'z, brecciation and stoping of the country rock may occur via hydraulic fracturing. The necessary
condition would be
(3.13)
where O'x is the least compressive horizontal stress, and Tu is the tensile strength of the host rock. This is,
however, only true for the condition where O'z - O'x < 4Tu (after Price and Cosgrove, 1990). If O'z - O'x > 4Tu, shear
failure will occur, with the possibility of inclined dyke formation.
Estimates of driving pressure for specific dykes may be made from a measurement of the width to length ratio
(along a horizontal cross-section), the Young's modulus E and Poisson's ratio V of the host rock, using the relation
(Gudmundsson, 1983, 1990)
W E(P-S)=- ( 2)
L 21-u(3.14)
where (P - S) is the driving pressure (or overpressure) of the magma, and W/L is the dyke width to length ratio,
equivalent to t/l in (3.4).
It must be assumed that dyke intrusion into a region under lateral compression is feasible provided that the
internal magmatic pressure is suitably large (Roberts, 1970). .
3.4.2 Propagation
The principal aspects of sheet intrusion propagation are described in section 3.2. There are further particular
mechanisms concerning dyke propagation.
Field observations suggest that dykes are thinnest where their number is greatest (Gudmundsson, 1990).
Presumably, this suggests that dyke thicknesses decrease as the source is approached. This assumption is adequate as
increasing confining pressure with greater depth would necessitate a propensity for vertical propagation rather than
increasing dilation. Predominantly vertical flow directions would thus be expected in close proximity to a primary
source at depth.
Dykes probably become thicker and longer as higher crustal levels are approached. A region under effective
tension may exhibit a more rapid decrease in both vertical and horizontal least tensile stress than occurs in the
maximum horizontal regional tensile stress. This, coupled with an associated decrease in vertical magma pressures,
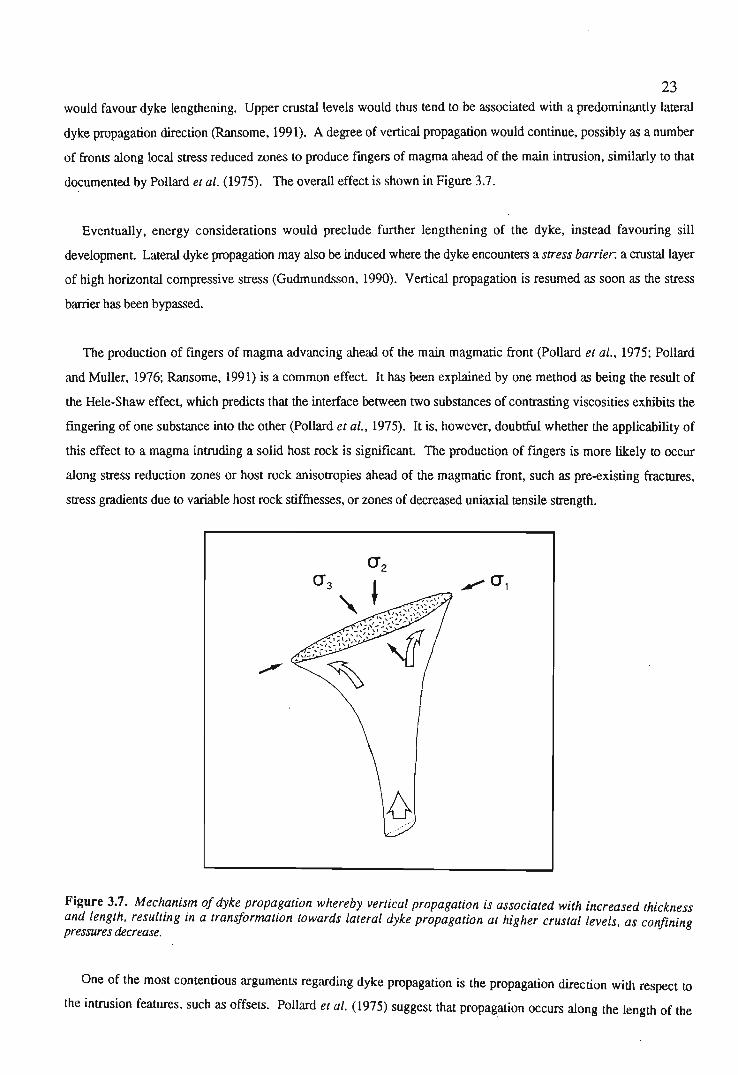
23would favour dyke lengthening. Upper crustallevels would thus tend to be associated with a predominantly lateral
dyke propagation direction (Ransome, 1991). A degree of vertical propagation would continue, possibly as a number
of fronts along local stress reduced zones to produce fmgers of magma ahead of the main intrusion. similarly to that
documented by Pollard et al. (1975). The overall effect is shown in Figure 3.7.
Eventually. energy considerations would preclude further lengthening of the dyke , instead favouring sill
development. Lateral dyke propagation may also be induced where the dyke encounters a stress barrier. a crustallayer
of high horizontal compressive stress (Gudmundsson , 1990). Vertical propagation is resumed as soon as the stress
barrier has been bypassed.
The production of fingers of magma advancing ahead of the main magmatic front (Pollard et al., 1975; Pollard
and Muller. 1976; Ransome, 1991) is a common effect. It has been explained by one method as being the result of
the Hele-Shaw effect, which predicts that the interface between two substances of contrasting viscosities exhibits the
fingering of one substance into the other (Pollard et al.• 1975). It is. however. doubtful whether the applicability of
this effect to a magma intruding a solid host rock is significant. The production of fmgers is more likely to occur
along stress reduction zones or host rock anisotropies ahead of the magmatic front, such as pre-existing fractures .
stress gradients due to variable host rock stiffnesses, or zones of decreased uniaxial tensile strength.
.".,,0',
Figure 3.7. Mechanism of dyke propagation whereby vertical propagation is associated with increased thicknessand length. resulting in a transformation towards lateral dyke propagation at higher crustal levels. as confiningpressuresdecrease.
One of the most contentious arguments regarding dyke propagation is the propagation direction with respect to
the intrusion features. such as offsets. Pollard et al. (1975) suggest that propagation occurs along the length of the

24offset surface; a model that has received much support (eg. Delaney and Pollard, 1981; Nicholson and Pollard, 1985;
Smith, 1987; Pollard, 1987). There are other authors, however, that advocate lateral dyke propagation, resulting in
an array of offset fractures being successively dilated and filled with magma (eg. Currie and Ferguson, 1970;
Gudmundsson, 1984; Sigurdsson, 1987; Halls, 1988; Bussell, 1989). The former model explains offsets as a
consequence of the linkage of adjacent, slightly out of plane sheet intrusions (or fmgers of magma), whereas the
latter model ascribes offset formation to the way in which magma successively forces its way from one crack into
the adjacent one in an array of offset cracks, with subsequent dilation.
Probably neither of the above models is always applicable. It has already been described how vertical dyke
propagation can be transformed into lateral propagation at higher crustallevels. It would appear feasible, therefore,
that both models may be applicable to dykes depending upon the circumstances.
3.4.3 Rate of Intrusion
The volumetric flow rate of a viscous fluid through a narrow slit is proportional to the cube of the slit dilation
(Bird et al., 1960). Under conditions of constant viscosity and driving pressure, the linkage and dilation of offset
sheet intrusions would result in a volumetric flow rate increase to the order of n3 (Bussel, 1989).
The flow rate of a specific intrusion is directly related to the magma viscosity. Magmas with low viscosities
flow with greater ease than high-viscosity melts. Basaltic magmas thus flow much better, and with a greater
velocity, than acidic magmas. Temperature is also an important factor as it affects viscosity directly, as shown by
the Arrhenius equation
(3.15)
where 11 is the shear viscosity (the ratio of shear stress to the corresponding rate of shear strain in a liquid), E11_ is
the activation energy per mole, and R is the gas constant (Carmichael et al., 1974). Equation (3.15) indicates that
increasing temperatures will result in decreasing viscosities, and thus higher flow rates. Other factors that influence
viscosities include the magma geochemistry (Bottinga and Weill, 1972; Shaw, 1972), and the presence of water,
which tends to increase viscosities in acidic magmas.
3.4.4 Dyke Swarms
Dykes do not necessarily occur as single, isolated features. They regularly occur as an assembly of parallel or
sub-parallel units, temied a dyke swarm. Dyke swarms have been widely documented, such as in Iceland
(Gudmundsson, 1983; Sigurdsson, 1987), Greenland (Wager and Deer, 1938), Ethiopia (Mohr, 1971), and Southern
Africa (Saggerson et al., 1983; Armstrong et al., 1984; Wilson et al.; 1987; Hunter and Reid, 1987; Meth, 1991;
Ransome, 1991). The dykes generally occur as a result of multiple intrusive events, with later dyke phases

25frequently being emplaced within earlier dykes. Dyke swarm development, as opposed to single dyke formation,
requires a substantially greater volume of magma, and a large degree of lateral crustal extension (Price and Cosgrove,
1990). The latter point indicates the conduciveness of ocean-floor spreading centres towards dyke swarm
development.
The ratio of dyke material to original country rock selvages may be extremely small in a dyke swarm, indicating
the considerable degree of lateral extension that may occur. An increase in the intensity of dyke occurrence along the
length of a swarm may also be indicating the presence of an original magma chamber at a shallow crustal depth
(Ransome, 1991).
An alternative mechanism of dyke swarm development involves crustal flexure. Wager and Deer (1938) attributed
a dyke swarm in East Greenland to the effects of lithospheric flexure (Figure 3.8B). Roberts (1970) documented the
stress configuration to be expected in a region of monoclinal crusta! flexuring, and how this explains the
development of a dyke swarm (Figure 3.8A). The upwarped region is characterised by maximum principal
compressive stress trajectories that are steeply dipping to vertical, resulting in the formation of dykes. These
trajectories curve around to a horizontal attitude in the downwarped region, resulting in sill development. Roberts
(1970) used this model to explain major sill occurrences in Spitzbergen, and dyke swarm development in East
Greenland and the Rooi Rand in South Africa.
A.
10 kill
--.....---------o III kill
Figure 3.8. Dyke swarm development as a result of monoclinal lithospheric flexuring . A: associated stressconfiguration. The upwarped region is characterised by steep to vertical crI (maximum compressive stress)trajectories and dyke swarm development, whereas the downwarped region exhibits shallow-dipping to horizontal 0'1trajectories, and thus sill development (Roberts, 1970). B: dyke swarm of East Greenland associated with crustalflexure (Price and Cosgrove, 1990).
3.5 Sills
3.5.1 Initiation

26Sills are intruded as shallow-dipping to horizontal planar bodies that are, by definition, concordant with bedding
surfaces. They are an upper crustal feature, frequently emplaced within sediments of a relatively undeformed
sedimentary basin underlain by a crystalline basement (Bradley, 1965).
Park (1989) envisages the preferential development of sills over dykes as a consequence of the overburden pressure
decreasing to a value less than the driving pressure at high crustallevels. This corresponds to a minimum value of
the vertical stress, <lz. The development of a sill can more accurately be given by the condition
Pm=<lz+Tu (3.16)
where Tu is the host rock tensile strength measured perpendicular to the bedding planes. When a sill intrudes along a
bedding plane or other pre-existing fracture, as is frequently the case, Tu can be approximated as being zero. The
transformation of a dyke into a sill can be explained in terms of a change in the local stress configuration (Figure
3.9). Whereas <llc and <l3c (compressional) act in a horizontal sense for a dyke, <l3crotates to a vertical orientation
at the point of sill initiation.
Figure 3.9. Change in stress configuration as adyke develops into a sill . The local compressivestresses are (]1c (maximum), (]2c (intermediate) and
(]3c (minimum) .
If <llc and <l2c are very similar, magma flow
may radiate in all directions to produce a penny
shaped sill, as described in section 2.6. If <llc is a
dominant horizontal principal stress, then a blade
shaped body would be expected. Price and
Cosgrove (1990) suggest that for sill development,
the difference in magnitude of the horizontal and
vertical stresses is very small.
feederdyke
The features associated with a propagating dyke tip were illustrated in Figure 3.1. One feature was the opening
and sliding along mechanical discontinuities ahead of the dyke tip. This provides a feasible mechanism by which a
dyke can efficiently evolve into a sill. An induced opening along a bedding plane ahead of an advancing dyke may
become filled with magma and, if the above-mentioned stress conditions h?ld, a sill may develop along that bedding
plane (Pollard, 1969). When bedding planes are absent, sill development must conceivably be attributed to the
attainment of a point in the crust where a dyke begins to fracture the host rock in a horizontal plane and lift up the
overlying strata. This mechanism would be aided by the existence of faults in the region, along which an upward
displacement of the overlying strata can beaccommodated. Inclined dykes will turn over into a sill at a conveniently
situated bedding plane. The resultant sill will be asymmetrical (Pollard, 1969).

27
Another method by which sills can develop is documented by Gudmundsson (1990). Earlier formed sills can
inhibit continued dyke propagation by absorbing the intruding magma or, if they are already solidified, by acting as a
stress barrier.
For the case of a sill that is assumed to have a central source, an estimate can be made of the magmatic
overpressure using the formula
(3.17)
where ha is the maximum thickness of the sill, Z is the depth within the crust. L is the width of the sill and B is the
rigidity modulus, where B ='\)2E/('\)2_1) (Johnson, 1970). The applicability of (3.17) is, however, restricted to
cases where L/z > 10.
3.5.2 Intrusive Mechanisms
Sill development may occur by one of two mechanisms: hydrostatic or tectonic (Roberts, 1970). The hydrostatic
hypothesis predicts sill development when the magma driving pressure exceeds the overburden pressure as described
previously. The tectonic hypothesis explains sills that intrude in response to conditions of horizontal compression.
As the sill propagates, it may step up or down in response to local changes in .stress conditions brought about by
factors such as crusta! flexure, differential compaction or variations in the mechanical properties of the host rock
(Gretener, 1969) or due to topographical variation (Bradley, 1965). Where such steps occur, the vertical opening
displacement is constant and so dilation is not perpendicular to the sides of the intrusion.
Like dykes , an intruding sill may be characterised by a number of fingers of magma advancing ahead of the main
propagation front (Pollard et al., 1975). Initially these fingers are coplanar, however, progression into a number of
slightly out-of-parent-crack plane segments may occur as a result of structural inhomogeneities (Pollard, 1978)
resulting in an en echelon arrangement of sills. Presumably, this method of intrusion is restricted to situations
where the host rock is poorly bedded or unbedded Coplanar fingers that begin to coalesce may produce inter-finger
cusps of relatively deformed host rock (Pollard et al., 1975). Out of plane fmgers that coalesce exhibit sharply offset
contacts and may be associated with the development of horns and bridges.
3.5.3 Host Rock Effects
As sill dilation serves to uplift the overlying lithologies, the final shape is asymmetrical rather than elliptical
(Price and Cosgrove, 1990). The host rock undergoes greatest displacement closest to the central area of the sill.
The propagation of a sill through a sedimentary bed may result in a number of host rock features. Stresses

28imposed upon the sediments may result in deformation, especially if the sediments are relatively wet and
unconsolidated. Krynauw et al. (1988) noted that such sediments at Grunehogna, Antarctica, had been deformed into
large disharmonic folds by intruding sills in the mid-Proterozoic. Fluidization of the sediments resulted in the
destruction of sedimentary structures, large-scale soft sediment deformation, partial melting and fusion of the
sediments. Small-scale intraformational fault development also featured. Norman (1969) describes hornfels that was
dragfolded during intrusion.
Remobilisation of partially molten sediments may produce rheomorphic vein injection into the igneous body.
Such features have been noted in the Rooi Rand region (Meth, 1991), and near Empangeni, South Africa in this
study.
Additional effects in more brittle host rocks include stoping, brecciation, strain concentration and contact
metamorphism.
3.6 Stress Analysis
3.6.1 Intrusion Modes
It has already been advocated how a propagating fracture or an intrusion advancing into pristine host rock develops
in response to the regional stress configuration . Fractures propagate orthogonally to the maximum tensile regional
stress. In many instances however, magma-filled fractures develop in response to changes in the local stress field,
induced by factors such as host rock inhomogeneities, topographical variation, density changes and interaction with
adjacent intrusions.
The concept of crack modes was introduced in section 2.7. Applied to propagating sheet intrusions, three
varieties of intrusion can be identified on the basis of the relative displacements of formerly juxtaposed points
(Figure 3.10). Each mode is characterised by a unique state of stress that governs the propagation (Lawn and
Wilshaw,1975).

Figure 3.10. Propagation paths of sheet intrusionsbased on the types of fracture modes. Pure mode Ifractures involve opening displacements only, whereasmixed mode fractures include both opening and sheardisplacements and result in curved or segmentedintrusion forms (Pollard, 1987).
A. Pure mode I fracture
B. Mixed mode I, n fracture
7
29
3.6.2 Stress Conditions around Propagating Tips
C. ~1Ixed mode I, ill fracture
The state of stress around the termination of an intrusion propagating parallel to the maximum compressive
stress crlc is dictated by the driving pressure and not crlc (Olson and Pollard, 1989). Pollard (1973) demonstrates
the stress conditions around the tip of a propagating fracture or intrusion (Figure 3.11). A curvature develops in the
maximum compressive stress trajectory very close to the intrusion tip. This curvature is bimodal in that it occurs to
either side of the tip, thus producing a nett continued migration in the regional maximum compressive stress
direction . Exceptions occur when the stress field on one side of the intrusion interacts with another stress field in
some way, resulting in aberrations that may promote out-of-main-fracture-plane propagation. Such is the case when
the stress fields of offset sheet intrusions interact (section 3.6.3). The principal shear stress concentration around the
intrusion termination (Figure 3.llB) suggests the manner in which host rock deformation may occur (Pollard ,
1973). Shear fractures may form along the shear stress gradient Increased driving pressure could enable these shear
fractures to be utilised by the intrusion as a propagation pathway.

A.
B.
"rl . .. " ,-' ,~ '~':"'_ \ I I
<".O~<$~~:. ~ \ I ~
r' - - . : . .I. " , I
.. .. .. .. . .I , , ' /~.. . ' "
.~ ~"--==~.'l
\(\'0.....~
\
\ . ' I I
\ 0"1 curvature at tip\ I,~I X
'--_'---..l_-..l_--l_~~~---'---"-!:! ==l====--'--
Y/I
30
Figure 3.11. A: stress' conditions around one halfofa propagating fracture . Inset is the stress configuration at thetip of a magma filled crack oflength, l. The maximum principal compressive stress, aI, curves in towards the tip.B: principal shear stress (as) concentrations around one half of the tip (Pollard, 1973).
3.6.3 Interference From Adjacent Intrusions
The stress fields of offset, adjacent intrusion terminations may interact to produce a modified state of stress. The
resultant stress field is directly related to the manner in which the two intrusions are spatially arranged (Pollard,
1973; Rogers and Bird, 1987; Ransome, 1991). Intrusions offset perpendicular to the lengths interact to a greater
extent than those offset both perpendicular and parallel to the lengths. Adjacent intrusions frequently curve in
towards each other, and this is readily explained by superimposing the stress fields for each to produce a resultant
stress configuration (Figure 3.12).

31
- ..
---.I .'
'\.,--/
--.'
- "-.----..
Figure 3.12. Indication of the possible resultant principal shear stress concentrations induced by the interaction ofadjacent offset intrusions. The nature of the stress distribution dictates whether the intrusions will converge ordiverge (Pollard,1973) .
Shear stress concentration between the two intrusions may result in convergence and linkage. This is particularly
common for intrusions offset both perpendicular and parallel 10the intrusion length. Such is the case for dykes and
sills arranged en echelon (Nicholson and Pollard. 1985). The convergence of adjacent intrusions may be preceded by
a small degree of initial divergence, which serves 10minimize shear stress and maximize the tensile stress across the
propagation paths (Olson and Pollard, 1989). Convergence is then induced by an inward rotation of the maximum
tensile stress due to a change in the sense of shear resolved across the tip.
Where the intrusions are offset perpendicular to their strike lengths so that they are parallel, they have a greater
tendency to diverge (Pollard, 1973). This divergence of parallel intrusions is less marked in regions that are under
lateral tension, such as the case for most dyke swarms, where divergence of adjacent dykes does not readily occur.
Olson and Pollard (1989) introduce a method of interpreting the state of stress between offset adjacent vertical
fractures in a environment under regional compress ion. The interaction of adjacent intrusions can be understood in
terms of the remote differential compression. ila:
(3.18)
where SH is the maximum compressive stress and Sh is the least compressive stress. Crack morphology for
different values of the remote differential compression are shown in Figure 3.13.

32
3.0~-----------,
20
,,,
.':- " - " - ' - ..
. .. 4•• l MP.
-·4a-5UP.
10 15Cr . c lc h:nl th (rn )
o ol-- -'- --:!.o
J.o~--------------,-Isolaled
~zS 1~4a._o~ UP.~20 - - Oa -O MP.
~ I 5
: 1 0
0: 0 5 ---.::::--=:.c:..:...=':""::':"::::=;l
"2010 15Cr . ck l"nllh Cm l
ool--------~-_:!.o
- bolaled . • • 411 • I UP.
- Z.~ - .. liP:.. IC4.,__o.s MP. -- 4 11 • J •
.!. Z 0 _ -,\0' • 0 },IP..- '
: I .S • •" / \~ ,'....>.: '0 / / \ci: OS ~.... '
.." - .- ", -:;: . :-;-.-. ~' ~:: '--
5.0 ..--- - - - - - - - - ---,
.l---c;~ j~ °t· · · · · · ··:~~·_·_ ·_ ·~
- J 0 5 ,0 15 20
Melen
2 .~
~ 0 .0;,
- Z.5
,,,I
I,,
,I
II
r,,
201510
Meters
-5 .0J-- --_-----:o
Figure 3.13. Theoretical crack paths of offset. interacting adjacent cracks in relation to the remote differentialstress .10'. A: lis = 10. B: lis = 20, where s is the crack separation and l is the length of the crack array (Olson andPollard. 1989).
Under isotropicconditions (Llcr. =0), initial divergence is followed by convergence. As Llcr increases, the amount
of convergencedecreasesand the cracks propagateasymptotically. Under tensile conditions (Llcr < 0), path curvature
is exaggerated,and the cracks form T-type intersections (Olsonand Pollard, 1989). Crack linkage frequently requires
the precursor of an increased driving pressure. The exact geometries (Figure 3.14), are also a function of the host
rock fracturestrength.
3.7 En Echelon Geometries
3.7.1 Morphology
Fractured materials frequently display arrays of consistently offset cracks, sometimes overlapping, to produce a
pattern described as en echelon. Anderson (1951) provided a qualitative analysis of en echelon dyke segments.
Thereafter, documentation of en echelon features has been plentiful (eg. Hodgson, 1961; Ramsay, 1967; Roering,
1968;Lajtai, 1969; Hancock, 1972; Beach, 1975;Pollard et al., 1982;Nicholson and Pollard, 1985). Some of these
observationsare specific to shear zone related fractures, which will not be analysed in this investigation.
Arrays of en echelon igneous intrusions are usually interpreted as stemming from a common parent crack that
splits into a number of segments or fingers which rotate in a changing stress field along an axis parallel to the
propagationdirection. Emphasis is placed on the fact that the segments rotate out of the plane of the parent crack as
a result of a change in the regionalprincipal stress configuration. The rotating fractures trace out a helicoidalsurface
(Sih, 1981;Pollard et al., 1982). The reason for the productionof an array of helicoidally migratingfractures is one
of simple energy conservation, Less energy is expired in the development of n cracks, each of width 2b than for a
single rotated surfaceof width2nb (Pollardet al., 1982).

33
Crack segments within a single array generally display similar widths and thicknesses. There is frequently an
amount of overlap, resulting in interactive crack-tip stress fields that cause the cracks to dilate asymmetrically, and
SOmetimes sigmoidally. There is a finite number of cracks that may develop in anyone array in response to the
total possible energy expenditure and as a result of the development of stress reduction regions between dominant
echelon fractures that inhibit cracks within these regions from developing into members of the echelon array (Pollard
et al.. 1982).
The geometry of an en echelon array of rectilinear fractures can be defmed by the parameters width 2b, dilation 2a,
separation 2s, overlap 20, centre spacing parallel to the array axis 2c, centre spacing parallel to the cracks 2k, twist
angle to, and the array width 28 (Figure 3.14).
1----------28---------1
1-----2b ----1
T25 1-20-1.i,
28: '
' )
Figure 3.14. Geometric features of an en echelon array of three rectilinear cracks with parameters width 2b,dilation 2a, overlap 20. separation Zs, centre spacing along the array axis 2c. centre spacing parallel to the cracks Zk,twist angle wand array width 28 (Nicholson and Pollard. 1985).
3.7.2 Shear Failure
The association of en echelon fractures with shear zones is well known (eg. Riedel, 1929; Lajtai, 1969; Hancock,
1972; Rarnsay, 1980). However, the transmutation of a planar fracture or intrusion into an array of rotated segments
is not conspicuously associated with shear. Beach (1975) proposes that en echelon configurations of cracks that
rotated out of a common plane are tensile fractures. Delaney and Pollard (1981) suggest that both the parent and en
echelon cracks are tensile fractures orientated perpendicular to the least compressive stress which is temporally or
spatially variable. Olson and Pollard (1991) propose that en echelon fracture initiation is the most feasible
mechanism for crack propagation because the associated mechanical fracture interaction promotes the most effective
crack growth.
A highly probable explanation of en echelon fracture development (Pollard et al., 1982) is this: the spatial
rotation of a regional stress configuration is resolved on the plane of a propagating fracture as components of both
normal and shear stress . The normal stress and the internal pressure combine to produce a mode I stress intensity

34whereas the shear stress induces a mode III stress intensity. The latter initiates the development of en echelon
segments (Figure 3.10).
Although the rotation of cracks out of the plane of a common fracture can therefore be associated with a resolved
stress component, the cracks will eventually rotate into a plane that is once again perpendicular to the least
compressive stress and must thus be classified as tension fractures. The degree to which the stress component is a
valid parameter would probably depend upon the relative rates of fracture torsion and regional stress configuration
variation, and is thus likely to be a function of the driving pressure and propagation rate (with slower torsion rates
for higher propagation rates). This synopsis is in general agreement with the discussion of Pollard et al. (1982).
3.7.3 Linkage of En Echelon Cracks
Nicholson and Pollard (1985) recognise two end-member situations for dilating echelon fractures that have linked
together (Figure 3.15). They are essentially geometrically defined, with one end-member exhibiting straight
propagation paths and the other curved paths.
Cracks may produce straight propagation paths as a result of large separations or a large remote differential
compression (Olson and Pollard, 1989). Linkage of such cracks is thus a consequence of dilation, with host rock
bridges concentrating strain until the point of tensile failure is reached, causing crack linkage along the cross fracture.
A subsequent increase in dilation results, and bent bridge formation. In conditions of low remote differential stress
or small crack separations, pronounced crack curvature may lead to linkage. This again produces increased dilation
and the induction of bent bridges which, unlike bridges associated with straight propagation paths, are not
significantly strained. The formation of horns is common for both fracture varieties. Depending upon the exact
conditions under which crack propagation, dilation and linkage occur, a large spectrum of possibilities between the
two end-member situations may be produced (Nicholson and Pollard, 1985). In addition, the different frames of each
end-member in Figure 3.15 can represent either simultaneous developments in successively more proximal sections
along the advancing fracture, or a succession of events along a single cross section as dilation gradually increases.

A.
~t bent tridge
~.' ..•, .
~
to
staiglt propagation paths
B.
cLrV8CI p ropagalion paths
35
Figure 3.15. Progressive development of dilating echelon segments that become joined. A: straight propagationpath: dilation is accommodated by the bending ofbridges ofhost rock. The failure ofbridges along cross fracturesleads to crack linkage . B: curved propagation paths : stress field interaction causes the propagating cracks to rotatetowards each other. Tip-to-plane breakthrough links the cracks,resulting in increased dilation and the formation ofrotated bridges (after Nicholson and Pollard. 1985).
3.7.4 Flow Directions
If segments of en echelon offset intrusions advance as fingers from a common source , then the propagation and
flow direction must be perpendicular to the plane of the page in Figure 3.14. Propagation thus occurs along the
length of an offset surface (Pollard et al., 1975), and must also be parallel to the long dimensions of horns. This is
not necessarily true for all offset cracks (eg. Tweto, 1951: Bussel, 1989), but must be the case for en echelon arrnys
of fractures emanating from a common source.
3.7.5 Paleostress Interpretation
The orientation of en echelon crack arrnys associated with shear zones can be utilised to infer the regional
paleostress configuration that produced the cracks (Roering, 1968: Hancock, 1972). Similar generalisations cannot
be made regarding echelon cracks that have rotated out of a common plane. It has already been described how en
echelon segments rotate within a changing stress field and how the rate of rotation may not necessarily be as rapid as
the rate of change in stress configuration. In cross-sections near to the parent crack, therefore , en echelon segments
cannot be used as regional paleostress indicators with any great accuracy. More proximal cross-sections, where the
segments are consistently oriented, are more likely to be good regional paleostress indicators (Nicholson and Pollard,

361985).
3.8 Dilation
An appraisal of dilation direction determination is provided by Bussel (1989). The dilation vector is determined
by the relative offset of previously juxtaposed points along the fracture surface. which is governed by the mode of
fracture. The amount of dilation that occurs may vary along the propagation path in response to variations in host
rock ductility (Price and Cosgrove, 1990). An array of en echelon cracks may have a greatly enhanced dilation in
comparison to an isolated crack of equal dimensions to the array (Pollard et al., 1982). and crack interaction can
result in sigmoidally dilated gashes. Nicholson and Pollard (1985) give the dilation aof an isolated crack of width
2bas
~= Ap(l-u)b
J..I.
where Ap is the driving pressure. u is Poisson's ratio and J..I. is the elastic shear modulus.
(3.19)

374. SILL INTRUSION NEAR EMPANGENI
4.1 Introduction
One of the most impressive features of the Karoo Igneous Province is the volume of dolerite sills injected into
Karoo Sequence sediments. Although there have been a number of petrological and geochemical investigations
undertaken on these sills (eg. Walker and Poldervaart, 1949; Le Roex and Reid, 1978; Richardson, 1984), there has
been little attempt at establishing intrusion mechanisms or flow directions of these dolerite sills.
The mechanism by which hypabyssal igneous rocks are emplaced is a topic of long standing in the scientific
. literature. Developments in the understanding of fracture mechanics involving brittle solids by authors such as
Inglis (1913), Irwin (1957) and Jaeger and Cook (1969), as discussed in Chapter 2, have led to a better understanding
of the mechanics of fracture and intrusion in the Earth's crust This is testified in a number of geological works such
as by Roberts (1970), Pollard (1973, 1987) and Pollard et af. (1982), in which mechanisms of dyke and sill intrusion
are described (Chapter 3).
The aim of this chapter is to introduce a geomechanical perspective in the analysis of sill intrusion into Karoo
Sequence sediments. Outcrops of dolerite sills have been investigated in northern Natal in an attempt to recognise
features that provide evidence of the intrusion mechanism. Criteria have also been developed for the determination of
absolute flow directions and recognition of the three-dimensional morphology of the sills. A study of the
petrological and geochemical nature of the dolerites has proven to be a successful method for the identification of
separate intrusive phases, the internal structure of multiple-intrusion sills, petrologic and geochemical gradients
induced by intra-sill crystallisation effects, and the recognition of late-stage hydrothermal activity. Feature-specific
measurements of sills have further allowed a reconstruction of local conditions of stress, strain, driving pressure and
thermodynamic constraints.
Late Karoo dolerites of Jurassic age are intruded into Permian sediments of the Ecca Group along the Mhlatuze
River, west of Empangeni, Natal. The sediments include sandstones of the upper Vryheid Formation and a variable
sequence of mudstones and siltstones of the Volksrust Formation, previously documented by McCarthy (1960) and
Tavener-Smith et al. (1988). Detailed mapping along the western bank of the Mhlatuze River led to the construction
of a profile through the outeropping sediments and associated dolerite sills. This illustrates a number of
morphological features of the sills, such as an en echelon geometry, that may be used to infer the emplacement
mechanism. An investigation has also been made of dolerites that crop out in a dolerite quarry in the vicinity of the
Mhlatuze River traverse. Dolerites have been analysed both petrographically and geochemically in order to
distinguish specific characteristics and trends, as well as to obtain an understanding of Karoo dolerites situated in
close proximity to the Lebombo Monocline, and how they compare to dolerites elsewhere in the Karoo Igneous
Province , such as documented by Walker and Poldervaart (1949). Comparisons have also been made with results
from previous investigations in the Lebombo region, such as by Cox and Bristow (1984), Sweeney (1988) and

38Sweeney and Watkeys (1990).
4.2 Locality
The mapped portion along the Mhlatuze River is located approximately 16 km west of Empangeni (Figures 1.1
and 4.1). Fieldwork along the Mhlatuze River was restricted to the western bank. along which high cliffs of good
outcrop occur. The traverse extends from the iron-girder bridge. where the old Empangeni-Eshowe road crosses the
river. to a point 1800 metres downstream (south). A dolerite quarry , in which a number of dolerite sills crop out, is
located 1 km northwest of the iron-girder bridge (Figure 4.1), and is operated by Baystone Sales of Richards Bay.
4.3 Local Geology
The Karoo dolerite sills under investigation
are restricted principally to the Volksrust
Formation, although part of the traverse along
the Mhlatuze River incorporates the upper
vestiges of the Vryheid Formation. These
formations mark the uppermost part of the Ecca
Group (Figure 4.2).
4.3.1 Ecca Group
Figure 4.1. Locality map with generalisedgeology, indicating the extent of the traversealong the Mhlatuze River, and the position ofthe dolerite quarry (from mapping in this studyand after McCarthy, 1960).
o 250
metres
N
1
Empatlgeni 16k
Dolerite sills
AlluviumVryheid Formation
Beaufort Group
Volksrust Formation

39
WEST
Vryheld Fm.lVolkarust Fm.contect
Mhlaluze River
VRYHEID FORMATION
O.3m Ihlck m-c.g.sandstone
VOLKSRUST FM.
It-----------A--------------,';rr----A..---..,."'"'-.....:;.;;:.::..;...:.;:..:.;....;;=:.;;...;.;~-~
not 10 sce le
Figure 4.2. Position of the Vryheid and Volksrust Formations in the local stratigraphy. Notations are: Fm.:Formation; c.g.: coarse-grained; m.g.: medium-grained; f.g.ifine-grained.
The contact between the Vryheid and Volksrust Formations has been defined by Tavener-Smith et al. (1988) as
the top of the uppermost sandstone bed within the sandstone-dominated Vryheid Formation, This contact occurs
approximately 1500 m downstream from the iron-girder bridge. Dolerite intrusion occurred immediately below the
contact, leaving a 0.3 m thickness of coarse-grained sandstone between the sill and the contact. Tavener-Smith et al.
(1988) describe the sandstones here as being coastal to deltaic or lagoonal in origin. The Volksrust Formation
consists of an approximately 200 m thickness of siltstones and mudstones which can be sub-divided into a number
of discernable facies on the basis of sedimentological and palaeontological data These facies have been tabulated
together with an interpretation of the depositional conditions. similar to that given by Tavener-Smith et al. (1988),
in Table 4.1. The sedimentary beds and incorporated sills dip to the northwest with inclinations varying between 70
and 160 .

FACIES TYPE
Interbedded siltymudstone/sandy
siltstone
Silty mudstone
Sandy siltstone
Mudstone
Clayey siltstone
Sandy siltstone
DESCRIPTIONS
Bm thick. Duskyblue to light grey .Includes a O.Gmthick f .g.sandstonebed with flaserbedding + thin lime-stone lenses +rippled beddingplanes + twig andGlossopteris leafimprints.
=40m thick . Darkgrey. Micaceous .Bedding 244°/l2°NW .Sandy siltstones upto O.3m thick withclay draped ripplecross lamination.Glossopteris leafand Phyllothecastem imprintspresent.
=SOm thick. Colourvaries throughgrey, light olivegreen and palegreyish green. Beds300 o/lGoNE. Towardstop, Glossopterisand Vertebrariaroot and stemstructures occur.
lOm thick. Lightgrey and rubblywith some flaserbedding present.
ISm thick. Darkgrey with sand bedsup to O.2m thick.Bedding 22so/28°NW .
=70m thick. Duskyblue to dark bluishgrey. Micaceousnear base. MuchPlanolites andScolicia-liketrails withSiphonichnus andTeichichnus trailshighlighted bycalcite . 4m thicklight greymicaceous siltstoneat basa of facias .
INTERPRETATION
There was a sourceof woody materialclose-by. Themudstones withsmall ripples plusthin limestone maybe lagoonal or fromcoastal inletdeposition, withsand from bars orbarrier beaches.
Possibly calmcoastal embaymentconditions withfluvially suppliedplant debris, ordeposition in awell vegetatedlagoonalenvironment.
Tavener-Smith et al(1988) reportedPhyllotheca stemsin this facies too.This suggests freshwater lake margins.The possibledepositionalenvironment was alagoonal margin.
Interpretation ofthis facies isdif f Lcu Lt. Lowenergy environment;possibly highlybioturbated.
Comparison withadjacent faciessuggests lagoonalor shallow marine.The sand beds maybe the result offluvial flooding orstorm surges.
The abundance ofmarine relatedbioturbationeffects suggests ashallow marineenvironment. Thismay have been inthe vicinity of ariver mouth withits associatedsupply of sand intothe depositionalbasin.
40
Table 4.1. Yoiksrust Formation sedimentary sequence with interpretations of depositional environment The baseof the sequence is at the bottom of the table. .

41
Dilation and dolerite intrusion was compensated by a vertical displacement of the intruded sediments, with no
apparent elimination of strata. Strata of the Volksrust Formation are disturbed by fault drag along a zone of normal
faulting 1150 m downstream of the iron-girder bridge (Figure 4.1), however, there has been no elimination of strata
(Tavener-Smith et al., 1988). The Volksrust Formation, which dominates the outcrop along the river traverse, is
exposed from its basal contact to the iron-girder bridge, through an equivalent vertical thickness of 200 m. A light
grey mudstone containing the terrestrial fossil Glossopteris crops out in the dolerite quarry, and may be related to the
uppermost fades along the Mhlatuze River traverse. Due to the lack of any specific definition of the boundary
between the Volksrust Formation and the overlying Emakwezini Formation of the Beaufort Group (defined by SACS
(1980) as being composed of shale, rnudstone, sandstone and minor coal seams), all siltstones and mudstones
described here have been allocated to the Volksrust Formation, in agreement with the interpretation of Tavener-Smith
et al. (1988) . The Beaufort Group lower contact as shown in Figure 4.1, was defined by McCarthy (1960).
4.3.2 Dolerite Sills
The morphology of the dolerite sills along the Mhlatuze River is shown in Figure 4.3. Field observation
suggests at least three phases of dolerite. The first phase produced thick (15 - 28 m), coarse-grained sills that crop
out near the iron-girder bridge at the northern end of the river traverse, and along the junction between the Vryheid
and Volksrust Formations (Figure 4.3). The sill at the northernmost extent of the traverse has an outcrop thickness
of 27 m with no upper contact exposed. The grain size of the coarse-grained dolerite decreases markedly towards the
sill margins as a consequence of more rapid cooling against the host rock.
The second dolerite phase resulted in comparitively thinner (2 - 5 m) sills of fine-grained to glassy dolerite. They
occur along the entire length of the section, repeatedly dipping and stepping up towards the northwest Along the
northern part of the section (Figure 4.3) the fine-grained dolerite was emplaced into the earlier sills of coarse-grained
dolerite approximately one quarter of the way up from the base. Where this has occurred, the fine-grained dolerite has
chilled against the coarse-grained dolerite along both the upper and lower contacts. This enabled the determination of
field relations and relative ages. The fine-grained dolerite sills are associated with a number of small-scale intrusion
related features such as offsets, horns and both bent and rotated bridges. The rotated bridges show evidence of
permanent strain. This is most apparent in bridges of incompetent host rock but is true also for bent bridges
composed of dolerite. An example at the 129 m mark along the traverse (Figure 4.3) incorporates a 3 cm thick .
granitic vein intermediate in age between the coarse-grained and fine-grained dolerites. A rotated bridge of coarse
grained dolerite exhibits deformation of the vein within the bridge (Figure 4.4).

ometres
100200300400
~.~.~~~. - ."-,,",, "", -, ~ - -"-,, ,,-,;, " "';';';',,;';';',.;';';';'""','\. '" , " """""",. .. ", .:. ... . . . . ;';' '" " " ;' ;' ;' . . ".I';' , ;' ;' ;' ;' .I' ;' ;' ;' ;'
:.,:~ "' '.,'~""~'.,'", ~ .J " " '" '\. ';';,'"'"';,';';,',,,',,,'
500600700800
~;I:;;.-:z;::z .;;;;.s ~· r ;;· · · · '··'"'··· · ' · ' · ··,=· , ·,·.", . · . · . · . · . · . · .· ::·..:2:, .~,. , ." . , . " . , . " . , . , . ,..;;;,.,..,,..,.".,..:-::,.:-",,~ ~~:. ~~;::;;.~~~.~7'77'~~~',~,, ,~'"is
w
900100011001200
dyke
1300140015001600 f
;' ;' ;' ;' ;' ;' ; ;' ;'
'\. .... '\. " " " " "1700
VryheidFm'VolksruslFmcontact .........
""""',';' ;' ;' ;' ;' ;' ;' ;' ;'
" '\. " " '\. " " '\. " "
E
1800
LEGEND
~......•J'.
/',
Volksrust Fm: siltstone, mudstone
Vryheid Fm: sandstone, siltstone
fault
~~ ~
": 1~~!ii!!rr
-coarse-grained dole rite
fine-grained dolerite
xenolithic dole rite
Figure 4.3. Cross-section along the Mhlatuze River west bank indicating dolerite sill morphology along the traverse indicated ill Figur e 4 .1.+:0N

fine-grained doleritechill zone
." \ -.. .. ... . - - :.: .,' " :. .:' . . '.. ·.rotated bridge
43
. '.
131
coarse-grained dolerite
130 128 m
Figure 4.4. A rotated bridge of coarse-grained dolerite within fine-grained dolerite at the 129 m mark. Thestrained bridge exhibits a deformed granitic vein that is intermediate between the two dolerite phases in age. Bothend-member bridge types defined by Nicholson and Pollard (1985) are represented in close proximity to each other atthis Location.
The third dolerite type is characterised by the incorporation of an assortment of xenoliths of crustal material, and
will thus be termed the xenolithic dolerite. It occurs as two distinct blocks or wedges, both encapsulated within fine
grained dolerite (Figure 4.3). The first block, extending from the 350 m mark to the 360 m mark is 0.5 m thick.
The second block, between the 700 m and 738 m marks, varies from 1 m to 1.5 m in thickness . The xenoliths are
predominantly granite gneiss, with lesser amounts of quartz, feldspar, clay, mica schist and graphite xenoliths . They
constitute approximately 60% of the rock, are rarely greater than 10 cm in diameter, and are elongate, defining a
macro-foliation. Parallel to the foliation , there are also thin bands of increased deformation within which quartz
xenoliths are ribbon-like, and granite gneiss and graphite xenoliths are increasingly foliated. The fine-grained dolerite
has chilled against the enclosed xenolithic dolerite blocks which must, therefore, pre-date the fine-grained phase.
The xenolithic dolerite contains pyrite along the xenolith boundaries and within the matrix of fine-grained
dolerite. Calcite amygdales are common , and pass through both the dolerite matrix and the xenoliths. They are
characterised by dark chlorite rims and are predominantly less than 2.5 mm in diameter , although amygdales up to 17
mm across occur. The "matrix" of fine-grained dolerite displays a cooling induced decrease in grain size towards the
edges of the blocks.
The tenninologies "coarse-grained dolerite", "fme-grained dolerite" and "xenolithic dolerite", as outlined above,
will be retained as the consistent means of dolerite nomenclature in this chapter.
4.3.3 Faulting
The Mhlatuze River section is faulted in two locations: at the 1150 m and 1520 m positions (Figure 4.3). The
subvertical fault at the 1150m mark has disrupted the strata for a distance of about 50 m to the north of the fault.

44This appears to be the result of fault drag, induced by a downthrow on the northern side of the normal fault. Near the
fault, the sediments are brecciated and deformed. The apparent fault plane is marked by two post-faulting dolerite
dykes, 1.5 m and 0.3 m thick respectively. Despite the prominence of this fault and shatter zone, displacement is
probably not extensive (Tavener-Smith et al., 1988). Thefault near the 1520 m mark has a downthrow of 1.5 m on
the northern side and is a normal fault, contrary to its appearance in Figure 4.3 in which it resembles a reverse fault
as a consequence of its orientation (strike and dip of 235°/78° NW respectively) with respect to the orientation of
the section (Figure 4.1).
4.4 Dolerite Petrography
Twenty one petrographic thin sections of dolerites along the Mhlatuze River traverse were examined (Appendix
2). The dolerites are all essentially tholeiitic, with sub-ophitic plagioclase and lesser amounts of pyroxene occurring
as the predominant mineral phases. Most dolerites have undergone varying degrees of alteration involving
chloritisation of pyroxene and sericitisation or calcitisation of plagioc1ase.
4.4.1 Coarse-grained dolerite
FELDSPAR: The coarse-grained sills generally consist of 50-70% plagioclase, ranging in composition from
oligoclase to labradorite. The crystals are tabular and randomly oriented, and exhibit Carlsbad, albite and
polysynthetic twinning. Near the sill margins, the amount of plagioclase increases to 70-75% of the rock, and
occurs as both an unoriented , sub-ophitic acicular groundmass and a phenocrystic portion. The plagioclase is
An35-55 (andesine/labradorite) and the phenocrysts are visibly zoned Alteration effects include both calcitisation and
sericitisation. Calcite replacement began along cleavage and twinning lamellae before moving to the grain
boundaries. Sericitisation is 'common, occasionally in the fonn of sericitised exsolution lamellae. Small amounts
of alkali feldspar (orthoclase) sometimes occur.
PYROXENE: Both clino- and orthopyroxenes occur in the dolerites in the form of augite and hypersthene
respectively, although small amounts of pigeonite were noted from one sill. Pyroxene is represented by both
phenocrystic and groundmass portions, with the latter arranged sub-ophitically with plagioclase. Away from the sill
margins, augite and hypersthene occur in equal abundance, constituting a total pyroxene content of 30%. Closer to
the sill margins, there is less total pyroxene (20-25%), with variable relative amounts of augite and hypersthene,
although the amount of augite does not exceed 10%. Alteration effects include the ubiquitous chloritisation of both
pyroxene types, and later calcitisation in close proximity to the sill margins. In addition, hypersthene is
occasionally serpentinised along cracks and grain boundaries (Figure 4.5).

45
Figure 4.5. Serpentinisation of hypersthene crystals along cracks and grain boundaries (arrowed). Sericitisation(5) ofadjacent plagioclase is also evident . as well as chloritisation (e) ofgroundmass pyroxene.
OTHER MINERALS: Interstitial glass comprises up to 15% of the coarse-grained dolerite. Accessory minerals
include pyrite, titanomagnetite, ilmenite, sphene, biotite and quartz . The volwne percentage of both phenocrysts and
opaque minerals increases towards the lower margins of the sills, probably as a result of crystal settling of the larger
and denser crystals in the magma. Up to 10% of the rock is constituted by primary phenocrysts of plagioclase,
augite and hypersthene. Opaque minerals comprise up to 10% of the dolerite, predominantly pyrite, which is most
concentrated near the sill boundaries. The euhedral biotite grains exhibit occasional pyroxene nuclei and may
therefore be pre-chloritisation pseudomorphs of augite. Calcite-rich amygdales represent up to 5% of the rock,
increasing in abundance towards the upper contacts.
4.4.2. Fine-grained dolerite
Compared to the coarser dolerites, this type has less plagioclase and more total pyroxene. Small amounts of
interstitial glass usually occur. Cooling of the fine-grained dolerite from the contacts inwards has resulted in a small
degree of fractionation so that substantial amounts of primary quartz and alkali feldspar occur at some of the sill
centres.
FELDSPAR: Plagioclase constitutes 60-65% of the rock and is approximately An50 (labradorite). The grains
are acicular and usually unoriented, although a now fabric is present within some chilled. glassy margins of the sills.
As was the case with the coarse-grained dolerite, plagioclase is most abundant near the sill base. Alteration by
sericitisation is common near the sill margins.

46
PYROXENE: The greater amount of total pyroxene in the fine-grained dolerite in comparison with the coarse
grained dolerite is manifested by an increase in the augite content , which totals 20-25% of the rock. The augite
grains are acicular and are frequently substantially chloritised. Where appreciable amounts of devitrified glass occur
between the plagioclase grains, pyroxene is usually absent. Chloritised hypersthene never exceeds 15% of the rock
volume, and is sometimes completely absent
OTHER MINERALS: Green-brown biotite is usually present in amounts less than 5% but comprises up to 10%
of the rock in places. Small nuclei of augite are remnants of the pyroxene grains that were pseudomorphed by the
biotite. Biotite grains are frequently juxtaposed against titanomagnetite. A few biotite grains have calcitised rims.
The opaque minerals present are titanomagnetite and pyrite, which are present in amounts up to 10%.
Titanomagnetite is a primary mineral phase but pyrite is a secondary pseudomorphing phase concentrated along the
sill margins, as in the coarse-grained dolerite. Calcite-rich amygdales are dispersed throughout the sills. Calcite is
common in the dolerites, frequently in substantial amounts. This is especially true closer to the sill margins and it
is probable, therefore, that calcite is a secondary mineral associated with late fluids migrating along the sill contacts.
Pyrite probably formed in a similar manner as it too is concentrated along the sill margins. Calcite can also be a by
product of the alteration of pyroxene to chlorite (Hatch et al, 1972) but this reaction would probably not result in
large quantities of calcite, as observed.
4.4.3 Xenolithic dolerite
The doleritic groundmass of the xenolithic dolerite consists principally of calcic plagioclase and hypersthene. The
plagioclase is substantially calcitised and the majority of hypersthene grains are altered to chlorite. Pyrite occurs
around xenocryst boundaries and along the foliation direction. Calcite-rich amygdales are common and have
diameters of up to 17 mm. Sphene occurs in an accessory capacity. Most xenocrysts are quartz and K-feldspar
(orthoclase) , probably derived from disaggregated granite gneiss xenoliths of local basement origin. The quartz
xenocrysts are frequently strained and embayed, and feldspar xenocrysts are disaggregated and calcitised (Figure 4.6).
Some xenocrysts have been completely converted to calcite. Quartz equilibrium textures such as 1200 triple
junctions suggest partial melting and recrystallisation. Partial melting would also account for the occurrence of
amygdales within xenoliths, In thin section, graphite occurs as thin (20-200 microns) bands intercalated with a
dolerite matrix, suggesting immiscibility during partial melting (Figure 4.7). The intrinsic grain size difference in
the doleritic groundmass of Figures 4.6 and 4.7 reflects a cooling-induced grain size decrease towards the margins of
the xenolithic dolerite blocks.

47
Figure 4.6. Xenolithic dolerite (plane polarised light) with xenocrysts of embayed quartz and ealcitised feldspar.The doleritic groundmass is comprised ofplagioclase and chloritised hypersthene.
Figure 4.7. Graphite component of the xenolithic dolerite as seen in plane polarised light . Thin graphite bandsoccur intercalated with dolerite groundmass as a result of immiscibility during partial melting of xenoliths ofgraphite or coal.
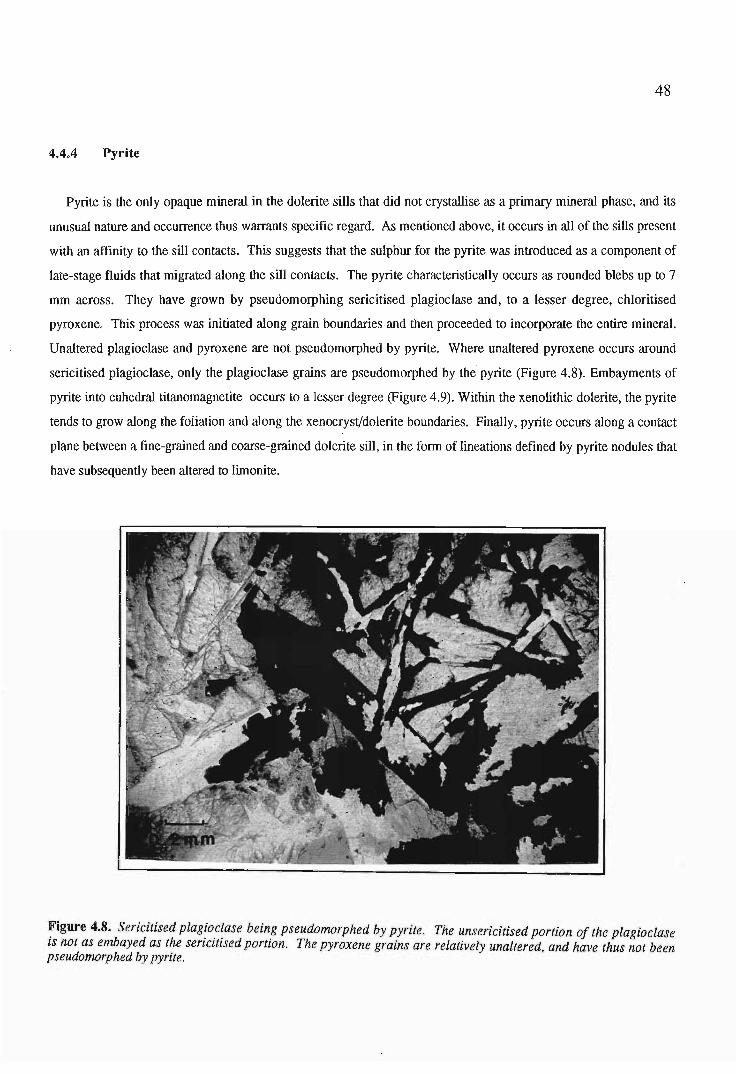
48
4.4.4 Pyrite
Pyrite is the only opaque mineral in the dolerite sills that did not crystallise as a primary mineral phase , and its
unusual nature and occurrence thus warrants specific regard. As mentioned above, it occurs in all of the sills present
with an affinity to the sill contacts. This sugges ts that the sulphur for the pyrite was introduced as a component of
late-stage fluids that migrated along the sill contacts . The pyrite characteristically occurs as rounded blebs up to 7
mm across. They have grown by pseudomorphing sericitised plagioclase and, to a lesser degree, chloritised
pyroxene , This process was initiated along grain boundaries and then proceeded to incorporate the entire mineral.
Unaltered plagioclase and pyroxene are not pseudomorphed by pyrite. Where unaltered pyroxene occurs around
sericitised plagioclase, only the plagioclase grains are pseudomorphed by the pyrite (Figure 4.8) . Embayments of
pyrite into euhedral titanomagnetite occurs to a lesser degree (Figure 4.9). Within the xenolithic dolerite, the pyrite
tends to grow along the foliation and along the xenocryst/dolerite boundaries. Finally, pyrite occurs along a contact
plane between a fine-grained and coarse-grained dolerite sill, in the form of lineations defined by pyrite nodules that
have subsequently been altered to limonite.
~igure 4.8. Sericitisedplag!o.c~ase being pseudomorphed by pyrite. The unsericitised portion of the plagioclaseIS not as embayed as the sericitised portion. The pyroxene grains are relatively unaltered. and have thus not beenpseudomorphed by pyrite.

49
Figure 4.9. Embayments of pyrite intoeuhedral titanomagnetite that exhibitsilmenite oxidation and exsolution lamellae.Note how pyrite grows by extending alonggrain boundaries. TM = titanomagnetite.PY =pyrite. I = ilmenite. PX =pyroxene.F =plagioclase feldspar.
F
4.4.5 Amygdales
Amygdales occur within all the dolerites, but are most common in the fine-grained phase, increasing in
concentration towards the tops of the sills. In three dimensions they are spherical, although a small number are
distended along a principal axis. As mentioned previously, amygdales within the xenolithic dolerite are up to 17
mm across, however, within the other dolerites the amygdales have a diameter range of 0.1 mm to 1.5 mm. The
infill sequence of the vesicles was generally uniform in all the sills:
1. Chlorite (at the rim)2. Thomsonite3. Calcite4. Quartz (not always present)
The rims consist of green-brown, structureless chlorite, and are occasionally interspersed with small opaques. The
next mineral phase is a rim of thomsonite: a zeolite characterised by radiating fibrous crystals. It was identified
using analogies to descriptions of amygdale minerals within the Mfolozi River Formation basalts to the north of
this location (Wheelock, 1978). Calcite constitutes the major portion of the amygdales. Small grains of quartz at
the centre of some amygdales mark the last mineral that crystallised within the vesicle (Figure 4.10). A narrow, pale
olive-green zone of leaching frequently surrounds the amygdales, predominantly within the glassy chill-margins.
The amygdales within the fme-grained dolerite dyke at the 505 m mark along the river section (Figure 4.3) exhibit an
enclosing ring of glass.
4.5 Sills in the Dolerite Quarry
The dolerite quarry is situated 1 km northwest of the iron-girder bridge at the northern end of the Mhlatuze River
traverse, and is operated by Baystone Sales of Richards Bay. Present operations in the quarry are confined to the
northern end, whereas the older, southern end has become filled with water (Figure 4.11).

50Although the quarry is dominated by thick dolerite sills, outcrops of silty mudstone mark the basal contact of the
stratigraphically lowest sill within the quarry. The mudstone is light grey and contains twig and leaf imprints of
Glossopteris, and is thus very similar to the stratigraphically highest mudstone occurring along the Mhlatuze River
section, and may belong to the same fad es. The dolerites within the quarry were correlated at various points across
the quarry on the basis of the relative heights above the silty mudstone contact.
Figure 4.10. Two amygdales displaying a typical infi ll mineral assemblage. The chlorit e rims (CHL) encompassfibrous thomsonite (T),jollowed by calcite (CCT) and a small amount ofquartz (Q) . Most amygdales are spherical,but some are distended along a prin cipal axis , such as the one shown here which has a long-axis length of 1.4 mm.
As the dolerite sills generally dip towards the north, the greatest thickness of dolerite within the quarry occurs at
the northern end. At this point, the dolerite atta ins a thickness of approximately 50 m (overlying the silly
mudstone), with no upper boundary observed. This thickness of dolerite appears to occur as three separate sills. The
lowest sill contacts against the silly mudstone and is 15 m thick. The sill above this is approximately 35 m thick,
and only the first metre of the uppermost sill crops out above this. The sill contac ts are not well defined and,
therefore, recognition of the three sills was achieved on the basis of visual differences and petrography.
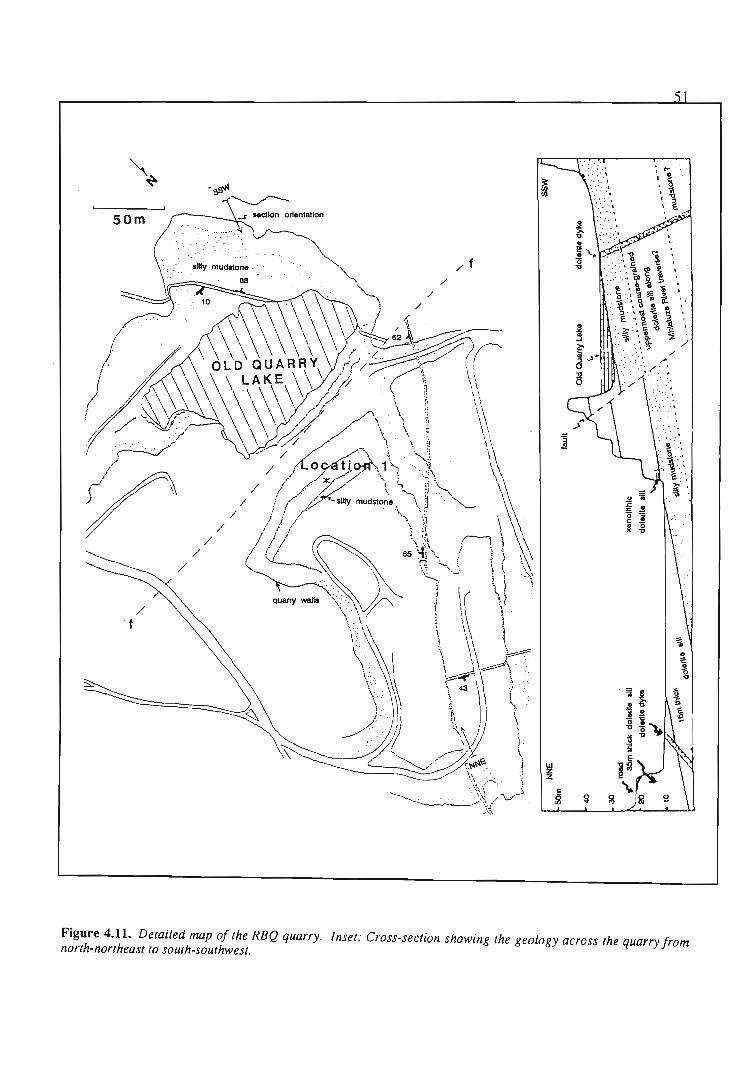
.J lectlon orientation
:' ': . ..' .- .' . ." • . 'i.
/-f
50m
Figure 4.11. Detailed map of the RBQ quarry. Inset: Cross-section showing the geology across the quarry fromnorth-northeast to south-southwest,
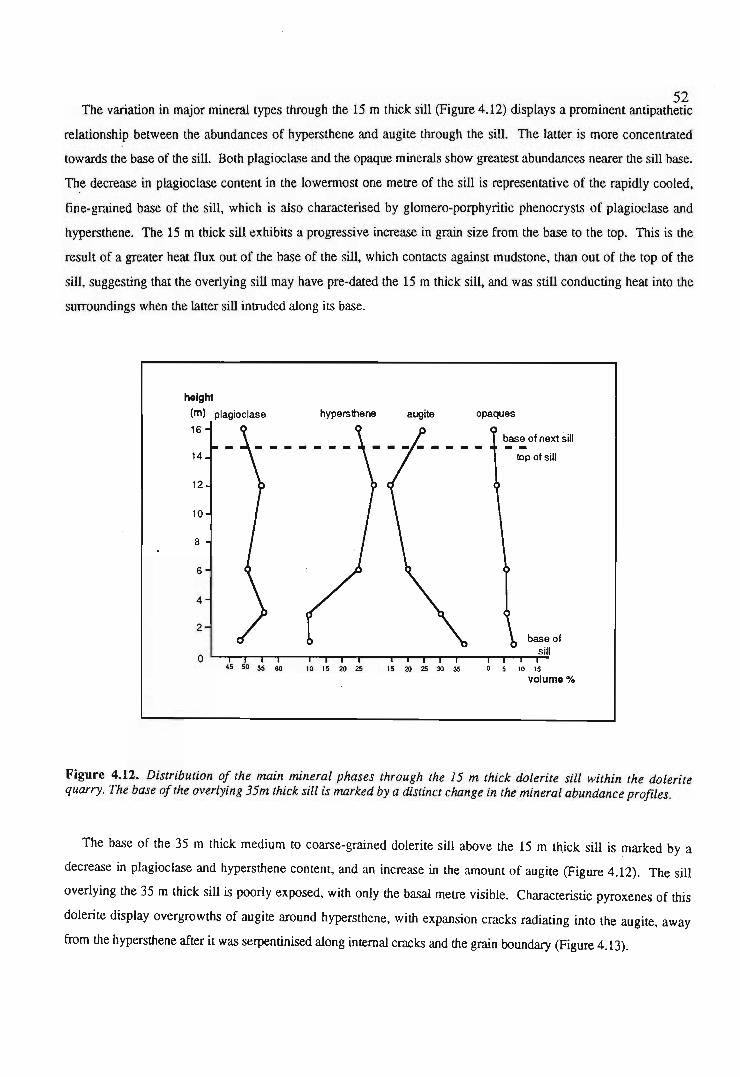
52The variation in major mineral types through the 15 m thick sill (Figure 4.12) displays a prominent antipathetic
relationship between the abundances of hypersthene and augite through the sill. The latter is more concentrated
towards the base of the sill. Both plagioclase and the opaque minerals show greatest abundances nearer the sill base.
The decrease in plagioclase content in the lowermost one metre of the sill is representative of the rapidly cooled ,
fine-grained base of the sill, which is also characterised by glomero-porphyritic phenocrysts of plagioclase and
hypersthene. The 15 m thick sill exhibits a progressive increase in grain size from the base to the top. This is the
result of a greater heat flux out of the base of the sill, which contacts against mudstone, than out of the top of the
sill, suggesting that the overlying sill may have pre-dated the 15 m thick sill, and was still conducting heat into the
surroundings when the latter sill intruded along its base.
height(m) plagioclase hypersthene augite opaques
16base of next sill
14 top of sill
12
10
8
6
4
2base of
sill0
45 50 55 60 10 15 20 25 15 20 25 30 35 0 5 10 15
volume %
Figure 4.12. Distribution of the main mineral phases through the 15 m thick dolerite sill within the doleritequarry . The base of the overlying 35m thick sill is marked by a distinct change in the mineral abundance profiles.
The base of the 35 m thick medium to coarse-grained dolerite sill above the 15 m thick sill is marked by a
decrease in plagioclase and hypersthene content, and an increase in the amount of augite (Figure 4.12). The sill
overlying the 35 m thick sill is poorly exposed, with only the basal metre visible. Characteristic pyroxenes of this
dolerite display overgrowths of augite around hypersthene , with expansion cracks radiating into the augite, away
from the hypersthene after it was serpentinised along internal cracks and the grain boundary (Figure 4.13).

53
Figure 4.13. Overgrowth of augite around serpentinised hypersthene , from the 35 m thick dolerite sill in RBQquarry. Note the expansion cracks radiating into the augite due to serpentinisation of the hypersthene core. C =augite, 0 =hypersthene, P =plagioclase, Q=quartz. M =magnetite , SP =sericitised plagioclase.
At one location within the quarry, the 15 m thick dolerite sill encapsulates a fine-grained dolerite sill that is
xenolithic (Figure 4.11, location 1). This sill is a maximum of 2.5 m thick and contains a number of xenoliths of
quartz, shale and dolerite. The sill is extraordinary in that although it occurs within another dolerite, it is totally
enclosed within thin bands of mudstone at its upper and lower contacts. These slivers of mudstone are up to 0.4 m
thick and are highly deformed. Many fragments of the shale were incorporated into the fine-grained sill, especially
along the contacts. The dolerite groundmass is composed of highly sericitised plagioclase and chlorite, with some
augite remnants . Quartz xenocrysts are embayed and sub-grains display 1200 triple junctions. Feldspar xenocrysts
are substantially calcitised. The xenocrysts define a prominent foliation direction. Pyrite has crystallised along the
foliation direction, and pseudomorphs altered plagioclase. These characteristics compare well to the xenolithic
dolerite along the Mhlatuze River. The obvious difference is the presence of the mudstone wedges along the contacts
and the more sill-like appearance of this xenolithic dolerite.
As shown in Figure 4.11, there are three dykes traversing the dolerite quarry. They appear to pass through all of
the sills within the quarry. The longest dyke strikes northeast to southwest across the quarry, and is associated with
post-intrusion faulting along the intrusion plane. that has converted the dolerite to schist.
There is evidence for late-stage hydrothermal fluid flow along the dolerite sill contacts. as was suggested along the

54Mhlatuze River section. The introduction of sulphides into the sills was one consequence of this fluid event,
however, more specific evidence occurs along the contact between the 15 m thick dolerite sill and the underlying
mudstone , as well as along partings within the mudstone. These surfaces are characterised by linear trails of pyrite
nodules. similar to those observed along the Mhlatuze River on the contact plane between two juxtaposed sills.
Smith (1987) describes linear ridges and grooves along a dyke contact that he ascribes to the "scouring and erosion of
chilled, viscous magma near the dyke contact by more fluid magma flowing in the dyke's interior". Similar features
were noted by Roberts and Sanderson (1971). These scour marks along the chill margin should thus give evidence of
the magma transport direction. The appearance of the pyrite nodule lineations along the chill margins of the sills
suggests that the pyrite may have nucleated along pre-existing grooves along the contact plane during fluid injection .
Such grooves may have formed by the mechanism proposed by Smith (1987). However, this mechanism does not
account for the existence of pyrite lineations along partings within the mudstone immediately adjacent to the sill
contact. A possible extension of Smith's (1987) solution is the formation of grooves along the mudstone partings
induced by sliding along the principal shear direction. This would parallel the magma transport direction in close
proximity to the contact plane (Ross , 1986). The orientations of the pyrite lineations are shown as a rose diagram
in Figure 4.14, and the overall trend may be indicative of the magma migration direction for the ISm thick sill. The
pyrite defining the lineations has subsequently been altered to limonite , and a thin zone of iron staining extends into
the mudstone along the migration planes.
Calcite and quartz veins are common in the dolerites within the quarry. Multiple pulse, episodic fluid injection
into joints to produce quartz veins is discernable via internal chill margins. Three crystallisation events were
identified in one quartz vein using this criterion (Figure 4.15).
n=24
Figure 4.14. Rose diagram showing the orientation of pyrite nodule lineations along fluid migration planesdefined by ~olerite/mudstone c.onta~ts a~ the southern side of Old Quarry Lake (Figure 4.11). The trend may be arepresentation of the magma migration direction (see text).

3 32
1cm
" /" ...-'" /\ / \/ \ /
' .' - .....\ \ I - / r- -' -
"
\ I "-
I \
,:1
1 ' 1 ';: _\ I
ChillI'zone of ,"
15t "\qu a r t z f:'phase .. -
Flow Direction
The initial pulse of magma that intrudes a dilating fracture is rapidly 1 \ _
quenched against the sides of the fracture to produce a chill margin.
Consequently. any preferred orientation of crystals or phenocrysts is
preserved in the frozen magma. The flow of magma into a dilating doler ile chill zones
fracture is likely to produce a flow-parallel alignment, defined by crystals L- ~
and phenocrysts of suitably high aspect ratio (eg. Roberts and Sanderson.
1971; Smith. 1987; Benn and Allard, 1989; Allard and Benn , 1989). This is most likely to occur against the walls
4.6
Figure 4.15. Episodicfluid flow along joint planes demonstrated by asyntaxial quartz vein (on the northeast sideof Old QuarryLake) exhibitingthree crystallisation events, The separate eventsare distinguished by thepresence of chill margins within the vein, as with the criterion used forrecognising multiple intrusion in dykes and sills,
of the intrusion. where the greatest velocity gradient occurs (Komar, 1976). together with high associated rates of
shear (Barriere, 1976; Ross, 1986; Ildefonse et al., 1992). Rapid quenching preserves this flow fabric which may
thus provide information on the flow orientation. although not the absolute flow direction. Phenocrysts introduced
with the magma pulse are unlikely to be accreted onto an inwardly advancing crystalline margin during periods of
flow . as a result of hydrodynamic forces that induce flow differentiation (eg. Bhattacharji, 1967; Barriere, 1976;
Ross, 1986; Platten and Watterson. 1987). The flow fabric is thus likely to be demonstrated in an aphyric margin
by micro-phenocrysts and crystals growing along the shear direction. Flow differentiation effects are greatest for
narrow fissures. Wide fissures may undergo differential accretion during episodic magma pulses. producing multiple
aphyric and porphyritic zones (Platten and Watterson, 1987). In such cases. aphyric zones away from the absolute
margin may presumably also provide evidence of the flow axis. or variations thereof between successive injection
pulses.
The lower chill margin of one of the fine-grained sills sampled along the Mhlatuze River exhibits a preferred
mineral orientation in a plane parallel to the contact. defined by quenched acicular pyroxene crystals (Figure 4.16) .
This effect is restricted to the chill margin of the sill and is thus assumed to be indicative of the principal shear plane
and accordingly. the flow axis orientation. Measurements of crystal orientations (Figure 4.17) indicate a preferred
orientation of 025°-0300; in other words an approximately north-northeast/south-southwest orientation axis. This
compares well to the measured strike directions of a number of offsets and apophyses of the fine-grained dolerite sills
near the 670 m mark along the Mhlatuze River traverse. If the preferred mineral orientation is indeed a result of
shear along the magma flow direction. then the flow direction would have been along the offset surfaces. in
agreement with the model of Pollard et al. (1975). The relatively shallow dip of the Volksrust Formation
sedimentary beds. and associated shallow plunge of the flow axis down the dip. results in a negligible change in the
inferred flow axis orientation when the beds and lineation are stereographically projected back to the horizontal plane.

56The 0250 -0300 observed orientation is thus an accurate representation of the original flow lineation prior to local
tilting.
.Additional peaks in the mineral orientation frequency profile (Figure 4.17) occur at the 1000 and 1600-1700
orientations. These orientation peaks probably represent minor shear across the predominant flow/shear direction , or
may be the result of an imbrication or tiling effect produced by stacked grains, similar to the tiles on a roof (Benn
and Allard, 1989; lld efonse et al., 1992). A skewness in the distribution of orientations may also be attributed to
differences in shape preferred-orientation for grains with differing aspect ratios (Benn and Allard, 1989).
Figure 4.1.6. L~wer contact. chill zon.e (inner extent) f rom a f ine-grain ed sill at the 150 m mark along theMhlatu ze River. The dark, acicular grams are quenched pyroxenes that display a prominent preferred orientationalong the magma transport direction. The plane of the fig ure is parallel to the sill margin.

57·The orientation of pyrite nodule lineations in scour marks along the lower contact of a dolerite sill in the quarry
(Figure 4.14) differs from the alignment of pyroxenes mentioned above by about 600 , suggesting different magma
transport directions in these two cases if the criteria described for recognising flow directions by these methods is
accurate. This suggests that the respective dolerite sills in these two instances represent different intrusive events .
III •••••_._••••••••••••_ ... . .. _•••••_ . .. •
.. _._-_.--.
>.(J
cQJ::l" --- ......_--0'QJ
.'"~
._ .. ._ _ __._.._ _ _ __ ...1 n = 47 1 I .
f-- - .- -- .- .- - - ..- ..-..- - ..-.-.----- - ..--
... -_·_·_-----~_..__··__·_····_···--··- - IZl) •••••• ••• • • _-. . . . . . . . . . . . . . . . . . . •• • •••• ••• •• • _. ••• • ••••••• • • • • • • •• • • • • • • •• • • .. •• - • ••• • ••• • •• • • •• • •• ••• •• •••••••• __• • • •• • •••••••••••• •• • • •• • • • • • • •• • • •• • • • • • • •• _- .
.. - - - - -
., ' .. .. " ., " 11 UlIl'" W l Ull 1» tlA I UiP lID'" no lID---i
Crystal orientations
Figure 4.17. Histogram showing a prominent preferred orientation of 025 '0030 '0 for acicular pyroxenes withinthe chill zone ofa fine-grained dolerite . This is assumed to represent the flow axis orientation. Smaller peaks maybe the result ofa tiling effect (see text).
Benn and Allard (1989) propose a criterion by which absolute flow direction may be determined. In a case where
the shear plane of a sheet intrusion is known (that being the wall of the intrusion) , the obliquity between the
magmatic foliation and the shear plane may be used to infer the magmatic shear sense, and thus the flow direction.
In the case of a sill, this determination would have to be applied to a thin section cut in a plane perpendicular to the
sill margin but parallel to the flow lineations. The shear sense would then be that which would rotate the magmatic
foliation through the smallest angle to he in parallelism with the plane of the sill margin (Figure 4.18). In the case
of the fine-grained dolerite, the determined shear sense along the lower contact, but parallel to the flow lineations is
dextral towards the north-northeast, thus indicating flow to have been in that direction.
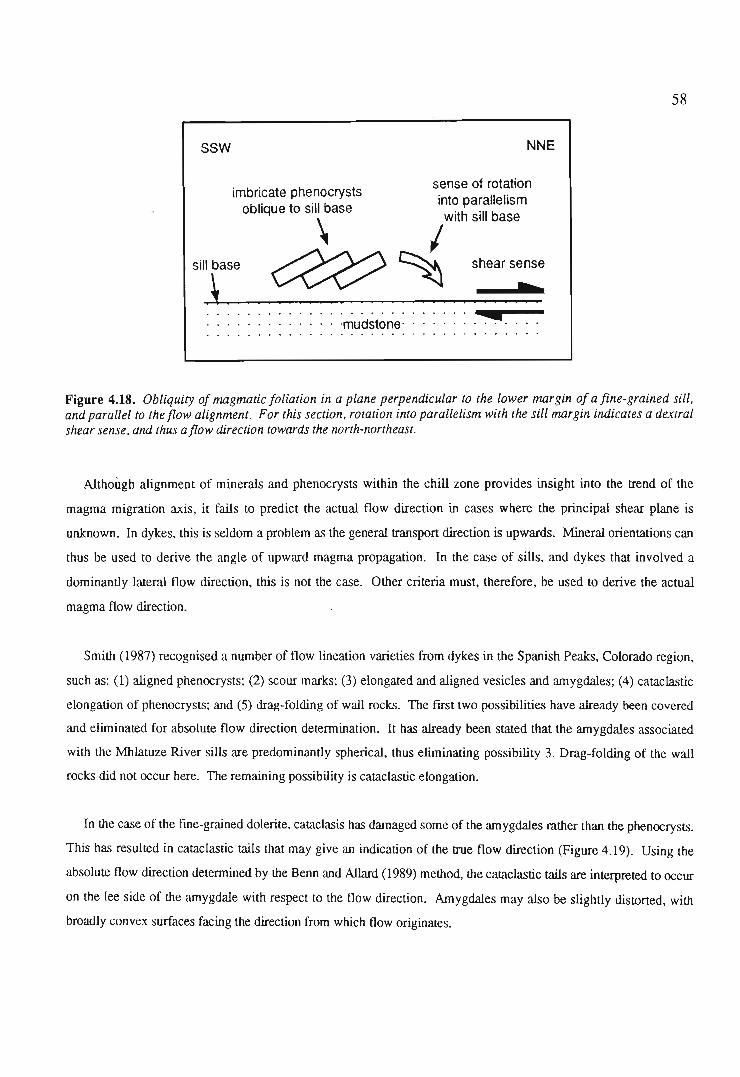
58
ssw NNE
ftp
•
shear sense
rnudstone-
. . sense of rotationImbricate phenocrysts . t 11 I'., In 0 para e Ism
oblique to sill base ith '11 b\ WI SI ase
~~sill base
\
Figure 4.18. Obliquity of magmatic foliation in a plane perpendicular to the lower margin of a fine- grained sill.and parallel to the flow alignment. For this section, rotation into parallelism with the sill margin indicates a dextralshear sense, and thus aflow direction towards the north-northeast.
Although alignment of minerals and phenocrysts within the chill zone provides insight into the trend of the
magma migration axis, it fails to predict the actual flow direction in cases where the principal shear plane is
unknown. In dykes, this is seldom a problem as the general transport direction is upwards. Mineral orientations can
thus be used to derive the angle of upward magma propagation. In the case of sills, and dykes that involved a
dominantly lateral flow direction, this is not the case . Other criteria must, therefore, be used to derive the actual
magma flow direction.
Smith (1987) recognised a number of flow lineation varieties from dykes in the Spanish Peaks, Colorado region,
such as: (1) aligned phenocrysts; (2) scour marks ; (3) elongated and aligned vesicles and amygdales; (4) cataclastic
elongation of phenocrysts: and (5) drag-folding of wall rocks. The first two possibilities have already been covered
and eliminated for absolute flow direction determination. It has already been stated that the amygdales associated
with the Mhlatuze River sills are predominantly spherical, thus eliminating possibility 3. Drag-folding of the wall
rocks did not occur here. The remaining possibility is cataclastic elongation.
In the case of the fine-grained dolerite, cataclasis has damaged some of the amygdales rather than the phenocrysts.
This has resulted in cataclastic tails that may give an indication of the true flow direction (Figure 4.19). Using the
absolute flow direction determined by the Benn and Allard (1989) method, the cataclastic tails are interpreted to occur
on the lee side of the amygdale with respect to the flow direction. Amygdales may also be slightly distorted, with
broadly convex surfaces facing the direction from which flow originates.

.-- ---,9
O.5mm
flow dIrection
cataclastlcN
IJ ~7" I! ~V~ ~ ~ #D
;J ll~ . il I!tf 0 I : .~ fl I #!I
o ~"L ? 7"\.. ~ _ pyroxene• phenocrysts
O.5mm
/
/ /\ tphenocrysts
/
//XI
/ / /
cataclastlc
~a\1I / l /// I I /
/ \'-/; ! / 1 // \ DJ.) .r >:: <q 'q U I / /
/ /
/
//
/
•flow direction
Figure 4.19. Cataclastic tails are inferred to occur on the lee side of amygdales , with respect to the flo w direction .Both examples therefore suggest flow towards the north-northeast. Amygdales may also appear broadly conv ex onthe surface facing the direction from which the flow originates. From the fin e-grained dolerite lower chill margin atthe 150 m mark along the Mhlatuze River.
Another possible method that may be used to confum the criterion used above to determine the flow direction, is
the pattern defined by micro-phenocrysts flowing around larger phenocrysts. Flow disturbance around rigid particles
rotating in a flow is controlled to some extent by the shape and size of the particle (Ildefonse et al. , 1992). Large
phenocrysts that have relatively low aspect ratios (i.e. similar lengths and breadths) exhibit less flow alignment than
more elongate grains. Consequently, the amount of flow disturbance around the phenocryst is frequently enough to
affect the pattern defined by acicular micro-phenocrysts that are generally oriented in the direction of flow. In
particular, the lee side, or "flow shadow" region. of the phenocryst displays a high degree of heterogeneity in the
orientation of micro-phenocrysts in comparison to the edge facing the flow direction , where the micro-phenocrysts
are aligned against the phenocryst edges (Figure 4.20). In general , the "flow shadow" region displays a lower
concentration of micro-phenocrysts compared to the phenocryst edge facing into the flow (Figures 4.20 and 4.21).
The conclusions drawn from the observati on of micro-phenocryst patterns again suggests flow to be towards the
north-northeast in the fine-grained dolerite.

Figure 4.20. Disruption of the flowalignment of acicular pyroxene microphenocrysts in the flow shadow region of afeldspar phenocryst that has beentransformed to myrmekite (M) and chlorite(CHL) . Flow appears to be towards thenorth-northeast . From the fine-graineddolerite at the 150 m mark along theMhlatuze River.
Figure 4.21. (below) Decrease in theconcentration of . plagioclase microphenocrysts in the flow shadow region of ananorthoclase phenocryst in the lower chillzone of the fine-grained dolerite at the 150 m
. mark along the Mhlatuze River. Flow senseis from left to right.

61
4.7 Mechanics of Intrusion
4.7.1 Fingered En Echelon Sills: Discussion
A generalised analysis of the mechanism of sill emplacement was provided in section 3.5. In summary , dykes
intruding the crust form sills at high crustallevels due to the overburden pressure decreasing to a value less than the
magmatic driving pressure (Roberts, 1970; Park, 1989). A propagating sheet intrusion has associated with it an
inelastic process zone about the intrusion tip, and within which small-scale fracturing of the host rock occurs
(Pollard, 1987). The orientation of the fractures, and thus the propagation direction of the sill, is strongly influenced
by the regional stress configuration. Sheet intrusions and associated microfractures are oriented in a plane
perpendicular to the least compressive stress , 0"3c' In the case of sills, 0"3c is vertical and so the resultant
morphology of the sill is dependent upon the relative values of O"lc and 0"2c'
Planar discontinuities such as bedding planes, unconformities, faults, joints and foliations produce host rock
anisotropies that can have a marked effect on an advancing planar intrusion, by acting as preferred propagation
pathways. The Volksrust Formation sediments are reasonably well bedded, possibly suiting sill intrusion. However,
the outcrop pattern of the dolerite sills (Figure 4.3) suggests the initial existence of a number of offset dolerite
segments that became joined at adjacent tips, resulting in the upward stepping attitude presently displayed.
Pollard et al. (1975) documented a sill at Shonkin Sag, Montana, that intruded as a number of fingers along a
common plane, rather than one continuous sheet. Fingered intrusions are visualised as extending away from a
common magmatic front along preferential propagation paths (Figure 4.22). Such paths are likely to be dictated by
regions of reduced minimum compressive stress, host rock anisotropies, pre-existing fractures or stress gradients due
to variable host rock stiffnesses. Although the fmgers are initially eo-planar, progression into a number of slightly
out of parent-crack-plane segments may occur as a result of structural inhomogeneities (Pollard, 1978). The fine
grained dolerite sills along the Mhlatuze River can be interpreted in this manner although there is a consistent
unidirectional sinistral offsetting (Figure 4.3) that has resulted in the sills defming an en echelon array.

62
1-- ~D1RECTION
Figure 4.22. Mechanism of fingered sill intrusion aLong preferentiaL propagation pathways ahead of the mainpropagationfront (after Pollard et aL.. 1975).
Documentation of intrusive en echelon arrays in the literature has thus far principally been in relation to dyke-like
bodies rather than sills. They have been suggested to be inherently associated with the presence of a shearing action
(Lajtai, 1969; Hancock, 1972; Ramsay, 1980; Rickard and Rixon, 1983), whilst Beach (1975) suggested that tensile
en echelon arrays may also occur in the absence of shear zone activity. Pollard et at. (1982) ascribe the formation of
an en echelon pattern to a parent fracture splitting into a number of helicoidal segments within a changing stress
field that effectively resolves a mixed-mode l-Ill stress intensity along the crack edge (Figure 3.10). Multiple crack
production incurs a lesser amount of energy expenditure than would occur if the entire parent crack were to be rotated.
Crack torsion thus induces a re-orientation in a plane perpendicular to the spatially Of temporally variable least
compressive stress direction (Delaney and Pollard , 1981). In the case of sills, this effect would presumably rotate
individual sill segments within the changing stress field resulting in an en echelon array that is discordant with the
sedimentary bedding.
The Mhlatuze River sills are concordant with the sedimentary bedding. It is, therefore , unlikely that the present
arrangement of sinistrally offset, bedding-concordant sills arose in the field of a rotating stress configuration. TheXI
consistent sinistral offset (as in Fig. 4.3) and lack of any apparent parent-crack pLane negates the probability of the
sills having formed as simpLedeviation s from a eo-planar attitude induced by structural inhomogeneities or host rock
anisotropies.
It needs. therefore. be asked whether or not intruding sills have the ability to produce true en echelon arrays as
defined for dykes , propagating as bedding-concordant fingers (in the case of sills) ahead of a common parent
magmatic front and then rotating out of the plane of the parent crack. Consistently offset sills that display an en
echelon morphology in cross section. but where each array segment is bedding-concordant. are thus not necessarily
true en echelon features as defined above . This author has not encountered any definite documented cases of en
echelon sill segments that have been emplaced discordantly with sedimentary bedding planes, as would be expected in

63the instance of a rotating regional stress field along the propagation length of an initially bedding-concordant
intruding sill. Harley and Charlesworth (1991) document an "imbricate-like" diabase sill array from the eastern
Transvaal. The array is associated with deformed host rocks and a degree of shearing between adjacent sill segments
induced by a changing stress field that has resulted in the segments producing a highly overlapping en echelon
appearance and an apparent discordance with surrounding strata. These authors, however, did not consider the
possibility of the array being a syn-fracture-growth development affected by stress fluctuations associated with syn
Bushveld Complex tectonics, but rather a post-sill-emplacement deformation feature.
Where en echelon sill segments are bedding-concordant, it must be assumed that either bedding planes or a pre
existing set of en echelon fractures, more conducive to magma injection than bedding planes, preceded the formation
of the en echelon sill array.
Olson and Pollard (1991) propose that en echelon fracture initiation occurs as a result it being the most effective
mechanism for crack propagation because the associated mechanical fracture interaction promotes growth. The
propagation of fingered sills along such fractures implies that the fractures in the en echelon array dilate
simultaneously, with linkage of adjacent tips being a later effect due to tip-stress interaction and resultant tip
curvature. This is in accordance with the proposal by Pollard et al. (1975) that magma propagation occurs along the
length of an offset surface.
From the above discussion, it is proposed that two distinct varieties of en echelon arrays occur (Figure 4.23). The
first variety involves intrusion into a region undergoing a resolved simple shear stress, due to a rotation of the
regional stress configuration, resulting in the breakdown of the periphery of a sheet intrusion into a number of
segments or fingers that rotate out of the plane of the parent fracture, tracing out a helicoidal surface. The ultimate
effect is to re-establish an equilibrium situation where the individual segments are once again oriented perpendicular
to the least compressive stress, as proposed by Delaney and Pollard (1981). This mechanism is applicable to en
echelon dyke segments associated with a shear zone. In the case of sills, the resultant en echelon array should
theoretically occur emplaced discordantly with horizontal sedimentary bedding, assuming the parent fracture to be
bedding-eoncordant.
The second variety involves the formation of an en echelon array, the individual segments of which do not
undergo any rotation out of the plane of the parentfracture. The periphery of the sheet intrusion either breaks down
into a number of segments or fingers that propagate ahead of the parent fracture in an en echelon manner, or
segments intrude a pre-existing set of en echelon fractures that are susceptible to intrusion and dilation.
Alternatively, the individual fingers of the array may be derived from individual sources, rather than from the break
down of a single parent fracture. These too would intrude in an en echelon manner in the presence of a pre-existing
en echelon fracture array. The occurrence of this pre-existing array is in accordance with the proposed method of
efficient fracture growth via an en echelon geometry (Olson and Pollard, 1991). This mechanism is applicable to
both dykes and sills that have intruded en echelon arrays of vertical and horizontal fractures respectively.

B.
64
It must be noted that discordance and concordance with sedimentary bedding exhibited by sills that formed via the
two proposed mechanisms respectively, is only applicable where the parent sill is bedding-concordant En echelon
fingers propagating from the periphery of such a source would thus be bedding-discordant via the first mechanism,
and bedding-concordant via the second mechanism (Figure 4.23). In the case of the Mhlatuze River en echelon sill
array, it can be concluded that mechanism B produced the existing sill geometry. Furthermore, it seems likely that
it is the most common mechanism of en echelon sill formation. Offset fingered intrusions may develop without the
presence of a pre-existing set of fractures too, however they are likely to be characterised by the occurrence of host
rock deformation at the leading edge of the fingers , as well as in the cusp region separating adjacent or offset sills
(Pollard et al., 1975).
Figure 4.23. Two proposed mechanisms for theformation of an en echeLon sill array. (A). The A.periphery of the bedding-concordant parentsill breaksdown into a number of helicoidal segments thatrotate in a changing stress field to produce an enecheLon arrayofbedding-discordant segments. (B). Apre-existingen echelon array offractures is intrudedanddilated to produce"an en echeLon array of beddingconcordant sills.
4.7.2 Sill Linkage
Nicholson and Pollard (1985) recognise two end-
member situations for dilating en echelon fractures
that have linked together (refer to section 3.7 .3).
They are essentially geometrically defined, with one
end-member exhibiting straight propagation paths
and the other curved paths. Where propagation paths
of adjacent fractures remain relatively straight. cross
fractures develop through intervening bridges and
linkage results in increased dilation and bent bridge
formation. Thin offshoots on one or both outside
edges of the offset intrusions are called horns. Where
pronounced crack curvature occurs, crack tips simply propagate into the inside edge of the adjacent fracture resulting
in linkage, increased dilation, and rotated bridges that are relatively unstrained.
The cross-section along the Mhlatuze river (Figure 4.3) suggests that for conditions where adjacent sill segments
had high vertical and/or lateral separations, linkage occurred via an inward curvature between adjacent offset sills that

65linked tip-to-tip. In places where fractures were closely spaced or overlapping, however, increased sill interaction has
resulted in the production of abrupt offsets. horns and bent bridges where the propagation paths were straight, and
tip-to-plane linkage with rotated bridge development where the propagation paths were curved. Such features occur
in close proximity to the 135 m. 615 m, 670 m and 1120 m positions along the river. The development of the
features at the 670 m mark may be interpreted in terms of bridge fracture and failure (Figure 4.24). The existence of
closely associated bent and rotated bridges places the Mhlatuze River array of sills between the two end-member
states of Nicholson and Pollard (1985), the occurrence of which thus appears to be attributable to the extent of initial
fracture spacing, measured both perpendicular and parallel to the long axis of the sills as seen in two dimensions.
Rotated bridges of rnudstone host are frequently notably strained and deformed. contrary to the inference of Nicholson
and Pollard (1985) that curved propagation path end-member rotated bridges are not significantly strained.
Figure 4.24. Dilation history of the fine-grained doleritesill near the 670 m mark (Figure. 4.3) . (A) Initial crackgeometry. (B) Initial dilation. (C) Tip-to-tip linkage of nonoverlapping segments. (D) Present morphology after bridgefracture and increased dilation.
Between the 1115 m and 1125 m marks (Figure 4.3), a
rotated mudstone bridge was split along fissile-sediment
partings by intruding magma on three occasions, resulting in
three isolated.xenoliths of mudstone in the dolerite adjacent to
the remnant of the rotated bridge. This is probably a localised
in situ effect along the three-dimensional length of the rotated
bridge. in order to have produced the exhibited bridge-affiliated
geometry of the xenoliths.
D.
c.
Linkage induced by crack curvature is explained in terms of
the local stress conditions at the crack tips (section 3.6.2).
Where offset cracks occur, the stress fields associated with
adjacent tips interact. The dilation of one of the cracks
resolves a shear stress on the surface of the other (Olson and
Pollard. 1989). This results in the rotation of the a r 1
(maximum tensile or least compressive) trajectories which, in
turn, induces a curvature in the crack paths, thus minimizing
the shear stress and maximizing the tensile stress across the
propagation paths. Crack convergence may be preceded by an
initial amount of divergence as a result of the initial resolved
shear sense on the crack surfaces. Divergence of interacting
B.
A.
OVERLAP

66cracks causes a reversal in the resolved stress sense, rotation of the maximum tension about the tip, and curvature in
towards the adjacent crack. Linkage tends to be tip-to-plane rather than tip-to-tip (pollard et al., 1982), although this
is not consistently true for the Mhlatuze River sills because of the extent of both lateral and vertical offset of
adjacent en echelon sill segments in places, as previously outlined.
Olson and Pollard (1989) interpret the state of stress between offset adjacent vertical fractures in terms of the
renwte regional compression .10 = SH - Sh' where SH and Sh are the maximum and least compressive stresses
respectively, and measured in the plane perpendicular to that containing the crack (section 3.6.3). They conclude that
extreme curvature occurs under tensile conditions (.10 < 0). The amount of curvature then decreases steadily through
isotropic conditions (.10 = 0) into situations where SH is dominant (.10 > 0), eventually attaining an asymptotic
propagation trend. The exact fracture behavior will also be a function of the driving pressure and the host rock
fracture strength. The applicability of Olson and Pollard's (1989) analysis to sills remains untested, however, if the
same principles apply, the amount of curvature exhibited by the Mhlatuze River sills would require stress conditions
approaching isotropy. These are the proposed conditions under which sill emplacement occurs (Price and Cosgrove,
1990, p76).
4.8 Discussion and Intrusion Reconstruction
In order for the previously discussed effects of adjacent, en echelon fractures and intrusions to beapplicable to the
sills under investigation, it must be shown that separate en echelon fingers dilated simultaneously, interacted and
consequently joined. This is necessary as sills have been documented stepping upwards in the direction of
propagation. Such an effect may be induced by parameters such as crusta! flexure, differential compaction or
variations in the mechanical properties of host rocks (Gretener, 1969), or due to topographical variation (Bradley,
1965).
In the case of the Mhlatuze River sills, it has already been concluded that propagation and flow occurred
approximately towards the north-northeast. This gives credence to the proposal that propagation occurred..
orthogonally to the plane containing the en echelon pattern, with simultaneous dilation of the sills, followed by later
linkage to produce the present morphology. Propagation along the offset surfaces (Pollard et al., 1975), which
would be expected for the case of linked en echelon fingers (see Figure 3.15), was confmned via the similarity
between the flow direction and strikes of offset edges. Furthermore, magma emplacement in an en echelon pattern
accounts for the plethora of linkage-related features that occur.
Magma emplacement occurred as at least two intrusive events, with the initial phase involving a greater volume
of magma and producing sills with a considerably greater thickness than the subsequent fine-grained dolerite sills
with enclosed xenolithic dolerite. The first phase of intrusion cannot accurately be described as en echelon on the
basis of the Mhlatuze River outcrop scale. The coarse-grained sills are too massive for any large-scale geometrical
morphology to be recognised. The fine-grained phase, however, can beconfidently classified as being geometrically

67en echelon. The fractures dilated by the fme-grained phase may have been activated within the process zone of the
initial phase. This would explain why these fractures were not initially dilated by the coarse-grained phase. As
previously mentioned, Figure 4.3 illustrates a fine-grained sill contained within a coarse-grained sill at the northern
end of the traverse. This mechanism of multiple intrusion has been described for dyke swarms (eg. Saggerson et al.,
1983), but may be an indication of horizontal crustal tension and is thus not directly comparable to multiple sill
intrusion. The existence of a zone of incomplete crystallisation within a sill may act as a plane of weakness for a
subsequent intrusive phase, thus producing a composite sill. However, near the 130 m mark (Figure 4.3), there is a
zone of offsetting characterised by both a bent and a rotated bridge, suggesting brittle behavior in the earlier sill
during intrusion of the fine-grained phase. Furthermore, this region of bridging contains a deformed granitic vein
which is post-coarse-grained but pre-fine-grained dolerite in age (Figure 4.4), indicating a significant time break
between these two intrusive phases. Nevertheless, there was some factor that induced a preferential intrusion into the
earlier sill rather than into the relatively weaker fractured mudstone host. Horizontal cooling joints occur in the
coarse-grained sills and may, therefore, have acted as planes of weakness during the second phase of intrusion.
It has already been proposed how the field relationships between the xenolithic and fme-grained dolerite types
suggests the former to be an early association of the latter. Although the xenolithic dolerite is totally enclosed
within the fine-grained dolerite, suggesting intrusion of the former into the latter (as with the composite sills at the
northern end of the section), field observation indicates that the fine-grained dolerite has chilled against the enclosed
xenolithic dolerite blocks. The xenolithic dolerite thus pre-dates the fine-grained dolerite. In no instances are any
field relationships between the xenolithic and coarse-grained dolerite exhibited, however, the 350 m mark along the
section (Figure 4.3) reveals an arrangement of xenolithic dolerite enclosed within the fine-grained dolerite, which
itself has intruded into the coarse-grained dolerite sill. It is therefore assumed that the xenolithic dolerite post-dates
the coarse-grained dolerite, having intruded as an early association of the fine-grained phase. This is credible under
the proposed model of emplacement mechanics involving the propagation of a number of fingers of dolerite ahead of
the main magma sheet It is proposed that the tips of the advancing fingers of the fine-grained dolerite phase became
concentrated in a xenolithic component, derived via stoping of intruded host rocks or alternatively due to the feeder
dyke to the sill having passed through a major active fault zone at depth (McCarthy, 1979). The granite gneiss
xenolithsare most common and are derived from the local basement, but xenoliths of sedimentary origin also occur.
Graphite xenoliths probably formed from incorporated fragments of coal derived from the Vryheid Formation coal
seams. Frankel (1969) stressed that a basaltic melt would have to contribute such a large amount of its latent heat of
crystallisation during the assimilation of a large amount of crustal material , that very little of its original mass
would remain as liquid. The amount of Si02 that a basaltic melt can digest is strongly influenced by the temperature
of the melt and the surface area of the incorporated granitic block (Watson, 198Z). There is evidence of partial
melting and a degree of liquid immiscibility, and the low diffusivities of SiOZ and AlZ03 further promoted
preservation of the partially molten xenoliths as pods of unassimilated material in the magma. The general flattened,
elongate appearance of the xenoliths may have resulted from re-crystallisation under conditions of compression plus
extension. This would occur in the zone between the lines of no finite longitudinal strain and no infinitesimal
longitudinal strain on a simple shear strain ellipse (zone 2 of Ramsay, 1967), and is assumed to be associated with

68simple shear induced by increasingly viscous magma flow near the propagating sill tip.
A disadvantage of fingered intrusions is the rapidity with which heat may be lost to the country rock. In the case
of ,the Mhlatuze River sills, the proposed scenario is that the xenolith-rich tips of the dolerite fingers lost a
considerable amount of latent heat in the partial assimilation of xenolithic material and by cooling against the
country rock fairly early during intrusion. This cooling is demonstrated by the marked decrease in grain size of the
xenolithic dolerite blocks from centre to margin. This effect became a hinderance to propagation by increasing the
magma viscosity. The tips of the fingers thus effectively began acting as plugs (Figure 4.25), with magma pressure
causing a build-up of uncontaminated magma behind the xenolithic plugs, perhaps also inducing the deformation
bands within. This resulted in widening and dilation of cracks or bedding planes in the process zones of the fingers,
and the xenolithic plugs were subsequently overtaken by the magma, which chilled against the xenolithic portion.
The xenolithic blocks thus became isolated within the magmatic flow which cooled around it to produce the fine
grained dolerite. Some xenoliths were plucked away from the enclosed blocks resulting in the presence of isolated
xenoliths distributed randomly within the fine-grained dolerite. This may be the equivalent of the "Effingham-type"
dolerite documented by McCarthy (1960; 1979), Frankel (1969) and Absolom (1970).
A.
B.
xenoliths concentratedat sill tip
lractunng inprocess zone
c.
xenolithic tip coolsagainst host rock andimpedes propagation
magma bypassesxenolithic block
and chills against it
, - -
Figure 4:25. Origin of the xenolithic dolerite blocks within the fine-grained dolerite. The xenalith-concentratedpropagation fron,t of the fingered fine-grained dolerite intrusive phase (A) cooled against the host rock. impedingmagma prop.ag~tlOn (B). Magma driving pressure build-up behind the obstruction led to bypassing and incorporationof the xenolithic block (C).

69The base of the 15 m thick dolerite sill in the RBQ quarry (Figure 4.11) contains xenolithic dolerite encapsulated
within fine-grained dolerite, but exhibiting a marginal wedge of deformed mudstone between the xenolithic dolerite
and the enclosing sill. This provides evidence of the xenolithic dolerite having initially contacted against
sedimentary host rock before being engulfed by an advancing magmatic front. In this case, the sediment against the
contact was also preserved when the main magma pulse bypassed the xenolithic tip.
A close examination of Figure 4.3 indicates an apparent change in the morphology of the sills in cross-section
near the 450 m mark along the traverse. This is a result of a bend in the course of the Mhlatuze River at this point
(Figure 4.1). From the 0 m to the 450 m mark, the river flows south-southwest, but then curves around to a
southeasterly orientation beyond the 450 m mark until the 1250 m mark. from which point the river flows
approximately eastwards. Used in conjunction with the determination of the propagation and magma flow direction
of the sills. it can be seen that the river course is only oriented at a high angle to the sill propagation direction
beyond the 450 m mark. which is thus the only extent of the traverse that exemplifies the en echelon nature of the
sills. Before the 450 m mark the river cuts through the sills at a shallow angle to the propagation direction, and this
causes the sills to appear laterally wider than beyond the 450 m mark (Figure 4.26) . The Mhlatuze River section
thus provides an example of how the true morphology of a sheet intrusion may be misconstrued if the section
orientation is not properly visualised in conjunction with the three-dimensional morphology of the intrusion.
B.
Figure 4.26. S~mplifi~d three-dimensional representation of the fine-grained sills (shown prior to linkage) alongthe M.hlat.uze RIver. with respect to the tre~d of the river bank. The 0-450 m range of the traverse intersects thed~lente SIlls ~t a low angle to the propagation and magma flow direction , resulting in an increase in the apparentWidth of the s~ll when compared.to the en echelon segments beyond the 450 m mark. All other geological featureshave been omitted for better clarity.

70
4.9 Application of Fracture Mechanics Equations
The interpretation of the intrusion mechanics of the Mhlatuze River dolerite sills as presented above can now be
complimented and compared with some geometrical and mathematical applications using documented formulae and
defmitions as presented in Chapters 2 and 3.
The en echelon morphology of the sills is defined by a number of sill fmgers or segments that linked together in
the later stages of dilation. The geometrical parameters defining en echelon intrusions are given by Pollard et al.
(1982) and Nicholson & Pollard (1985) as width 2b, dilation 2a, separation 2s, overlap 20, centre spacing parallel to
the array axis 2e, centre spacing parallel to the cracks 2k, twist angle ID, and array width 2B (see Figure 3.14). The
Mhlatuze River fine-grained dolerite sills do not display consistent values of these parameters, as the values vary
from sill to sill. Ranges of respective values for sills outcropping from 320 m to 900 m along the river section
(Figure 4.3) are calculated to be:
2b: 120m - 170m2d: 2m - 5m2s: 18m - 36m2c: 114m - 190m2k: 1l0m - 187m(J): 110
For the above estimates, the dolerite from 580-750 m along the section (Figure 4.3) has been approximated as
being equivalent to one sill segment in the array, despite a number of relatively minor offsets along its width.
Values of the geometrical parameters for the northernmost fine-grained dolerite along the section have not been
included because the three-dimensional attitude of the river bank with respect to the sill in this region of the section,
as discussed previously, would result in false representations of the true values. The value of 2B can not be
evaluated from the river outcrop, as the full extent of the en echelon array is unknown. There is no overlap of sill
segments, therefore 20 = O. The value of 110 for (J) is almost identical to the dip of the sedimentary bedding. This
similarity, existing in conjunction with the shallow gradient of the river explains why the en echelon geometry of
the sills is demonstrated with such clarity along the river bank. If either _ or the river gradient had been considerably
larger, the exposed en echelon geometry as observed along the river bank would have been lost
The range in values for most of the geometrical parameters of the sills implies that the Mhlatuze River sill array
does not involve an ideal situation of dilated en echelon fractures . Nicholson and Pollard (1985) proposed the use of
these parameters for intrusions with straight, rather than curved propagation paths. It has already been suggested that
the sills may represent a situation intermediate between the two end-member types of Nicholson and Pollard (1985).
Furthermore, much of the theoretical analysis by authors such as Pollard are derived within homogeneous brittle
elastic media. The intruded sediments along the Mhlatuze River are not homogeneous; anisotropies are provided by
bedding planes and possibly differential stress gradients produced by previous, localised intrusions. These effects
have detracted from the theoretical behavior of the sills, however, the overall geometry compares well with

71theoretical predictions of effects such as linkage, suggesting the sill-tip stress distributions to have obeyed theoretical
predictions despite the presence of anisotropies. It is, therefore, suggested that theoretical observations and
mathematical applications, such as described in Chapters 2 and 3, may have significant application to geological
situations such as the Mhlatuze River sill array, where deviations from ideal conditions are encountered.
Mathematical applications for the Mhlatuze River sill array will, therefore, be attempted and evaluated for
applicability.
Values for the geometrical parameters of the fme-grained dolerite array may be utilised to estimate intrusion
related characteristics such as the magma driving pressure and strain imparted to the intruded host rocks. Pollard
(1987) provides a relation by which magma driving pressure (P - S) may be estimated (refer to section 2.2.4) using
the geometrical parameter thickness-ta-length ratio t/l, and the physical constants Poisson's ratio u and elastic shear
modulus u:
t (P - S)-::::
1 ~/(1-u)(4.1)
The sill thicknesses, t, (dilation) were listed previously as 2a, and the lengths, 1, (as defined for 4.1 by Pollard,
1987) are the equivalent of the parameter width, 2b. Thickness-to-length ratios of the sills vary from 0.0173 to
0.0287. Using a reasonable estimate for shales of u "" 0.15 for Poisson's ratio (Carmichael, 1989) , and a shear
modulus of 1.4 X 10¹⁰ (Turcotte and Schubert, 1982), the driving pressure values have an estimated range of 2.9 _
4.7 X 10⁸ Pa.
Gudmundsson (1990) gives an equation for the evaluation of driving pressures for dykes:
W E(P - S) = L' 2(1- 1)2) (4.2)
In this case , the width-to-length ratio W/L is the equivalent of the thickness-to-length ratio t/l in (4.1), and Eis
Young's modulus. Applying (4.2) to the Mhlatuze river sills , using E =0.2 X 10¹¹ Pa (Turcotte and Schubert,
1982), the estimated driving pressure range is 2.0 - 3.4 X 10⁸ Pa. These values are slightly lower than those
obtained via (4.1), but still in the same magnitude range.
An important point to note is that the effect of pre-existing fractures or bedding planes prior to magma intrusion
probably result in equations 4.1 and 4.2 producing slightly over-estimated values for P.
When such equations are used, care must be taken insofar as the parameter nomenclature is concerned. Pollard et
al. (1982) and Nicholson and Pollard (1985) define the long axis of the intrusion in cross section as width 2b, and
the short axis as dilation 2d. Pollard (1987) labels the long axis as length 2a and the short axis as thickness 2b.

72Gudmundsson (1990) labels the short axis width W and the long axis length L. The adoption of a standard
nomenclature would obviate confusion arising from such inconsistencies. It is proposed, therefore, that the
parameters be named using the terms width for the long axis (in cross section), and thickness or dilation for the short
axis . The term length should be reserved for the longest axis in the third dimension, with respect 10 the plane of the
cross section.
The calculated value for the magma driving pressure .(P - S) may be used to estimate the amount of strain
imparted 10 the host rock during intrusion (Pollard, 1987) using the equation:
(4.3)
(section 2.4) where 2a is the long axis width of the intrusion. From (4.3), the estimated strain energy imposed 10
the host rock mudstones is 3.6 X 10¹⁰ N m-I (using 2a = 130 m and (P-S) =3.0 X 10⁸ Pa). Again, this is
probably an overestimate. As the fractures were probably pre-existing, the strain imparted upon the rock resulted in
widening of the fractures rather than creation of them. This deviation from theoretical experiments in isotropic
elastic media may be the cause of the range in sill widths and thicknesses.
The overburden stress O'z imposed on the Volksrust Formation sediments at the time of dolerite intrusion can be
estimated using the formula O'z =pgz, where p is the density of the overlying stratigraphy, z is the depth in the
crust, and g is the acceleration due to gravity. The local stratigraphy is tabulated as Table 4.2, with sedimentary unit
thicknesses as documented by Wolmarans and du Preez(1986) and Linstrom (1987) .
GROUP FORMATION AGE THICKNESSLebombo Letaba basalt Jurassic 3600 m
Clarens Triassic 45 mNvoka Triassic 250-285 m
Ntabene Triassic 200-260 mBeaufort Emakwezini U. Permian 380 m
Ecca Volksrust Permian 200 m
Table 4.2. Estimated thicknesses of the presumed local stratigraphic succession at the time ofdoleriteemplacement within the Volksrust Formation.
Using the stratigraphic thickness data in Table 2, two variations of the overburden stress may be estimated: either
excluding or including the great thickness of extruded basalts. Using approximate densities of 2400 kg m-3 for the
sedimentary package and 2740 kg m-3 for the basalts (Turcotte and Schubert, 1982; Carmichael, 1989), the
overburden stress is approximately 2.53 X 10⁷ Pa if the basalts are excluded, and 1.2 X 10⁸ Pa if the basalts are
included. Despite which of these values is more accurate, a notably higher value was obtained for the magma driving
pressure. This could be taken to suggest that extrusion had begun at the time of sill emplacement in this vicinity,

73as the overburden stress may have been too small to prevent magmafrom reaching the surface. Alternatively, the
existenceof a fracturearray that precededmagmainjectionmaybean indicationthat the calculateddrivingpressure
was overestimatedslightly,as suggestedpreviously. Nevertheless, an increase in the driving pressure to a value
greater than the overburden stress certainlyprompted the developmentof sills in this region of the stratigraphy,as is
adequately demonstrated by the theoretical equationsfor fracture in homogeneous brittle-elastic media.
4.10 Dolerite Geochemistry
IMineral geochemical data were obtained via electron microprobe analysis, and is listed in Appendix 3. The
whole-rock volatile-free analyses (Table 4.3) represent various positions through the dolerite sills. Samples were
analysed by XRF at the Department of Geochemistry at the University of Cape Town, using the method and
detection limits described by Duncan et al. (1984). In this section, the geochemicaldata are displayedprincipally in
the form of graphical plots, with interpretations provided in the text. The main objective of the geochemical
evaluation is to develop another method of distinguishing between intrusivephases of different ages as this can assist
in the interpretationof the intrusion mechanics.
4.10.1 Mineral Geochemistry
(A) PLAGIOCLASE:
The plagioclasedata for the doleritesare representedon anorthite-albite-orthoclase ternary diagrams(Figure4.27),
showing variations from cores to rims. The margins of the thick, coarse-grainedsills are medium-grainedcompared
to the sill centres. As crystallisation in a sill initiates at the sill margins, and progresses inwards, the medium
grainedmarginaldolerite crystallisedbefore the central coarse-graineddolerite. Plagioclasecompositions are similar
throughout the coarse-graineddolerite, and so mineral variations from sill margins to centres are not apparent. This
is demonstrated by the orthoclase versus anorthite graphs for the plagioclases (Figure 4.28) which show different
trends in the fme-grained and coarse-graineddolerites. The similarityin the plagioclase compositionsthroughoutthe
coarse-graineddolerite sill may be the result of renewed magma influxes into the cooling sills, negating the expected
crystallisation trend of decreasing An content of the plagioclasesfrom sill margins to centres. A trend of decreasing
An and increasing Or content of plagioclases from cores to rims throughout the coarse-grained dolerite defines an
upward movement from right to left across the graph. This reflects the core-to-rim compositional zoning that occurs
in individual plagioclase grains. Small grains in the groundmass tend to plot higher along this trend towards the
left, as a result of late crystallisation.

74
Figure 4.27. Anorthite-albite-orthoclase diagrams for plagioclase crystals in the do/erites. Variations from coresto rims are as indicated. (a) Coarse-grained dolerite (margins). (b) Coarse-grained dolerite (centres) . (c) Fine-graineddolerite.

75
Or ('Ko)4
3.5 "3 " "",
2.5
2
1.5
0 .5
75706550 55 60An (%)
4540
oL-_--L-_---'-__...L-_---'-__"----_-'-_----''--_...J
35
Figure 4.28. OrthocLase versus anorthite graph showing differences between the fine-grained dolerite and coarsegrained dolerite plagioclases. The variationfrom cores to rims in the latter are as indicated.
Although Figure 4.28 does not demonstrate identifiable mineralogical compositional variation from sill centres to
margins in this example, there is a noticeable difference between the fine-grained and coarse-grained sill plagioclase
compositions. The fine-grained sill plagioclases have higher Or values and a smaller An range. Figure 4.28 is,
therefore, effective at differentiating between sills of varying ages.
A number of profiles through various plagioclase grains are shown in Figure 4.29 for Si02, Al203, CaO and
Na20. The general trend is a normal zoning decrease in CaO and Al203, and an increase in Si02 and Na20 from
the cores to the rims of the plagioclase grains. There are, however, a number of exceptions to this trend, as
indicated. This is apparent in the plagioclases from the central portion of the coarse-grained sills. Normal zoning
trends near the plagioclase cores have reverse zoning trends superimposed at the grain rims. This again may be
indicative of renewed magma influxes producing oscillatory-zoned plagioclases. This effect is less common for the
sill margin plagioclases due to crystallisation termination prior to later magma influxes into the sill centres. Trends
in the fine-grained dolerite plagioclases are more difficult to define as a result of grain-size considerations. Basic
normal zoning profiles are recognisable.

76
)
a \l...... .n
N
'" J...
:!
o........
~ fl ~ ~
!
)'"
(~~ ~N 0",
Z :<%
··C
~'" °'"z i.! .~ ~
! ~
~~
e. ~ .~
k 0
! ~~ '-' u
......
s: :> 1; Cl ~ " ~ ;!, :;\~
~'"!
~
0", '"':N ON'"
0",
C z: ;;: % :<
• .!"C
! i -.~~
C. ~
~! c; 0
!~
J u '" u
•·C
~'"0..~
C z %:;
! •"C
j ~
1 ~~
~ ~ ~ a '"~ ~
.. 0u u VI
~
X $, ::l r. '.'J s J, :)I
Figure 4.29. Core to rim zoning of dolerite plagioclase grains.

77
(B) PYROXENE:
Enstatite-ferrosilite-wollastonite ternary diagrams have been used to indicate the pyroxene compositions in the
various dolerites (Figure 4.30) . Orthopyroxene plots towards the base of the diagram, in the range En60-80. The
core to rim trend in orthopyroxene is shown by a movement towards the ferrosilite corner. Clinopyroxenes generally
plot near the centre of the triangle, in the field of augite, as defmed by Deer et al. (1966) , although early pyroxenes
near the coarse-grained sill margins are more iron-enriched, plotting closer to the Fs corner. The apparently random
compositional variations from cores to rims in many of the pyroxenes is not in accordance with the expected En
decrease caused by movement down the solvus isotherms, such as described by Lindsley and Anderson (1982) for co
existing clino- and orthopyroxenes. The coarse-grained sill centres exhibit normal zoning trends but the sill margin
pyroxene trends are more erratic, perhaps due to rapid crystallisation along the margins, or later superimposed
alteration effects.
Core to rim variations are totally random in the fme-grained sill, suggesting a disequilibrium situation. Separate
fields of pyroxenes for the dolerites are demonstrated by the relative atomic proportion plots of A13+ versus Mg2+
(Figure 4.31) and Ti4+ versus Mg2+ (Figure 4.32). The latter figure shows the higher titanium content in the fine
grained dolerite pyroxenes with respect to the coarse-grained dolerite. Sill margin to centre mineral compositional
variation in the coarse-grained dolerite is more apparent in the pyroxene data than the plagioclase data described
previously.

78
A) COARSE-GRAINED (MARGIN)
En
En
..
to
B) COARSE-GRAINED
80
C) FINE-GRAINED
e cores• rims
10
80
70
'"
60
AUGIT~.
'----:-
Wo-<}.
FERRO-AUGITE
10
10
10
10
Fs
Fs
Figure 4.30. Enstatite-ferrosilite-woliastonite diagrams showing pyroxene compositional variations in thedolerite sills. Core to rim variations ofspecific grains are indicated by solid connecting lines.

79
AI (3+)0.12 r----------------------------,
0.1
0.08.;.
orthopyroxenE
0 .06
0.04o
n
.;.c
c
-i-
.;. +a.;. 01-.;. ltJ
0 .02
1.61.41.20.6 0.8
Mg (2+)0.40.2
ol-_----.!__---l.__---"-__-L__-L-__-l.-__...L-_-----l
o
Figure 4.31. A13+ versusMg2+for pyroxenesin the dolerites. Separate fields for thefine-grained and centre andmargin coarse-grained types areapparent. + = coarse-grained dolerite. 0= coarse-grained margins. 0 «fine-graineddolerite.
Ti (4+)0.05 r----------------------------.,
0.0400
0.03
%0cllnopyroxene?
0.02
0.01orthopyroxene
+ .;.:i:~
.;.
1.61.41.20.6 0.8
Mg (2+)0.40.2
oL---.L.---....l.-__....L-__---L__---l..__--l .L.-_----I
o
Figure 4.32. Ti4+ versus Mg2+ for pyroxenes in the dolerites. The variousfields for the dolerite divisions areapparent. Note the highertitanium valuesin thefine-graineddolerite pyroxenes. Symbols are as in Figure4.31.

80
4.10.2 Wbole-rock Geocbemical Evaluation
The whole-rock volatile-free XRF analyses (Table 4.3), which represent various positions across the thickness of
the dolerite sills, show that the dolerites under investigation are enriched in silica (55-56%) compared to the whole
rock values of 52.5% for the average Karoo dolerite (Walker and Poldervaart, 1949). They are comparatively depleted
in MgO and CaO, reflecting the absence of olivine. An exception is the xenolithic dolerite (53.09% SiOV, which is
has a more "Karoo-like" whole-rock geochemistry, although it is slightly MgO-enriched and CaO-depleted.
Overall, the composition of the dolerites is typical of the "normal" Karoo basaltic magma type found along the
southern Lebombo (Cox et al., 1967; Sweeney and Watkeys, 1990). Geochemically, the dolerites fall into the
basaltic andesite field, except sample SK91-8 (from the centre of the fme-grained sill) which lies in the andesite field
(Figure 4.33). The latter is a silica-rich fractionation end-product of the fine-grained sill. Whole-rock geochemical
analyses can determine multiple intrusion phases where visual discrimination is difficult. This is demonstrated by
the variation in major and minor elements plotted across the composite sill at the northern end of the river traverse
(Figure 4.34). The position of the fine-grained sill approximately one quarter of the way up from the base of the
coarse-grained sill is obvious. Removal of the fine-grained sill from the profiles would cause the lower and upper
coarse-grained divisions to match up almost perfectly, thus demonstrating their initial correlation before the fme
grained phase intruded. The data may be an indication that the fine-grained dolerite is more evolved than the coarse
grained phase. The differences, however, are accentuated by the effect of quartz and potassic feldspar concentration
towards the centre of the fme-grained sill, as well as pyrite concentration along the margins.
The major element concentrations are plotted against MgO in Figure 4.35. The dolerite types are clearly
recognisable. The centre of the fme-grained dolerite sill is characterised by lower MgO values than the margins,
whereas the trend moving from the margin of the coarse-grained dolerite sill towards the centre, is one of increasing
MgO values. The xenolithic dolerite has a much higher MgO concentration than the other dolerites. The trace
elements La, V, Ba, Rb, Sr and Zr are plotted against MgO in Figure 4.36.

81Table 4.3. Whole-rock geochemistry of dolerites between 0 m and 200 m along the Mhlatuze River traverse (Fig.4.3). Major element oxides are in weight %; trace elements are in parts per million.
Sample: SK91-3 SK91-4 SK91-S SK91-6 SK91-7 SK91-8 SK91-9 SK91 -11 SK91 ·12 SK91-13 SK91-1S Ave.Karoo
Si02 55.69 55.86 55.73 55.71 55.70 61.51 55.86 55.63 55.34 55.23 53.09 52.5Ti02 1.20 1.21 1.20 1.12 1.33 1.70 1.36 1.02 1.04 1.04 1.26 1.0
AI203 14.61 14.66 14.71 14.99 14.69 13.35 14.56 15.38 15.19 15.09 15.75 15.4Fe203 11.23 10.66 10.66 10.51 11.29 10.58 11.24 9.84 10.12 10.14 10.82 11.5MnO 0.16 0.15 0.15 0.15 0.18 0.15 0.18 0.14 0.15 0.15 0.15 0.2MgO 4.92 4.94 4.92 5.27 4.56 2.17 4.54 5.80 5.72 5.80 8.70 7.1CaO 8.10 8.33 8.40 8.55 8.40 6.20 8.54 8.78 8.48 8.43 7.38 10.3Na20 2.56 2.64 2.63 2.42 2.23 1.74 2.05 2.26 2.53 2.69 2.10 2.1K20 1.29 1.32 1.36 1.05 1.41 2.32 1.43 0.94 1.23 1.23 0.51 0.8P20S 0.24 0.23 0.24 0.22 0.22 0.29 0.22 0.19 0.20 0.20 0.25 0.1
100.00 100.00 100.00 100.00 100.00 100 .00 100 .00 100.00 100.00 100.00 100.00 101.0
Mo < 0.6 0.9 0.7 1.1 1.4 1.6 1.2 0.7 < 0.6 < 0.6 0.8Nb 10.9 11.0 10.8 10.1 9.3 14.3 9.6 9.6 9.2 9.1 7.9Zr 145 145 144 129 209 318 217 121 121 118 134Y 30 30 30 28 41 55 42 26 25 24 27Sr 388 395 395 396 . 244 216 222 406 414 419 515U 1.9 <1.7 < 1.7 <1.7 <1.7 2.5 <1.7 < 1.6 . < 1.6 < 1.6 2.3Rb 33 32 34 27 31 51 29 23 33 32 17.8Tb 5.1 4.7 3.8 3.3 4.9 9.6 3.7 4.1 6.0 4.7 2.5Pb 7.9 7.7 5.4 7.6 10.6 14.0 7.7 6.2 6.5 4.8 < 2.5Ba 515 621 517 442 455 689 458 414 481 494 383Se 20 21 21 21 34 35 34 19 19.8 19.1 28S 412 361 434 821 1091 847 1363 1164 1387 702 358La 28 30 30 25 25 36 25 27 26 29 17.2Ce 64 63 61 57 53 82 58 53 56 53 42Nd 28 28 27 28 30 47 31 24 27 25 22Cs < 5.6 < 5.6 < 5.5 < 5.5 < 5.7 < 5.8 < 5.7 < 5.5 < 5.5 < 5.5 < 5.7Co 38 39 39 39 30 19.6 30 40 41 42 52Mn 1126 1128 1148 1115 1423 1231 1389 1061 1028 1057 1175Cr 81 73 82 92 81 32 79 124 114 118 375V 212 211 200 203 177 152 182 182 171 170 220Ga 20 21 21 20 20 21 20 20 20 19.6 19Zn 94 97 93 93 119 123 117 86 83 83 101Co 35 35 33 29 10.5 11.6 9.9 33 33 35 23Ni 40 40 42 44 < 2.1 < 2.1 < 2.1 53 50 52 84
Sample heights above base of coarse-grained sill (as in Fig. 4.34):
SK91-3: 0.5 m SK91-6: 8.5 m SK91-9: 12.5 mSK91-4: 1.5 m .SK91-7: 9.5 m SK91-11: 13 mSK91-5: 5 m SK91-8: 11 m SK91-12: 22 m
SK91-13: 34 mSK91-15: xenoIithic doleriteAve. Karoo: from Walker and Poldervaart (1949)
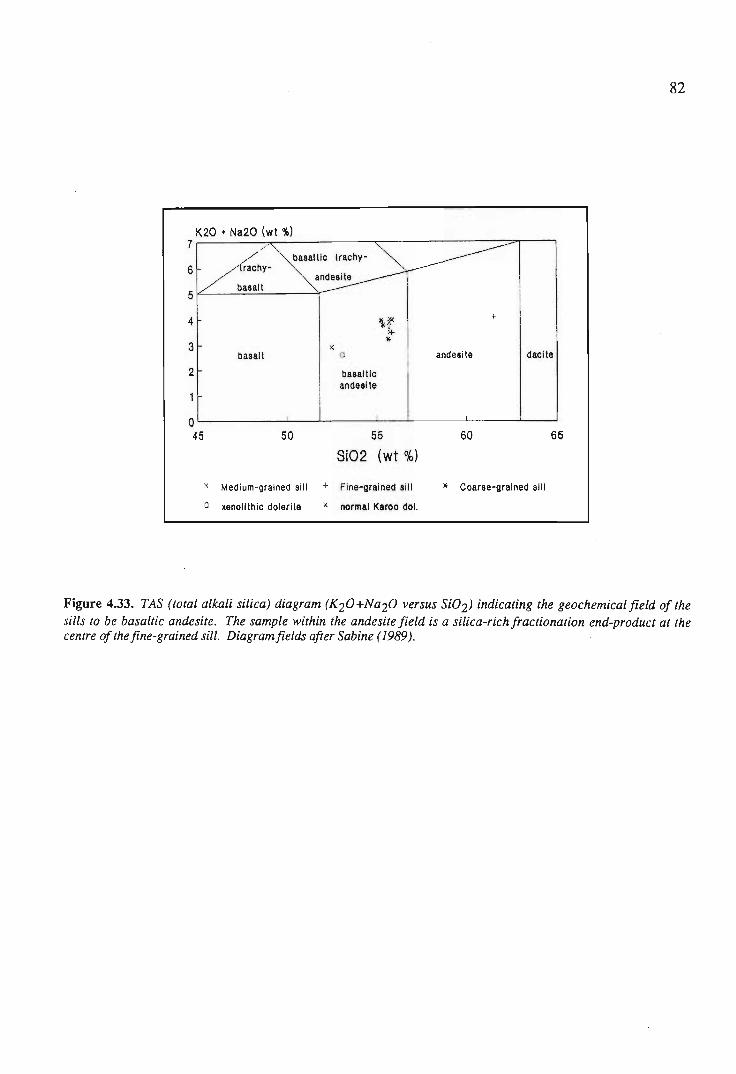
82
656055
Si02 (wt Ok)50
"/" '~;' tracnv ~~/ rachy-
-: an~L>" basalt
\ X< -l-
~l<
xbasalt 0 andesite dacite
basalticandesite
,
2
o45
4
3
K20 + Na20 (wt \)7
6
5
x Medium-grained sill -l- Fine-grained sill .. Coarse-grained sill
o xenollthic dolerlle x normal Karoo dol.
Figure 4.33. TAS (total alkali silica) diagram (K20+Na20 versus Si02) indicating the geochemical field of thesills to be basaltic andesite. The sample within the andesite field is a silica-rich fractionation end-product at thecentre of thefine-grained sill. Diagramfields after Sabine (1989).

83
height(m)
Alz03 Fez03 MnO MgO CaO
height(m) ?? yy
MIDDLE Cl"COARSE-GAANED SLL
30
2.
"
r i i l"'DOLf OF CO-'RSE.-GRAIEO SLL3.
2.
15
height r-------------------~--------_,(m)
Figure 4.34. Geochemical profiles showing relative changes in composition across the composite dolerite sills inthe 0 - 200 m region of the Mhlatuze River traverse in Figure 4.3. Heights are measured above the base of thecoarse-grained dolerite sill. Absolute values are given in Table 4.3.

84
2
3
o
2
"1203
n
". '"t •...
3
3K20
.5 ...2
.5 • ~ ...1 x
".5 c
4Na20
.5
3
~ ".5 x "... "... o2
...1.5
2.5
T102
2
...1.5
t.
"c
x1 •
0.3MnO
.215
0.2 ...115'"
x . cx ":
0.1
.05
0
o
o
o
115
16
17
10118
+ '-g. dol.rlta
e unollthlo dol.rlt.
5 6 7MgO (wt %)
3
x c .g. dol.rUe margin
.. o.g . dolerlt.
2
· 810 2
...
.. ill . 04
0
CaO
11"t. x
""'It
8 •c
7
...8
12Fe203
.5
* x
11o
x.5
... x
...10
".5
O.~
P205
0.3 ...c
+- ~ x0 .2 'l!
0.1
0
11
10
80
1515
615
10
11
2 3 15 6 7
MgO (wt %)8 11 10
Figure 4.35. Major element variation diagrams plotted versus MgO. The points represent the various doleritetypes as indicated. (n=ll) .

85
1098587MgO (wt %)
432
La+-
x ..x ..
+- x..
c
Rb+-
r ~ ....0 . ..0 c
0
40 V
20 clit
00 x x
80 +- "+- ...60
+-
40
20
00
2
2
2
2
3
15
50
40
20
80
25
30
35
40
1098587MgO (wt %)
432
Ba+- .
• ".+ . ..
c
+- Zr
"\:0
0 x C• ..0
0
0Sr
c0
0 '"x ott
0+-
+- +-0
0
0
5
50
30
20
10
80
40
10
15
20
250
300
350
400
300
500
800
700
800
x c.g. dol.rl" margin
.. c.g. dol.rlte
+- I.g. dol.rlte
o xanollthlc dol.rlte
Figure 4.36. Trace element variations in the dolerites plotted versus MgO.
An investigation of the geochemistry of the Sabie River Basalt Formation of the Central Lebombo (Sweeney,
1988) led to the recognition of three basalt groups: the normal- , low-iron-, and high-iron-groups. The latter two
groups comprise the "enriched" (high-K) basalt division recognised by Cox and Bristow (1984). Although the
dolerites under investigation here are situated beyond the southern end of the Lebombo basalts, they are
geochemically similar to the "normal" group. The main differences are higher silica and lower iron contents within
the dolerites. The "normal" basalts are thought to indicate derivation from post-Archaean lithospheric mantle. away
from the Kaapvaal Craton (Sweeney and Watkeys, 1990). Fields for "normal" basalts were identified for various
other plots (Figure 4.37) and the dolerites again correlate well. A strontium normalised comparison of yttrium and
neodymium (Figure 4.38) defmes two distinct slopes for the fine- and coarse-grained dolerite phases. This difference
may be reflecting a decreasing A1203 content towards the centre of the fine-grained sill. resulting in a lower Sr
content and thus a more gentle slope in Figure 4.38.

86
32.51.5 2
Ti02 (wt %)
0.5
"enriched"
"normal· ..l( lko ..
".
1
oo
O.
0.2
0 .4
0.3
0.5
P205 (w! "IO.lI
32.51.5 2
Ti02 (wt %)
0.5
.. "enriched"
.r"normal'
. )( lICO
oo
lOO
200
300
400
Zr (ppml500
Y (pp m)60"'-~-------------------""
x 0..0.. dolerlN m.ro1n
• e..g. dol.rlfe
... to. do l.rUe
a unoflthlo dol.rUe
50
'0
30
20
10
Zr/Y· 4 6 ..
.00350300150 200 250Zr (ppm)
10050
0~::""-----L__...I-__L-_-'-_ _ ...J....__.l..-_--1_ _ ....J
o
Figure 4.37" Trace element plots for the dolerites, showing correlation with the "normal" basalt fields (afterSweeney and Watkeys. 1990) .
Sr/Y25
20
15
10
5
00 5 10 15 20 25
Sr/Nd
x e.g. dolerlte margin
e.g. dolerlte
+
o
f.g. dolerlte
xenollthle do lerlte
Figure 4.38" Sr/Y versus SrlNd indicating notably different slopes for the fine- and coarse-grained dolerltes, dueto the lower Sr values in the fine-grained phase.

87The silica enrichment of the dolerites with respect to "normal" basalts and Karoo dolerites may be due to crustal
contamination or magma evolution via fractionation. Geophysical work in the Lebombo region indicated the
presence of a positive anomaly in the crustal gravity data (Darracott and Kleywegt, 1974). This anomalous zone was
traced as far south as Durban, and it is interesting to note that this zone coincides with the coastal band of silica
enriched "Effingham-type" dolerites (Frankel, 1969), which are not found elsewhere in the Karoo Igneous Province.
The dolerites under investigation here also occur within the anomalous crustal gravity zone , and so the silica
contamination may bea crustal effect rather than parental magma effect.
4.10.3 Mineral Control on Whole-rock' Geochemical Variations
Chemical variation diagrams that display both XRF whole-rock data and microprobe mineral data can be used to
show which minerals controlled the changing geochemistry at various stages of crystallisation (Cox et al ., 1979).
Analyses for the coarse-grained dolerite are shown in Figure 4.39. In the coarse-grained dolerite, there is no
dominating mineral that defines the chemical variation, however, plagioclase and clinopyroxene appear to be having
a greater effect than orthopyroxene. Petrographic studies suggested that plagioclase was the first mineral to
crystallise, and this is demonstrated by the points for the coarse-grained dolerite sill margins plotting closer to the
plagioclase field than the points from the sill centre. From the Si02 and CaO diagrams, it has been estimated that
clinopyroxene and orthopyroxene crystallised out in the ratio of 3:1, and plagioclase and orthopyroxene in the ratio
of 3.5 : 1. Plagioclase is thus the most abundant mineral, as was suggested in the petrographic analyses. Another
observation can be made from the Fe203 plot, where it can be seen that the crystallisation trend of the dolerite
(decreasing Fe203 content towards the sill centre) is mimicked by the clinopyroxene variation trend, whereas the
opposite effect occurs for the orthopyroxenes, which become more Fe-enriched away from the sill margin. This may
be reflecting the increasing CaO and MgO concentration away from the sill margins, with subsequent formation of
Ca-Mg clinopyroxene, thus allowing Fe to substitute preferentially into orthopyroxene. The whole-rock
geochemical variation in the fine-grained dolerite (Table 4.3 and Figure 4.34) represents the effects of fractionation
from the margins towards the centre of the sill. Petrographically, the centre of the sill was observed to contain
substantial amounts of quartz and K-feldspar, a liquid evolution effect due to the crystallisation of plagioclase and
pyroxene at the sill margins. The K-feldspar presence is reflected in the trace element concentrations (Figure 4.36).
Barium and rubidium, which can be substituted for potassium in the feldspar lattice, show increases towards the sill
centre. Strontium, however, which substitutes for calcium, decreases in this part of the sill, thus suggesting K
feldspar control.

88
36 1"1203 Na20
30 6
26 5
20 ~l16 .0. 3
' . f"10 2
5,p e ,.,,&""1 .. v • "",,," ee .Oll<._
0 00 2 ~ 6 6 10 12 1~ 16 16 20 22 2~ 26 26 30 0 2 ~ 6 8 10 12 14 16 18 20 22 2~ 26 28 30
MgO (wt %) MgO (wt %)
3 35TI02 Fe203
302.5
252
20x•• x1.5
15 <aOx.. :.. x"",0 10
eo~~0.5 5x
'ill>0 0
0 2 ~ 6 8 10 12 1~ 18 18 20 22 2~ 26 28 300 2 ~ 8 8 10 12 14 16 18 20 22 2~ 26 28 30MgO (wt %) MgO (wt %)
20 815102CaO cllno-pylt
15 62
51 -52 ex x x x
cllno-pyx
0 4T0 2 ~ 6 6 10 12 1~ 16 16 20 22 2~ 26 26 30 0 2 ~ 6 6 10 12 1~ 16 18 20 22 2~ 28 28 30
MgO (wt %) MgO (wt %)
c.g. dol.rlte margin " o.g. dol.rlte " c.g . pyroune
e C.g. ",.rgln pyrox.ne .. 0.;. plaolool ••• • o.g. margin plag .
Figure 4.39. Chemical variation diagrams showing mineral control of whole-rock geochemistry changes in thecoarse-grained dolerite (see text). Mineralfields are as labelled.
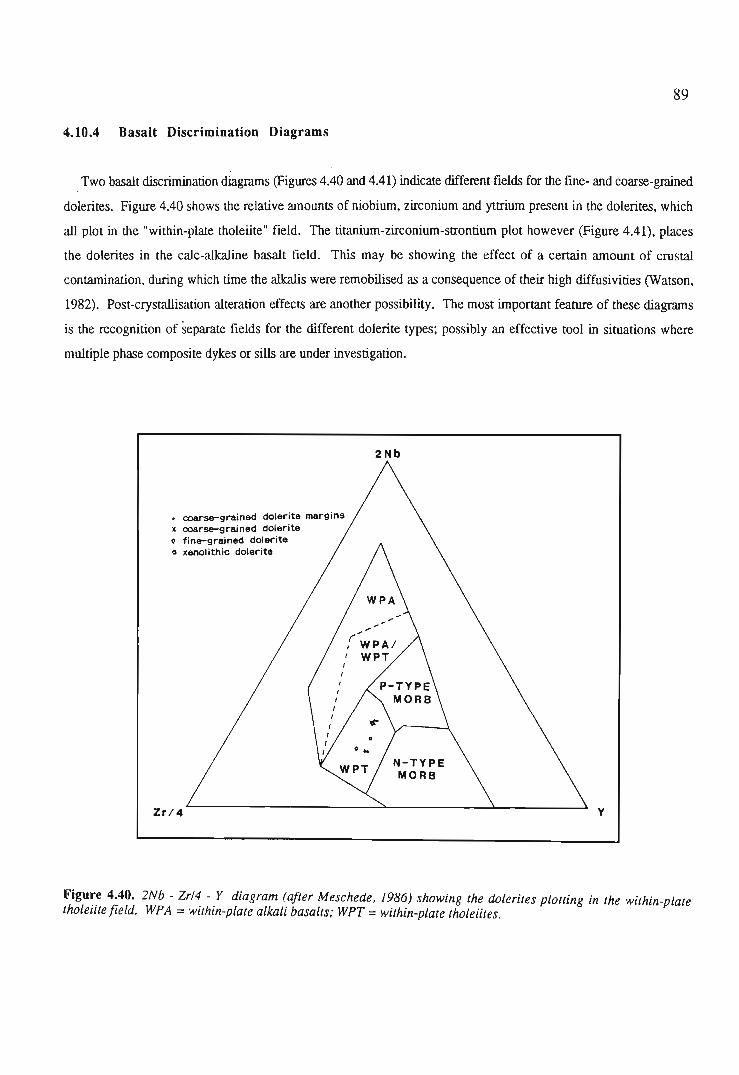
89
4.10.4 Basalt Discrimination Diagrams
Two basalt discrimination diagrams (Figures 4.40 and 4.41) indicate different fields for the fine- and coarse-grained
dolerites. Figure 4.40 shows the relative amounts of niobium, zirconium and yttrium present in the dolerites, which
all plot in the "within-plate tholeiite" field. The titanium-zirconium-strontium plot however (Figure 4.41), places
the dolerites in the calc-alkaline basalt field. This may be showing the effect of a certain amount of crustal
contamination, during which time the alkalis were remobilised as a consequence of their high diffusivities (Watson,
1982). Post-crystallisation alteration effects are another possibility. The most important feature of these diagrams
is the recognition of separate fields for the different dolerite types; possibly an effective tool in situations where
multiple phase composite dykes or sills are under investigation.
2Nb
• coarse-grained dolerite marginsx coarse-grained doler iteo fine-grained dolerite" xenolithic dolerite
Zr/4 y
Figu~~ 4.40. 2Nb - Zr/~ -.r diagram (a/ter Meschede, 1986) showing the dolerites plotting in the within-platetholeiite field. WPA = Within-plate alkali basalts; WPT = within-plate tholeiites.

90
TI
• coarse-grained dolerite margins" coarse-grained doleriteo fine-grained doleriteg xenolithic dolerite
Zr L.- ----' S r /2
Figure 4.41. Ti - Zr - Sr/2 diagram (after Pearee and Cann, 1973) with the dolerites falling into the eale-alkalinefield (see text).
4.10.5 Geochemical Evaluation Discussion
An evaluation of the intra-sill characteristics allows a detailed understanding of sill intrusion with respect to both
emplacement and crystallisation. When injection of magma is complete, cooling and crystallisation are the
predominant processes occurring in the sill. Crystal settling , fractionation and hydrothermal activity induce
petrographic and geochemical gradients across the sills as seen in the mineralogical content and whole-rock
chemistry.
In all sill phases, plagioclase was the first mineral to crystallise, followed by pyroxene. Where chilling occurred
along the sill margins, pyroxene did not form and plagioclase crystals are set in a matrix of glass. Crystal
fractionation resulted in a decrease in the basaltic nature of the fine-grained sills at the centres, with the
crystallisation of primary quartz and K-feldspar. This is reflected in the whole-rock geochemistry, with increases in
Si02 and K20, and decreases in A1203' Fe203' MgO, CaO and Na20 towards the sill centre. Late-stage

91hydrothermal fluid activity along sill margins induced calcitisation and introduced the components necessary for the
formation of pyrite, which pseudomorphed altered pyroxene and plagioclase against the sill margins, and
explains the Fe and S anomalies along these contacts.
The dolerite geochemical data allow a number of applications to be identified with regards to the recognition and
differentiation between separate intrusive phases; in this case between the coarse- and fine-grained dolerite phases
respectively. Mineral chemical characteristics such as illustrated for plagioclase on an Or versus An graph (Figure
4.28) or via core to rim variations (Figure 4.29), and illustrated for pyroxene core to rim variations (Figure 4.30) and
Ti4+ concentrations (Figure 4.32), effectively demonstrate differences between the two dolerite intrusive phases.
Whole-rock geochemical data are just as effective, such as via absolute whole-rock compositional variation across a
composite sill (Figure 4.34) , variable Harker-type diagram compositional trends (Figure 4.35), trace element .
concentrations (Figures 4.36 and 4.38), and basalt discrimination diagram fields (Figures 4.40 and 4.41). Finally,
different mineralogical controls on whole-rock variation trends (Figure 4.39) may also be evident for different
intrusive phases. All of these geochemical characteristics may prove useful as tools for the identification of separate
intrusive events in areas where multiple intrusive activity has occurred, such as has been applied for the Mhlatuze
River dolerite sills.

925. DILATION AND MAGMA FLOW IN DYKES
5.1 Introduction
The mechanics of formation, dilation and intrusion of dykes were summarized in Chapters 2 and 3. In this
chapter, specific examples will be utilised to demonstrate the mechanism by which a dyke dilates, possible chemical
controls on fracture development, and the dynamics of magma flow in a thin dyke. The methods of dyke intrusion
will be illustrated by multiple intrusion event recognition in a dyke swarm, as well as a determination of the
successive opening steps for an individual dyke within the swarm in order that the intrusion mechanics may be
demonstrated. Chemical controls on fracture propagation at the tip of the latter dyke will be investigated using
microprobe analyses of minerals through which fractures are propagating on a microscopic scale. The dynamics of
magma flow in a thin fissure will be determined using digitally analysed phenocryst orientations, allowing the
determination of a magma flow direction.
Samples for these exercises were obtained from a well exposed outcrop of the Rooi Rand Dyke Swarm along the
Pongola River, 150 km north of Empangeni (Figure 5.1).
5.2 Rooi Rand Dyke Swarm
The Rooi Rand Dyke Swarm is a basaltic (dolerite) dyke swarm in the southern Lebombo region that extends a
distance of approximately 200 km from Hluhluwe in the south to central Swaziland in the north, and has been
documented by authors such as Bristow (1976), Armstrong (1978), Saggerson et at. (1983), Armstrong et at. (1984),
Hunter and Reid (1987) and Meth (1991).
The dyke swarm is represented by a multiple phase assortment of dykes that were emplaced 188 ±5 million years
ago (K-Ar date; Cleverley, 1977), and consists of both single and composite intrusions (Saggerson et al., 1983).
The dyke swarm trends essentially north-south, dips steeply to the west at 650-750 , and attains a maximum width of
about 20km (Armstrong et al., 1984). The intensity of intrusion decreases with increasing distance from the centre
of the swarm, and was associated with an average crustal extension of 40 per cent (Saggerson et al., 1983). The
dykes range in thickness from 25m to very thin dykelets, and were "emplaced towards the final stages of eruption of
the Sabie River Formation and during the main period of faulting, tilting and warping to which the Lebombo region
was subjected" (Armstrong et al., 1984) in response to the fragmentation of eastern Gondwana during the Jurassic.

Geochemically. the Rooi Rand dykes display major element
variation trends typical of iron-enriched continental tholeiite
suites that result from the fractionation of a clinopyroxene +
plagioclase + olivine gabbroic assemblage (Armstrong et al.,
1984). Recognition of individual intrusive episodes has been
attempted on the basis of geochemical variation trends by Meth
(1991).
Figure 5.1. Location of the Pongola River outcrop of theRooi Rand Dyke Swarm in northern Natal. After EaLes et aL.(1984) .
5.3 Mechanics of Multiple Dyke Intrusion
20 km
N
t
28"3a
The attitude of the Rooi Rand Dyke Swarm outcrop along the Pongola River is illustrated in Figure 5.2. Meth
(1991) recognised up to eight episodes of intrusion on the basis of field relationships and geochem ical data, but this
has been modified to ten episodes in Figure 5.2. The dykes have intruded through an older , Karoo-age dolerite sill ,
which is preserved as isolated wedges within the swarm, suggesting the Rooi Rand episode to be comparatively
younger than the extended period of dolerite intrusive activity in the Karoo Igneous Province. Comparative ages of
juxtaposed dykes are frequently best recognised on the basis of chill margin relationships. However, where intrusion
of later dykes into older intrusions has occurred, there sometimes occurs a chill-on-chill effect whereby only one chill
margin of each phase of a composite dyke is preserved, with the exception of the final intrusive phase (Saggerson et
aL., 1983). Where later phases intrude along the chill margin of an older phase , that chill margin may be obliterated
and replaced by the chill of the later phase. Chill margin relationships must, therefore, be studied with caution in
order that the correct sequence of events can be interpreted.
Armstrong (1978) recognized five different intrusion events using chill margin relationships. Meth (1991) identified
the individual dolerite phases on the basis of chill margin relationships and grain sizes as shown in Figure 5.2. A
similar approach was used by Saggerson et al. (1983). Although this is a somewhat crude method considering the
number of intrusive phases present, it has prov~d to be a fairly accurate field method of identification, and is
supported by the geochemical data (Meth, 1991). Many of the thinner dykes exhibit steps and offsets and en echelon

~ _ "':; "- ~""1
i/ (-'
(/:t"" '/" ~ '1.._,~,~-
.. .!. .'
.' '
(~~~....... .. .......Sv, ·:·
I
o metres
I300
..-..,[...-:,..-:..-- ~
brldg,supports
D
I
100
; fJ'\~lr~1
a ,;p (;
,400,
t(:;; v
/.... .).......}
.--_ ........... " . '''''.r--tt" ' ;;:- ... ....... ./"1 ,1Ifli ' ~,_ .. L1 .,' , ! . " ... . "'b 'J~N ie t ••. ..... v t:- f.~ ~\,..~ ., .~ ~
,. C" :-- ~ 'I;; ;-~(t''''J 1: ~ r~":r~c]}! ;: ~_. ..... l
\ '11"":,.,-) "'~\.............. :J -.. :- , ,~", ~\"r<ly
I
200
Eft""'.. .. .... -~ .~ CS" "' .:1 , • • • • •r : ~ ,...~-, ,' (' '" - -J.. :t.. }"
cl r-l..J"""i ~ I'.l"'·'-J· ,..:~'~:e ~~'tt;" - ' J-. ,7 .... ,,;:,••{)
I
500
'-'-, C~~:..~ ···.¥d- , '-,
,..t.',..r
,600
N
tFigure 5.2. Outcrop characteristics of the RoeiRand Dyke Swarm along the Pongola River (modifiedafter Meth, 1991). Relative ages of the individualintrusive phases is shown on the basis of colour.
/.... , - ...• I
'.....'-'
/ /~...'
'Phas,e 9 (y.oungest)Phase 8Phase 7Phase 6
·:Phase .5Phase 4
,Phase 3'Phase 2Phase 1 (oldest)Ka .foo dolerltehost rock sediments
chill margin

94patterns, with linkage of adjacent segments in accordance with the models described in Chapter 3. Cooling joints at
right angles to the dyke margins are occasionally intruded by later dolerite phases, although thicknesses of such
dykelets are limited to a few centimetres. At the 360m mark along the river traverse (Figure 5.2), a blunt-ended dyke
is associated with a number of thin offshoots (Figure 5.3) that may provide an explanation as to the mode of
formation of blunt-ended dykes (pers. comm. Watkeys, 1992). Dilation of the dyke is associated with a shear
component in the adjacent rocks, resulting in shear fracture dilation and intrusion that compensates for the amount of
dilation occurring in the main dyke body. Evidence for such a shearing effect is apparent on a microscopic level, as
will be described in the following section.
N
tdolerite host rock0.1 m
dolerite offshootsa.
b. c.
~(jr1
Figure 5.3. (A): Multiple offshoots of dilated shear fractures adjacent to a blunt-ended dyke at the 360 m markalong the Pongola River outcrop. (B): The proposed zone of left-lateral shear curves gradually into parallelism withthe dyke plane with increasing distance from the dyke. The maximum regional tension ,is «t'; (C) : Cumulativedilation of the shear fractures is D (=dl + d2 + d3). Additional dilation in the dyke. i, is the initial elastic dilation ofthe dyke prior to development ofa shear zone into the adjacent host rock essentially orthogonal to the dyke plane .
A recurring feature of the dyke swarm is the tendency for later dyke phases to intrude into older dykes , frequently
through the centres of the earlier formed dykes (Figure 5.2). The presence of chill margins indicates that earlier
phases cooled and solidified before the intrusion of subsequent phases (Saggerson et al., 1983). It must therefore be
explained why later intrusions are emplaced within older, solidified dykes, rather than into the adjacent country rock
of predominantly shale. According to Pollard (1987), an intruding dyke tip is associated with a process zone within
which substantial fracturing of the country rock occurs (Chapter 3). These fractures are juxtaposed against the sides

5.4 Dilation History of an En Echelon Dyke
5.4.1 En Echelon Dyke Development
As most of the dykes in the Pongola River cutting
have greater dimensions than the outcrop itself, absolute
dilation reconstruction can only be attempted for the
thinner dykelets which are more wholly exposed. Such
an example occurs at the 345 m mark along the river,
where a 3.5 cm thick dyke is composed of a number of
linked en echelon segments. Slabs of rock cut
perpendicularly to the plane of the dyke (both vertically
and horizontally), allowed the construction of a three
dimensional representation of the dyke, showing the
changes that occur along the propagation direction at a
zone of offset and linkage (Figure 5.5).
96
Figure 5.5. Three-dimensional representation of a 3.5cm thick dyke that splits into two offset segments alongthe propagation direction . This resulted in the formationof blunt-ended dykes and horn development. Verticalthickness is approximately 30 cm.
50mm, ,
UP

97
In this figure, it can be seen that a single dyke at a deeper level divides into two offset segments along the
propagation direction. Most literature studies document en echelon intrusions that begin as offset, individual
segments that link due to the interplay of near-tip stresses (Pollard et al., 1982; Nicholson and Pollard, 1985; O1son
and Pollard, 1989 & 1991). Segmentation of dykes into en echelon segments along the propagation direction has
been frequently proposed to explain the occurrence of en echelon segments (Anderson, 1951; Pollard, 1987; Price and
Cosgrove, 1990). Such segments are envisualised to rotate in a changing stress field out of the plane of the parent
dyke.
In the case of Figure 5.5, it can be seen that the offset in the horizontal plane is accompanied by a simultaneous
offset in the vertical plane. This suggests that the formation of the en echelon segments is not the result of
fragmentation of the dyke front in a changing stress field, but rather due to the dilation ofan adjacent, offset fracture.
There is thus no rotation of the en echelon dyke segments with respect to the parent dyke. This may suggest that
the emplacement of an intrusion occurs via a repetitive splitting ("deconstruction") and relinking action
("construction") that serves to minimize the energy expenditure during intrusion (Pollard et al., 1982). A developing
horn on the outside edge of one of the segments (Figure 5.5) begins to curve in towards the adjacent dyke segment
further along the propagation direction due to the nature of the near-tip stresses. Assumedly, this horn would link
with the adjacent dyke segment further along the propagation direction to form a single dyke once again. This
proposed mechanism of "constructive" and "deconstructive" en echelon behavior may be quite common, and it
obviates the need for a higher crustal, rotating stress field in order to produce the en echelon segments. There is no
reason for a region undergoing crustal extension, such as the tectonic regime of the Rooi Rand Dyke Swarm, to have
rotating crustal stress patterns.
Figure 5.5 reveals that the major offset and associated horn, as well as the minor offsets along strike, propagated
obliquely towards the surface. This may be a reflection of magma migration upwards and towards the south, away
from a deeper, more northerly magma source. Such features plunge at between 480 and 800 towards the north.
Minor offsets are of very limited extent along the dyke length, suddenly appearing and then disappearing again a few
centimetres along the direction of propagation. The southward-directed magma pressure may be the reason for the
formation of a single horn on the southern edge of the one dyke segment, rather than on the outside edges of both
dyke segments, as is often the case. The initial development of the horn occurs with rapid growth away from the tip
of the dyke segment, with the lower edge of the horn plunging at 260 to horizontal. Further along the magma
propagation direction, the lower edge of the horn rotates to a steeper inclination, attaining an attitude similar to the
other features described above. This suggests the horn is attaining a state of equilibrium with the propagating
magma, at which point the dominant feature is the near-tip stress interaction and consequent rotation in towards the
adjacent dyke segment.
Horn growth and curvature may be better understood when investigated on the microscopic level. Figure 5.6
shows a photomicrograph of a horn tip. From the orientations of microphenocrysts in the glassy groundmass of the

98horn, it appears that the horn tip was associated with a degree of magmatic turbulence. Furthermore, the dolerite
country rock through which the horn is advancing has undergone a marked degree of cataclasis ahead of the horn tip,
perhaps due to stresses induced by dilation of the horn. The existence of cataclastic dolerite fragments in the glassy
groundmass suggests that the horn may advance by a simple erosive effect of the turbulent magma against the
cataclastic host rock at the horn tip.
Figure 5,6. Photomicrograph of the tip of the horn in Figure 5.5 , showing cataclasis of the dolerite host rockahead of the tip and magmatic turbulence at the tip , as suggested by microphenocryst orientations in the glass ygroundmass. Dyke locality: 345 m mark in Figure 5 .2.
The effects of horn dilation and propagation in the host rock ahead of the horn tip is better illustrated in Figure
5.7. Microfractures in the host rock ahead of the tip curve in towards the adjacent dyke segment (not shown in the
figure) , and cause a significant degree of cataclasis of the host rock. This curvature of the microfractures is very
similar to the pattern of stress trajectories predicted by Ramsay (1967) for the case of a "constant horizontal
supplementary stress sys tem", such as might be produced by the magma pressure at the horn tip. Furthermore,
curvature of the microfractures may induce curvature of the horn itself, in towards the adjacent dyke segment.

99
Figure 5.7. Photomi crograph of fra ctured dolerite host rock ahead of the tip of an advan cing horn . Microfracturescurve in towards the adjacent dyke segment (above the fi eld of the photograph) causing cataclasis of the host rock andpromotin g horn growth and curvature. Inset: detailed representation of the frac ture pattern. Dyke locality: 345 mmark in Figure 5.2 .
5.4.2 Blunt-Ended Offset Segments: Dilation Reconstruction
The three-dimensional dyke representation in Figure 5.5 indicates that the "deconstruction" of the dyke produced two
offset segments with essentially rectangular ends . Such blunt- ended dykes are frequently observed in the field , and
the effect is also common in sills. As fracture dilation is ass umed to produ ce elliptical ope nings (Pollard, 1973 ),
there must be some additional mechanism that results in the formation of blunt-ended planar intrusions. In the case
of the dyke in Figure 5.5. a reconstruction of the dilation history, and microscopic analysis allows clarifica tion of
the mechanism responsible for such dyke geometries.
The dilation history has been reconstructed for the region around the offset, blunt-ended terminations of the two
dyke segments of Figure 5.5 in Figure 5.8.
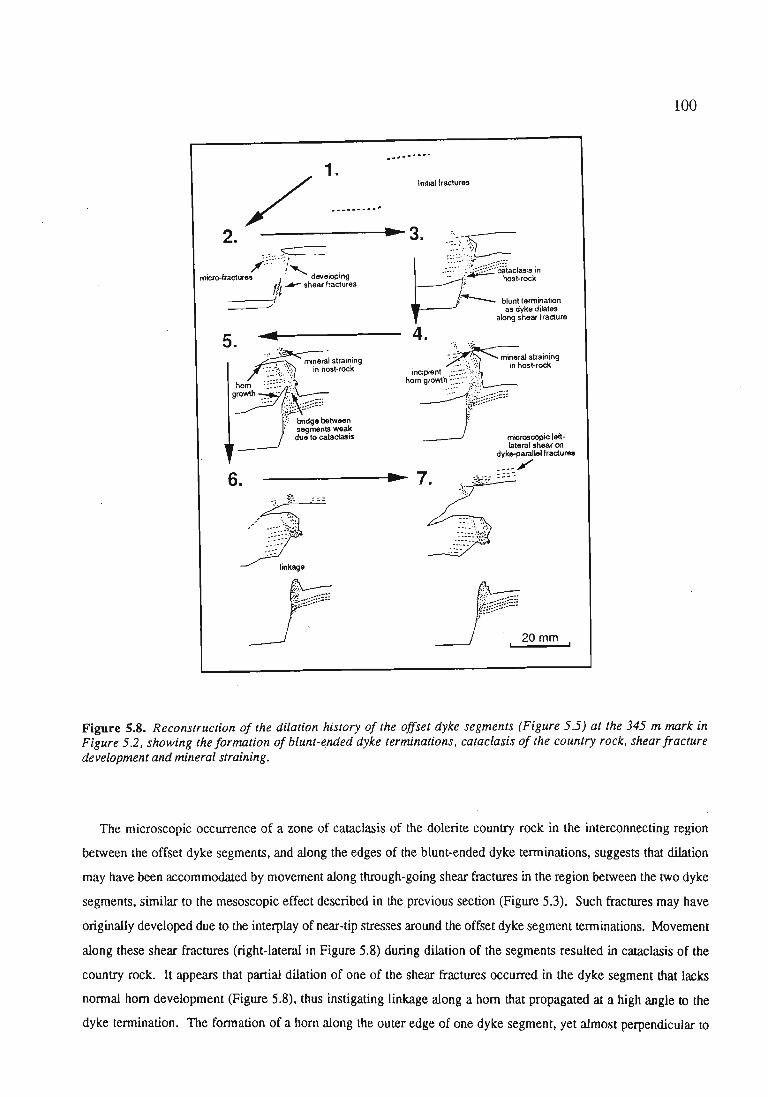
100
f~,---20 m---"m
Initial fractures
.......1.
------·~7.
-:
6.
~-- 'j '\~:, ::=
,; ~ ..~ . -:;:.....::: ::.:.~';
. " ~ ~ ..--linkage
f fi2 -"~~:::::;;::::
" .
2.
5.mineral straining
j~
'::'.' -"~;r-_. -,",' lop"mao--fractures ( devs tngIh ...- shear fractures
__--1{
----'
Figure 5.8. Reconstruction of the dilat ion history of the offset dyke segments (Figure 5.5) at the 345 m mark inFigure 5.2, showing the formation of blunt-ended dyke terminations , cataclasis of the country rock, shear fracturedevelopment and mineral straining.
The microscop ic occurrence of a zone of cataclasis of the dolerite country rock in the interconnecting region
between the offset dyke segments, and along the edges of the blunt-ended dyke terminations, suggests that dilation
may have been accommodated by movement along through-going shear fractures in the region between the two dyke
segments , similar to the mesoscopic effect described in the previous section (Figure 5.3). Such fractures may have
originally developed due to the interplay of near-tip stresses around the offset dyke segment terminations. Movement
along these shear fractures (right-lateral in Figure 5.8) during dilation of the segments resulted in cataclasis of the
country rock. It appears that partial dilation of one of the shear fractures occurred in the dyke segment that lacks
normal horn development (Figure 5.8), thus instigating linkage along a horn that propagated at a high angle to the
dyke termination . The formation of a horn along the outer edge of one dyke segment, yet almost perpendicular to

101the other dyke segment, resembles the "monocline" stress field distribution described by Roberts (1970) to explain
the existence of sills on one side of a rnonocline, and dykes on the other. Figure 5.8 also shows that a left-lateral
displacement occurred along dyke-parallel fractures on either side of the dyke segments. This is probably indicative
of a left-lateral shear motion parallel to the strike of the dyke segments, produced by a translational dilation
component and possibly the frictional effects of magma propagation upwards and towards the south as described
previously (Figure 5.5).
5.4.3 Effect of Dilation on Host Rock Minerals
The mechanism described above for the formation of a blunt-ended dyke assumes dilation accommodation via
movement along shear fractures. It would be expected that such displacement along shear fractures in the region
between the offset dyke segments would induce strain in the host rock on the outer edges of the segments, opposite
the zone of shear fracture displacement Such effects are visible on a microscopic level for the region of host rock
shown in Figure 5.8. The host rock is a medium-grained dolerite composed of clinopyroxene (augite) and
plagioclase. Dyke dilation resulted in straining of plagioclase grains as shown in Figure 5.8. Strain effects include
the bending of elongate grains, the production of mechanical twins, and the formation of subunits within bent/rotated
Istrained grains (Figure 5.9), similar to the effect detailed in pyroxenes from a granophyric gabbro from the Lebombo
region (Saggerson and Logan, 1988).
Figure 5.9. Subunit development in a strained plagioclasegrain (surrounded by pyroxene) against the outer edge of adilating dyke segment (Figure 5.8) at the 345m mark in Figure5.2. Subunits display individual twinning laws.
Work on pyroxenes suggested lattice defect migration to planes corresponding most closely to directions of
maximum stress (Saggerson and Logan, 1988). Perhaps a similar effect is occurring in the plagioclase here, with
different subunits obeying different twin laws as a result of stress concentration. The formation of mechanical twins
results from simple shear of the lattice on the twin glide in the twin glide direction (Tullis, 1975). Successive

102atomic planes parallel to the twin glide plane are displaced over one another. as may be occurring in specific subunits
in Figure 5.9. Mechanical twins may involve mirror-imaging across a twin plane. as is demonstrated by plagioclase
grains exhibiting a "herringbone" effect, caused by a number of twins being rotated and thus reflected across a twin
plane oblique to them (Figure 5.10).
220~
. . . ."
undulose
s, dyke-parallel'S;: I microshear
Figure 5.10. "Herringbone"effect in plagioclase due tomechanical deformation across asuitably oriented twin plane. PX =pyroxene, CHL = chlorite, PR =prehnite. All other grains areplagioclase. Note the subunitdevelopment. undulose extinctionbands. and plagiociase grainbending. Locality: 345 m mark inFigure 5.2 .
Additional effects observed in plagioclase include grain annealing, sericitisation and a thermal-induced alteration to
prehnite. Deformation is minimal in the pyroxene grains. A small amount of grain bending and subunit
development has occurred. The most visible effect is the production of an undulatory extinction. Alteration is by
chloritisation, and is most common adjacent to the offset and cataclasis zone, where the pyroxene grains are strained.
S.S Chemical Controls on Fracture Development
The importance of magmatic fluid effects at the tip of a propagating fracture was suggested in section 2.2.5.
Pollard (1987) recognised the need for the investigation of the contact and near-tip regions of dykes in order that the
conditions of temperature. pressure. and chemical environment during propagation might be evaluated. Thus far,

103aspects of fracture development have been considered in terms of stress conditions and the mechanical properties of
the fractured materials. The role of chemical conditions around a propagating tip is poorly understood. The
possibility exists that magmatic fluids preceding the magma influx at a fracture tip interact with the host rock in a
way that is conducive to the production of a chemically weakened propagation route. This might be assumed to be
an effective method of fracture propagation where the driving pressure is not large enough to mechanically fracture
the host rock. The chemical environment ahead of the tip of the propagating horn in Figure 5.5 has been analysed
using an electron microprobe, so that chemical changes associated with fracture development may be examined. The
geochemical analyses are listed in Appendix 4. Chemical analyses were performed and documented as a function of
the distance from the fracture passing through the mineral grain (plagioclase or pyroxene) so that changes in
chemistry may be recognised in the proximity of fracture.
5.5.1 Fracture of Plagioclase
. The trends in fractured plagioclase grains are decreases in CaO and increases in Na20, FeO and MgO moving
towards the fracture. Si02 and AlZ03 variations are less well defined, although the latter usually displays a slight
decrease within 6 microns of the fracture. MgO values decrease between 50 and 20 microns approaching the fracture
but then increase again within 6 microns of the fracture. This may be an indication of MgO mobility towards the
region of fracture from a zone of radius ZO microns from the fracture tip. Figure 5.11 illustrates chemical changes in
the vicinity of a fracture, expressed relative to the CaO concentrations. The effect of MgO behaviour is well
demonstrated in the CaO/MgO graph.

104
A. B.CaO
CaO/FoO35 -
20 . ----- +
=.~ 30 •
15 .
'_____ 4- "Ji 25 -
~!S2f%+ +
20
10 - 15·
105
5
00
50 60 0 10 20 30 40 50 600 10 20 30 40
C. C~O/MgOD'CaOlNa2010
120
+100 + ..---" 6
,1:
60
*'6
604 x
A
40 +
220
00
50 60 0 10 20 30 40 50 600 10 20 30 40
Distance from crack (microns) Distance from crack (microns)
x SK92-El + SK92-D4 '" SK92-Cl 0 SK92-D2
Figure 5.11. Chemical variations in fractured plagioclase as a function of distance away from the fracture. A.CaD (wt %) variation . B. CaD/FeD variation. C. CaO/MgO variation. D. CaO/Na20 variation .
5.5.2 Fracture of Pyroxene
Geochemical variations in pyroxene adjacent to fracture zones are less well defined than the plagioclase trends.
Variations are generally very slight and the trends in specific elements may be variable from grain to grain. In most
cases, increasing proximity to the fracture is associated with slight decreases in the CaO content and an increase in
FeO within 6 microns of the fracture. The MgO and Al203 values show little to no variation. Geochemical
variations in pyroxene grains are displayed in Figure 5.12, showing slight increases in FeO/MgO and Al3+/Mg2+
moving towards the fracture.

105
a.2 :-:Fe~O:.:..:/ M:,::9"..::O:'-- 1
b..A..1.:..3'.:..:/M.:.:.:g~2:...-' ,
0 .25,
"0 .2 -
1.5 .
-!-----+
0.5
0.15
0.1
0 .05
+
7010 20 30 40 50 60
Distance from crack (microns)
01_ _ --'-__-'-__'--_--'-__-'-__.1--_--'
o7010 20 30 40 50 60
Distance from crack (microns)
oo
x SK92-El + SK92-04 '" SK92-Cl 0 SK92-02
Figure 5.12. Geochemical variations in pyroxene grains in the vicinity of a through-going fracture. (a) FeOIMgO
variation. (b) AI3+IMg2 + variation .
5.5.3 Discussion
From Figures 5.11 and 5.12, it can be seen that fractures advancing ahead of a propagating intrusion tip are
associated with geochemically altered minerals. The problem posed by this observation is the actual timing of this
geochemicalchange induced in the plagioclase and. to a lesser extent, pyroxene grains. Ion-enriched magmatic fluids
might be expected to precede an advancing magma front, and fluid-rock interactions may well occur in a way that is
conducive to the promotion of fracture by lowering the fracture strength of the minerals . However, the possibility
also exists that the observed chemical variations are the result of post-intrusion alteration due to fluids moving along
pre-existing fractures. Much of the chemical change within the minerals is the result of the mobilisation of
elements with a highly ionic character, such as CaO, Na20 and MgO, perhaps induced by ion-enriched magmatic
fluids, however , the exact cause of the chemical changes, and the impact on the fracture susceptibility cannot be
conclusively determined.
5.6 Dynamics of Magma Flow in a Thin Fissure
5.6.1 Introduction
The dynamics of magma flow in a dilating fracture was introduced in section 4.6. Magma flowing through a
fissure has the greatest velocity gradient and the highest rate of shear along the fissure walls (Komar, 1976; Barriere,
1976; Ross, 1986; Ildefonse et al., 1992). Such high rates of shear will frequently induce a preferred orientation of
crystals with suitable aspect ratios (Roberts and Sanderson, 1971; Smith, 1987; Allard and Benn, 1989; Benn and
Allard , 1989). These preferred orientations may be preserved as the magma chills against the country rock.

106Determination of flow orientations may be deduced from information on the crystal orientations (Tweto, 1951; Ross ,
1986; Platten and Watterson, 1987) as was performed for the dolerite sills along the Mhlatuze River in section 4.6.
Another effect of hydrodynamic forces in a flowing magma is flow differentiation (Bhattaeharji, 1967; Barriere, 1976)
whereby phenocrysts are concentrated at fissure centres by either the wall effect, the Magnus effect, or the Bagnold
effect . This is most effective in narrow fissures.
In this section, shape-preferred orientations of phenocrysts in glassy dykes from the Rooi Rand Dyke Swarm will
be examined so that flow effects may berecognised, and flow directions determined, This will be accomplished via
digital analysis of microscope thin sections in order that a full statistical analysis may be made of the orientations of
crystals of variable aspect ratio.
5.6.2 Magma Flow Effects in a Tbin Fissure
Digital analysis of microscope thin sections was performed using the KONTRON VIDAS system at the Electron
Scanning Microscope Unit at the University of Natal at Pietennaritzburg. A video camera attached to a polarizing
microscope conveys an image to a computer monitor that is connected to the VIDAS program. VIDAS then converts
the camera image into a digital image on the monitor screen. The digital image may then be manipulated via
various command functions that clarify objects, such as by sharpening the boundaries and discriminating objects
from the background, and will allow for the selection of specific objects for digital analysis. Such operations were
performed on thin sections taken from Rooi Rand Dyke samples using a macro program specifically constructed for
this purpose. The macro is given in Appendix 5 together with an explanation of VIDAS commands.
Digital analysis can be used to demonstrate the effects of flow differentiation in a thin fissure. Figure 5.13
provides photographic evidence of flow effects in a 16mm thick fissure, showing alignment of microphenocrysts in a
glassy groundmass near the margins of the fissure , and random orientations together with a flow differentiation
induced volume increase of microphenocrysts towards the centre of the fissure.

107
Figure 5.13. Photographic representation of magma fl ow effects fro m the margin to centre of a 16 mm glassydolerite dykelet. Microphenocryst alignment is greatest along the margin (lef t), becoming more random towards thedykelet centre where the volume of microphenocrysts is increased by fl ow differentiation .
Such magma flow effects may be demonstrated by digital analysis. The histograms of Figure 5.14 illustrate the
orientations of microphenocrysts from the margin to centre of the dykelet shown in Figure 5.13. The variationaway
from the centre is evident from the peak position of the superimposed Gaussian distributioncurves:
Distance from margin
< 1 mm1 - 2 mm2 - 4 mm4 - 6 mm6 - 8 mm
Gaussian Mean
89.990
85.060
85.380
78.990
79.290
where 900 represents the angle at which point the acicular microphenocrysts are in parallelism with the dyke wall.
ANGLEDMAX is defined as the angle between the positive x-axis (of the microscope cross-hair) and the DMAX
orientation of the object, where DMAX is the longest diameter of an object, obtained by selecting the largest of the
Feret diameters measured in thirty-two different directions (an angular resolution of 5.7"). With this resolution,
acicular microphenocrysts such as those under investigation, have a DMAX which approximates to the long-axis
length measured parallel to the crystal faces, and therefore ANGLEDMAX gives an accurate representation of the

108orientations of microphenocrysts. From Figure 5.14, it can be seen that there is a decrease in the ANGLEDMAX
mean movingaway from the dyke margin,as well as a greater distribution of orientations(increasing variance) and a
decreasing kurtosis. Preferredorientations are thus most common against the dyke margins where the flow velocity
and the rate of shear is greatest. Orientations are more random at the dykecentre due to a decreasedflow velocity and
shear rate, and probably also due to an increased amount of inter-phenocryst interaction induced by flow
differentiation effects.
Microphenocryst orientations around the offset region of the en echelon dyke segments illustrated in Figures 5.5
and 5.8 are illustratedin Figure 5.15. The preferred,dyke margin-parallel orientationof microphenocrysts is evident
against the dyke walls, becoming more random towards the centres. Larger phenocryst concentration at the dyke
centres is probablydue to flow differentiation. The patternsdefinedby microphenocryst orientationsis often dictated
by flow conditions around the larger phenocrysts, and suggests flow to be laminar against the dyke walls, but more
turbulentat the phenocryst-enriched centres.

109
6-8mmAIIGLEIllIAlC
728 .00
172.978
72o
1511.53
1 .1189 .118
8 .118172 .87
S7II8. '17s ,lIlI79 .2'.1
3197.87st..54
8.281818-1 .17
rileparaaet....cooantalowoe.. ~"" :IlP.... ~... :UMer{ low :In r ......o ......tlowcl••_
- .. I."n.cl......... c l•••
StaU.Ucs.. 1nl........xl ........~J.nllM.lu.:_nIIMP'.nee.'t.. . 4.......kurt.a•••
tll. 1-2mmp.,.al"eta" AHGU~
count. 84JOIoHII' hound : 26 .57",pper bound : 164 .86underClow : 8I n .. _"We Il4ouortlow 8Fl....- ISOodu I 9 .38...In.cl ••• 8 .1lII.... .c l ••• 19 .1lII
St.'tbtlca.. In INUt 26 .57A&XI..... 165 .96..... 7144 .64_.UanWl lu e: 86 .77_..
OS.86"ar lance 673.99std..dev. 25.96akawne•• 8.88'J7S7kurtoal. 8 •37'.llI8S
HMI. AIlCLEDItAX
ri le 4-6mm,........ter AIll:l.EDtlAXcount. 46lowe.. hound: 28 .S&upper t.ouM : 172 .97"a4erflow : 8In r.~. 46o \le r f" low 8c l •••ca IS_ .. I
18.16.'.. .c l ••• 8 .1lIIlI'AX.cl__
8 .1llIStatl.tlc.
,,1nl.,. 28 .S&-..1_ 172.87..... 3633.Tr~I.nve.hi.: 69 .67_n 78 ."variance 1612 . 88.U..... . 48.1'".kewno•• 8 . 'J'J6541......to. l. 8.179632
168 . AItQ.EI)flAX
1511.1lllI.511.11
v "V -,-,
1,4.00
7.118
8.88
3.1IlI
9.00
5.1IlI
2.118
1.118
.... 00
8 .008.118
Cooan~
rile 2-4mm C<>oantp.r....tar AIlCOLEIltIAXc ou nt . S& 8 .88lower lw:Jund.: 0 .88upper bouncl : 172 .97underfJow 8 7 .88In ra",e 56overflow 8 6 .88cl••••• IS
- .. I 11.53 5 .08.. In.c l••• 0 .88...... cl••• 9.88
St.tl.tlcs 4 .08.. 1nl..... 8 .118.... 1... 172 .87 3.88..... 4781.32_cl I.n.....hl.: OS.OS 2 .1IlI_n OS.30"'arlance 1428 .23.U . ..... e , Tr .69 1.118.- 0 .195«42Iwrtoal. 11 .286112 1I.1IlI
AIIGLEIllIAlC 128 .1511.1lllI .511.11
/' r.....
1\
/ 1\/ \
I~ 11 I~~
4.1IlI
2.1IlI
8.1IlI8.118
3 .1IlI
I.IIlI
7.1IlI
6.88
5 . 1IlI
8 .00
Cooant
r 11. < 1mm CooantCooan~.........t ... A/l(O\.EWWCcou nt . 61IowaI' bound: 7.12
18.8 upper bound.: 164 .86,*nd.er( low 8In range 61 15 .8ouer-flow 88 .88 cl••••• IS
- .. I 18 .68_In .cl••• 8 .88
6 .811 lI'&X.cl••• 11 .88 18 .8St.tl.tlea
.. In'",", 7 .12
.....xl.ua. 165.%4 .88• u.. S48'J .62IIlMtd lanv.a 1"8: 88.52_..
8'J .992 .88 variance 1823 .40
atd..d.eu. 31.99akewne•• 8.2Sl1S67
8.88 kurtoata 8.91324'" 8 .8828 .0 68.8 188. 148. A/l(OLDlIIAlC 40.8 88 .8 128.
Figure 5.14. Results of digital analysis of the dyke in Figure 5.13 for various distances from the dyke wall. aslabelled. Histograms display the ANGLEDMAX population versus frequency of occurrence. Micro-phenocrysts
parallel the dyke walls where ANGLEDMAX =90° . Prefe rred orientations are most common against the dyke wall.whereas orientations are more random towards the dyke centre.

110Figure 5.15. Pattern of phenoeryst andmicrophenocryst distribution and orientation at a pointof offset of two en echelon dyke segments , as shownin Figure 5.8.
5.6.3 Flow Direction Determination from Digital Analysis
In the previous chapter, flow directions were calculated for dolerite sills along the Mhlatuze River using the
method of phenocryst long-axis orientations, and shear-sense deductions along the lower contact via the method of
Benn and Allard (1989). Determination of flow directions was performed using thin sections taken along the chilled
sill contact, where rapid cooling preserves the flow fabric defined by the phenocrysts aligned under high-shear
conditions. In the case of sills, absolute flow directions are difficult to determine because the possible horizontal
flow sense suggested by the flow fabric may be either one of two opposing directions along this fabric. The Benn
and Allard (1989) method is thus an essential procedure in the determination of an absolute flow direction. In the
case of dykes, however, it may usually be assumed that the flow sense is upward (unless phenocryst orientations
indicate lateral magma movement), and thus an absolute flow direction may be deduced from the flow fabric. This
assumes no post-emplacement strike-parallel rotation or tilting of the dykes. Measurements must again be made
from thin sections taken against the chilled margins, where the high rates of shear produce a dyke wall-parallel
alignment.
Before a digital analysis of flow direction is performed on a Rooi Rand dyke, it is necessary to defme the three
dimensional axes used to describe planes in space. Figure 5.16 illustrates the reference axes used to defme the three
orthogonal planes represented by the thin sections to be analysed.
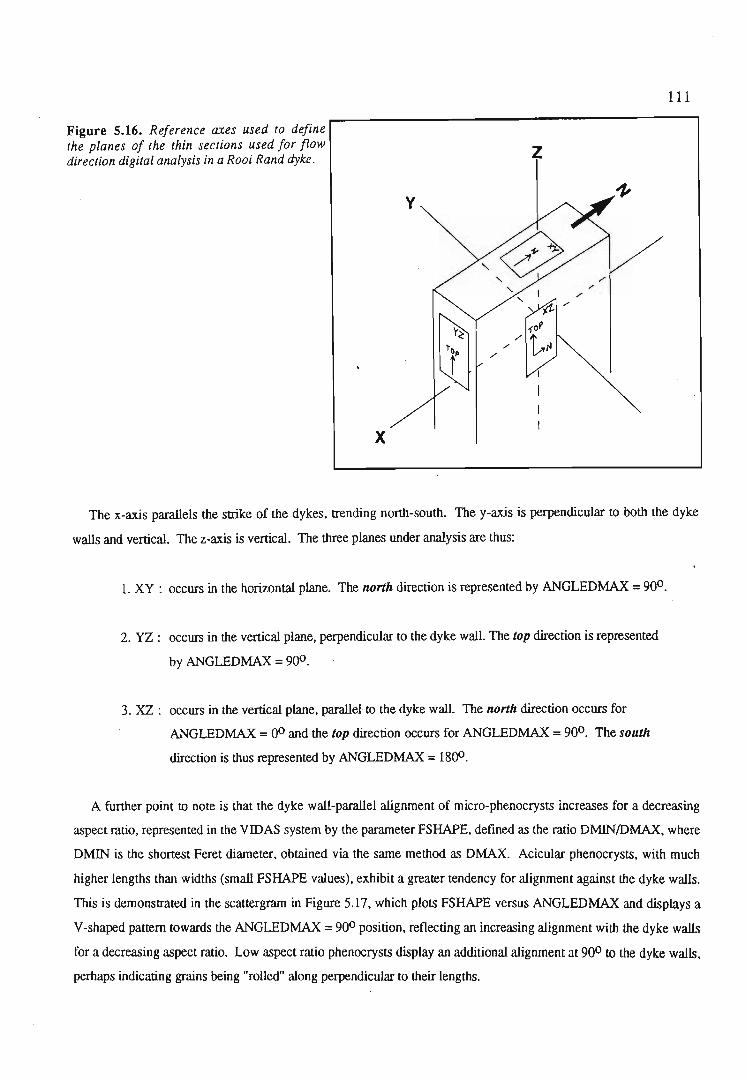
111
Figure 5.16. Reference axes used to definethe planes of the thin sections used for flowdirection digital analysis in a Rooi Rand dyke . z
y
~" ,/1-, ;'
..... ...I ;'-,
;'..... rz.fOP
,/
t~'",/
x
The x-axis parallels the strike of the dykes, trending north-south. The y-axis is perpendicular to both the dyke
walls and vertical. The z-axis is vertical . The three planes under analysis are thus:
1. XY: occurs in the horizontal plane. The north direction is represented by ANGLEDMAX =900 .
2. YZ: occurs in the vertical plane, perpendicular to the dyke wall. The top direction is represented
by ANGLEDMAX = 900 .
3. XZ: occurs in the vertical plane, parallel to the dyke wall. The north direction occurs for
ANGLEDMAX =00 and the top direction occurs for ANGLEDMAX =90°. The south
direction is thus represented by ANGLEDMAX =1800.
A further point to note is that the dyke wall-parallel alignment of micro-phenocrysts increases for a decreasing
aspect ratio, represented in the VillAS system by the parameter FSHAPE, defined as the ratio DMIN/DMAX. where
DMIN is the shortest Feret diameter, obtained via the same method as DMAX. Acicular phenocrysts, with much
higher lengths than widths (small FSHAPE values), exhibit a greater tendency for alignment against the dyke walls.
This is demonstrated in the scattergram in Figure 5.17, which plots FSHAPE versus ANGLEDMAX and displays a
V-shaped pattern towards the ANGLEDMAX = 90° position. reflecting an increasing alignment with the dyke walls
for a decreasing aspect ratio. Low aspect ratio phenocrysts display an additional alignment at 900 to the dyke walls.
perhaps indicating grains being "rolled" along perpendicular to their lengths.
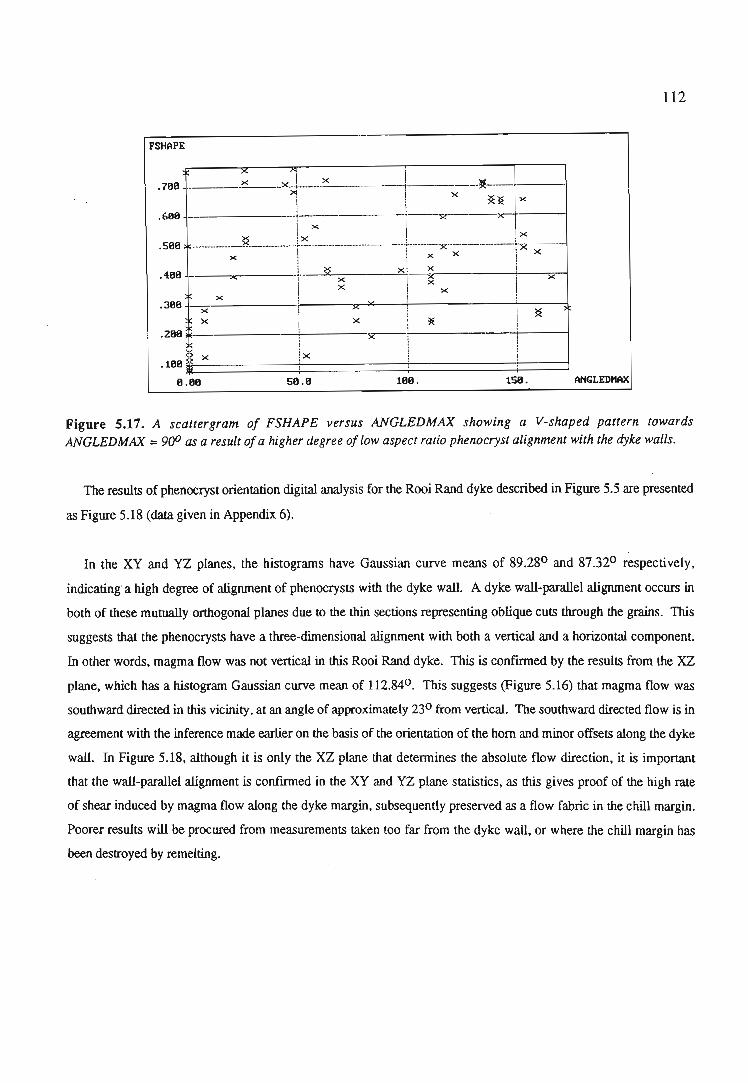
112
FSHAPE
x><
.s BB
.4BB
><x
x
><
><
B.BB sB.B lBB. 158.
Figure 5.17. A scattergram of FSHAPE versus ANGLEDMAX showing a V-shaped pattern towardsANGLEDMAX =9ao as a result ofa higher degree of low aspect ratio phenocryst alignment with the dyke walls.
The results of phenocryst orientation digital analysis for the Rooi Rand dyke described in Figure 5.5 are presented
as Figure 5.18 (data given in Appendix 6).
In the XY and YZ planes, the histograms have Gaussian curve means of 89.280 and 87.320 respectively,
indicating"a high degree of alignment of phenocrysts with the dyke wall. A dyke wall-parallel alignment occurs in
both of these mutually orthogonal planes due to the thin sections representing oblique cuts through the grains. This
suggests that the phenocrysts have a three-dimensional alignment with both a vertical and a horizontal component
In other words, magma flow was not vertical in this Rooi Rand dyke. This is confirmed by the results from the XZ
plane, which has a histogram Gaussian curve mean of 112.840 . This suggests (Figure 5.16) that magma flow was
southward directed in this vicinity, at an angle of approximately 230 from vertical. The southward directed flow is in
agreement with the inference made earlier on the basis of the orientation of the horn and minor offsets along the dyke
wall. In Figure 5.18, although it is only the XZ plane that determines the absolute flow direction, it is important
that the wall-parallel alignment is confirmed in the XY and YZ plane statistics, as this gives proof of the high rate
of shear induced by magma flow along the dyke margin , subsequently preserved as a flow fabric in the chill margin .
Poorer results will be procured from measurements taken too far from the dyke wall, or where the chill margin has
been destroyed by remelting .

8 .a8172.87
15623.2593.8489.28
11a6.1333 .26
-a .128638a .278847
XyAHGLEDMAX
175a .a8
172.978
1758
1511.532.88
35 .88
fll ..para....~..rcountslower hound:upper hound:underfl owIn rAngeoverflowclasses..odul.. In .cIAss"<LX. ClASS
Statistics.dnl..u....axl",u..su'"..edIAnuA lue:..eAnVAriAnces~d .dev .
skewnesskur~osls
AHGLEDMAX15a .rea,5a .a
ia.a Jl----+~II 1-111-111
a.aa +-.YI.YI.YI~.YI.YI.YI~bA!:&!:&!:&~:zA9a . a8
5 .eaJ.l--~L"~1I1~1 f-I f·1f'. HI Hl t--ttn:".--i
15 .a .).j-----f-71f-If-I' • ~.I__\_--..L-~
za.a J}-----r--,-tll
25. a J}-----+_-. f----i~.I___--__+--1
3a.aJl--- ----'r------+IIr-- ---ir-----i
35. a ....---------.--- -:o;;;>r----:----,Coun~
Figure 5.18. Results ofdigital analysis performedon phenocryst orientationsless than 2mm from thewall of the Rooi Rand dykeshown in Figure 5 .5. Thethree graphs representmutually orthogonal thinsections labelled as in Fig.5 .16.
Coun~ YZAHGLED/'lAX
1437.12
172.978
1438
1511 .a6a.88
4Z.El8
7.12172.87
12487 .3384.9887.32
893.1329.89
-a.4328438 .993873
rileparA....tercountslower hound :upper hound:underflowin ra.ngeoverflowclasses..odul.. In.classIO&X.CIASS
Statistics.. In h.u....axl ......su....edIAnvalu.. :"eAnvariAnces~d .dev.
skewness. kur~osls
AHGLEDMAX
III
I
Ha.
I I II I IN i l1"'.,1 Iilll~
raa.68 .a
I!
i i! !
"la .aJl--f---f---+-."-+-+-+-+---l
28.8
/If
1=. 1 Y iWI.,1l
XZAHGLED/'lAX
138a.88
172.97a
1388
1511.53
2.El828.a8
8 .88172.87
15571.68126.82112 .84
2489.3219 .a8
-8 .918154-8.288337
r u ..para.... tercoun~s
lower hound:upper hound:underflowIn rang..overflowclasses..odul.. in.cla......ax.class
Statls~lcs
.. 1nl ......
...xl ..u..su....edlanvalue:I'lIcanvarlanc..s~d.d.. v .skewnesskur~osls
AtlGLEDMAX158.iea .5a.8
I I r !
I II II~ ~I
lA I
~ 11 ~
15.8
la .a
28.8
a . a8a.aa
5.a8
Coun~
1146. DISCUSSION AND CONCLUSIONS
This investigation was performed with the aim of providing a broad-based characterization of the mechanisms by
which fractures propagate and dilate to form dykes and sills. The intrusive mechanisms are frequently inherent in the
geometrical nature of an intrusion. In this thesis, the mechanisms introduced by Inglis (1913) and Griffith (1924) to
explain fracture propagation, subsequently developed and applied to hypabyssal intrusions by authors such as Pollard,
have been described and evaluated on the basis of comparison with field examples, such as the Mhlatuze River
dolerite sills and the Rooi Rand Dyke Swarm. In addition, further developments have been achieved regarding the
relationship between geometrical features and magmatic flow directions, and the geochemical features of composite
intrusions and fracture tip process zones.
Since 1969, the work of David Pollard on the mechanisms of intrusion has paved the way to a better
understanding of the geometrical nature of dykes and sills , having inspired many authors to further such
developments. The analysis of planar intrusions provided in Chapter 3 documents much of the theory behind the
intrusion mechanics involved. Factors such as intrusion initiation , propagation, process zone behavior, driving
pressures, intrusion rates, host rock effects, stress distributions and controls, and en echelon array development and
linkage introduced the basis on which the Mhlatuze River sills were investigated.
First impressions of the dolerite sills within shales and mudstones along the Mhlatuze River, near Empangeni,
suggest a simple upward stepping nature by which magma migrated towards the surface along planes of weakness.
However, a comparison of the sill features with the documented characteristics of linked en echelon intrusion arrays
suggests that such a mechanism may be invoked to explain the sill geometry. Features such as bent and rotated
bridges and offsets indicate that separate sill segments dilated individually and subsequently underwent tip-to-tip
linkage as a result of tip stress interactions. The dependence of sill tip curvature and overall sill geometry on
parameters such as the sill separation and degree of overlap was also documented.
Justification for the application of the en echelon array mechanism for the sills was provided by calculations of
the magmatic flow direction. Chill zone flow fabrics defined by phenocrysts indicate the magmatic flow to have
been perpendicular to the plane in which the en echelon geometry occurs. Flow was thus along the offset surfaces
and not upwards from one sill segment to the next. Each sill segment thus dilated individually under conditions of
crusta! stress that were conducive to en echelon fracture development. Linkage was a later feature that resulted in
offset and rotated bridge production.
Identification of this mechanism for sill intrusion is important because it obviates the need for out-of-parent
crack-plane rotation of individual sill segments propagating ahead of a parent fracture to explain an en echelon
geometry, as has been suggested by many authors (eg. Sih, 1981; Pollard et al., 1982). The Mhlatuze River sills
are bedding-concordant. There is no evidence that individual segments have undergone rotation. A similar
observation was made for a dyke from the Rooi Rand Dyke Swarm (Chapter 5).

115
The true geometry of an intrusion may be misrepresented where variations occur in the outcrop face orientation.
Such an effect was demonstrated for the Mhlatuze River sills, where changes in the river course caused associated
variations in the outcrop nature of the sills and a distortion of the sill array geometry. Such effects must be
considered during intrusion analysis.
Geochemical analysis of the dolerite sills allowed the nature of composite sills to be determined, providing a
method by which individual intrusive phases may be recognised. This is a useful tool in situations where
interpretations are hampered by poor outcrop occurrences.
Mechanisms of multiple dyke intrusion were described in Chapter 5. The Pongola River outcrop of the Rooi
Rand Dyke Swarm was used to describe some of the features associated with such intrusion types. Individual
intrusive episodes and relative ages may be predicted on the basis of chill zone relationships. Geochemical variations
provide further evidence (Meth, 1991). Linkage of adjacent offset dyke segments is associated with significant
cataclasis and deformation of host rock minerals. Geochemical anomalies in the process zone of propagating
fractures suggests that mineral chemical changes may be facilitating fracture and linkage. It has been concluded that
later intrusions are emplaced into the centres of pre-existing dykes rather than along the weaker contacts and dyke
parallel fractures as a result of uncrystallised dyke centres at depth providing paths for later intrusions (eg.
Gudmundsson, 1990) that continue to propagate through the centres of crystallised dykes at higher crustallevels.
The dynamics of magma flow in a thin fissure was statistically investigated via the method of digital analysis,
which demonstrated the effects of flow differentiation and the effects of shear stress decrease towards dyke centres.
Higher shear stresses along the margins result in a high degree of phenocryst alignment. Such flow fabrics, when
preserved as a chill margin, may be used to predict the magma flow direction in a dyke. Digital analysis of a flow
fabric from a Rooi Rand Dyke suggests magma flow to have been upwards and towards the south, at approximately
23 lJ from vertical. The digital analysis method introduced in this investigation may provide a fast and accurate
method by which flow directions can be determined , and can greatly contribute to future intrusion mechanism
investigations.

116
ACKNOWLEDGEMENTS
The author kindly acknowledges the assistance provided by: D. Meth, A. Bullock, T. Rebelo, D. Rickard, B.
Dudley, S. Schutte, V. Hugo, R. Uken, K. Gifford-Nash, E.P. Saggerson, J. McCarthy and S. Lee. In addition,
appreciation is expressed to C. Harris at the Department of Geochemistry, University of Cape Town, for assistance
with the whole-rock analyses, and to E. Todd of Bay Stone Sales for allowing access to the RBQ Quarry. Helpful
comments on papers based on the content of parts of this project, by C. Roering, W.M. Schwerdtner, and Agust
Gudmundsson are also acknowledged. Sincere thanks to the reviewers of this thesis.
No graduate research project works its way to completion without the guidance, patience and support of an
esteemed advisor. My sincerest gratitude to Mike Watkeys for introducing me to a satisfyingproject, and putting me
on the road to future endeavours.
This project was fmanced in part by a FRO M.Sc. Bursary and the University of Natal Research Fund.
"Limitless are the choices of he who dares to dream."

APPENDICES
117

APPENDIX 1: SYMBOLS AND DEFINITIONS
A. TABLE OF SYMBOLS
118
tS
IlianToT0iI,L,2at,W,2b
ar1ar3
alca2c
a3cPT,TaEalalaTAill
UE11PUsyPPm
ShSHKKcRsiW,2b,tL,2a,1lp
Pm- Pr
gPA11~RhozLB
shear stresscohesive strengthcoefficientof internal frictionstress acting normal to a surfaceuniaxial tensile strengthangle between shear plane and maximumprincipal stressslope of Mohr failure envelopeelliptical crack major axis (see also for sheet intrusion)elliptical crack minor axismaximum uniaxial regional tensile stress
minimum uniaxial regional tensile stressmaximum compressive stressintermediate compressivestressminimum compressive stressradius of curvatureat a crack tiptensile strength of a materialYoung's modulusmaximum local tensile stress at a crack tipcritical tensile strength at instant of crack propagationsurfaceen~gyofacrack
angle between long axis of a crack and ar3strain energy of an elastic solidelastic shear modulusPoisson's ratiopotentialen~gyofacracksurface
surfaceenergyof a crack surface per unit areahydrostatic pressure acting on the internalboundariesof a dilating fractureinternalmagma pressure
minimumregional compressivestress (= _ar1)maximumregional compressive stressstress intensity factorfracture toughnessstress intensity ratiothickness of a sheet intrusionlength of a sheet intrusionperpendicular to flow directionlength of a sheet intrusionparallel to flow directionmagmadensityaveragedensityof crusta!rocksacceleration due to gravitymagma pressure at the top of a vertical intrusionshear viscosityactivationenergy per molegas constantmaximum sill thicknessdepth within the crustwidth of a sillrigidity modulus

As2i)2s202k2cID
2BD,a(P-S),Ap
remote differential compressiondilation thickness of a fractureseparation between fracturesoverlap between two fracturescentre spacing parallel to adjacent crackscentre spacing parallel to crack array axistwist angle of a fracture arraywidth of a fracture arraydilationmagmatic driving pressure
119
B. DEFINITION OF PRINCIPAL STRESSES
During the course of the last few decades, and the corresponding advances in the field of fracture mechanics, there
has been much conflicting usage of principal stress nomenclature in the geological literature. Initial work by
authors such as Inglis (1913) and Griffith (1924) defined the principal stresses as used in the field of engineering.
This involved the use of crI for the maximum tensile stress and cr3 for the minimum tensile stress. However,
Robson and Barr (1964), Roberts (1970) and Pollard (1973), amongst others, use an alternative definition. The most
logical reference stress axis system for rocks situated at depth is a system undergoing triaxial compression. For this
reason, geologists tend to use this stress axis system, in which crI is the maximum compressive stress, cr2 is the
intermediate compressive stress and cr3 is the minimum compressive stress.
The equations that have become the framework of the mathematical aspects of fracture mechanics were thus
developed for systems undergoing tension. Direct applicability to compressive environments has generally been
inferred in subsequent developments. A problem with this , however, is that rock reacts differently under
compression compared to conditions of tension (Jaeger and Cook , 1969), reacting very much weaker under tension
than under compression.
In this thesis, a complete historical analysis of the topic of fracture mechanics and geolog ical applications has
required that both tensional and compressional systems be referenced at various stages. The nomenclature for the
stresses (whether tensional or compressive) is consistent in this thesis, and should be referenced against the list of
symbols presented above.

APPENDIX 2: PETROGRAPHIC DESCRIPTIONS
Sample localities are shown on section maps at end.
1. COARSE·GRAINED DOLERITE:
SAMPLE NO.
120
SK90-5 :
SK90-6
SK90-7
SK90-8
SK90-9
SK90-11 :
SK90-13 :
SK90-18 :
SK90-28 :
Plagioclase: (70%) Oligoclase (altered) with myrmekitic intergrowths.Clinopyroxene: (15%) Pigeonite (chloritised). Sub-ophitic texture.Orthopyroxene: (15%) Possibly enstatite (chloritised).Other: Opaque minerals include pyrite (",,1%).
Plagioclase: Acicular and unoriented. Calcite alteration.Clinopyroxene: Highly chloritised.Orthopyroxene: Highly chloritised. Some calcite replacementOther: ""10% opaques. ""10% phenocrystic content.
Plagioclase: Zoned phenocrysts. Sericitisation.Clinopyroxene: Augite. Chloritisation. Some phenocrysts.Orthopyroxene: Phenocrysts larger than cpx. Dark green alteration rims. Chloritisation.Other: ""10-15% opaques. Largest phenocrysts are plagioclase.
Plagioclase: Sericitised andesine phenocrysts.Clinopyroxene: Smallest phenocrysts. Much chloritisation of groundmass augite.Orthopyroxene: Largest phenocrysts with dark alteration rims. Groundmass opx highlychloritised.Other: Less than 1% opaques. No calcitisation present.
Plagioclase: (75%) Andesine. Groundmass sericitised,Clinopyroxene: (10%) Augite (chloritised).Orthopyroxene: (5%) Hypersthene (chloritised). Dark reaction rims.Other: Small amounts of quartz and biotite. Opaques (""5%).
Plagioclase: (70%) Labradorite. Tabular to acicular. Some small alkali feldspar grains(orthoclase). Sericite exsolution lamellae in some plagioclase crystals.Clinopyroxene: « 10%) Augite (highly chloritised). Tabular or elongate crystals.Orthopyroxene: (10-15%) Hypersthene. Highly chloritised,Other: Opaques (3-5%). Amygdales (3-5%).
Plagioclase: (50%) Tabular and euhedral grains (sericitised).Clinopyroxene: (25%) Augite (fresh) defmes sub-ophitic texture.Orthopyroxene: (25%) Hypersthene (chloritised).Other: Opaques (",,3%).
Plagioclase: Fresh andesinellabradorite.Clinopyroxene: Sub-ophitic augite (chloritised).Orthopyroxene: None.Other: Biotite with pyroxene nucleii. Pyrite pseudomorphs sericitised plagioclase and less
commonly chloritised pyroxene.
Plagioclase: (60%) Labradorite. Unoriented and tabular.Clinopyroxene: (10-15%) Augite. Sub-ophitic texture.Orthopyroxene: (10-15%) Enstatite. Grains are fractured.Other: Glassy matrix (10-15%). Opaques include ilmenite. Some quartz in groundmass.
Remnants of olivine have been calcitised.

121
2. FINE-GRAINED DOLERITE:
SK90-1
SK90-3
SK90-4
SK90-16 :
SK90-20:
SK90-21 :
SK90-22 :
SK90-23 :
SK90-24 :
SK90-25 :
Plagioclase: Acicular. Oftenaltered to a dark brown colour. Flow lineationaround containedphenocrysts.
Clinopyroxene: None (glassymatrix).Orthopyroxene: None (glassymatrix).Other: Darkbrown devitrifiedglassymatrix. Amygdales and calcite veining. Alkali feldspar
phenocrysts.
Plagioclase: Too fine-grained to identify.Clinopyroxene: None (glassymatrix).Orthopyroxene: None (glassymatrix).Other: Disseminated opaques(10%)are the largestcrystals in the rock. Calcite+ quartz
amygdales with greenreactionrims.
Plagioclase: Acicularand altered. Flow fabricat sill base.Clinopyroxene: Acicularand dark.Orthopyroxene: Acicularanddark.Other: Colourlessglassy matrix. Quartz xenocrysts.
Plagioclase: (60%)Labradorite. Acicularand sericitised.Clinopyroxene: (15-20%) Augite (chloritised). Sub-ophitic texture.Orthopyroxene: (15%?)No fresh grains. Completelychloritised.Other: Opaques(1%). Calcite. A little biotite.Calcite amygdales (3%).
Plagioclase: (60%) Acicular to prismatic. Highly sericitised,Clinopyroxene: Almost totally chloritised.Orthopyroxene: Almost totally chloritised.Other:Rock contains=10% unalteredpyroxeneand 25% chlorite. Pyrite is pseudomorphing
sericitisedplagioclase. Some biotite«3%). Amygdales (=3%) with infill as definedinmain text.
Plagioclase: (60%)Fresh grains (now at the centre of the sill).Clinopyroxene: (20-25%) Augite(chloritised).Orthopyroxene: «5%) Hypersthene (chloritised).Other: Green-brown biotite (5%). Chlorite (10%).
Plagioclase: (65%)Acicularand slightlysericitised.Clinopyroxene: (25%) Chloritised.Orthopyroxene: (10%)Alteredto chlorite.Other: A little biotite (=1%). Some phenocrysts.
Plagioclase: Veryfme-grained acicularplagioclase. Phenocrysts are sericitised.Clinopyroxene: None (glassy).Orthopyroxene: None (glassy).Other: Glassy groundmass. Calcite amygdales ringed by glass.
Plagioclase: (65-70%) Fresh plagioclasegrains.Clinopyroxene: (25%) Very little chloritisation.Orthopyroxene: Nonerecognised.Other: Green-brown biotite (5%). Chlorite«3%).
Plagioclase: Acicularand sericitised.Clinopyroxene: Almost totally altered to chlorite.Orthopyroxene: Almost totallyaltered to chlorite.Other: Scatteredcalcite in groundmass, and in amygdales.

SK90-26 : Plagioclase: (60%) Tabular and fresh.Clinopyroxene: (20%) Augite.Orthopyroxene: Highly chloritised (chlorite 5-10%). ., . . .Other: Green-brown biotite (10%). Pyrite (5%) pseudomorphing sericitised plagioclase,
Amygdales with usual mineral assemblage.
122
3. XENOLITHIC DOLERITE
SK90-27 : Plagioclase: Sericitised, tabular. randomly oriented grains.Clinopyroxene: No fresh cpx observed.Orthopyroxene: Hypersthene altering to chlorite.Other: Accessory minerals are sphene, hematite and pyrite. Dolerite component comprises
=40% of rock volume. Xenocrysts of quartz and orthoclase. Quartz is embayed andexhibits strained extinctions. Disaggregated grains show optical continuity. Feldspargrains are highly disaggregated and calcitised.
4. DOLERITE QUARRY THIN-SECTIONS:
SK91Ql :
SK91Q2
SK91Q3
SK91Q4
SK91Q5
SK91Q6
Plagioclase: (60%) Large crystals.Clinopyroxene: (20%) Augite. Large crystals grew after plagioclase.Orthopyroxene: (=20%) Ill-defmed small grains. Altered .Other: Small grains of ilmenite in groundmass. Amygdales contain chlorite, thompsonite,
calcite and quartz.
Plagioclase: (50%) Oligoclase/andesine (sericitised). First-formed mineral. Myrmekiticintergrowths with quartz.Clinopyroxene: (25%) Augite. Largest crystals. Often euhedral and unaltered.Orthopyroxene: (25%) Hypersthene. Serpentinised rims and cracks.Other: Opaques (3%) include pyrite. Lesser biotite «1%).
Plagioclase: (55%) Andesine. Finest component of rock. Sericitised.Clinopyroxene: (15%) Augite (+ little titanaugite). Largest grains.Orthopyroxene: (30%) Hypersthene. Serpentinised rims and cracks.Other: Opaques (=3%).
Plagioclase: (50%) Andesine. Much grain-size variation. Sericitised.Clinopyroxene: (20%) Last formed mineral. Chloritised.Orthopyroxene: (25%) Large grains. Sub-ophitic. Serpentinised rims.Other : Opaques (>5%) include secondary pyrite. Small amounts of quartz juxtaposed
against chlorite. Biotite «1%).
Plagioclase: (55%) Andesine (highly sericitised). Some phenocrysts.Clinopyroxene: (30%) Has deteriorated into a brown, shapeless mineral.Orthopyroxene: (10%) Largest grains. Alteration to chlorite and serpentine with minor amounts
of quartz as a by-productOther: Opaques (5%).
Plagioclase: (45-50%) Highly sericitised. Phenocrysts form glomero-porphyritic clumps withhypersthene phenocrysts.
Clinopyroxene: (35-40%) Augite, altered to brown chlorite.Orthopyroxene: (10%) Hypersthene. Phenocrysts that settled to sill base. Glomero-porphyritic
with plagioclase.Other : Opaques (5-10%) include secondary pyrite associated with ilmenite and hematite.

SK91Q9
SK91Q10 :
SK91Q12:
SK91Q13 :
SK91Q15 :
SK91Q16 :
SK91Q17 :
123Plagioclase: (=60%)Clinopyroxene: (20-25%)Orthopyroxene: (15-20%)Other: Opaques (5%)
Plagioclase: (50%) Fine-grained and sericitised.Clinopyroxene: (30%)Largestgrains. Sub-ophitic texture.Orthopyroxene: (20%)Highlyalteredwith serpentinised rims.Other : Opaques(=1%)and small amountsof biotite.
Plagioclase: Very large grains. Tri-modal orientation direction.Clinopyroxene: Augite. Very large grains.Orthopyroxene: No freshopx observed.Other : Unusualalterationproducts. Coloursare dark brown,bright orange, dull green or
pale yellow. Fine-grained chloritein the groundmass + some calcite. Ilmenitegrainsdefinea bimodallineation trend.
Plagioclase: Altered,small, acicularcrystals.Pyroxene: No fresh pyx. Alteredto green chlorite.Other:Doleriteis xenolithic. Xenocrysts of quartzand clay. Quartz is recrystallised with 120·
grainboundarytriple junctions. The xenocrysts defme a foliation. Also present:calciteand secondary pyritepseudomorphing plagioclase.
Plagioclase: Highlyaltered, acicular, lightbrown grains.Pyroxene: Small amountof augite. Mostlyaltered to a fibrous, green chlorite.Other: Xenolithic doleritesill margin. Quartzxenocrysts are embayed. Feldsparxenocrysts
are calcitised. All xenocrysts containalignedinclusions that defmea foliation. Opaqueminerals grow along the foliation, and containaligned inclusions.
Plagiociase: (55%) Sericitised labradorite.Clinopyroxene: (30%)Augite, Alteredto green chloritealongcracks.Orthopyroxene: (=10%) Hypersthene. Frequently unaltered.Other: Opaques (5%)are euhedral hexagonal. Minoramounts of quartz, K-feldspar and
calcite. Myrmekitic intergrowths of K-feldspar and plagioclase.
Plagioclase: (50%)Sericitised.Clinopyroxene: (25-30%) Augite. Alteration to brightgreen chlorite.Orthopyroxene: (15-20%) Hypersthene. Grainsare surrounded by a ring of augite. Subsequent
serpentinisation of opx corescaused a volumeincreasing, resultingin the augite rimsbecoming cracked.
Other: Opaques «3%).

w
-9001000_110012001300140015001600 f
Vryheld Fm I VoIksru st Fmcontact .....
1700
?~i%:'~~,;;::·.;';' :~: ;'-,:~~':~~~~;;~~~i~~Yf)}~'~,z;;;~J::;",,,',~,_ " "" •• •;, "'~-"' '' '' ~ I' -'' '' ' ''~~...:. ~:::,,::::_.;~. _ . " . ...~:.; ...~ ' !I ../ I"} '= ! ~ _ ... ·/,·;·:~..::.,~:l~:; :~~:;::~.~-------·
1800
E
s N
900 800 25 omotr..
SAMPLE LOCALITIESLEGEND
SK90- SERIES
~Volksrust Fm: sntstone, m uds tono.
Vryheld Fm sandstone, siltslone . E]:..,.' ,.. ~
: ,' ~ ..' Coarse-tJrained dolcrilo
fino -grained dolorilo
I
/ faultI
_ Xenoli lhic dolcfile
.......N.p..

LE LOCALITIESSAMP
SK91-Q SERIES
125

126
APPENDIX 3: MICROPROBE ANALYSES (EMPANGENI DOLERITES)
NOTE: All sample locations are shown on section map atend.
1. COARSE-GRAINED DOLERITE MARGINS:
1.1. Sample SK91-4
1.1.1. pyroxene data : (ND = not detected)
si02 54.56 54.30 54.55 54.89 54.61 52.54Tio2 0.25 0.26 0.25 0.23 0.24 0.46A1203 1.38 1.26 1.10 1. 09 1.16 1.35Cr203 0.19 0. 18 0.13 0.11 0.11 NDFeO 13.43 13.52 13 .46 13 .59 13 .88 13 . 92MnO 0.25 0.28 0 .36 0.31 0.29 0.35MgO 28.13 27 .91 28.06 28.40 27 .50 16.98CaO 2.17 2 .11 2.21 2.26 2.25 14.61Na20 ND ND ND ND ND 0.18K20 ND ND ND ND ND ND
TOTAL 100.36 99.82 100.12 100.88 100 .04 100.39
WO 4.17 4.09 4.24 4.30 4 .35 29 .59EN 75 .28 75.08 75.01 75.08 74.19 47.85FS 20.55 20.83 20.75 20.62 21.46 22.56
1.1.2. Plagioclase data:
Na20 4.03 4.03 4.58 3.33 3.43 3.40 3.69K20 0.24 0.27 0.22 0.14 0.19 0.17 0.21Si02 53.73 54.43 55.63 52.83 53.01 52.91 53.48A1203 29.59 28.73 28.31 30 .03 30 .20 29.99 29.89FeO 0.70 0.82 0 .75 0 .68 0.82 0.77 0.84MgO 0 .22 0.25 0.11 0.18 0.25 0.16 0.17CaO 12.67 11.96 11. 66 13 .64 13 .61 13 .86 13.29
TOTAL 101.18 100.49 101. 26 100.83 101.51 101. 26 101. 57
AB 36.01 37.26 41. 01 30.40 30.96 30.42 33.03OR 1.39 1. 64 1.29 0.86 1.11 1. 00 1.27AN 62.59 61.10 57.70 68.74 67.93 68 .58 65.71

127
Na20 3.55 3.85 4.17 3.37 3.49 3.88 3.48K20 0.22 0.21 0.27 0.17 0 .17 0.20 0.20Si02 52.43 53.93 54.02 52.24 52.81 53.39 53.04A1203 29.93 29.24 28 .82 29 .92 29.78 29.40 29.74FeO 1.06 0.78 0.94 0.64 0.78 0.81 0.83MgO 0.20 0.17 0.18 0.18 0.25 0.18 0.18CaO 13 .57 12.76 12.13 13.74 13 .31 12.80 13 .30
TOTAL 100.96 100.94 100.53 100.26 100.59 100.66 100.77
AB 31. 73 34.86 37.73 30.40 31.87 35.00 31. 76OR 1.27 1.26 1. 63 1. 02 1. 00 1.20 1.18AN 67.00 63.88 60 .64 68.58 67.13 63.80 67.06
Na20 4.27 4.51 6.03K20 0.21 0.89 0.36Si02 54.48 55.29 58.71A1203 25.24 28.52 26.40FeO 3.28 0.96 0.83MgO 1.41 0.11 0.06CaO 11.11 10.23 8.58
TOTAL 100.00 100.51 100.97
AB 40.49 41.97 54.78OR 1.31 5.47 2.13AN 58.21 52 .56 43 .08
1.2. Sample SK91-6
1.2 '.1. Pyroxene data:
si02 51. 06 51. 07 51.27 52.59 51.53 51. 06Tio2 0.84 0.47 0.57 0.48 0.63 0.76A1203 1.57 0.76 1. 76 1. 67 0.93 1.92Cr203 ND ND ND ND ND NDFeO 15.00 26.26 14.88 10.90 15.79 13.96MnO 0.31 0 .58 0.34 0.26 0.33 0.31MgO 12.98 15.79 15.21 16.28 12.72 14.25CaO 18.30 4.85 16.35 18.14 18.10 17.60Na20 0.23 0.10 0.24 0.20 0.23 0 .26K20 ND ND ND ND ND ND
TOTAL 100.29 99.88 100.62 100.52 100.26 100.12
WO 37.88 10.15 33.10 36.64 37.41 36.24EN 37.38 45.98 42.84 45.76 36 .57 40 .81FS 24.74 43.86 24.06 17.60 26.01 22.94

128
1.2 .2. Plagioclase data :
Na20 3.90 4 .08 4.02 4.40 5.33 6.11 5.15K20 0.23 0 .23 0.22 0.24 0 .36 0.41 0.34Si02 53.63 54.10 53 .92 53.75 56.04 57.49 55 .42A1203 29.41 29.01 28 .31 28.72 27.09 25.91 27.53FeO 0.64 0.66 1.80 0.90 0.76 0.67 0.89MgO 0.14 0.11 0.35 ND 0.08 ND 0 .08CaO 12 .83 12.47 11.58 11.80 10.06 8.77 10.67
TOTAL 100.78 100.66 100.20 99.81 99.72 99.36 100 .08
AB 34 .99 36 .67 38.02 39 .72 47 .91 54.45 45 .68OR 1.37 1.34 1.38 1.42 2.13 2.39 2.00AN 63 .64 61. 99 60 . 60 58.85 49.95 43.16 52 .32
2. COARSE-GRAINED DOLERITE CENTRES:
2. 1. Sample SK91-11
2.1.1. Pyroxene data:
Si02 54.14 52.02 50.84 51.31 51.00 50.11 51.23Ti02 0.28 0 .51 0.65 0.47 0.54 0.54 0.50A1203 1.24 1.89 2.07 1. 77 1. 75 1.88 1. 79Cr203 0.12 ND ND ND ND ND NDFeO 15 .55 10.10 13.02 10.68 10.93 11.81 10.04MnO 0.33 0.23 0.33 0 .24 0.25 0.27 0.21MgO 26.20 16.84 15.60 16.54 16.37 15.43 16.80CaO 2 .20 18.34 17 .58 18.24 18.13 18.65 18.53Na20 ND 0.20 0.26 0.19 0 .24 0.23 0 .21K20 ND ND ND ND ND ND ND
TOTAL 100.06 100.13 100.35 99.34 99.21 98 .92 99.31
WO 4.30 36.81 35.38 36.64 36 .53 37.64 37.13EN 71.41 47.01 43.66 46.23 45.88 43 .33 46.82FS 24 .29 16.18 20.96 17.13 17.60 19.03 16.05
Si02 50.76 52.88 52.89 52.61Ti02 0.68 0.43 0 .49 0 .52A1203 2.09 1.80 2.03 2.00Cr203 ND ND ND 0.10FeO 14.51 8 .91 9.25 9.11MnO 0.45 0 .24 0.26 0.28MgO 14.72 17 .18 16 .78 16.71CaO 17.03 19 .03 18.93 19.28Na20 0.26 0 .22 0.23 0.23K20 ND ND ND ND
TOTAL 100.50 100.69 100.86 100.84

WOENFS
34.6341.6223 .75
38.0147.7214.27
38.0946 .9 714.94
38.6746.6314.70
129
2 .1.2. Plagioc lase data:
Na20 5 .7 5 5 . 72 6.04 3 .96 3.90 5 .41 3.66
K20 0.41 0.43 0.41 0.19 0 .17 0.32 0.20Si02 57.74 57.64 58.24 54.12 53.66 57.25 53.30A1203 26.72 26.68 26.51 29 .65 29.90 27.64 29.98FeO 0.74 0.77 0.70 0.78 0.87 0.69 0.75MgO ND 0.05 0 .06 0 .13 0.10 0.09 0.12CaO 9.12 9 .15 9 .04 12 .60 12.91 10.23 13 .10
TOTAL 100 .48 100.44 101.00 101. 43 101.51 101. 63 101.11
AB 51. 99 51. 72 53.40 35.83 34.97 47.97 33.14OR 2.41 2 .57 2.42 1.13 0.98 1.89 1.22AN 45.60 45.71 44.18 63.04 64.04 50.13 65 .64
Na20 3.73 3.90 3.40 3.53 3.36 4.63 3.67K20 0.18 0.19 0.14 0.15 0.17 0.24 0.19Si02 53.07 53.87 52.01 52.99 51.62 55.22 53 .08A1203 29.91 29.27 26 .93 30.27 30.07 28.35 29 .62FeO 0.83 0.85 3.37 0.79 1. 06 0.88 0.93MgO 0.12 0.08 1.46 0.09 0 .08 0.09 0.11CaO 13 .18 12.69 13 . 09 13 .35 13.54 11 .23 13 .01
TOTAL 101.02 100.85 100.40 101.17 99.90 100.64 100 .61
AB 33.53 35.31 31.66 32.08 30.67 42.16 33.42OR 1. 07 1.15 0.88 0 .88 1. 01 1.42 1.12
,
AN 65.40 63.54 67.46 67.04 68.32 56.43 65.46
Na20 3.91 4.25 7.11K20 0.16 0.20 0. 73Si02 52.97 53.61 61.46A1203 29.33 28.89 23.82FeO 0.94 1.02 0.80MgO 0.12 0.09 NDCaO 12.72 12.10 6.00
TOTAL 100 .15 100 .16 99.92
AB 3 5.40 38.37 65.15OR 0 .98 1.20 4.43AN 63.62 60.43 30.43

130
2.2. Sample SK91-13
2.2.1. Pyroxene data:
si02 50.18 50.00 53.32 52.87 54.26 54.10 50.75Ti02 0.36 0.37 0.34 0.35 0.21 0.20 0 .59A1203 0.64 0.60 1. 09 1.29 1. 30 1. 72 1.85Cr203 ND ND ND ND 0.13 0.20 NDFeO 25.93 27.88 16.54 19.36 13.66 14.80 11. 68MnO 0.56 0.59 0.32 0.34 0.28 0 .28 0.28MgO 18.25 14.70 26.09 23.96 28.24 27.17 15.72CaO 3.08 5.19 2.31 2.11 2.20 2.16 17.78Na20 ND ND ND ND ND ND 0.23K20 ND ND ND ND ND ND ND
TOTAL 99.00 99.33 100.01 100.28 100.28 100.63 98.88
WO 6.27 10.83 4.46 4.14 4.19 4.18 36.29EN 51. 66 42.73 70.11 65.69 75.02 73.07 44.65FS 42.07 46.44 25.43 30.26 20.79 22.76 19.06
Si02 50.47 52.17 50.52 53.56 51. 39Ti02 0.73 0.49 0.72 0.27 0.34A1203 1.51 1.80 1. 61 1.38 0.86Cr203 ND ND ND 0.15 0.10FeO 15.17 10.05 16.70 13 .95 22.65MnO 0.38 0.24 0.36 0.37 0.36MgO 13.69 16.97 12.50 27.30 21.93CaO 17.47 18.09 17 .24 2.53 1.99Na20 0.24 0.20 0.28 ND NDK20 ND ND ND ND ND
TOTAL 99.69 100.01 99.93 99.51 99.62
WO 35.90 36.37 35.96 4.90 3.94EN 39.13 47.47 36.26 73.40 60.45FS 24.96 16.16 27.78 21. 62 35.61
2.2.2. Plagioclase data:
Na20 3.89 3 .96 4.12 3.67 3.67 4.27 5.43K20 0.25 0.22 0.25 0.17 0.18 0.22 0.30Si02 52.82 52.73 52.98 52.51 52.65 54.55 56.00A1203 29.30 28.96 28.71 30.00 30.04 29.07 27 .05FeO 0.82 0.81 1. 02 0.73 0.79 0.81 0.70MgO 0.08 0.09 0.08 0.10 0.07 0.08 0.05CaO 12.75 12.70 12.24 13.27 13 .29 11.92 10.55
TOTAL 99.91 99.47 99.40 100.45 100.69 100.92 100.08
AB 35.03 35.59 37.27 33.04 32.98 38.80 47.37OR 1.46 1.31 1.50 1. 03 1. 04 1.30 1. 73AN 63 .50 63.10 61.23 65.93 65.98 59.90 50.90

131
Na20 4.19 3.98 4.00 4.26 5.13 4.34 4.39
K20 0.22 0.21 0.22 0.24 0.34 0.24 0.26
si02 53.84 52.38 53.02 54.15 56.66 53.66 53.84
A1203 29.29 28.88 29.02 28.54 27.52 28.24 28.23
FeO 0.86 0 .81 0.80 0.78 0.79 0.86 0.91MgO 0.06 0.11 0.09 0.08 0.06 0.09 0.10CaO 12.31 12 .51 12.55 11.88 10.14 11. 70 11.58
TOTAL 100.77 98.88 99.70 99.93 100.64 99.13 99.31
AB 37.64 36.07 36.11 38.79 46.84 39.58 40.03OR 1.32 1.28 1.32 1.46 2.06 1.41 1.58AN 61. 04 62.65 62.57 59.75 51.10 59.00 58.39
3. FINE-GRAINED DOLERITE:
3 .1. Sample SK91-8
3.1.1. Pyroxene data:
Si02 50.20 49.35 48.09 49.09 48.55 48.57 49.84Tio2 0.82 0.84 1. 40 1.24 1.38 0.69 0.58A1203 1.15 1. 03 1.57 1. 66 1.47 2.10 1.49Cr203 ND ND ND ND ND ND NDFeO 25.06 28.28 23.55 21. 72 26.22 24.85 24.23MnO 0.55 0.56 0.51 0.47 0.52 0.50 0.53MgO 14.68 12.71 10.00 11.93 14.83 15.30 12.54CaO 7.01 7.44 13.66 13.75 14.83 7.33 9.14Na20 ND ND 0.11 0.12 0.11 0.10 0.12K20 ND ND ND ND ND ND ND
TOTAL 99.47 100.21 98.89 99.98 100.48 99.44 98.47
WO 14.79 15.61 29.47 28.84 32.23 15.14 19.90EN 43.05 37.12 30.00 34.82 22.37 43.98 38.00FS 42.16 47.27 40.53 36.34 45.40 40.89 42.10
si02 50.43 49.37Ti02 1. 07 1.42A1203 1.08 1.56Cr203 ND NDFeO 24.81 22.88MnO 0.47 0.41MgO 15.81 10.78CaO 6.37 13 .88Na20 ND 0.12K20 ND ND
TOTAL 100 .04 100.42
WO 13 .25 29.50EN 45.72 31.87FS 41. 03 38.63
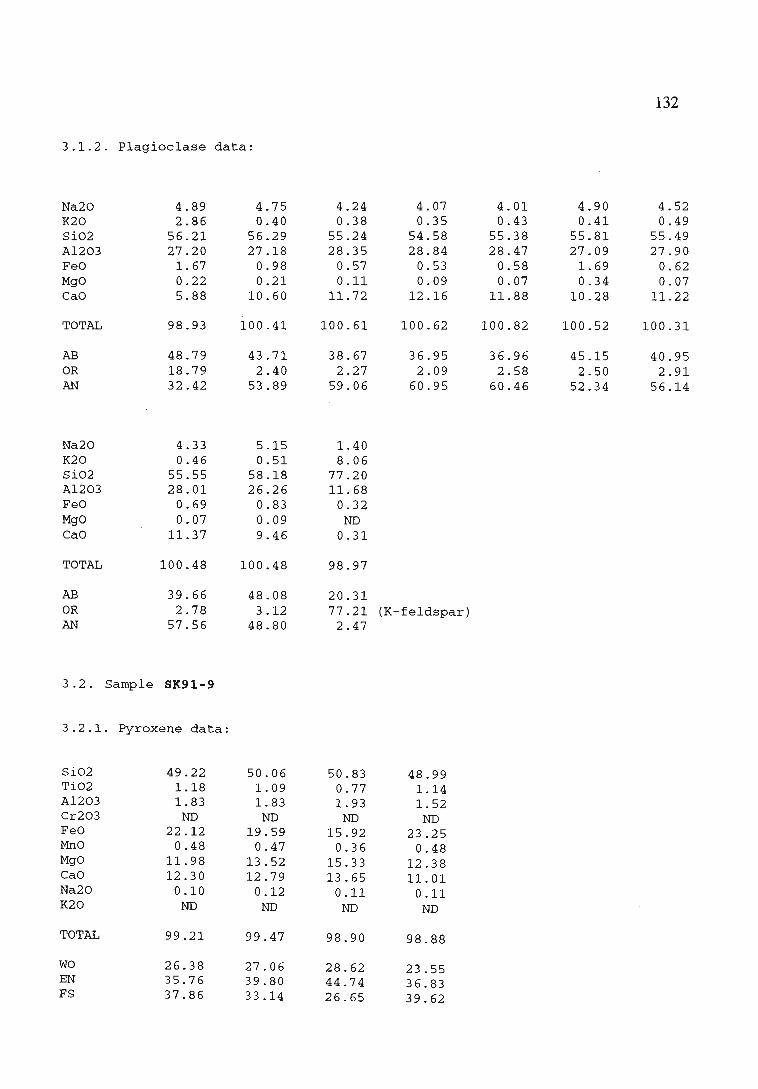
3.1.2. Plagioclase data:
132
Na20 4.89 4. 75 4 .24 4 .07 4.01 4 .90 4.52K20 2.86 0.40 0.38 0.35 0.43 0.41 0.49si02 56.21 56.29 55.24 54.58 55.38 55.81 55.49A12 03 27 .20 27.18 28.35 28.84 28.47 27.09 27.90FeO 1. 67 0 .98 0.57 0 .53 0.58 1. 69 0.62MgO 0.22 0.21 0.11 0.09 0.07 0.34 0 .07CaO 5 .88 10.60 11. 72 12.16 11.88 10.28 11 .22
TOTAL 98.93 100.41 100.61 100 .62 100.82 100 .52 100.31
AB 48.79 43 .71 38.67 36.95 36.96 45.15 40.95OR 18.79 2.40 2.27 2.09 2.58 2.50 2.91AN 32.42 53.89 59.06 60.95 60.46 52 .34 56 .14
Na2 0 4.33 5.15 1.40K20 0 .46 . 0.51 8.06si02 55.55 58 .18 77.20A120 3 28.01 26.26 11. 68FeO 0.69 0.83 0.32MgO 0.07 0.09 NDCaO 11.37 9.46 0.31
TOTAL 100 .48 10 0.48 98.97
AB 39.66 48 .08 20.31OR 2. 78 3.12 77.21 (K-feldspar)AN 57.56 48.80 2 .47
3 .2. Sample SK91-9
3.2 .1. Pyroxene data:
Si02 49.22 50.06 50 .83 48.99Ti02 1.18 1. 09 0.77 1.14A1203 1.83 1. 83 1.93 1.52Cr203 ND ND ND NDFeO 22.12 19.59 15.92 23 .25MnO 0.48 0 .47 0 .36 0 .48MgO 11.98 13 . 52 15.33 12 .38CaO 12 .30 12 .79 13 .65 11. 01Na20 0.10 0.12 0.11 0.11K20 ND ND ND ND
TOTAL 99 . 21 99.47 98.90 98 .88
WO 26.38 27.06 2 8 . 62 23.55EN 35.76 39.80 44 .74 36.83FS 37.86 33.14 26 .65 39.62

1333 .2.2. Plagioclase data:
Na20 4.23 4.27 4.11 4.66 4.40 3.96K20 0.47 0.46 0.45 0.41 0.56 0.40Si02 55.68 55.31 54 .94 56.36 55.60 54.73A1203 27.04 27.29 26 .97 27.01 26.58 27 . 3 6FeO 0 .74 0.81 0 .80 1.57 0 .67 0.64MgO 0.14 0.17 0.25 0.36 0.15 0 .18Ca O 11.13 11. 35 11.16 10.59 10.84 11. 72
TOTAL 99.43 99 .66 98 .68 100.96 98.80 98.99
AB 39.57 39.39 38.87 43.22 40.92 37 .02OR 2.87 2.77 2.80 2.53 3.41 2.48AN 57.57 57.85 58.3 3 54 .25 55.67 60.51
4. LIST OF AB BREVIATIONS:
NO = not detectedEN= enstatiteAB = albiteAN =anorthite
wo = wollastonitePS = ferrosiliteOR= orthoclase

w
'~:~~ :J~.:~~...6.... -•. : - • 1-,j ";t ' ,!-1' -:_,,: I_'\ . , ..
· 1100 _ 1000 _ - -00012001300140015001600 I
Vryheld Fm I VoIksrust Fmcceteet ....
1700
~:~!.:~:;;~:~~~:~~~~:~~tf~~!f~~}Y~w~:?~1800
E
5 N
900 800
~ "-.
700 600
9
SAMPLE LOCALITIES
_ Xcnolithic dol erno
SK91- SERIES o Volkssusl Fm :
!ill Vl)'IlBid Fm :
I
/ 'aultI
LEGEND
sillslono, mudstone.
sandstone. siltstono. tj,..,
v t ... ~... " .• , v ;ColUsc-grwned dolorilo
Rne-grained <IolerilB
......W+>-

APPENDIX 4 : DYKE TIP MINERAL MICROPROBE DATA
135
A) PLAGIOCLASE DATA
NOTE: Distance from crack is in microns
SLIDE SK92-El:
CaO Na20 FeO Si02 MgO Al203 Crack dist.
14.98 3.14 0.90 51.09 0.21 30.86 616.62 2.09 0.57 48.38 0.15 30.59 2017.39 1.91 0.66 48.15 0.20 28.99 50
14.06 3.60 0.81 52.12 0.31 28.83 614.29 3.39 0.59 51.95 0.20 28.45 2014.47 3.34 0.63 51.73 0.21 28.05 50
13.16 4.15 0.78 53.02 0.15 28.62 614.38 3.53 0.68 51.91 0.16 28.38 2014.58 3.29 0.72 51.78 0.27 27.64 50
11.87 3.01 4.96 48.51 2.41 28.26 614.55 3.26 0.70 51.18 0.21 28.35 2014.84 3.26 0.58 50.99 0.15 26.22 50
SLIDE SK92-D4:
CaO Na20 FeO Si02 MgO Al203 Crack dist.
16.98 1.91 0.51 49.48 0.24 32.06 5016.38 2.26 0.82 49.89 0.34 30.97 2017.02 1.87 0.95 48.89 0.47 31.46 6
16.81 2.02 0.73 48.35 0.19 30.29 5016.69 2.12 0.55 47.95 0.17 30.13 2016.71 1.98 0.68 47.95 0.17 30.34 6
14.61 3.34 0.65 52.32 0.19 29.38 4014.71 3.22 0.67 51.99 0.19 29.27 2014.65 3.12 0.85 52.04 0.26 29.29 6
12.80 4.51 0.92 54.66 0.18 27.76 4012.83 4.45 1.18 54.19 0.25 27.94 2012.39 4.37 1.89 54.38 0.55 27.73 6

136
SLIDE SK92-Cl:
CaO Na20 FeO Si02 MgO A1203 Crack dist.
13.67 3.95 0.69 52.74 0.19 29.51 3013.49 4.06 0.64 52.65 0.16 29.06 2013.15 4.19 0.81 53.06 0.16 28.79 6
14.13 3.19 0.61 51.44 0.20 29.50 3013.94 3.68 0.74 51.69 0.23 29.50 209.94 4.93 4.21 52.92 1.55 26.10 6
12.31 4.75 0.74 54.59 0.12 28.37 3011.89 4.85 0.80 54.32 0.13 27.86 2011.61 4.86 1.77 54.79 0.61 26.85 6
13.58 4.01 0.65 53.34 0.18 29.48 3013.00 4.21 0.72 53.06 0.12 28.83 2012.85 4.29 0.91 53.34 0.23 28.63 6
SLIDE SK92-D2:
Cao Na20 FeO Si02 MgO A1203 Crack dist.
11.49 5.25 0.92 55.40 0.10 27.60 3011.36 5.24 1.06 55.13 0.12 27.29 2011.04 5.17 1.91 54.60 0.51 26.18 6
B) PYROXENE DATA:
SLIDE SK92-El:
Si02 FeO CaO MgO A1203 Crack dist.
50.81 7.05 20.30 16.73 3.05 5049.72 6.71 20.44 16.44 3.06 2049.97 6.72 20.45 16.46 3.30 6
50.93 7.13 19.10 17.20 3.34 5051.47 7.48 19.38 17.64 3.26 2050.66 7.34 19.25 17.33 3.36 6
51.16 9.94 19.15 15.95 2.81 6051.20 9.77 19.12 15.80 2.76 4050.72 9.94 19.03 15.93 2.76 2048.98 13.47 17.65 13.78 3.30 6

SLIDE SK92·D4:
Si02 FeO Cao MgO Al203 Crack dist.
50.39 15.52 16.74 14.41 2.28 5049.41 17.05 16.10 14.00 2.18 2048.89 16.98 15.87 13.74 2.12 6
52.36 12.96 17.21 16.35 1.63 4052.28 13.31 16.10 16.38 1.92 2052.44 13.46 16.40 16.42 1.59 6
52.83 7.27 19.21 17.12 2.72 4053.88 6.69 20.66 17.58 2.08 2052.90 7.19 19.97 17.22 3.00 6
SLIDE SK92·Cl:
Si02 FeO CaO MgO Al203 Crack dist.
52.65 8.13 19.61 16.72 2.06 5052.59 9.37 19.04 16.41 1.94 3052.07 8.13 19.53 16.73 2.06 8
50.93 15.92 15.01 15.41 1.51 4050.81 17.00 14.40 15.26 1.55 1050.84 17.73 13.91 14.94 1.55 4
SLIDE SK92·D2:
Si02 FeO CaO MgO Al203 Crack dist.
52.69 6.54 20.96 17.07 3.03 3052.46 6.61 20.70 16.87 3.02 2052.25 6.55 20.73 16.72 3.11 6
52.19 23.00 8.81 12.73 3.32 3052.99 9.88 18.47 17.03 1.79 2052.72 9.66 18.40 16.94 1.80 6
137

138
APPENDIX 5: VIDAS MACRO AND USER COMMAND FUNCTIONS
1. VIDAS MACRO: PHENOCRYST ORIENTATIONS IN A MAGMA FLOW
alpharesetparclearallclearallovsetframe "F512"loadlut "grey"tvchan 2,2tvonrgbwtbalance 1tvinp 1tvchan 0,0delin 1,2,1O,5,_ONnormim 2,3,1dis2lev 3,4,64,191,_ON,_ON,1identframe 4,5,_ON,1,512,512,0,0,_ON,_OFF,_OFFrejectobj 5,2,0scrap 5,6,_OFF.0,40,_ON._ONidentify 6,7,_ON,_ONInitobj ANGLEDMAX, FSHAPE, AREAmeasobj 7,"objdb",_OFFoutlist "objdb",_OFFoutscat "objdb","ANGLEDMAX","objdb"."FSHAPE",_OFF,_OFF,_ON,_ON,4.00,492.10,1.0outhist "objdb","ANGLEDMAX" ,15,_OFF._OFF,0,_ON,_ON,11.05,174.60,8.00,"" ,"HISTOGRAM"
2. VIDAS USER COMMAND FUNCTIONS
ANGLEDMAX: angle between the positive x-axis and the DMAX orientation of the object, where DMAX is the
longest diameter of the object, obtained by selecting the largest of the Feret diameters measured in 32 different
directions (at an angular resolution of 5.70 ) . With this resolution, acicular grains have a DMAX that closely
approximates the long axis orientation parallel to the crystal faces.
FSHAPE: aspect ratio of the object, defined as DMIN/DMAX where DMIN is the shortest of the Feret diameters.
alpha: sets graphic displays to alphanumeric mode for faster operation
resetpar: erases all feature vectors defmed
c1earall: clears all present images
c1earallov: clears the overlay plane for the entire image memory .
setframe "F512": setting image size at 512 pixels
loadlut "grey": loads a look-up table from a sub-directory to define colours
tvchan 2,2: adjusts system to different input channels and input modes. Set to b/w (black & white) or RGB (red
green-blue).

139tvon: initialises television
rgbwtbalance: calculates mean grey value of the image
tvinp: digitizes a single tv cycle and stores the image data
tvcban 0,0: image converted to b/w\
delin: restores blurred object edges in an image
normim: increases the contrast of an image by scaling the grey levels linearly into the full dynamic range of the
image memory.
dis2lev: discriminates objects from the background by setting two thresholds
identframe: selects size of frame to be analysed and rejects any objects touching the outside boundaries of the
frame.
rejectobj: manual exclusion of unwanted objects
scrap: eliminates all objects smaller than a specified pixel area
identify: identifies all remaining objects by colour - any objects joined by at least one pixel will be identified as a
single object.
initobj: defines the parameters to be measured
measobj: measure defined parameters
outlist: records data
outscat: scattergram representation of data
outbist: histogram representation of data
DBCREATE: createsadatabase
DBOPEN: opens a created database
DBCLOSE: closes a created database
DBAPPEND: appends current data to the end of a currently open file

140APPENDIX 6: DIGITAL ANALYSIS DATA
1. SLIDE SK92-D4: ORIENTATION XY
count ANGLEDMAX AREA FSHAPE-----------------------~-----------------------------
1 69.44 704.00 0.3045202 172.87 1958.00 0.6619113 104.04 195.00 0.7706744 159.44 505.00 0.2755135 110 .56 209.00 0.3106826 131. 19 419.00 0.4431477 69.44 166.00 0.7549518 148.00 287.00 0.4005449 69.44 768.00 0.270328
10 97.12 913.00 0.42065411 97.12 253.00 0.54788812 53.13 400.00 0.37460813 116.56 152.00 0.48092914 97.12 177.00 0.71725815 63.43 226.00 0.37226316 57.99 319.00 0.67024517 75.96 196.00 0.70295518 75 .96 494.00 0.48722119 63.43 232.00 0.63511420 82.87 461. 00 0.34738621 97 .12 397 .00 0.37988522 90.00 4553.00 0.31062223 75.96 291. 00 0.60997724 63.43 190.00 0.51767525 57.99 109.00 0.50846226 116 .56 503.00 0.29806127 138.81 848.00 0.26763528 82.87 543.00 0.69688829 57.99 261. 00 0.72581930 104.04 103.00 0.51796531 57.99 298.00 0.56441432 57.99 652.00 0 .63588933 104.04 865.00 0.27676534 153.43 528.00 0.41871935 97.12 454.00 0.35474716 97.12 158.00 0.42059837 0.00 272.00 0.22587038 143 .13 495 .00 0.23598839 63.43 372.00 0.58758040 110.56 149.00 0 .35551241 53.13 643.00 0.26146942 122.01 365.00 0.31038543 75.96 1811. 00 0.21292644 104.04 1041. 00 0.39092145 110 .56 1250.00 0.78577846 82 .87 150.00 0.76148347 41.19 277.00 0.40693248 63.43 171. 00 0.51870249 104.04 392.00 0.35665050 14 .04 222.00 0 .33246751 135.00 182.00 0.30373552 110 .56 337.00 0.47458753 104.04 1393.00 0.36356654 97 .12 1001 .00 0.24562255 0.00 106.00 0.24000056 110.56 925.00 0.342090

Count ANGLEDMAX AREA FSHAPE------------------------------------------------------
57 53.13 223.00 0.33283958 75.96 239.00 0.51566059 82.87 647 .00 0.19615560 57.99 108.00 0 .56418461 82.87 561. 00 0.22284662 116.56 249.00 0.25468963 75.96 122.00 0.64888264 122.01 664.00 0.40895965 97.12 212.0 0 0.27108766 122.01 361. 00 0.24327567 104.04 545.00 0.25908068 104.04 144.00 0.52000069 69.44 582.00 0.28239070 45.00 528.00 0.12389471 20.56 652.00 0.34849572 69.44 241.00 0.47878973 45.00 190.00 0.30422074 159.44 103 .00 0 .20532575 82.87 1814.00 0.34140476 126.87 390.00 0.19856977 36.87 237.00 0.33301778 57.99 1135.00 0.42053679 63.43 805.00 0.47747280 26.57 592.00 0.14029981 122.01 332.00 0.25797182 69.44 325 .00 0.28013683 97.12 314.00 0.45017084 110.56 203.00 0.39557685 104.04 459.00 0.41906286 104.04 604.00 0.57090287 75.96 229.00 0.45031788 69.44 495.00 0.43124589 148.00 551 .00 0.76498390 126.87 585.00 0.56293891 48.81 1422.00 0.522762'12 41.19 651. 00 0.40276293 110 .56 316.00 0.26849694 82.87 174.00 0.38187195 97.12 225.00 0.44151596 75 .96 251. 00 0.36508697 104.04 223.00 0.46107898 97.12 504.00 0.23205899 104.04 485.00 0.289437
100 104.04 790 .00 0.491699101 75 .96 689.00 0.398678102 159.44 491. 00 0.293266103 104.04 250.00 0.518863104 97.12 570.00 0.317627105 97.12 706.00 0.350315106 82 .87 747.00 0.318588107 97 .12 233 .00 0 .289879108 110.56 220.00 0.438290109 75.96 542.00 0.615803110 69.44 1174.00 0.312154111 20.56 517.00 0.235247112 69.44 369.00 0.562309
141

142
Count ANGLEDMAX AREA FSHAPE-------------------------------------------------------
113 165.96 407.0 0 0 . 4 658 9 8114 97 .12 405.0 0 0.240315115 104.04 458.00 0.334274116 104 .04 921.00 0.554057117 143.13 788.00 0.501844118 90 . 0 0 2162.00 0.628423119 69.44 3339 .00 0.379631120 138.81 379.00 0.419673121 57 .99 808.00 0.504718122 75.96 112.00 0.647340123 26.57 2601. 00 0.484076124 138 .81 369.00 0.185045125 116.56 624.00 0.252669126 82 .87 436.00 0.274097127 104 .04 118.00 0.545070128 75.96 130.00 0.661242129 90. 00 2313.00 0.403844130 69 .44 501. 00 0.307042131 97.12 898.00 0.662480132 104.04 678.00 0.408438133 75.96 503.00 0.523965134 104.04 2806.00 0.543552135 104.04 892.00 0.532973136 104 .04 479.00 0.402505137 75.96 623.00 0.446980138 116.56 132.00 0 .538812139 110.56 422.00 0.432619140 110.56 586.00 0.521661141 97.12 407.00 0.265697142 122.01 183.00 0.447963143 110.56 164.00 0.485261144 110.56 406.00 0.207477145 20.56 831.00 0.296163146 159.44 289.00 0.210675147 97.12 406.00 0.284812"48 69.44 406.00 0.338569149 148.00 1193.00 0.273665150 82.87 1071.00 0.257057151 36.87 249 .00 0.38945615 2 1 43.13 728.00 0.502012153 63.43 2234.00 0.585242154 57.99 115.00 0.213807155 110.56 163.00 0.304445156 104.04 685.00 0.455113157 82.87 1531. 00 0.139628158 90.00 1008.00 0.382398159 97.12 189.00 0.361845160 63.43 1303.00 0.345070161 122.01 287.00 0. 476720162 82.87 141.00 0.407356163 69.44 271.00 0.653696164 116.56 1369.00 0.491921165 97 .12 1298.00 0.2172751 66 75 .96 265.00 0.734406167 32.01 297.00 0.201658168 0 .00 162.00 0.296296169 97.12 359.00 0.407295170 53.13 1604.00 0.393016171 82.87 487.00 0.172141172 82.87 1207.00 0.419840173 53.13 636.00 0.517129174 75.96 207.00 0.311412175 97.12 921. 00 0.138703

2. SLIDE SK92-Dl: ORIENTATION YZ
count ANGLEDMAX AREA FSHAPE------------------------------------------------------.
1 82.87 7541.00 0.1265022 75.96 260.00 0.1230913 75.96 426.00 0.3211784 110.56 379.00 0.7123285 82.87 472.00 0.5561436 104.04 225.00 0 .4325167 57.99 2920.00 0.5144148 82.87 310.00 0 .1970759 116.56 108.00 0.470968
10 75.96 766.00 0.34456011 104.04 327.00 0 .50523812 104.04 144.00 0.25362913 90.00 1035.00 0.39096814 14.04 320.00 0.64810015 104.04 678.00 0.42288216 82.87 789.00 0.32913117 82.87 789.00 0.32913118 126.87 200.00 0.23323919 138.81 137.00 0.36874820 97.12 369.00 0.47254921 90.00 547 .00 0.40791222 90 .00 218.00 0.14000023 75.96 590.00 0.36700424 172.87 184.00 0.38946425 104.04 1380.00 0.15307926 97.12 1668.00 0.17549927 110.56 1213 .00 0 .26913628 57.99 475.00 0.71288529 41.19 798.00 0.08808730 104.04 1124.00 0.22262531 82.87 1297.00 0.41251232 104.04 530.00 0 .22692733 69.44 591. 00 0.2037263 4 131.19 569 .00 0 .22774235 97.1.2 232.00 0 .13785736 122.01 267.00 0.82400437 116.56 21.47.00 0.31701638 7.12 197.00 0.39496739 148.00 410 .00 0 .43009540 104.04 293.00 0.28767141 69.44 131. 00 0.28835642 135.00 2005.00 0.21246843 32.01 142.00 0.28353044 122.01 143.00 0.36282045 165 .96 136.00 0.19429646 69.44 2167.00 0.09142847 75.96 140.00 0 .20450348 82.87 2127.00 0.11655149 110.56 370.00 0.25556750 104.04 839.00 0.14636251 20.56 1737.00 0.2603'2452 57.99 124.00 0.30876253 97.12 355.00 0 .30507654 90.00 1413.00 0.14035155 32.01 2192.00 0.48293756 75.96 661. 00 0 .423110
143

count ANGLEDMAX AREA FSHAPE------------------------------------------------------
57 126.87 1295.00 0.25240858 7 .12 374.00 0.37787859 69.44 376.00 0.16020060 90 .00 644.00 0.23231561 75 .96 2970.00 0.18395962 126.87 655.00 0.35912463 82.87 134.00 0.53410064 41.19 614.00 0.16337965 82.87 6133.00 0.23579766 82 .87 1011. 00 0.256049
, 67 82.87 5295.00 0 .72383768 36.87 103.00 0.40538469 32.01 315.00 0.30269 070 7 .12 6564.00 0.52165771 82.87 109.00 0.41847972 110.56 460.00 0.19368073 116.56 931.00 0.34730874 75.96 1926.00 0.14813175 57.99 229.00 0.53849976 57.99 585.00 0.20576877 82.87 2535.0 0 0.17325978 75.96 2615.00 0 .29869079 63.43 229.00 0.35552580 75.96 243.00 0 .21674181 110.56 505.00 0.25065782 32.01 630.00 0.51514083 104.04 499.00 0.66084584 104.04 1391. 00 0.38685485 116.56 5216.00 0.23551286 82.87 3372.00 0.11236587 97.12 1152.00 0.16590988 104.04 322.00 0.28175289 116.56 302 .00 0.42281990 14.04 4 74.00 0.52025991 75.96 300.00 0.38632292 82.87 5818.00 0.28110193 63.43 968.00 0.33114894 104.04 765.00 0.37611195 82.87 360.00 0.32930396 69.44 290.00 0.15801297 104.04 310 .00 0.42874698 75.96 178.00 0.18409199 75.96 298.00 0.355581
100 82.87 784 .00 0.156315101 90.00 5943 .00 0.280454102 75.96 910 .00 0 .332700103 69.44 7329.00 0.415829104 48.81 827.00 0.439840105 75.96 688 .00 0.178325106 69.44 265.00 0.321088107 104.04 7208.00 0 .370995108 82.87 727.00 0.829889109 82.87 495.00 0.537260110 90.00 6066 .00 0.322034111 82.87 3171.00 0.355221112 82.87 5088.00 0.231932
144

count ANGLEDMAX AREA FSHAPE._-----------------------------------------------------
113 131.19 160.00 0.550492114 110.56 562.00 0.503154115 104.04 5831.00 0.422555116 90.00 2533.00 0.156116117 131.19 512.00 0.282411118 75.96 2304.00 0.471986119 97.12 1207.00 0.269377120 104.04 477.00 0.292847121 90.00 672.00 0.258621122 104.04 1528.00 0.217956123 104.04 1097.00 0.264328124 97.12 204.00 0.478650125 90.00 667.00 0.417573126 110.56 1377.00 0.477482127 138.81 1486.00 0.211957128 82.87 797.00 0.275829129 97.12 611.00 0.119229130 75.96 245.00 0.663234131 104.04 3606.00 0.253971132 110.56 147.00 0.472052133 90.00 1546.00 0.642960134 97.12 411. 00 0.209595135 97.12 1509.00 0.213200136 131.19 472.00 0.120456137 75.96 577.00 0.180017138 75.96 3435.00 0.298640139 14.04 172.00 0.293799140 75.96 117.00 0.291375141 116.56 361.00 0.211618142 90.00 1229.00 0.197802143 97.12 1253.00 0.252498
145
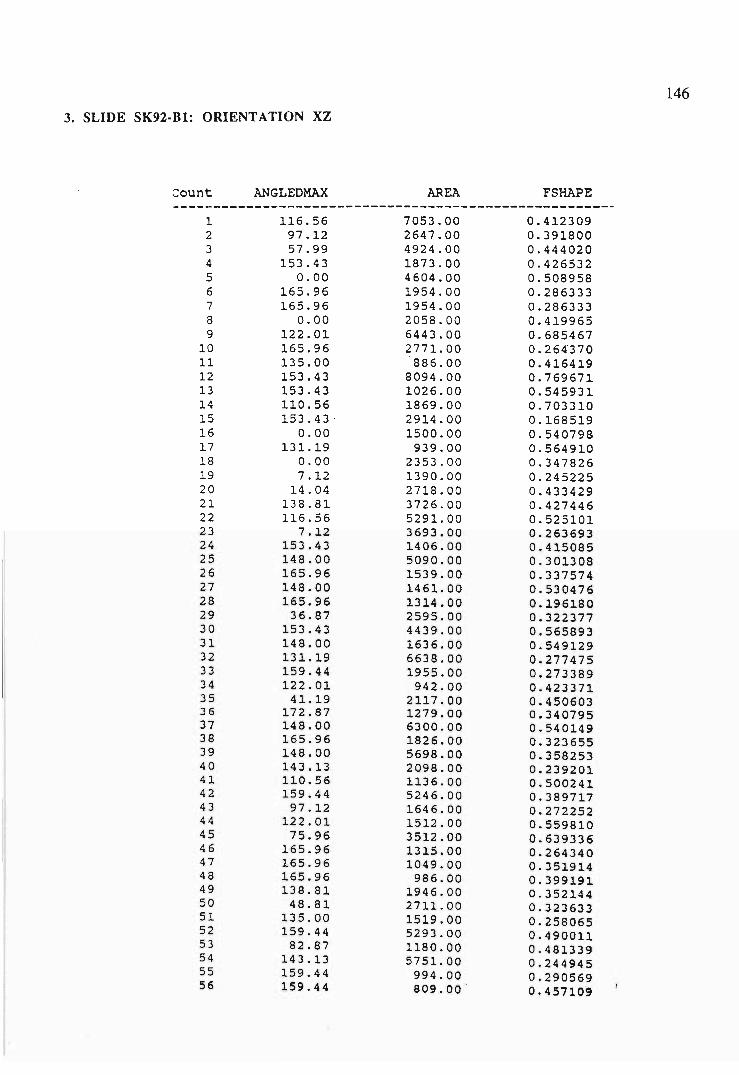
3. SLIDE SK92-Bl: ORIENTATION XZ
count ANGLEDMAX AREA FSHAPE------------------------------------------------------
1 116.56 7053.00 0.4123092 97.12 2647.00 0.3918003 57.99 4924.00 0.4440204 153.43 1873.00 0.4265325 0.00 4604.00 0.5089586 165.96 1954.00 0.2863337 165.96 1954.00 0.2863338 0.00 2058.00 0.4199659 122.01 6443.00 0.685467
10 165.96 2771.00 0.264'37011 135.00 886.00 0.41641912 153.43 8094.00 0.76967113 153.43 1026.00 0.54593114 110.56 1869.00 0.70331015 153.43 - 2914.00 0.16851916 0.00 1500.00 0.54079817 131.19 939.00 0.56491018 0.00 2353.00 0.34782619 7.12 1390.00 0.24522520 14.04 2718.00 0.43342921 138.81 3726.00 0.42744622 116.56 5291. 00 0.52510123 7.12 3693 .00 0 .26369324 153.43 1406.00 0.41508525 148.00 5090.00 0.30130826 165.96 1539.00 0.33757427 148.00 1461.00 0.53047628 165.96 1314.00 0.19618029 36.87 2595.00 0.32237730 153.43 4439.00 0.56589331 148.00 1636.00 0.54912932 131. 19 6638.00 0.27747533 159.44 1955.00 0.27338934 122.01 942.00 0.42337135 41.19 2117.00 0.45060336 172.87 1279.00 0.34079537 148.00 6300.00 0.54014938 165.96 1826.00 0.32365539 148.00 5698.00 0.35825340 143.13 2098.00 0.23920141 110.56 1136 .00 0 .50024142 159.44 5246.00 0.38971743 97.12 1646.00 0.27225244 122.01 1512.00 0.55981045 75.96 3512.00 0.63933646 165.96 1315.00 0.26434047 165.96 1049.00 0.35191448 165.96 986.00 0.39919149 138.81 1946.00 0.35214450 48.81 2711.00 0.32363351 135.00 1519.00 0.25806552 159.44 5293.00 0.49001153 82.87 1180.00 0.48133954 143.13 5751.00 0.24494555 159.44 994.00 0.29056956 159.44 809.00 0 .45710g
146

count ANGLEDMAX AREA FSHAPE-------------------------------------------------------
57 159.44 2203.00 0.40117558 165.96 1969.00 0.20502559 97.12 975.00 0.52136860 116.56 882.00 0.18832961 165.96 1908.00 0.28828462 126.87 5370.00 0.22055863 143.13 998.00 0.49069164 135.00 3991. 00 0.47985065 69.44 980.00 0.63983266 53.13 5248.00 0.24543467 69.44 1190.00 0.40294568 135.00 1563.00 0.32281069 131.19 1478.00 0.38291370 159.44 2379.00 0.20597671 14.04 911.00 0.49002672 48.81 1619.00 0.22604173 57.99 1371. 00 0.29838674 153.43 7338.00 0.36140575 110.56 824.00 0.27600176 172.87 1289.00 0.16439477 110.56 3265.00 0.2088867B 69.44 1294.00 0.44306279 165.96 3861. 00 0.61848580 165 .96 1782 .00 0.56037381 75.96 4058.00 0.47921682 104.04 2079.00 0.22593583 126.87 2275.00 0.18173984 165.96 3445.00 0.15345485 116.56 9857.00 0.28192686 110.56 2099.00 0.16811987 122.01 4039.00 0.64175488 110.56 1216.00 0.15264289 20.56 3044.00 0.21967390 159.44 5437.00 0.68798191 165.96 960.00 0.20521292 153.43 868.00 0.10865693 97.12 3747.00 0.54392094 116.56 1192.00 0.28876995 110.56 1665.00 0.37136296 90.00 1464 .00 0.17796697 36.87 3181.00 0.53545098 138.81 985.00 0.32020899 104.04 3801.00 0.384361
100 143.13 2781.00 0.234444101 110.56 4051. 00 0.142769102 110.56 2358.00 0.270843103 110.56 2064.00 0.200240104 75.96 1358.00 0.239198105 48.81 821 .00 0.550378106 122.01 3945.00 0.607245107 143.13 8120.00 0 .408964108 90.00 1178.00 0.282353109 36.87 1280.00 0.377200110 26.57 3041.00 0.357405111 97.12 2085.00 0.387486112 153.43 4771.00 0.260710
147

count ANGLEDMAX AREA FSHAPE------------------------------------------------------
113 165.96 1137.00 0.397230114 148.00 1339.00 0.219826115 148.00 1810.00 0.376345116 0.00 1451. 00 0.519068117 0.00 5188.00 0.577651118 122.01 5521. 00 0.598447119 122.01 8068.00 0.240870120 75.96 1490.00 0.567355121 75.96 1296.00 0.421875122 138.81 1978.00 0.503810123 159.44 6528.00 0.296715124 143.13 1549.00 0.305116125 143.13 3064.00 0.267368126 110.56 1193.00 0.421115127 32.01 1368.00 0.257732128 97.12 1579.00 0.372361129 131.19 10965.00 0.512589130 97.12 3320 .00 0.236511131 153.43 3656.00 0.293035132 138.81 1947.00 0.302830133 7.12 11410.00 0.281906134 148.00 2567.00 0.205612135 122.01 5410.00 0.167214136 45.00 1348.00 0.442308137 116.56 4987.00 0.159961138 131. 19 899.00 0.408245
148

149
REFERENCES
Absolom, S.S. (1970). Contaminated dolerites of Natal and Zululand. Petros, 2,10-15.Allard, B. and Benn, K. (1989). Shape preferred-orientation analysis using digitized images on a microcomputer.
Computers Geosci., 15, 441-448.Anderson, E.M. (1938). The dynamics of sheet intrusion. Proc. R. Soc. Edinb ., 58, 242.Anderson, E.M. (1951). The Dynamics of Faulting and Dyke Formation with Application to Britain. Oliver and
Boyd Ltd, Edinburgh, Scotland, 206pp.. Arm strong , RA. (1978). A Geological and Geochemical Appraisal of the Rooi Rand. MSc Thesis (unpubl.),
University of Natal (Durban), 135pp.Armstrong, RA., Bristow, J.W. and Cox, KG. (1984). The Rooi Rand Dyke Swarm, Southern Lebombo. Spec.
Publ. geol. Soc. S. Afr., 13, 77-86.Barriere, M. (1976). Flowage differentiation: limitation of the "Bagnold Effect" to the narrow intrusions. Contrib.
Mineral. Petrol., 55, 139-145.Beach, A (1975). The geometry of en-echelon vein arrays. Tectonophysics, 28, 245-263.Benn, K. and Allard, B. (1989). Preferred mineral orientations related to magmatic flow in ophiolite layered gabbros.
J. Petrol., 30, 925-946.Bhattaeharji, S. (1967). Mechanics of flow differentiation in ultramafic and mafic sills. J. Geology, 75, 101-112.Bird, RB., Stewart, W.E. and Lightfoot, E.N. (1960). Transport Phenomena. Wiley, New York. .
_~ Bottinga, Y.A and Weill, D.F. (1972). The viscosity of magmatic silicate liquids: a model for calculation. Am. J.Sci., 272, 438-475.
Brace, W.F. and Bombolakis, E.G. (1963). A note on brittle crack growth in compression. J. Geophys. Res., 68,3709-3713.
Bradley, J. (1965). Intrusion of major dolerite sills. Trans. Royal Soc. New Zealand Geol., 3, 27-55.Brink, AB.A. (1983). Engineering Geology ofSouthern Africa. Volume 3: The Karoo Sequence. Chapter 7: Karoo
Dolerite, 177-209.Bristow, J.W. (1976). The Geology and Geochemistry of the Southern Lebombo. MSc thesis (unpubl.), University
of Natal (Durban), 331pp.Bussell, M.A. (1989). A simple method for the determination of the dilation direction of intrusive sheets. J. Struct.
Geol., 11, 679-687.Carmichael, I.S.E., Turner, Fl. and Verhoogen, J. (1974). Igneous Petrology. McGraw-Hill, New York, 739p.Carmichael, RS. (1989). Practical handbook ofphysical properties of rocks and minerals. CRC Press, Inc., Boca
Raton, Florida; 741pp.Cleverley, RW. (1977).. The Structural and Magmatic Evolution of the Lebombo Monocline, Southern Africa.
with Particular Reference to Swaziland. PhD Thesis (unpubl.), Oxford University, p. 104.Clifton, RJ., Simonson, E.R, Jones, A.H. and Green, SJ. (1976). Determination of the critical-stress-intensity
factor Klc from internally pressurized thick-walled vessels. Exp. Mech., 16, 233-238.Cox, K.G., Bell, J.D. and Pankhurst, RJ. (1979). The Interpretation of Igneous Rocks. George Alien & Unwin,
London, 45Opp.Cox, KG. and Bristow, J.W. (1984). The Sabie River Basalt Formation of the Lebombo monocline and southeast
Zimbabwe. Geol. Soc. S. Afr. Spec. Publ., 13, 125-148.Cox, KG., MacDonald, Rand Horung, G. (1967). Geochemical and petrogenic provinces in the Karroo basalts of
southern Africa. Amer. Mineral., 52, 1451-1474.Currie, KL. and Ferguson, J. (1970). The mechanism of intrusion of lamprophyre dikes indicated by "offsetting" of .
dikes. Tectonophysics, 9, 525-535.Darracot, B. and Kleywegt, R (1974). The structure of the southern portion of the Lebombo volcanic belt deduced
from gravity data. Trans. geol. Soc. S. Afr., 77,301-308.Deer, W.A, Howie, RA and Zussman, J. (1966). An introduction to the rock forming minerals. Longman, New
York, 528pp.Delaney, P.T. (1982). Rapid intrusion of magma into wet rock: groundwater flow due to pore-pressure increases. J.
Geophys. Res ., 87, 7739-7756.Delaney, P.T. and Pollard, D.D. (1981). Deformation of host rocks and flow of magma during growth of minette
dykes and breccia-bearing intrusions near Ship Rock, New Mexico. U.S. Geol. Survey Professional Paper,1202, 61pp.
-'- -Delaney, P.T., Pollard: 0.0., Ziony, J.I. and McKee, E.H. (1986). Field relations between dikes and joints:emplacement processes and paleostress analysis. J. Geophys. Res., 91 (B5), 4920-4938.
Duncan, A.R (1987). The Karoo Igneous Province - a problem area for inferring tectonic setting from basaltgeochemistry. 1. Volcano Geotherm. Res. , 32, 13-34.
Duncan, A.R., Erlank, Al. and Betton, P.I. (1984). Appendix I: Analytical techniques and database descripJ~nq .Spec. Publ. geol . Soc. S. Afr., 13, 389-395.
Eales, H.V., Marsh, I.S. and Cox, KG. (1984). The Karoo Igneous Province: an Introduction. Spec. Publ . geol .Soc. S. Afr., 13, 1-26. . .. . . .
Frankel, U. (1969). The distribution and origin of the Effingham rock type, a dolente derivative of mtennediatecomposition, in Natal and Zululand, South Africa. Geol. Soc. Am. Memoir, 115, 149-173.
Fitch, FJ. and Miller, J.A. (1984). Dating Karoo igneous rocks by the conventional K-Ar and 40Ar/39 Ar agespectrum methods. Geol . Soc. S. Afr. Spec . Publ., 13, 247-266.
Gretener, P.E. (1969). On the mechanics of the intrusion of sills. Can. J. Earth Sci. , 6, 1415-1419.Griffith, AA. (1924). The theory of rupture. In: Biezeno, C.B. and Burgers, I.M. (Eds.), Proceedings of the fi rst
international congress on applied mechanics , J. Waltman, Delft, 55-63.Gudmundsson, A. (1983). Stress estimates from the length/width ratios of fractures. J. Struct . Geol., 5, 623-626.Gudmundsson, A. (1984). A study of dykes, ftssures and faults in selected areas of Iceland. Ph.D Thesis (unpubl.),
Univ. of London.Gudmundsson, A (1990). Emplacement of dykes, sills and crustal magma chambers at divergent plate boundaries.
Tectonophysics , 176, 257-275.Halls, H.C. (1988). Precambrian dyke swarms. IGCP 257 Progress Report.Hancock, P.L. (1972). The analysis of en-echelon veins. Geol. Mag ., 109, 269-276.Barley, M. and Charlesworth, E.G. (1991). Compressive deformation of a pre-Bushveld diabasic sill , Sudwala,
eastern Transvaal. S. Afr. J. Geol., 94, 348-354.Hatch, F.H., Wells, AK and Wells, M.K (1972). Textbook of Petrology Volume One: Petrology of the igneous
rocks. 13th 00. George Allen and Unwin, London, 551pp.Hodgson, RA. (1961). Classiftcation of structures on joint surfaces. Am. J . Sci., 259, 493-502.Hubbert, M.K. and Willis, D.G. (1957). Mechanics of hydraulic fracturing. Pet. Trans., Am. Inst. M echo Eng .,
210 , 153-166.Hunter, D.R. and Reid, D.L. (1987). Mafic dyke swarms in Southern Africa. In: Halls, H.C. and Fahrig, W.F.
(Eds.), Geol. Assoc. Can. Spec . Paper, 34, 445-456.Ildefonse, B., Launeau, P., Bouchez, l.-.L. and Fernandez, A (1992). Effect of mechanical interactions on the
development of shape preferred orientations: a two-dimensional experimental approach. J . Struct. Geol.,14, 73-83. .
Inglis, C.E. (1913). Stresses in a plate due to the presence of cracks and sharp corners. Royal Institute of NavalArchitects Transactions, 55, 219-230.
Ingraffea, AR and Ko, H.-.Y. (1981). Determination of fracture parameters for rock. In: Sih, G.C. and Theocaris,P.S. (Eds.), Mixed mode crack propagation. Sijthoff and Noordhoff, Alphen aan den Rijn, 41Opp.
Irwin, G.R (1958). Fracture. In: Flugge, S. (Ed.), Encyclopedia ofPhysics, Springer-Verlag, Berlin, 551-590.Jaeger, I.C. (1962). Elasticity.fracture and flow. 2nd 00. Methuen, London.Jaeger, J.C. (1967). Brittle fracture of rocks. In: Fairhurst, C. (Ed.), Failure and breakage of rocks, Proc . Sympos.
Rock Mech., 8, p. 3.Jaeger, I.C. and Cook, N.G.W. (1969). Fundamentals ofRock Mechanics. Methuen and Co. Ltd, London, 513pp.Johnson, A.M. (1970). Physical processes in geology. Freeman Cooper & Co., San Francisco.Kanninen, M.F. and Popelar, C.H. (1985). Advanced Fracture Mechanics. Oxford University Press, New York,
563pp.- ---.:.. Komar, P.D. (1976). Phenocryst interactions and the velocity proftle of magma flowing through dykes or sills.
Geol. Soc. Am. Bull ., 87, 1336-1342.Krynauw, I.R, Hunter, D.R and Wilson, A.H. (1988). Emplacement of sills into wet sediments at Grunehogna,
western Dronning Maud Land, Antarctica. J . Geol. Soc. London, 145, 1019-1032.Lajtai, E.Z. (1969). Mechanics of second order faults and tension gashes. Geol. Soc. Am. Bull., 80,2253-2272.Lawn, B.R and Wilshaw, T.R. (1975) . Fracture of brittle solids. Cambridge University Press, Cambridge,
England, 204pp.Le Roex, A.P. and Reid, D.L. (1978). Geochemistry of Karroo dolerite sills in the Calvinia district, western Cape
Province, South Africa Contrib . Mineral. Petrol., 66,351-360.Lindsley, D.H. and Anderson, D.I. (1982). A two-pyroxene thermometer, Proc. 13th Lunar Planet. Sci. Con!Linstrom, W. (1987). The geology of the Dundee area S. Afr. Geol . Survey Explanation: Sheet 2830 (1:250 000)
Dundee, 52pp.Marsh, I.S. and Eales,. H.V. (1984). The chemistry and petrogenesis of igneous rocks of the Karoo Central Area,
Southern Africa. Spec. Publ. geol. Soc. S. Afr. , 13, 27-67.McCarthy, M.I. (1960). The Geology of the Empangeni Fault Area MSc thesis (unpubl.), University of Natal
(Durban), 94pp.McCarthy, MJ. (1979). A perspective view of Karoo dolerites and normal faulting in coastal Natal. Petros,9,
44-52.Meschede, M. (1986). A method of discriminating between different types of mid-ocean ridge basalts and continental
tholeiites with the Nb-Zr-Y diagram. Chem. Geol., 56,207-218.

Meth, D. (1991). The Rooi Rand Dyke Swarm: classification and intra/inter-dyke geochemical relationships . l~S-cHons. Thesis (unpubl.), University of Natal (Durban), Mp.
Mohr , P. (1971). Ethiopian Tertiary dyke swarms. Smithsonian Astrophys. Observ . Spec . Rep. , 339.Murrell, S.A.F. (1963). A criterion for brittle fracture of rocks and concrete under triaxial stress and the effect of
pore pressure on the criterion. In: Fairhurst, C. (Ed.), Proc. Symp. Rock Mech., 5, Pergamon, Oxford, p.563.
Murrell, S.A.F. (1964). The theory of propagation of elliptical Griffiths cracks under various conditions of planestrain or plane stress . Pt I-Ill. Proc. Phys. Soc., 15, 1195-1211.
Nicholson, R. and Pollard, D.D. (1985). Dilation and linkage of echelon cracks. J. Struct . Geol., 7,583-590.Norman,N.G. (1969). The Mount Currie dolerite sheet MSc Thesis (unpubl.) , Univ. of Natal (Durban), 161pp.Ode, H. (1960). Faulting as a velocity discontinuity in plastic deformation, In: Griggs, D. and Handin, J. (Eds.),
Rock Deformation (A Symposium), J. Geol. Soc. Am. Mem., 79, 293-321.Olson, J. and Pollard, D.D. (1989). Inferring paleostresses from natural fracture patterns: A new method. Geology,
17, 345-348.Olson, J.E. and Pollard, D.D. (1991). The initiation and growth of en echelon veins. J. Struct. Geol ., 13,
595-608.Park , RG. (1989). Foundations ofStructural Geology. Blackie, Glasgow, 135pp.Pearce, J.A. and Cann, J.R (1973). Tectonic setting of basic volcanic rocks determined using trace element
analyses. Earth Planet. Sci. u«, 19, 290-300.Peck, L., Barton, C.C. and Gordon, R.B. (1985b). Microstructure and the resistance of rock to tensile fracture. J .
Geophys. Res., 90.- Platten, LM. and Watterson, J. (1987). Magma flow and crystallization in dyke fissures . In: Halls, RC. and
Fahrig, W.F. (Eds.), Mafic dyke swarms, Geol. Assoc. Can. Spec. Paper, 34,65-73.Pollard, D.D. (1969). Aspects of the mechanics ofsheet intrusions. MSc dissertation (unpubl.), Univ. of London.Pollard, D.D. (1973). Derivation and evaluation of a mechanical model for sheet intrusions. Tectonophysics , 19,
233-269.Pollard, D.D. (1976). On the form and stability of open hydraulic fractures in the Earth's crust. Geophys. Res.
Lett .,3 (9), 513-516.Pollard, D.D. (1978). Forms of hydraulic fractures as deduced from field studies of sheet intrusions. In: Kim, Y.S.
(Ed.), U.S. Symposium on Rock Mechanics, 19th, Volume I: Reno, Nevada. University of Nevada-Reno,1-9.
Pollard, D.D. (1987). Elementary fracture mechanics applied to the structural interpretation of dykes. In: Halls ,H.C. and Fahrig, W.F. (Eds.), Mafic dyke swarms, Geol. Assoc . Can. Spec. Paper, 34, 5-24.
Pollard, D.D. and Muller, O.H. (1976). The effect of gradients in regional stress and magma pressure on the form ofsheet intrusions in cross section. J. Geophys. Res., 81 (5), 975-984.
Pollard, D.D., Muller, O.H. and Dockstader, D.R. (1975). The form and growth of fingered sheet intrusions. Geol.Soc . Am. Bull ., 86, 351-363.
Pollard, D.D. , Segall, P. and Delaney, P.T. (1982). Formation and interpretation of dilatant echelon cracks. Geol.Soc. Am. Bull., 93 , 1291-1303.
'-- Price, NJ. (1975). Fault and joint development in brittle and semi-brittle rock. Pergamon, Oxford.Price, N.J. and Cosgrove, I.W. (1990). Analysis of geological structures. Cambridge University Press , Cambridge.Ramsay, J.G. (1967). Folding and fracturing ofrocks. McGraw-Hill, New York, 568pp.
- --Ramsay, J.G. (1980). Shear zone geometry: a review. 1. Struct. Geol., 2,83-99.Ransome, LG.D. (1991). The geochemistry , kinematics and geodynamics of the Gannakouriep Dyke Swarm. MSc
Thesis (unpubl.), Department of Geochemistry, University of Cape Town.Richardson, S.H. (1984). Sr, Nd and 0 isotope variation in an extensive Karoo dolerite sheet, southern Namibia.
Spec. Publ . geol. Soc. S. AIr., 13, 289-293.Rickard, MJ. and Rixon, L.K. (1983). Stress configurations in conjugate quartz-vein arrays. J. Struct. Geol., 5,
573-578.Riedel, W. (1929). Zur mechanik geologischer Brucherscheinungen (Ein Beitrag zum Problem der Fiederspatten).
Zentbl. Miner. Geol. Pal(a)eont. Abh. B, 354-368.Roberts, J.L. (1970). The intrusion of magma into brittle rocks. In: Newall, G. and Rast, N. (Eds.), Mechanisms
of igneous intrusion. Gallery Press, Liverpool, 38Opp.Roberts, J.L. and Sanderson, DJ. (1971). The intrusive form of some basalt dykes showing flow lineation. Geol.
Mag., 108 (6), 489-499.Robson, G.R and Barr, K.G. (1964). The effect of stress on faulting and minor intrusions in the vicinity of a
magma body. Bull . volcan., 27,315.Roering, C. (1968). The geometrical significance of natural en-echelon crack-arrays. Tectonophysics, 5, 107-123.Rogers, RD. and Bird, D.K. (1987). Fracture propagation associated with dyke emplacement at the Skaergaard
intrusion, East Greenland. J. Struct. Geol., 9, 71-86.. Ross , M.E. (1986). Flow differentiation, phenocryst alignment, and compositional trends within a dolerite dyke at
Rockport, Massachusetts. Bull. Geol. Soc. Am., 97,232-240. .

Sabine, P.A. (1989). Setting standards in petrology: The commission on systematics in petrology. Episodes~~i84-86.
Saggerson, E.P., Bristow, J.W. and Armstrong, RA. (1983). The Rooi Rand Dyke Swarm. S. Afr. J. Sci., 79,365-369.
Saggerson, E.P. and Logan, C.T. (1988). Deformation and chemistry of calcic pyroxenes in granophyric gabbro. S.Afr. J. Geol., 91, 439-449.
Schmidt, RA. and Huddle, C.W. (1977). Effect of confining pressure on fracture toughness of Indiana Limestone.Int. J. Rock Mech. Min. Sci. Geomech. Abstr., 14, 289-293.
Shaw, H.R (1972). Viscosities of magmatic silicate liquids: an empirical method of prediction. Am. J. Sci., 272,870-893.
Sigurdsson, H. (1987). Dyke injection in Iceland: a review. In: Halls, H.C. and Fahrig, W.F. (Eds.), Mafic dykeswarms. Spec. Pap. geol. Assoc. Can., 34, 55-64.
Sih, G.C. (1981). Prediction of crack growth under mixed mode conditions. In: Sih, G.C. and Theocaris, P.S.(Eds.), Mixed mode crack propagation. Sijthoff and Noordhoff, Alphen aan den Rijn, 41Opp.
Smith, RP. (1987). Dyke emplacement at Spanish Peaks, Colorado. In: Halls, H.C . and Fahrig, W.F. (Eds.),I Mafic dyke swarms. Spec. Pap. geol. Assoc. Can., 34, 47-54.
South African Committee for Stratigraphy (SACS) (1980). Stratigraphy of South Africa, Part 1. (Comp. L.E.I Kent): Lithostratigraphy of the Republic of South Africa, South West Africa/Namibia and the republics of
Bophuthatswana, Transkei and Venda. Handbk. geol. Surv. S. Afr., 8, 69Opp.Spence, D.A. and Turcotte, D.L. (1985). Magma-driven propagation of cracks. J. Geophys. Res., 90 (Bl),
575-580.Stevens, B. (1911). The laws of intrusion. Bulletin of the American Institute of Mining Engineers, 1-23.Sweeney, RJ. (1988). Geochemistry of the Sabie River Basalt Formation in the Central Lebombo, Karoo Igneous
Province. PhD Thesis (unpubl.), Department of Geochemistry, University of Cape Town.Sweeney, R.J. and Watkeys, M.K. (1990). A possible link between Mesozoic lithospheric architecture and
Gondwana flood basalts. J. Afric. Earth Sciences, 10(4) , 707-716.Tavener-Smith, R, Cooper, J.A.G. and Rayner, RJ. (1988). Depositional environments in the Volksrust
Formation (Permian) in the Mhlatuze River, Zululand. S. Afr. J. Geol., 91, 198-206.Tullis, J. (1975). Deformation of feldspars. In: Ribbe, P.H. (ed). Reviews in Mineralogy, Volume 2: Feldspar
Mineralogy. Mineralogical Society of America, Chelsea, 362pp.Turcotte, D.L. and Schubert, G. (1982). Geodynamics: Applications of continuum physics to geological problems.
John Wiley & Sons, Inc., New York, 45Opp.Tweto, O. (1951) . Form and structure of sills near Pando, Colorado. Bull. Geol. Soc. Am., 62, 507-532.W~ger, L.R and Deer, V.A. (1938). A dyke swarm and crustal flexure in East Greenland. Geol. Mag., 75, 39-46.Walker, F. and Poldervaart, A. (1949). Karroo dolerites of the Union of South Africa. Geol. Soc. Am. Bull., 60,
591-706.Watson, E.B. (1982). Basalt contamination by continental crust: some experiments and models. Contrib. Mineral.
Petrol., 80, 73-87.Wheelock, G. (1978). A study of amygdales from basalts of the Mfolozi River Formation, Lebombo. BSc Hons
Thesis (unpubl.), Department of Geology and Applied Geology, University of Natal (Durban).Wilson, J.F., Jones, D.L., and Kramers, J.D. (1987). Mafic dyke swarms in Zimbabwe. In: Halls, H.C. and
I Fahrig, W.F. (Eds.), Geol. Assoc. Can. Spec. Paper, 34, 433-444.W?lmarans, L.G. and Du Preez, J.W. (1986). The geology of the St Lucia area. S. Afr. Geol. Survey Explanation:
: Sheet 271/232 (1:250000) St Lucia, 42pp.I