Embed Size (px)
Citation preview
arX
iv:q
-bio
/061
1058
v1 [
q-bi
o.T
O]
17
Nov
200
6
Mechanisms of organogenesis of primary lymphoid
follicles
Tilo Beyer and Michael Meyer-Hermann
Frankfurt Institute for Advanced Studies, Johann Wolfgang Goethe-University,
Max-von-Laue-Str. 1, 60438 Frankfurt Main, Germany
Corresponding author: Tilo Beyer, E-mail: [email protected]
September 17, 2018
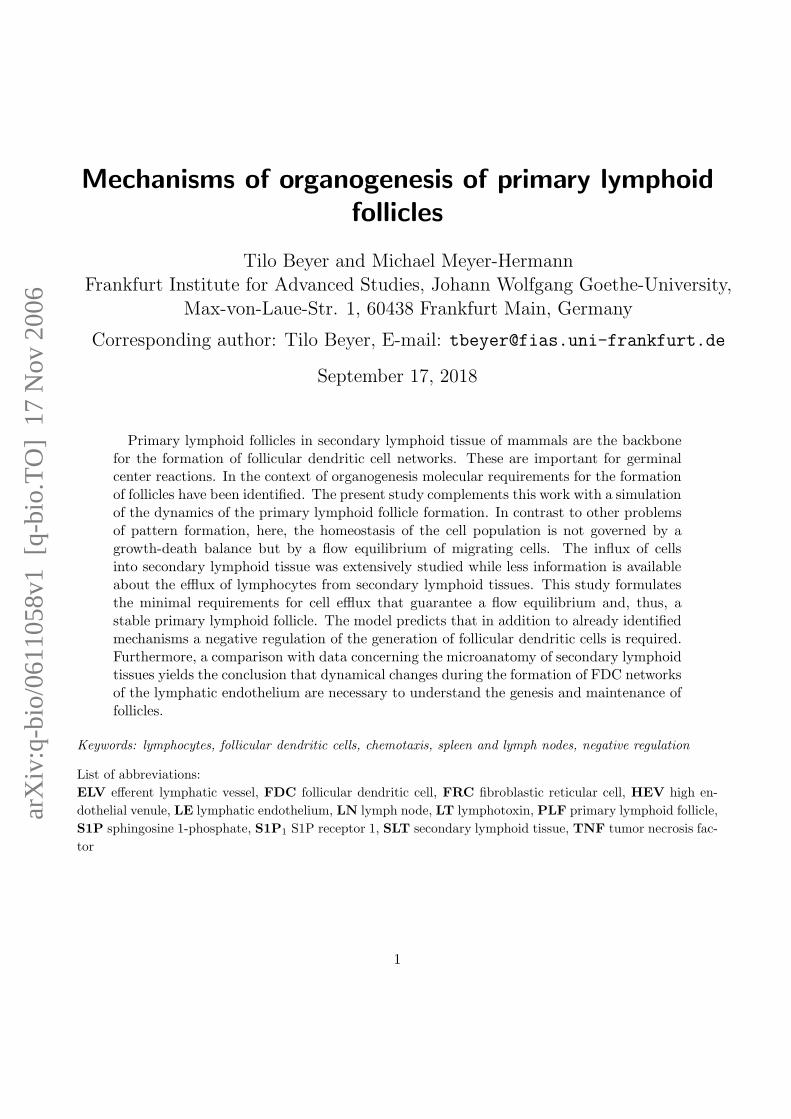
Primary lymphoid follicles in secondary lymphoid tissue of mammals are the backbonefor the formation of follicular dendritic cell networks. These are important for germinalcenter reactions. In the context of organogenesis molecular requirements for the formationof follicles have been identified. The present study complements this work with a simulationof the dynamics of the primary lymphoid follicle formation. In contrast to other problemsof pattern formation, here, the homeostasis of the cell population is not governed by agrowth-death balance but by a flow equilibrium of migrating cells. The influx of cellsinto secondary lymphoid tissue was extensively studied while less information is availableabout the efflux of lymphocytes from secondary lymphoid tissues. This study formulatesthe minimal requirements for cell efflux that guarantee a flow equilibrium and, thus, astable primary lymphoid follicle. The model predicts that in addition to already identifiedmechanisms a negative regulation of the generation of follicular dendritic cells is required.Furthermore, a comparison with data concerning the microanatomy of secondary lymphoidtissues yields the conclusion that dynamical changes during the formation of FDC networksof the lymphatic endothelium are necessary to understand the genesis and maintenance offollicles.
Keywords: lymphocytes, follicular dendritic cells, chemotaxis, spleen and lymph nodes, negative regulation
List of abbreviations:
ELV efferent lymphatic vessel, FDC follicular dendritic cell, FRC fibroblastic reticular cell, HEV high en-
dothelial venule, LE lymphatic endothelium, LN lymph node, LT lymphotoxin, PLF primary lymphoid follicle,
S1P sphingosine 1-phosphate, S1P1 S1P receptor 1, SLT secondary lymphoid tissue, TNF tumor necrosis fac-
tor
1
1 Introduction
The primary lymphoid follicle (PLF) is the precursor state of germinal centers in secondary lymphoidtissue (SLT) [1]. The most important constituents are naive B cells and follicular dendritic cells(FDC). PLF serve as a filter for antigen and bring B cells into contact with antigen presented by FDCin order to start a germinal center reaction [2].
In mammals PLF first develop around birth [3–8]. During the past decade many molecules relevantto the formation of PLF could be isolated. With an extensive number of knockout and antibody-blocking experiments the contributions of TNF-α, LTα1β2, LTα3, LIGHT, and TRANCE secondarylymphoid organ structure and in the formation of PLF have been identified (reviewed in [9–11]).
The homeostatic chemokines CCL19, CCL21 and CXCL13 are involved in guiding the lymphocytesto their compartment (reviewed in [12]). CXCL13 is secreted by FDC and acts as chemoattractantfor B cells via the CXCR5 chemokine receptor. CCL19 and CCL21 are produced by different cellpopulations in the T zone of SLT. The common receptor CCR7 is expressed by T cells. The expressionof these chemokines and the presence of FDC depend on LTα1β2, TNF-α and related molecules.The precise molecular interactions and chemokine expression profiles slightly vary for different SLT[9–11], however, in most SLT a persistent LTα1β2-stimulus is needed for both the induction andthe maintenance of FDC networks [13]. Further studies suggested that the maintenance of the PLFstructure is mediated by a positive feedback loop [14]: B cells are stimulated by CXCL13 to expresshigh levels of LTα1β2. This in turn stimulates FDC to produce CXCL13.
An interesting property of PLF is their equal size of several hundred µm in all mammals rangingfrom mice to horses [15–22]. Thus, the follicle size does not scale with the size of the animals or ofthe organs under consideration, which is considered to be a strong boundary condition for simulationsof PLF formation and maintenance. The formation of PLF is studied with a simulation based ona previously introduced agent-based model [23] on top of a regular triangulation [24–26]. A clearseparation of B and T cells is achieved using chemoattraction to an exit spot for the lymphocytesoverlaying the different chemokine responses of B and T cells to their homing chemokines CXCL13,CCL21, and CCL19. Formation of a PLF and an adjacent T zone is found when assuming thegeneration of FDC from T zone stromal cells by sufficiently large B cell aggregates. However, then,the location of the PLF relative to lymphatic vessels is not in agreement with experiment. The presentstudy concentrates on the correct formation of the lymphatic vessels and the PLF without consideringthe dynamics of the T zone of T cells. The model includes lymphangiogenesis, which dramaticallychanges the dynamics of the PLF formation, its geometry and also the regulation mechanisms involvedin PLF maintenance and size regulation. It is found that a negative regulation of the FDC generatingprocess is required. Furthermore it is demonstrated that a chemotactic activity of B cells for S1P is incontradiction to PLF morphology, suggesting that S1P chemotaxis is not active during PLF formationand maintenance in vivo, which was also found in experiment [27].
2 Model of primary lymphoid follicle formation
This section describes the properties of a minimal model for PLF formation. In addition the modelof lymphangiogenesis is discussed. The mathematical framework is briefly summarized in the methodsection (Sec. 5) and is presented in more detail in [23].
2
2.1 Flux of naive B cells
Essential ingredients to study the formation of the PLF are the B cell flux, the FDC and the FDCprecursor cells. The B cells are constantly entering SLT via high endothelial venules (HEV) in the casesof mucosa-associated lymphoid tissue (MALT) and lymph nodes (LN) or along the central arteriolesthrough the peri-arteriolar sheath of the spleen (reviewed in [12]). The exit route of lymphocytesthrough lymphatic endothelium (LE) is less clearly identified. Recent experimental data (see [12])suggest that B cells leave MALT via efferent lymphatic vessels (ELV). In LN and spleen the lymphaticsinuses guide lymphocytes to draining ELV. As the sinuses merge with the ELV they are consideredto belong to the efferent lymphatic system in the simulation.
The morphology of the LE is very similar across the different SLT and species. Studies usingcorrosion casts revealed that the LE is formed around the follicles. The precise shape ranges fromhalf-open baskets around the follicle base to almost closed shells enclosing the whole follicle. The LEforms a dense network in the non-follicular area [21,28–37].
The role of LE in lymphocyte emigration is supported by a study of the corresponding structurein the Bursa of chicken [38] and the identification of openings in the LE nearby follicles [28,31]. Theexit of lymphocytes via LE is further supported by a newly identified mannose receptor on LE. Thisreceptor may guide the specific exit route of lymphocytes via the lymphatic sinuses [39]. It is almostexclusively found on the lymphatic vessels in the LN and binds CD62L, thus, guiding lymphocytes tothe ELV and allowing their exit from LN.
S1P might be involved in the regulation of lymphocyte egress from SLT [12, 40–42]. S1P acts asa chemoattractant for lymphocytes in vitro [40]. Thus, the dynamics of the S1P receptor S1P1 isconsidered in the simulation: The LE is widely engulfing follicles such that lymphocytes have tomigrate around or across these structures in order to reach the follicles. Therefore a minimal transittime through SLT should be governed by some mechanism that prevents the lymphocytes from enteringand transmigrating across the LE. In the simulation it is assumed that S1P1 is downregulated whenB cell enter SLT and required for lymphocyte emigration. This is supported by studies using theS1P1 agonist FTY720 [12, 40–42]. There is good agreement between the minimal transit time oflymphocytes [33, 43–45] and the time required to fully upregulate S1P1 on lymphocytes [42] both ofwhich are in the order of 3 hours.
2.2 Origin of FDC
One fundamental question in the PLF formation is: Where do the FDC come from? The mostcommonly accepted view is that FDC are derived from stromal cells which might be related to thestromal cells observed in the T zone. These stromal cells are fibroblastic reticular cells (FRC) [46–49].Comparative reviews supporting the mesenchymal origin of FDC can be found in [50]. The evidencefor the relation of FDC to FRC is given by shared markers [51]. There exists a gradual decreaseof the fibroblast marker ASO-2 from the T zone to the heart of a germinal center. This decrease isaccompanied by a gradual morphological change from the ’classical fibroblastic’ to the typical FDCmorphology [52]. A similar change of marker expression has been observed in the PLF although a fewintermediate steps are missing. Indirect evidence for the reverse transition from FDC to stromal cellsis provided by culture experiments in which purified FDC gradually loose characteristic FDC markerone by one, finally turning stromal cell-like again [53–55]. This suggests that persistent stimuli are
3
required to maintain the FDC phenotype. Thus, the study of typical FDC marker expression indicatesa smooth transition from stromal cell precursors to FDC by subsequent accumulation of ’FDC-ness’of the stromal cells. A recent study of FDC development in human LN supports the idea of local FDCdifferentiation: FDC seem to acquire more and more markers like those found in culture experimentsextending the ’FDC-ness’ picture to several other markers [20]).
Observations of slow replacement of FDC by migratory precursors and of inefficient seeding by bonemarrow-derived cells argue against a hematopoietic origin of FDC [56]. However, a clear relationshipbetween FRC and FDC could not be identified in a study based on newly developed markers [49].Bone marrow transfer into severe combined immunodeficiency (SCID) mice revealed donor-derivedFDC suggesting that the stromal cells may originate from the bone marrow [57]. TNFR-I knockoutsand mice given injections of a blocking TNFR-I-Ig exhibit immature FDC or FDC precursors aroundsplenic follicle suggesting migrative FDC progenitors [58]. Similar conclusions have been drawn fromTNF-α−/− and TNFR-I−/− [59]. More support for the immigration of FDC precursor instead of localdifferentiation comes from the expression pattern of TuJ1, a microtubule-protein [60]. The broaddistribution with single positive cells scattered around lymphoid follicles suggests migratory activityof FDC. Reconciling both theories, FDC might be a heterogeneous population that can develop fromhematopoietic and stromal precursors [56, 61]. This favor the vantage point adopted in this studyconsidering FDC as a state of cells rather than a differentiated form of some cell type.
In the simulation FDC differentiate from FRC. This can be viewed as FDC being an ’excited’ stateof stromal cells. However, this must not be interpreted in a strict sense. The mechanism in thesimulation is indistinguishable of the interpretation that FRC and FDC have a common progenitorwhich can develop in either FRC or FDC depending on the external stimuli. Newly developing FDCreplace existing FRC at their site of generation.
In a simplified PLF model it could be shown that sufficiently large aggregates of B cells formingaround stromal cells can induce the presence of FDC if basal levels of LTα1β2 are expressed on the Bcells [23]. The migration properties of B cells derived from the experiment are such that the durationand size of the B cell-FDC contacts are sufficient to allow for a high LTα1β2 stimulus of a singleFDC by the interaction with many B cells. The stimulus can last for several hours which seems tobe reasonable according to the experimental data [13,23,29,62]. Thus, we conclude, that the positivefeedback loop [14] (which is included in the simulation) is not absolutely required to explain initialFDC formation.
2.3 Phenomenological lymphangiogenesis model
Lymphangiogenesis is included in the model in order to generate a LE distribution that matches theexperimental situation [21,28–37]. It is assumed that the LE is not preformed which would determineshape and position of PLF a priori. A preformed LE gap would immediately raise the question whatgenerates this specific LE pattern. Thus, in the simulation the generation of FDC is anti-correlatedwith the LE dynamics: LE is degraded when FDC are formed in the vicinity. It is assumed that theanti-correlation between FDC and LE is local, i.e. the LE-degradation process is not governed by along ranged diffusion of molecular messengers. In a similar manner LE is forming at places whereFDC have transformed back into FRC. Angiogenesis and lymphangiogenesis models are still underdevelopment [63–66]. Therefore, the present tissue simulation takes into account vessel formation anddegradation in the described phenomenological sense without considering the underlying mechanisms.
4
2.4 Internalization of CXCR5
The B cells have to leave the PLF before they can exit from the SLT. LE will dynamically enclose thefollicles. Thus, B cells frequently reach the surface of the follicle and randomly move until a lymphaticvessel has been found for exit. Alternatively, they might return to the follicle. It is assumed that thissearch for exit points is regulated by B cell chemotaxis. As the chemotactic response of leukocytescan be modulated by receptor internalization (reviewed in [67]), in the simulations this regulation ismediated by internalization of the CXCL13 receptor CXCR5.
2.4.1 Regulation of chemotaxis
Studies on neutrophils demonstrated that desensitization of chemoattractant receptors occurs predom-inantly for high concentrations of the chemoattractant [68]. One mode of desensitization is the inter-nalization of the chemokine receptor. However, in line with the dependence on high concentrations, ithas been shown that internalization is not absolutely required for chemotactic responses [67, 69–71].For example CCL21 does not induce the internalization of CCR7 in contrast to CCL19 which causesthe downregulation of this chemokine receptor [70]. It is a general observation that different ligandsof the same receptor cause different internalization levels [67].
Of note, some experiments fail to detect CXCL13 responses of naive B cells freshly isolated fromtonsils although the B cells where equipped with high levels of the corresponding receptor CXCR5 [72].Thus, the presence of chemokine receptors CXCR5 is necessary but not sufficient to cause chemotaxisof naive B cells. Most likely the suppression of the function of the CXCR5 chemokine receptor ismediated by a desensitization mechanism either by internalization or cross-desensitization (see below).
The importance of the receptor state can be demonstrated by the response of B cells towardsCCL21. The surface CCR7 level on freshly isolated B cells is undetectable [73]. The protein can beidentified in the cytoplasm and is brought to the surface in chemokine-free culture. This suggestsreceptor internalization by natural exposure to CCL21 or CCL19 in the tissue. Freshly isolated Tcells also show little attraction by CCL19 [74] suggesting an internalization mechanism for T cells aswell. However, the CCR7 levels have not been investigated in detail. Internalization may explain whydespite the presence of CCL21 in the T zone, and lymphocyte expression of the associated receptorCCR7, no chemotaxis has been observed in this area [75].
The presented data supports the notion that the chemotactic response of lymphocytes in SLT canbe modified by receptor internalization. Therefore cells may be unresponsive to chemokines despiteproper receptor expression and in vitro responses.
Note, that within the model framework regulation of chemotaxis on the basis of other mechanismslike transcriptional regulation is not incorporated.
2.4.2 Complex responses to multiple chemokines
In several systems cross-talks between different chemokines/chemokine receptors have been observed[71]. An example is the cross-desensitization that has been reported for CXCL12 which blocks theCCL19 response of lymphocytes while CCL19 does not block CXCL12 [76]. As expected cross-desensitization is found when different chemokines use the same receptor – as shown for CCL19and CCL21 [77].
5

Not in all cases the effect of multiple chemoattractant is pairwise blocking of the responses. It isalso possible that the cell computes a vector sum of the incoming signals to determine an averagedirection of multiple chemoattractants [78]. Only the direction of cell migration is influenced by theintegrated response, while the speed remains unchanged. This reaction is altered if multiple signalsare given in some sequential order. Then the direction is dominated by the newest chemoattractanteven for lower concentrations and/or gradients [78]. An explanation for this behavior would be thedesensitization of receptors for instance by internalization (see above and [70]). The desensitizationstate represents some memory for the chemoattractants a leukocyte is encountering.
Instead of desensitization a hierarchy of chemoattractants might exist. Indeed, two signaling path-ways for two different chemoattractant receptors have been identified [79]. The hierarchy levels arenamed ’target’ and ’intermediary’ chemoattractants. When only concurrent intermediary signals areprovided the cell responds by computing the vector sum otherwise the target chemoattractants arepreferred.
Which type of response results from multiple signals may rely on the signaling cascade, i.e. whichreceptors share or use a concurring cascade to induce directed cell migration. The data available onthe chemokines CCL19, CCL21, CXCL13, and S1P, which are important for the PLF system, arenot sufficiently conclusive to allow the determination of a signaling hierarchy. Activated naive B cellsupregulate there CCR7-levels by a factor of two to three and consequently enhance their response toCCL19/CCL21. This balances their CXCL13 response such that they migrate to the border betweenthe PLF and T zone [10, 12, 72, 73, 80–82]. When either CXCR5 is overexpressed or CCR7 is lackingB cells fail to relocate to the follicle border upon antigen-stimulation and remain in the follicle [81].Similar if CCR7 is overexpressed by genetic manipulations the B cells locate at the border withoutantigen and are moving farther into the T zone. Analogously, activated T cells upregulate the responseto CXCL13 relocating to the follicle border as well [12, 80,83,84].
Overall this suggests that the relevant chemokines in the PLF system have the same hierarchylevel and the chemotactic response of lymphocytes is a vector sum of concurrent chemokine signals.Therefore this mode of response for CCL19, CCL21, CXCL13 and S1P has been chosen in the model:The speed of lymphocytes is set to a constant value derived from two-photon imaging experiments[75, 82, 85, 86]. The direction of the chemotactic response is the weighted average direction of thechemokine gradients. The weight is provided by the gradient of the bound chemokine at both ends ofthe cell assuming that the cell senses the difference of bound molecules across its diameter.
3 Results
Simulations are performed on the basis of the model as introduced in the previous section. Theminimal set of assumptions entering the model are
• fixed number of non-migrating stromal cells,
• constant entrance of B cells via small number of HEV,
• B cells use the LE for egress from the SLT,
• generation of FDC by B cell LTα1β2 signaling,
6
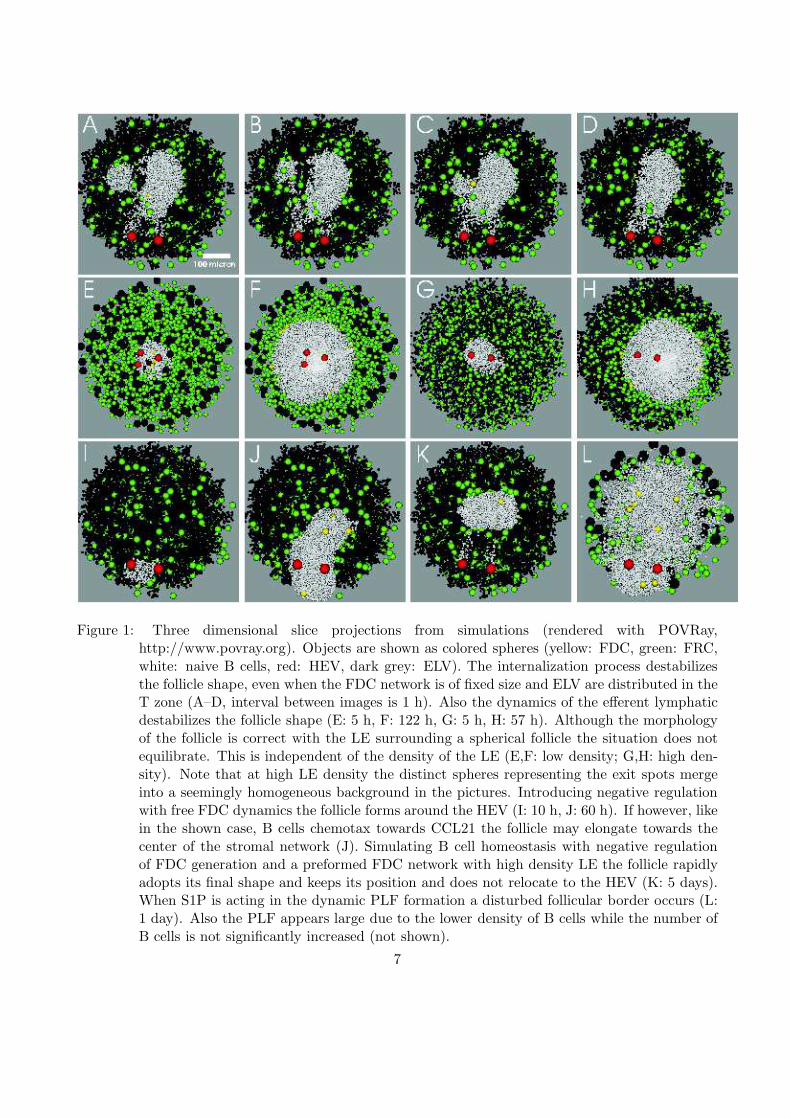
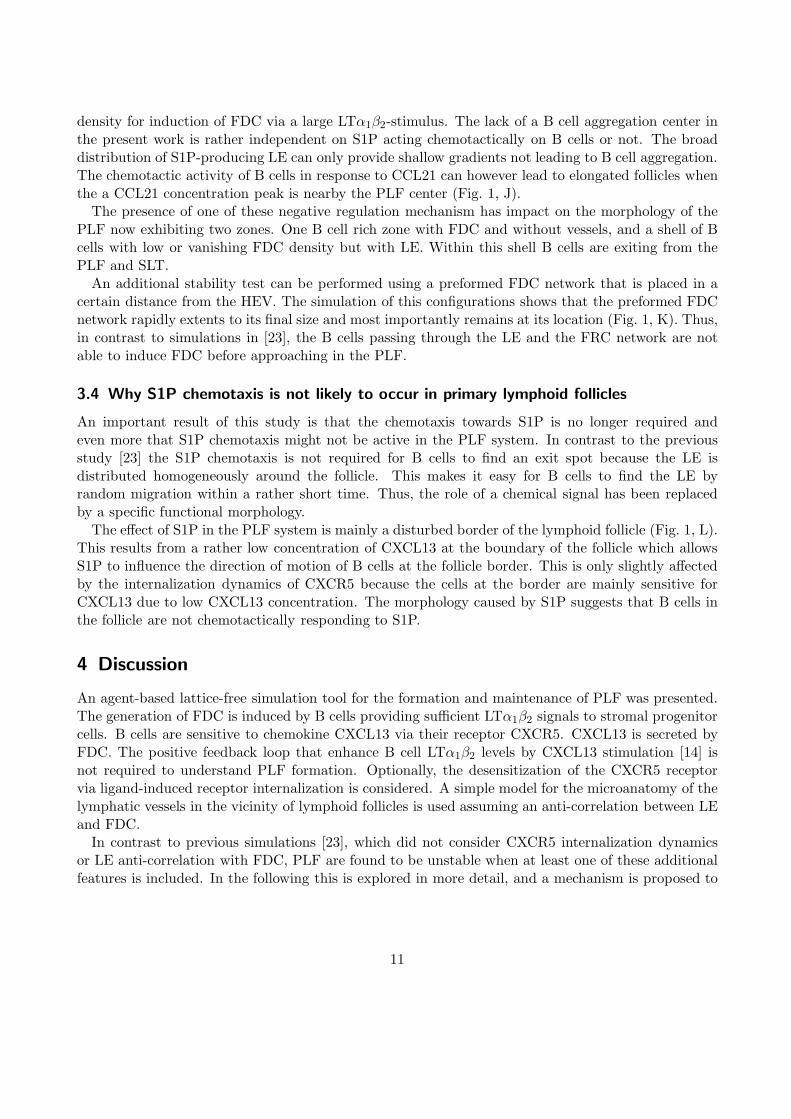
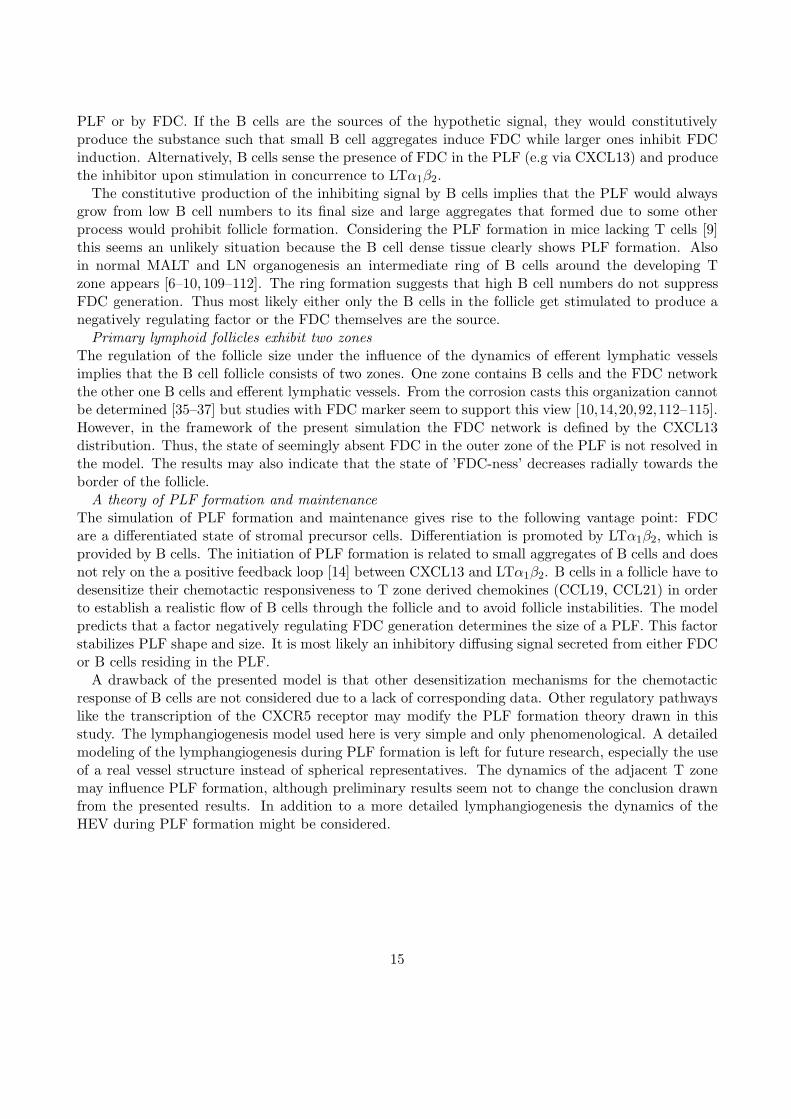
Figure 1: Three dimensional slice projections from simulations (rendered with POVRay,http://www.povray.org). Objects are shown as colored spheres (yellow: FDC, green: FRC,white: naive B cells, red: HEV, dark grey: ELV). The internalization process destabilizesthe follicle shape, even when the FDC network is of fixed size and ELV are distributed in theT zone (A–D, interval between images is 1 h). Also the dynamics of the efferent lymphaticdestabilizes the follicle shape (E: 5 h, F: 122 h, G: 5 h, H: 57 h). Although the morphologyof the follicle is correct with the LE surrounding a spherical follicle the situation does notequilibrate. This is independent of the density of the LE (E,F: low density; G,H: high den-sity). Note that at high LE density the distinct spheres representing the exit spots mergeinto a seemingly homogeneous background in the pictures. Introducing negative regulationwith free FDC dynamics the follicle forms around the HEV (I: 10 h, J: 60 h). If however, likein the shown case, B cells chemotax towards CCL21 the follicle may elongate towards thecenter of the stromal network (J). Simulating B cell homeostasis with negative regulationof FDC generation and a preformed FDC network with high density LE the follicle rapidlyadopts its final shape and keeps its position and does not relocate to the HEV (K: 5 days).When S1P is acting in the dynamic PLF formation a disturbed follicular border occurs (L:1 day). Also the PLF appears large due to the lower density of B cells while the number ofB cells is not significantly increased (not shown).
7
• replacement of FRC by generated FDC,
• removal of FDC (replaced by FRC) in case of lack of LTα1β2 stimulation,
• secretion of CXCL13 by FDC,
• secretion of CCL21 by FRC,
• secretion of S1P by LE,
• chemotactic activity of B cells to CXCL13, CCL21, and S1P,
• B cells leaving the SLT via LE when S1P1 levels are sufficient to dominate CXCL13 response.
These assumptions alone lead to reasonable cell dynamics. Restricting the LE to a small area generatesa PLF that is stable in size, shape, and position (see [23]) using physiological values for the parameters(Table 1). However, the position of the follicle is in contradiction to microanatomical data [21,28–37].Introducing the correct relative position of PLF and LE with dynamic LE, dramatically changes thefollicle stability. Thus, the stability of follicle shape and size in an equilibrium of cell flow cruciallydepends on further mechanisms.
In the following possible mechanisms are discussed that guarantee the stability of the follicle. Themost intuitive hypothesis, is related to internalization dynamics of chemotaxis receptors. It is shownthat this hypothesis leads to unphysiological results and is therefore unlikely to be the relevant factorof physiological follicle formation and maintenance. Realistic results could only be achieved by theassumption of a so far unknown mechanism of negative regulation of FDC generation. This mechanismis a prediction of the model.
3.1 Including internalization dynamics
The internalization of CXCR5 (modeled by Eq. 5 and [23]) destabilizes the shape of the follicle definedby the B cells (Fig. 1, A–D). In a first step, the dynamics of the FDC network was switched off inorder to isolate the effect of B cell internalization dynamics.
The instability is caused by uptake of CXCL13 when the CXCR5-CXCL13 complex is internalized:The chemotactically responding B cells act as a sink for CXCL13. This generates steep gradients in thechemokine distribution which guide the B cell movement. Interestingly, these local gradients, inducedby the responding lymphocyte population itself, can become so strong that they reverse the chemotaxisgradient. Then cell movement is not strictly directed towards the chemokine source anymore.
In principle, a large diffusion constant could counter-balance this tendency. However, the reversal ofchemokine gradients is most pronounced at larger distances of the chemokine source. An unphysiolog-ically large diffusion constant would be required to counter-act the local dynamics in the chemokineconcentration.
Internalization can induce quasi-periodical alterations of the chemokine concentrations. Assume apopulation of B cells with full CXCR5 expression and high concentration of CXCL13. The receptorwill be internalized on all cells using up the CXCL13 to some extent. The lowered CXCL13 concen-tration and CXCR5 levels promote B cells to enter a random walk migration modus and spread. Thelow uptake of CXCL13 by the B cells with internalized CXCR5 permits the CXCL13 concentration torise again. The combination of CXCL13 uptake and switch of cell migration between chemotaxis and
8
random migration leads to a local synchronization of the receptor dynamics of these cells. The spread-ing of the B cells destabilizes the shape of the PLF and becomes significant when local populations ofB cells synchronously spread out.
The instability of the B cell aggregate leads to high B cell densities outside the FDC network. Ifthe FDC network dynamics is switched on again this culminates in the generation of new FDC at theborder of the PLF. The area covered by the B cells becomes more extended than expected from adensely packed set of B cells in the FDC network (see also [23]). In other words, the volume of theFDC network becomes bigger than the volume required by the number of B cells. Thus, the wholePLF becomes unstable in shape and follows the shifted ’center of mass’ of the FDC network as a resultof the CXCL13 concentration peaks.
The positive feedback loop (CXCL13 stimulating higher LTα1β2 levels in B cells, inducing moreCXCL13 secreting FDC [14]) enhances this effect because B cells at low density can already induceFDC when their LTα1β2 levels are high due to the CXCL13 stimulus. This is most pronounced whenthe peak LTα1β2 levels of B cells are delayed compared to the peak CXCL13 stimulus because thenthe cells have a high probability to enter a FDC free area with enhanced surface LTα1β2 levels.
Note that in a previous study no instability was induced by internalization dynamics [23]. Thisis related to S1P chemotaxis towards the LE and to a wrong position of the LE in this study: Thefollicle formed around the LE position.
In conclusion, internalization dynamics of CXCR5 induce unstable PLF. As such instabilities arenot observed in nature, the present model predicts that receptor internalization is not a dominantprocess in PLF formation and maintenance. Even though it can not be excluded that internalizationis active and only attenuated by further interactions, it is unlikely that we loose essential features ofPLF formation when neglecting internalization dynamics in the following. However, the robustness ofthe results with respect to internalization dynamics will be considered.
3.2 Including lymphatic endothelium dynamics
LE dynamics might be considered to stabilize follicle shape and size by locating the exit points forB cells. However, LE dynamics turn out to destabilizes the follicle system independently of theinternalization dynamics (Fig. 1, E–H and Fig. 2). The reason for this instability is as follows: B cellsthat approach the LE – either by random motion or S1P-directed migration (Sec. 3.4) – can stimulateFRC to become FDC if they occur at sufficient density such that FDC are generated right next to theexit spots. As FDC and LE are anti-correlated, i.e. the vicinity of LE is free of FDC, the generationof FDC leads to the degradation of the LE. The exit spots for B cells are pushed further away. TheB cells need to approach the LE and ’follow’ the distant exit spots. Due to the increased distance ofthe exit spots from the follicle center the B cells take longer to reach the spots thus increasing theirtransit time. Consequently the follicle is enlarged and the density of B cells close to the exit spotsagain reaches concentrations to induce new FDC. Thus a self-perpetuating process drives the borderbetween FDC and LE leading to a constantly growing PLF size.
Even though the model for the genesis of lymph endothelium is rather simplistic, it nevertheless cov-ers a reasonable idea of the dynamics of LE. The destabilizing effect of this basic model points towardsan additional process that prevents the PLF from constant growth by inhibition of the generation ofFDC at the right follicle size.
9
0 25 50 75 100 125time [h]
0
2
4
6
8
10
cell
num
ber
[*1e
+4]
low density: FDC*500low density: B cellshigh density: FDC*500high density: B cells
cell kinetics
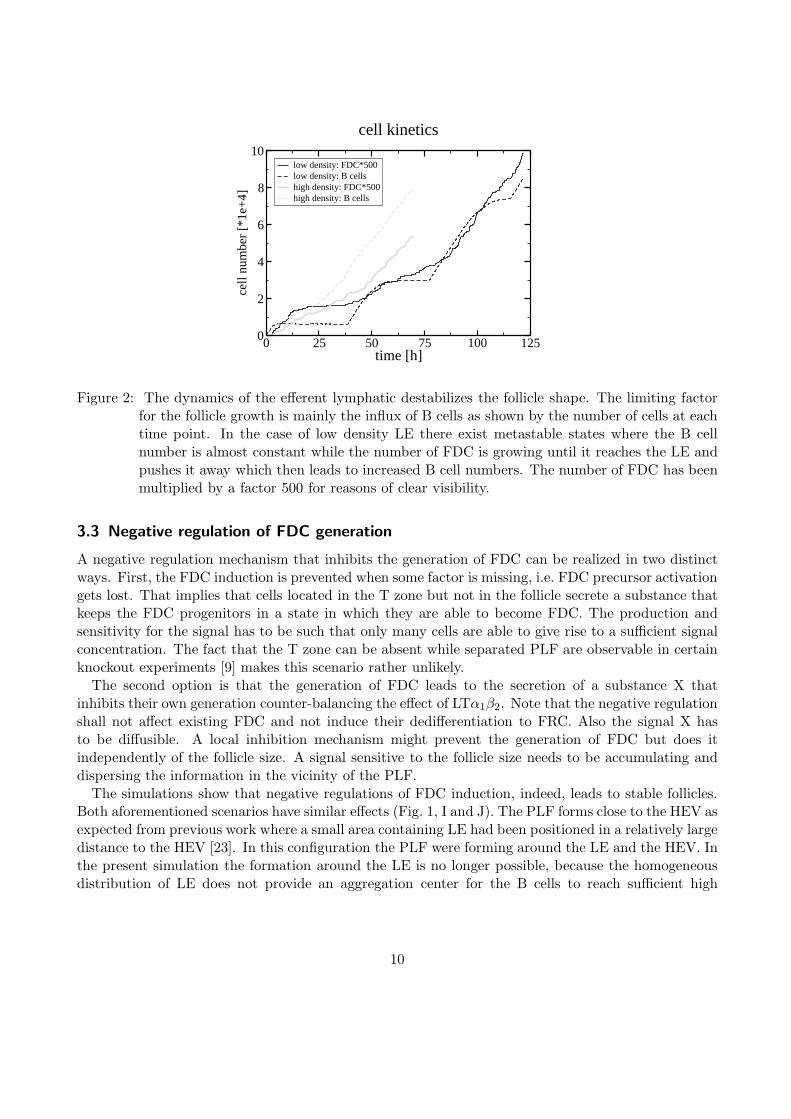
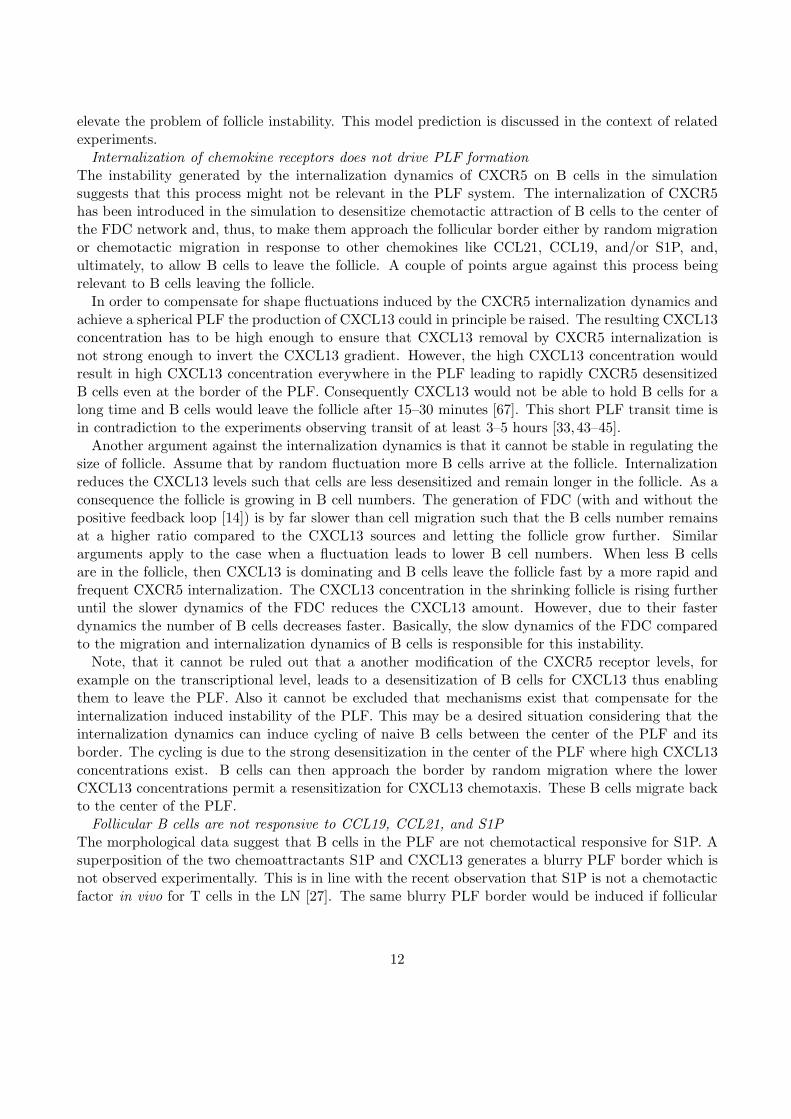
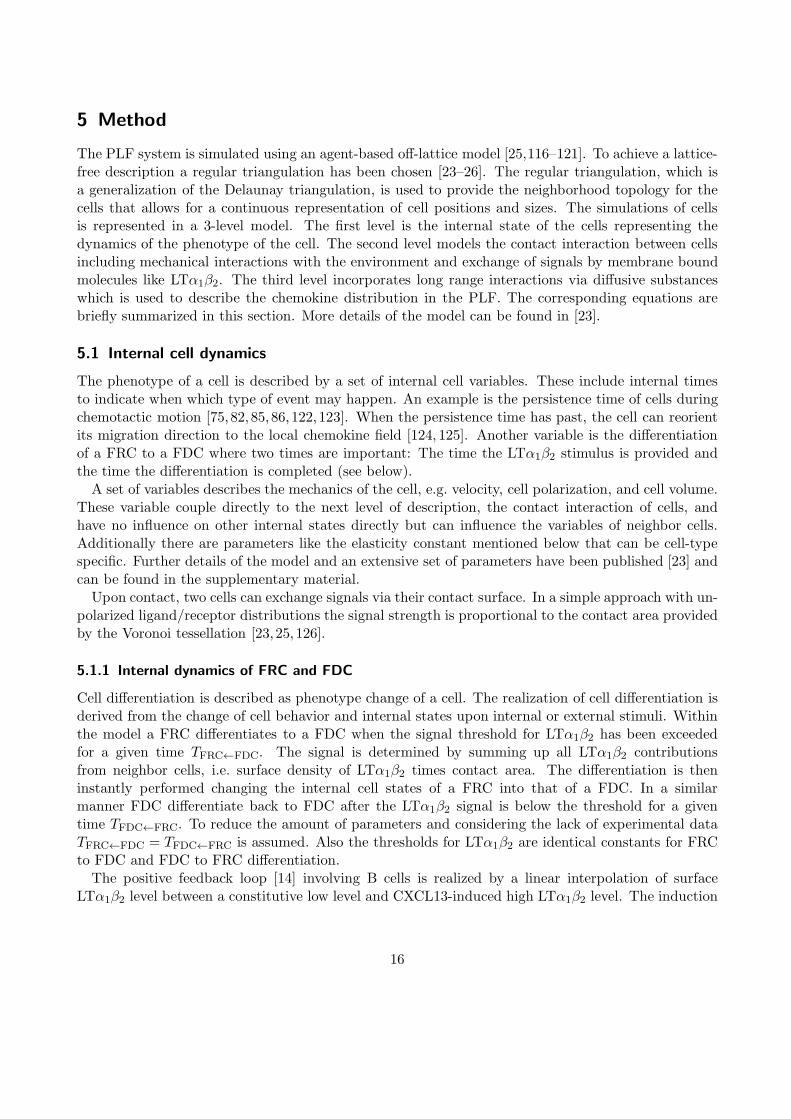
Figure 2: The dynamics of the efferent lymphatic destabilizes the follicle shape. The limiting factorfor the follicle growth is mainly the influx of B cells as shown by the number of cells at eachtime point. In the case of low density LE there exist metastable states where the B cellnumber is almost constant while the number of FDC is growing until it reaches the LE andpushes it away which then leads to increased B cell numbers. The number of FDC has beenmultiplied by a factor 500 for reasons of clear visibility.
3.3 Negative regulation of FDC generation
A negative regulation mechanism that inhibits the generation of FDC can be realized in two distinctways. First, the FDC induction is prevented when some factor is missing, i.e. FDC precursor activationgets lost. That implies that cells located in the T zone but not in the follicle secrete a substance thatkeeps the FDC progenitors in a state in which they are able to become FDC. The production andsensitivity for the signal has to be such that only many cells are able to give rise to a sufficient signalconcentration. The fact that the T zone can be absent while separated PLF are observable in certainknockout experiments [9] makes this scenario rather unlikely.
The second option is that the generation of FDC leads to the secretion of a substance X thatinhibits their own generation counter-balancing the effect of LTα1β2. Note that the negative regulationshall not affect existing FDC and not induce their dedifferentiation to FRC. Also the signal X hasto be diffusible. A local inhibition mechanism might prevent the generation of FDC but does itindependently of the follicle size. A signal sensitive to the follicle size needs to be accumulating anddispersing the information in the vicinity of the PLF.
The simulations show that negative regulations of FDC induction, indeed, leads to stable follicles.Both aforementioned scenarios have similar effects (Fig. 1, I and J). The PLF forms close to the HEV asexpected from previous work where a small area containing LE had been positioned in a relatively largedistance to the HEV [23]. In this configuration the PLF were forming around the LE and the HEV. Inthe present simulation the formation around the LE is no longer possible, because the homogeneousdistribution of LE does not provide an aggregation center for the B cells to reach sufficient high
10
density for induction of FDC via a large LTα1β2-stimulus. The lack of a B cell aggregation center inthe present work is rather independent on S1P acting chemotactically on B cells or not. The broaddistribution of S1P-producing LE can only provide shallow gradients not leading to B cell aggregation.The chemotactic activity of B cells in response to CCL21 can however lead to elongated follicles whenthe a CCL21 concentration peak is nearby the PLF center (Fig. 1, J).
The presence of one of these negative regulation mechanism has impact on the morphology of thePLF now exhibiting two zones. One B cell rich zone with FDC and without vessels, and a shell of Bcells with low or vanishing FDC density but with LE. Within this shell B cells are exiting from thePLF and SLT.
An additional stability test can be performed using a preformed FDC network that is placed in acertain distance from the HEV. The simulation of this configurations shows that the preformed FDCnetwork rapidly extents to its final size and most importantly remains at its location (Fig. 1, K). Thus,in contrast to simulations in [23], the B cells passing through the LE and the FRC network are notable to induce FDC before approaching in the PLF.
3.4 Why S1P chemotaxis is not likely to occur in primary lymphoid follicles
An important result of this study is that the chemotaxis towards S1P is no longer required andeven more that S1P chemotaxis might not be active in the PLF system. In contrast to the previousstudy [23] the S1P chemotaxis is not required for B cells to find an exit spot because the LE isdistributed homogeneously around the follicle. This makes it easy for B cells to find the LE byrandom migration within a rather short time. Thus, the role of a chemical signal has been replacedby a specific functional morphology.
The effect of S1P in the PLF system is mainly a disturbed border of the lymphoid follicle (Fig. 1, L).This results from a rather low concentration of CXCL13 at the boundary of the follicle which allowsS1P to influence the direction of motion of B cells at the follicle border. This is only slightly affectedby the internalization dynamics of CXCR5 because the cells at the border are mainly sensitive forCXCL13 due to low CXCL13 concentration. The morphology caused by S1P suggests that B cells inthe follicle are not chemotactically responding to S1P.
4 Discussion
An agent-based lattice-free simulation tool for the formation and maintenance of PLF was presented.The generation of FDC is induced by B cells providing sufficient LTα1β2 signals to stromal progenitorcells. B cells are sensitive to chemokine CXCL13 via their receptor CXCR5. CXCL13 is secreted byFDC. The positive feedback loop that enhance B cell LTα1β2 levels by CXCL13 stimulation [14] isnot required to understand PLF formation. Optionally, the desensitization of the CXCR5 receptorvia ligand-induced receptor internalization is considered. A simple model for the microanatomy of thelymphatic vessels in the vicinity of lymphoid follicles is used assuming an anti-correlation between LEand FDC.
In contrast to previous simulations [23], which did not consider CXCR5 internalization dynamicsor LE anti-correlation with FDC, PLF are found to be unstable when at least one of these additionalfeatures is included. In the following this is explored in more detail, and a mechanism is proposed to
11
elevate the problem of follicle instability. This model prediction is discussed in the context of relatedexperiments.
Internalization of chemokine receptors does not drive PLF formationThe instability generated by the internalization dynamics of CXCR5 on B cells in the simulationsuggests that this process might not be relevant in the PLF system. The internalization of CXCR5has been introduced in the simulation to desensitize chemotactic attraction of B cells to the center ofthe FDC network and, thus, to make them approach the follicular border either by random migrationor chemotactic migration in response to other chemokines like CCL21, CCL19, and/or S1P, and,ultimately, to allow B cells to leave the follicle. A couple of points argue against this process beingrelevant to B cells leaving the follicle.
In order to compensate for shape fluctuations induced by the CXCR5 internalization dynamics andachieve a spherical PLF the production of CXCL13 could in principle be raised. The resulting CXCL13concentration has to be high enough to ensure that CXCL13 removal by CXCR5 internalization isnot strong enough to invert the CXCL13 gradient. However, the high CXCL13 concentration wouldresult in high CXCL13 concentration everywhere in the PLF leading to rapidly CXCR5 desensitizedB cells even at the border of the PLF. Consequently CXCL13 would not be able to hold B cells for along time and B cells would leave the follicle after 15–30 minutes [67]. This short PLF transit time isin contradiction to the experiments observing transit of at least 3–5 hours [33,43–45].
Another argument against the internalization dynamics is that it cannot be stable in regulating thesize of follicle. Assume that by random fluctuation more B cells arrive at the follicle. Internalizationreduces the CXCL13 levels such that cells are less desensitized and remain longer in the follicle. As aconsequence the follicle is growing in B cell numbers. The generation of FDC (with and without thepositive feedback loop [14]) is by far slower than cell migration such that the B cells number remainsat a higher ratio compared to the CXCL13 sources and letting the follicle grow further. Similararguments apply to the case when a fluctuation leads to lower B cell numbers. When less B cellsare in the follicle, then CXCL13 is dominating and B cells leave the follicle fast by a more rapid andfrequent CXCR5 internalization. The CXCL13 concentration in the shrinking follicle is rising furtheruntil the slower dynamics of the FDC reduces the CXCL13 amount. However, due to their fasterdynamics the number of B cells decreases faster. Basically, the slow dynamics of the FDC comparedto the migration and internalization dynamics of B cells is responsible for this instability.
Note, that it cannot be ruled out that a another modification of the CXCR5 receptor levels, forexample on the transcriptional level, leads to a desensitization of B cells for CXCL13 thus enablingthem to leave the PLF. Also it cannot be excluded that mechanisms exist that compensate for theinternalization induced instability of the PLF. This may be a desired situation considering that theinternalization dynamics can induce cycling of naive B cells between the center of the PLF and itsborder. The cycling is due to the strong desensitization in the center of the PLF where high CXCL13concentrations exist. B cells can then approach the border by random migration where the lowerCXCL13 concentrations permit a resensitization for CXCL13 chemotaxis. These B cells migrate backto the center of the PLF.
Follicular B cells are not responsive to CCL19, CCL21, and S1PThe morphological data suggest that B cells in the PLF are not chemotactical responsive for S1P. Asuperposition of the two chemoattractants S1P and CXCL13 generates a blurry PLF border which isnot observed experimentally. This is in line with the recent observation that S1P is not a chemotacticfactor in vivo for T cells in the LN [27]. The same blurry PLF border would be induced if follicular
12
B cells responded to the T zone chemokines CCL19 and CCL21. Therefore, the simulation suggeststhat chemotaxis to CCL19, CCL21 and S1P is suppressed in follicular B cells, which seems to bethe case in vivo [12, 77, 87, 88] despite the positive response in vitro [74, 76]. This may be caused byinternalization of CCR7 at the border of the PLF where the concentrations of CCL19 and CCL21 arestill quite high [82, 89] which is supported by the missing CCR7 surface levels of freshly isolated Bcells [73].
A CXCL13-LTα1β2 positive feedback loop initiates PLF formation and gradual FDC differentiationThe function of the positive feedback loop [14] (LTα1β2 levels are increased by CXCL13, and LTα1β2induce novel FDC which are the source of CXCL13) was analyzed in the simulations. There aretwo possible functions: First, a randomly formed B cell aggregate may induce a minimum level ofCXCL13 that starts the feedback loop leading to increased LTα1β2 and finally to increased CXCL13.The CXCL13 levels reached in this way are sufficiently strong to induce chemotaxis in B cells and todominate other chemotactic responses (e.g. to CCL21). This initiates formation of follicles. However,in vitro data show that very high CXCL13 levels (10 nM) are required to efficiently induce LTα1β2 onB cells [89]. These concentrations are already optimal for chemotaxis [90,91], which sets in question theformer functional interpretation of the feedback loop. If one, nevertheless, assumes that the positivefeedback loop is required to induce initial CXCL13 expression, then the initiation of the first FDCrequires either another helper cell type or high LTα1β2 levels on some B cells. The latter might be aresult of stimulation with antigen [14]. Then, either the cellular helper source needs to be identifiedor the dependence on B cell activation has to be confirmed.
An alternative interpretation is that the LTα1β2 signal resulting solely from the aggregation of Bcells may be sufficient to induce CXCL13-producing FDC but not other FDC markers like CD21 orCD35 which require the high LTα1β2 levels achieved by the feedback loop [14]. The gradual maturationof FDC observed in other studies [20,51] supports this notion.
Moreover the notion of gradual maturation favors the strict interpretation of FDC as excited stateof stromal cells and speaks against the differentiation of an unknown progenitor. This may alsoexplain why in certain experiments FDC are rapidly lost when the LTα1β2 stimulus is blocked withantibodies [13, 62, 92, 93]. Thus the loss of the LTα1β2 signal may not lead to the loss of FDC byapoptosis but a ’decay’ of exited stromal cell back to their native state.
Lymphatic vesselsThe microanatomical location of the LE has been modeled by an exclusion principle: Whenever aFDC is newly appearing the lymphatic vessels in the vicinity are removed. Presumably, remodelingis organized by the exchange of chemicals inducing behavioral changes of the LE cell. This is notconsidered explicitly but summarized in a time delay of LE remodeling of several hours. Analogouslythe dedifferentiation of a FDC into a FRC is followed by the creation of LE.
The regulation of the LE is not precisely understood. In the following several hypothetic pathwaysthat may regulate the LE dynamics and their corresponding experimental evidence are discussed. TheLE dynamics could be related to the ECM. The reticular fibers are sparse in the follicle [31, 94–100]and their degradation in the PLF could cause the disintegration of lymphatic vessels. A candidatesignal to be involved is the expression of matrix metalloproteinases by FDC [101]. The generation ofECM components by FRC provides the ground for LE cells to extent the network in this area. Therequired vascular endothelial growth factors VEGF-C and/or VEGF-D can be provided from cells likemacrophages (which can transdifferentiate into LE cells themselves) [102] or dendritic cells [103]. Inthis view, the gradual destruction of the reticular network in developing follicles in sheep [18] would
13
be accompanied by a gradual loss of LE in this area, which, in turn, promotes PLF growth.There exists indirect evidence how LE remodeling might be regulated in the PLF. Angiogenesis
and lymphangiogenesis during airway infections is dependent on B cells [104]. A candidate for themediator signal is vascular endothelial growth factor (VEGF)-D [104]. Although the cellular sourceis not clear VEGF-D could directly couple to B cells as suggested by the stimulation of VEGF byc-Myc+ B cells in lymphoma [105]. A VEGF source candidate in SLT are DC in the T zone [103]. Theco-localization of DC in the T zone correlates with the presence of LE. Thus it may turn out that DCare important for the structure of SLT. The lack of LE in the PLF may then be coupled to the absenceof DC and not to a LE-destructing process initiated by the FDC. This hypothesis is already coveredby the present simulations outcome of the simulation because in the real tissue as soon as FDC form,the DC are replaced by B cells. Thus VEGF will no longer be present and consequently lymphaticvessels are not maintained. An experiment using a system with VEGF−/− DC may elucidate the roleof DC in SLT lymphangiogenesis.
Assuming that DC are responsible for the location of LE, the ring of B cells found in certain LTα1β2and/or TNF-α-deficiencies [9–11] should be devoid of LE. However, the absence of LE in the B cellring does not exclude the possibility that high B cells densities lead to the reduction of LE. Thus, theanti-correlation of FDC and LE assumed in the simulation can be re-interpreted to be indirect in theway that FDC support the aggregation of B cells leading to reduced LE in the PLF.
TNF-α might be not only involved in the generation of FDC [9–11] but directly in the LE remodelingprocess. Both B and T cells can provide TNF-α [9, 11]. TNF-α can upregulate VEGF-C ( [106] andreferences in [103]). The anti-correlation between FDC and vessels may be related to the TNF-α levelsin the PLF that are raised by TNF-α-producing FDC [107]. It is known that TNF-α can also haveanti-angiogenic effects at high concentrations [108]. TNF-α in the PLF may be present at sufficientlyhigh levels to induce anti-angiogenic effects .
The presented model assumes that the lymphatic network formation in SLT is coupled to thedynamics of PLF. In contrast one could assume that the LE is formed before PLF formation anddetermines the position and shape of the developing PLF. A direct test for the existence of the LE
dynamics is to provide anti-angiogenic factors to LTα1β−/−2 or similar knockouts prior to reconstitution
by wildtype lymphocytes or bone marrow. The PLF that form should be much smaller than usual andcontain LE. Alternatively, the inverse experiment could be done by blocking LTα1β2 in wildtype mice
or reconstitute them with bone marrow from LTα1β−/−2 . The disruption of the PLF should be followed
by the presence of vessels in these areas. When using anti-angiogenic factors during the experiment,the gaps in the vessel network due to the PLF should be preserved when the PLF disappear.
A novel mechanism of negative regulation of FDC generationThe instabilities created by the LE dynamics require a mechanism that negatively regulates the induc-tion of FDC. Even though negative regulation might be realized in a number of different mechanisms,from the simulation viewpoint, only the source and the propagation of the signal initiating negativeregulation are relevant. Either a signal has to be reduced or to be produced when FDC are generated.In both cases the signal overcomes a threshold at the border of the PLF. The signal is required to bediffusive in order to act on the length scale of a PLF and can be shown to require a rather fast decayin order to establish a time-independent (stable) follicle size (Appendix A).
Within the framework of the simulation an inhibiting signal is suggested that is produced whenFDC are generated. Note that this inhibiting signal may be secreted either by B cells located in the
14
PLF or by FDC. If the B cells are the sources of the hypothetic signal, they would constitutivelyproduce the substance such that small B cell aggregates induce FDC while larger ones inhibit FDCinduction. Alternatively, B cells sense the presence of FDC in the PLF (e.g via CXCL13) and producethe inhibitor upon stimulation in concurrence to LTα1β2.
The constitutive production of the inhibiting signal by B cells implies that the PLF would alwaysgrow from low B cell numbers to its final size and large aggregates that formed due to some otherprocess would prohibit follicle formation. Considering the PLF formation in mice lacking T cells [9]this seems an unlikely situation because the B cell dense tissue clearly shows PLF formation. Alsoin normal MALT and LN organogenesis an intermediate ring of B cells around the developing Tzone appears [6–10, 109–112]. The ring formation suggests that high B cell numbers do not suppressFDC generation. Thus most likely either only the B cells in the follicle get stimulated to produce anegatively regulating factor or the FDC themselves are the source.
Primary lymphoid follicles exhibit two zonesThe regulation of the follicle size under the influence of the dynamics of efferent lymphatic vesselsimplies that the B cell follicle consists of two zones. One zone contains B cells and the FDC networkthe other one B cells and efferent lymphatic vessels. From the corrosion casts this organization cannotbe determined [35–37] but studies with FDC marker seem to support this view [10,14,20,92,112–115].However, in the framework of the present simulation the FDC network is defined by the CXCL13distribution. Thus, the state of seemingly absent FDC in the outer zone of the PLF is not resolved inthe model. The results may also indicate that the state of ’FDC-ness’ decreases radially towards theborder of the follicle.
A theory of PLF formation and maintenanceThe simulation of PLF formation and maintenance gives rise to the following vantage point: FDCare a differentiated state of stromal precursor cells. Differentiation is promoted by LTα1β2, which isprovided by B cells. The initiation of PLF formation is related to small aggregates of B cells and doesnot rely on the a positive feedback loop [14] between CXCL13 and LTα1β2. B cells in a follicle have todesensitize their chemotactic responsiveness to T zone derived chemokines (CCL19, CCL21) in orderto establish a realistic flow of B cells through the follicle and to avoid follicle instabilities. The modelpredicts that a factor negatively regulating FDC generation determines the size of a PLF. This factorstabilizes PLF shape and size. It is most likely an inhibitory diffusing signal secreted from either FDCor B cells residing in the PLF.
A drawback of the presented model is that other desensitization mechanisms for the chemotacticresponse of B cells are not considered due to a lack of corresponding data. Other regulatory pathwayslike the transcription of the CXCR5 receptor may modify the PLF formation theory drawn in thisstudy. The lymphangiogenesis model used here is very simple and only phenomenological. A detailedmodeling of the lymphangiogenesis during PLF formation is left for future research, especially the useof a real vessel structure instead of spherical representatives. The dynamics of the adjacent T zonemay influence PLF formation, although preliminary results seem not to change the conclusion drawnfrom the presented results. In addition to a more detailed lymphangiogenesis the dynamics of theHEV during PLF formation might be considered.
15
5 Method
The PLF system is simulated using an agent-based off-lattice model [25,116–121]. To achieve a lattice-free description a regular triangulation has been chosen [23–26]. The regular triangulation, which isa generalization of the Delaunay triangulation, is used to provide the neighborhood topology for thecells that allows for a continuous representation of cell positions and sizes. The simulations of cellsis represented in a 3-level model. The first level is the internal state of the cells representing thedynamics of the phenotype of the cell. The second level models the contact interaction between cellsincluding mechanical interactions with the environment and exchange of signals by membrane boundmolecules like LTα1β2. The third level incorporates long range interactions via diffusive substanceswhich is used to describe the chemokine distribution in the PLF. The corresponding equations arebriefly summarized in this section. More details of the model can be found in [23].
5.1 Internal cell dynamics
The phenotype of a cell is described by a set of internal cell variables. These include internal timesto indicate when which type of event may happen. An example is the persistence time of cells duringchemotactic motion [75,82,85,86,122,123]. When the persistence time has past, the cell can reorientits migration direction to the local chemokine field [124, 125]. Another variable is the differentiationof a FRC to a FDC where two times are important: The time the LTα1β2 stimulus is provided andthe time the differentiation is completed (see below).
A set of variables describes the mechanics of the cell, e.g. velocity, cell polarization, and cell volume.These variable couple directly to the next level of description, the contact interaction of cells, andhave no influence on other internal states directly but can influence the variables of neighbor cells.Additionally there are parameters like the elasticity constant mentioned below that can be cell-typespecific. Further details of the model and an extensive set of parameters have been published [23] andcan be found in the supplementary material.
Upon contact, two cells can exchange signals via their contact surface. In a simple approach with un-polarized ligand/receptor distributions the signal strength is proportional to the contact area providedby the Voronoi tessellation [23,25,126].
5.1.1 Internal dynamics of FRC and FDC
Cell differentiation is described as phenotype change of a cell. The realization of cell differentiation isderived from the change of cell behavior and internal states upon internal or external stimuli. Withinthe model a FRC differentiates to a FDC when the signal threshold for LTα1β2 has been exceededfor a given time TFRC←FDC. The signal is determined by summing up all LTα1β2 contributionsfrom neighbor cells, i.e. surface density of LTα1β2 times contact area. The differentiation is theninstantly performed changing the internal cell states of a FRC into that of a FDC. In a similarmanner FDC differentiate back to FDC after the LTα1β2 signal is below the threshold for a giventime TFDC←FRC. To reduce the amount of parameters and considering the lack of experimental dataTFRC←FDC = TFDC←FRC is assumed. Also the thresholds for LTα1β2 are identical constants for FRCto FDC and FDC to FRC differentiation.
The positive feedback loop [14] involving B cells is realized by a linear interpolation of surfaceLTα1β2 level between a constitutive low level and CXCL13-induced high LTα1β2 level. The induction
16
by CXCL13 is chosen to be proportional to the fraction of bound CXCR5 receptor implying animmediate response. As an additional variant the LTα1β2 level can been chosen proportional to theamount of internalized CXCR5 to model a delayed response. Additional delays which may result bythe transcription of LTα1β2 have not been considered. This seems to be realistic considering that Bcells reside in the PLF for a few hours [33, 43–45] which permits high LTα1β2 levels only when thecells are about to leave the follicle, if at all.
5.2 Equations of motion
The contact interaction of cells is primarily the mechanical interaction between cells. It is described byNewtonian equations of motion in the overdamped approximation. In this approximation accelerationof cells and consequently conservation of moment can be ignored. The equations incorporate elastic cellresponses upon cell contact, forces generated by actively migrating cells, and friction forces betweencells as well as cells and extracellular matrix.
The Newtonian equations of motion read
mixi = Facti (φi) +
∑
j∈Ni
[
Factij (φi)− Fact
ji (φj) +Fpassij
]
+ Fdragi ≈ 0. (1)
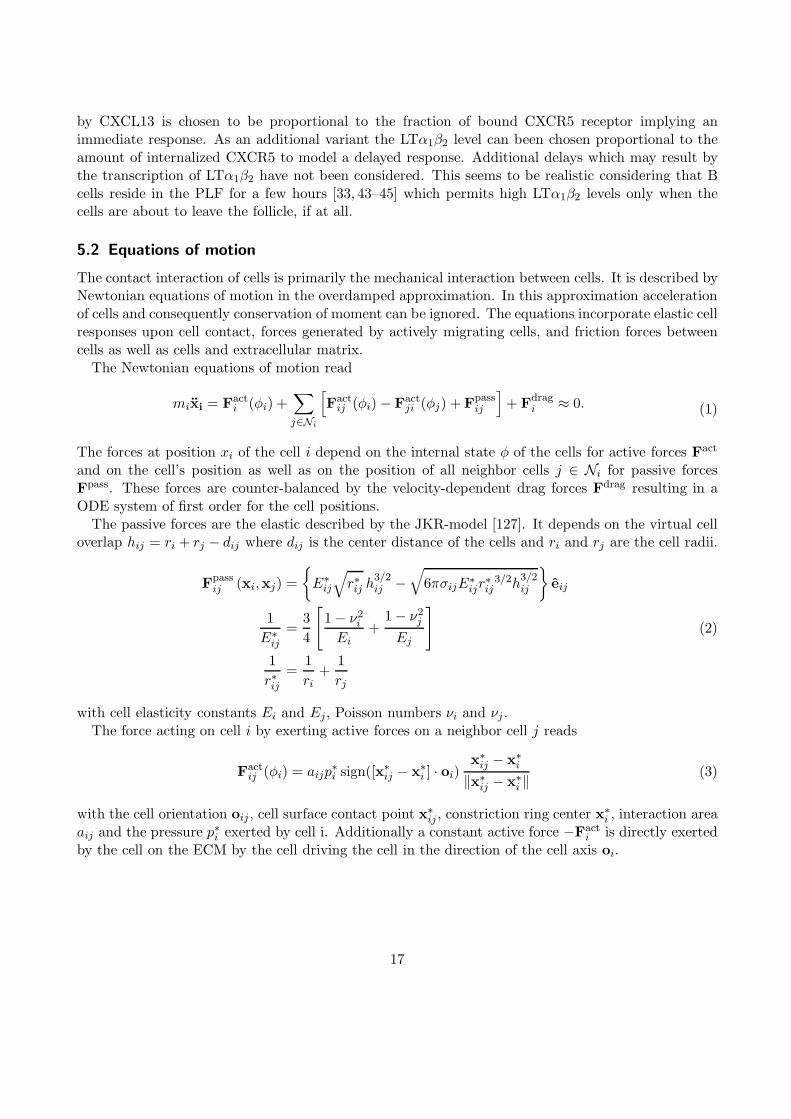
The forces at position xi of the cell i depend on the internal state φ of the cells for active forces Fact
and on the cell’s position as well as on the position of all neighbor cells j ∈ Ni for passive forcesFpass. These forces are counter-balanced by the velocity-dependent drag forces Fdrag resulting in aODE system of first order for the cell positions.
The passive forces are the elastic described by the JKR-model [127]. It depends on the virtual celloverlap hij = ri + rj − dij where dij is the center distance of the cells and ri and rj are the cell radii.
Fpassij (xi,xj) =
{
E∗ij
√
r∗ij h3/2ij −
√
6πσijE∗ijr∗ij3/2h
3/2ij
}
eij
1
E∗ij=
3
4
[
1− ν2iEi
+1− ν2jEj
]
1
r∗ij=
1
ri+
1
rj
(2)
with cell elasticity constants Ei and Ej, Poisson numbers νi and νj .The force acting on cell i by exerting active forces on a neighbor cell j reads
Factij (φi) = aijp
∗i sign([x
∗ij − x∗i ] · oi)
x∗ij − x∗i‖x∗ij − x∗i ‖
(3)
with the cell orientation oij , cell surface contact point x∗ij , constriction ring center x∗i , interaction area
aij and the pressure p∗i exerted by cell i. Additionally a constant active force −Facti is directly exerted
by the cell on the ECM by the cell driving the cell in the direction of the cell axis oi.
17
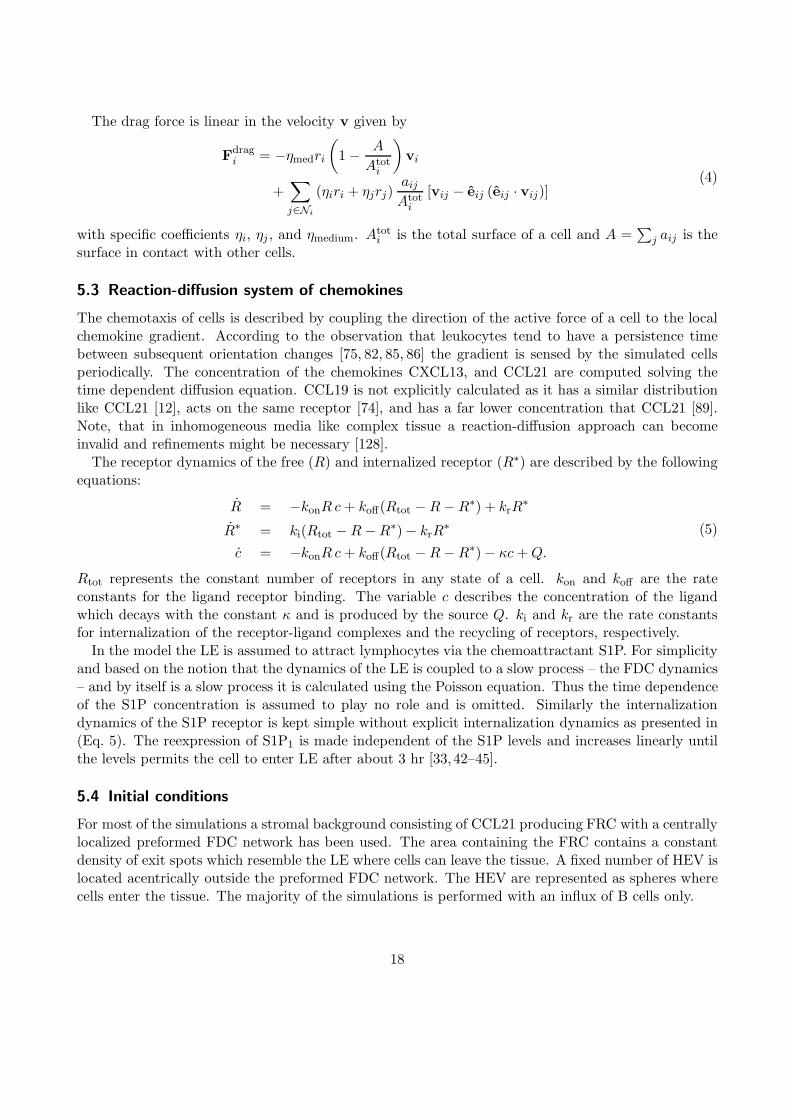
The drag force is linear in the velocity v given by
Fdragi = −ηmedri
(
1−A
Atoti
)
vi
+∑
j∈Ni
(ηiri + ηjrj)aijAtot
i
[vij − eij (eij · vij)](4)
with specific coefficients ηi, ηj , and ηmedium. Atoti is the total surface of a cell and A =
∑
j aij is thesurface in contact with other cells.
5.3 Reaction-diffusion system of chemokines
The chemotaxis of cells is described by coupling the direction of the active force of a cell to the localchemokine gradient. According to the observation that leukocytes tend to have a persistence timebetween subsequent orientation changes [75, 82, 85, 86] the gradient is sensed by the simulated cellsperiodically. The concentration of the chemokines CXCL13, and CCL21 are computed solving thetime dependent diffusion equation. CCL19 is not explicitly calculated as it has a similar distributionlike CCL21 [12], acts on the same receptor [74], and has a far lower concentration that CCL21 [89].Note, that in inhomogeneous media like complex tissue a reaction-diffusion approach can becomeinvalid and refinements might be necessary [128].
The receptor dynamics of the free (R) and internalized receptor (R∗) are described by the followingequations:
R = −konRc+ koff(Rtot −R−R∗) + krR∗
R∗ = ki(Rtot −R−R∗)− krR∗
c = −konRc+ koff(Rtot −R−R∗)− κc+Q.
(5)
Rtot represents the constant number of receptors in any state of a cell. kon and koff are the rateconstants for the ligand receptor binding. The variable c describes the concentration of the ligandwhich decays with the constant κ and is produced by the source Q. ki and kr are the rate constantsfor internalization of the receptor-ligand complexes and the recycling of receptors, respectively.
In the model the LE is assumed to attract lymphocytes via the chemoattractant S1P. For simplicityand based on the notion that the dynamics of the LE is coupled to a slow process – the FDC dynamics– and by itself is a slow process it is calculated using the Poisson equation. Thus the time dependenceof the S1P concentration is assumed to play no role and is omitted. Similarly the internalizationdynamics of the S1P receptor is kept simple without explicit internalization dynamics as presented in(Eq. 5). The reexpression of S1P1 is made independent of the S1P levels and increases linearly untilthe levels permits the cell to enter LE after about 3 hr [33,42–45].
5.4 Initial conditions
For most of the simulations a stromal background consisting of CCL21 producing FRC with a centrallylocalized preformed FDC network has been used. The area containing the FRC contains a constantdensity of exit spots which resemble the LE where cells can leave the tissue. A fixed number of HEV islocated acentrically outside the preformed FDC network. The HEV are represented as spheres wherecells enter the tissue. The majority of the simulations is performed with an influx of B cells only.
18
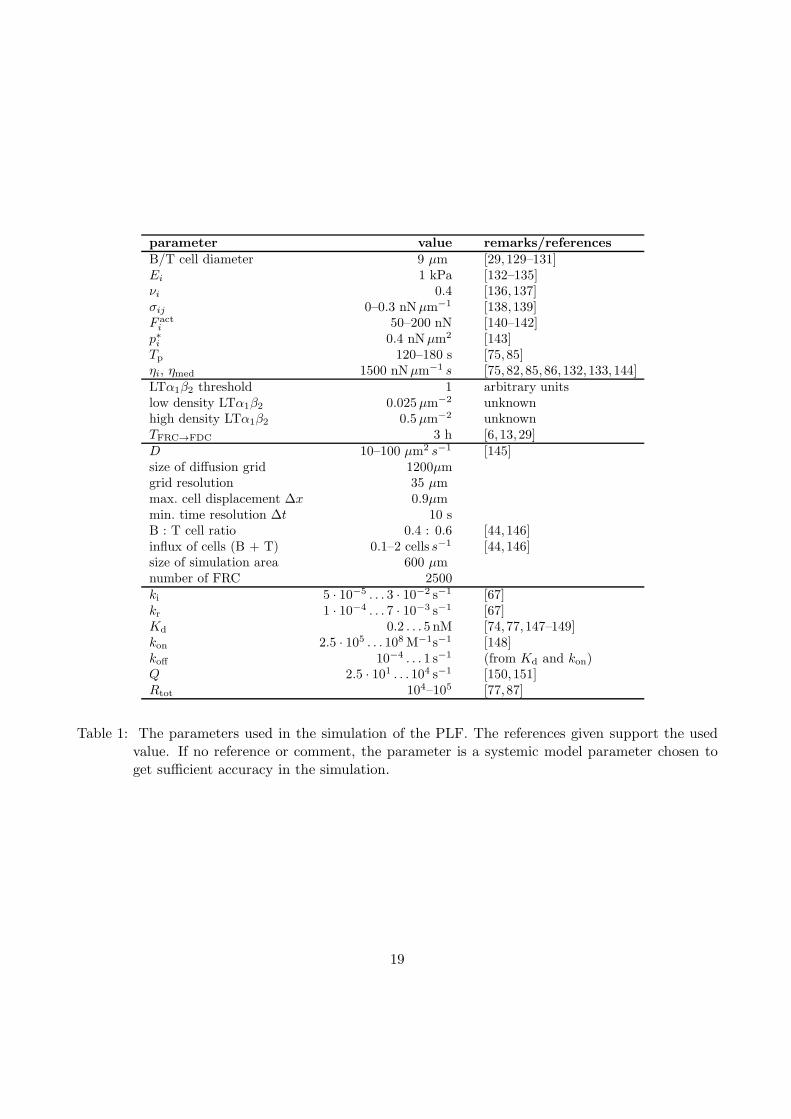
parameter value remarks/referencesB/T cell diameter 9 µm [29,129–131]Ei 1 kPa [132–135]νi 0.4 [136, 137]σij 0–0.3 nNµm−1 [138, 139]F acti 50–200 nN [140–142]
p∗i 0.4 nNµm2 [143]Tp 120–180 s [75, 85]ηi, ηmed 1500 nNµm−1 s [75, 82, 85, 86, 132, 133, 144]LTα1β2 threshold 1 arbitrary unitslow density LTα1β2 0.025µm−2 unknownhigh density LTα1β2 0.5µm−2 unknownTFRC→FDC 3 h [6, 13, 29]D 10–100 µm2 s−1 [145]size of diffusion grid 1200µmgrid resolution 35 µmmax. cell displacement ∆x 0.9µmmin. time resolution ∆t 10 sB : T cell ratio 0.4 : 0.6 [44, 146]influx of cells (B + T) 0.1–2 cells s−1 [44, 146]size of simulation area 600 µmnumber of FRC 2500ki 5 · 10−5 . . . 3 · 10−2 s−1 [67]kr 1 · 10−4 . . . 7 · 10−3 s−1 [67]Kd 0.2 . . . 5 nM [74,77, 147–149]kon 2.5 · 105 . . . 108M−1s−1 [148]koff 10−4 . . . 1 s−1 (from Kd and kon)Q 2.5 · 101 . . . 104 s−1 [150, 151]Rtot 104–105 [77, 87]
Table 1: The parameters used in the simulation of the PLF. The references given support the usedvalue. If no reference or comment, the parameter is a systemic model parameter chosen toget sufficient accuracy in the simulation.
19
A Estimating the life time of a signal for the negative regulation of FDC
generation
Solving the stationary diffusion equation with a decay term and a homogeneous spherical source f ofsize L (spherical coordinates with radius ρ)
0 = D
(
∂2c
∂ρ2+ 2ρ
∂c
∂ρ
)
− κc− f Θ(L− ρ) (6)
yields the solution
c =f
κΘ(L− ρ) +
f
κΘ(ρ− L)
[
L
ρcosh
ρ− L
l+
l
ρsinh
ρ− L
l
]
−f
κ
(
L
l+ 1
)
e−L/l
ρ/lsinh
ρ
l
(7)
with l =√
D/κ the typical length scale of the system. The negative regulation should set on aroundthe coordinate L where the source of the negative signal vanishes. The highest values at this borderwill be reached when L ≫ l. However, the PLF growth will stop as soon as this threshold is reachedsuch that the typical radius of the PLF will be in the order of a few l. For typical parameters ofthe diffusion coefficient of 10 . . . 100µm2s−1 the value for κ should be in the range of 10−3 . . . 10−2 s,i.e. the typical lifetime of the molecule mediating the negative regulation is in the order of minutes totens of minutes. The decay term may be just the uptake of the signal by the cells it is acting on orits enzymatic inactivation.
Acknowledgement
The ALTANA AG supports the Frankfurt Institute for Advanced Studies (FIAS).
References
[1] I. C. MacLennan (1994). Germinal centers. Annu. Rev. Immunol., 12:117–39.
[2] M. H. Kosco-Vilbois (2003). Are follicular dendritic cells really good for nothing? Nat. Rev. Im-munol., 3(9):764–9.
[3] L. Nicander, M. Halleraker, and T. Landsverk (1991). Ontogeny of reticular cells in the ilealPeyer’s patch of sheep and goats. Am. J. Anat., 191(3):237–49.
[4] P. J. Griebel and W. R. Hein (1996). Expanding the role of Peyer’s patches in B-cell ontogeny.Immunol. Today , 17(1):30–9.
[5] L. H. Makala, N. Suzuki, and H. Nagasawa (2002-2003). Peyer’s patches: organized lym-phoid structures for the induction of mucosal immune responses in the intestine. Pathobiology ,70(2):55–68.
20
[6] R. E. Mebius, P. Rennert, and I. L. Weissman (1997). Developing lymph nodes collectCD4+CD3- LTβ+ cells that can differentiate to APC, NK cells, and follicular cells but notT or B cells. Immunity , 7(4):493–504.
[7] S. Nishikawa, K. Honda, P. Vieira, and H. Yoshida (2003). Organogenesis of peripheral lymphoidorgans. Immunol. Rev., 195:72–80.
[8] D. Finke (2005). Fate and function of lymphoid tissue inducer cells. Curr. Opin. Immunol.,17(2):144–50.
[9] Y. X. Fu and D. D. Chaplin (1999). Development and maturation of secondary lymphoid tissues.Annu. Rev. Immunol., 17:399–433.
[10] G. Muller, U. E. Hopken, and M. Lipp (2003). The impact of CCR7 and CXCR5 on lymphoidorgan development and systemic immunity. Immunol. Rev., 195:117–35.
[11] A. V. Tumanov, S. I. Grivennikov, A. N. Shakhov, S. A. Rybtsov, E. P. Koroleva, J. Takeda,S. A. Nedospasov, and D. V. Kuprash (2003). Dissecting the role of lymphotoxin in lymphoidorgans by conditional targeting. Immunol Rev , 195:106–16.
[12] J. G. Cyster (2005). Chemokines, sphingosine-1-phosphate, and cell migration in secondarylymphoid organs. Annu. Rev. Immunol., 23:127–59.
[13] F. Mackay and J. L. Browning (1998). Turning off follicular dendritic cells. Nature,395(6697):26–7.
[14] K. M. Ansel, V. N. Ngo, P. L. Hyman, S. A. Luther, R. Forster, J. D. Sedgwick, J. L. Browning,M. Lipp, and J. G. Cyster (2000). A chemokine-driven positive feedback loop organizes lymphoidfollicles. Nature, 406(6793):309–14.
[15] P. Garside, E. Ingulli, R. R. Merica, J. G. Johnson, R. J. Noelle, and M. K. Jenkins (1998). Visu-alization of specific B and T lymphocyte interactions in the lymph node. Science, 281(5373):96–9.
[16] D. K. Bhalla, T. Murakami, and R. L. Owen (1981). Microcirculation of intestinal lymphoidfollicles in rat Peyer’s patches. Gastroenterology , 81(3):481–91.
[17] O. Ohtani, Y. Ohtani, C. J. Carati, and B. J. Gannon (2003). Fluid and cellular pathways of ratlymph nodes in relation to lymphatic labyrinths and Aquaporin-1 expression. Arch. Histol. Cy-tol., 66(3):261–72.
[18] M. Halleraker, C. M. Press, and T. Landsverk (1994). Development and cell phenotypes inprimary follicles of foetal sheep lymph nodes. Cell. Tissue Res., 275(1):51–62.
[19] E. F. Brachtel, M. Washiyama, G. D. Johnson, K. Tenner-Racz, P. Racz, and I. C. MacLennan(1996). Differences in the germinal centres of palatine tonsils and lymph nodes. Scand. J. Im-munol., 43(3):239–47.
21
[20] N. Kasajima-Akatsuka and K. Maeda (2006). Development, maturation and subsequent acti-vation of follicular dendritic cells (FDC): immunohistochemical observation of human fetal andadult lymph nodes. Histochem. Cell. Biol., pages 1–13.
[21] G. T. Belz (1998). Intercellular and lymphatic pathways associated with tonsils of the soft palatein young pigs. Anat. Embryol. (Berl), 197(4):331–40.
[22] P. Kumar and J. F. Timoney (2006). Histology, immunohistochemistry and ultrastructure ofthe tonsil of the soft palate of the horse. Anat. Histol. Embryol., 35(1):1–6.
[23] T. Beyer and M. Meyer-Hermann (2006). Modeling emergent tissue organization involving high-speed migrating cells in a flow equilibrium. submitted to Phys. Rev. E .
[24] G. Schaller and M. Meyer-Hermann (2004). Kinetic and dynamic Delaunay tetrahedralizationsin three dimensions. Comput. Phys. Commun., 162:9–23.
[25] G. Schaller and M. Meyer-Hermann (2005). Multicellular tumor spheroid in an off-latticevoronoi-delaunay cell model. Phys. Rev. E., 71(5 Pt 1):051910.
[26] T. Beyer, G. Schaller, A. Deutsch, and M. Meyer-Hermann (2005). Parallel dynamic and kineticregular triangulation in three dimensions. Comput. Phys. Commun., 172(2):86–108.
[27] S. H. Wei, H. Rosen, M. P. Matheu, M. G. Sanna, S. K. Wang, E. Jo, C. H. Wong, I. Parker, andM. D. Cahalan (2005). Sphingosine 1-phosphate type 1 receptor agonism inhibits transendothe-lial migration of medullary T cells to lymphatic sinuses. Nat. Immunol., 6(12):1228–35.
[28] C. K. Drinker, G. B. Wislocki, and M. E. Field (1933). The structure of the sinuses in the lymphnodes. Anat. Rec., 56(3):261–273.
[29] W. van Ewijk and T. H. van der Kwast (1980). Migration of B lymphocytes in lymphoid organsof lethally irradiated, thymocyte-reconstituted mice. Cell. Tissue Res., 212(3):497–508.
[30] O. Ohtani, A. Ohtsuka, and R. L. Owen (1986). Three-dimensional organization of the lymphat-ics in the rabbit appendix. A scanning electron and light microscopic study. Gastroenterology ,91(4):947–55.
[31] O. Ohtani, A. Kikuta, A. Ohtsuka, and T. Murakami (1991). Organization of the reticularnetwork of rabbit Peyer’s patches. Anat. Rec., 229(2):251–8.
[32] C. Belisle and G. Sainte-Marie (1990). Blood vascular network of the rat lymph node: tridimen-sional studies by light and scanning electron microscopy. Am. J. Anat., 189(2):111–26.
[33] T. C. Pellas and L. Weiss (1990). Deep splenic lymphatic vessels in the mouse: a route of splenicexit for recirculating lymphocytes. Am. J. Anat., 187(4):347–54.
[34] G. T. Belz and T. J. Heath (1995). Intercellular and lymphatic pathways of the canine palatinetonsils. J. Anat., 187 (Pt1):93–105.
22
[35] G. Azzali and M. L. Arcari (2000). Ultrastructural and three dimensional aspects of the lym-phatic vessels of the absorbing peripheral lymphatic apparatus in Peyer’s patches of the rabbit.Anat. Rec., 258(1):71–9.
[36] G. Azzali, M. Vitale, and M. L. Arcari (2002). Ultrastructure of absorbing peripheral lymphaticvessel (ALPA) in guinea pig Peyer’s patches. Microvasc. Res., 64(2):289–301.
[37] G. Azzali (2003). Structure, lymphatic vascularization and lymphocyte migration in mucosa-associated lymphoid tissue. Immunol. Rev., 195:178–89.
[38] S. Ekino, K. Matsuno, and M. Kotani (1979). Distribution and role of lymph vessels of the bursaFabricii. Lymphology , 12(4):247–52.
[39] H. Irjala, E. L. Johansson, R. Grenman, K. Alanen, M. Salmi, and S. Jalkanen (2001). Man-nose receptor is a novel ligand for L-selectin and mediates lymphocyte binding to lymphaticendothelium. J. Exp. Med., 194(8):1033–42.
[40] M. Matloubian, C. G. Lo, G. Cinamon, M. J. Lesneski, Y. Xu, V. Brinkmann, M. L. Allende,R. L. Proia, and J. G. Cyster (2004). Lymphocyte egress from thymus and peripheral lymphoidorgans is dependent on S1P receptor 1. Nature, 427(6972):355–60.
[41] F. Sallusto and C. R. Mackay (2004). Chemoattractants and their receptors in homeostasis andinflammation. Curr. Opin. Immunol., 16(6):724–31.
[42] C. G. Lo, Y. Xu, R. L. Proia, and J. G. Cyster (2005). Cyclical modulation of sphingosine-1-phosphate receptor 1 surface expression during lymphocyte recirculation and relationship tolymphoid organ transit. J. Exp. Med., 201(2):291–301.
[43] T. C. Pellas and L. Weiss (1990). Migration pathways of recirculating murine B cells and CD4+and CD8+ T lymphocytes. Am. J. Anat., 187(4):355–73.
[44] A. J. Young (1999). The physiology of lymphocyte migration through the single lymph node invivo. Semin. Immunol., 11(2):73–83.
[45] W. Srikusalanukul, F. De Bruyne, and P. McCullagh (2002). An application of linear out-put error modelling for studying lymphocyte migration in peripheral lymphoid tissues. Aus-tralas. Phys. Eng. Sci. Med., 25(3):132–8.
[46] E. Crivellato and F. Mallardi (1997). Stromal cell organisation in the mouse lymph node. Alight and electron microscopic investigation using the zinc iodide-osmium technique. J. Anat.,190 ( Pt 1):85–92.
[47] E. P. Kaldjian, J. E. Gretz, A. O. Anderson, Y. Shi, and S. Shaw (2001). Spatial and molecularorganization of lymph node T cell cortex: a labyrinthine cavity bounded by an epithelium-like monolayer of fibroblastic reticular cells anchored to basement membrane-like extracellularmatrix. Int. Immunol., 13(10):1243–53.
23
[48] M. A. Nolte, J. A. Belien, I. Schadee-Eestermans, W. Jansen, W. W. Unger, N. van Rooijen,G. Kraal, and R. E. Mebius (2003). A conduit system distributes chemokines and small blood-borne molecules through the splenic white pulp. J. Exp. Med., 198(3):505–12.
[49] P. Balogh, G. Horvath, and A. K. Szakal (2004). Immunoarchitecture of distinct reticularfibroblastic domains in the white pulp of mouse spleen. J. Histochem. Cytochem., 52(10):1287–98.
[50] K. van Nierop and C. de Groot (2002). Human follicular dendritic cells: function, origin anddevelopment. Semin. Immunol., 14(4):251–7.
[51] M. Bofill, A. N. Akbar, and P. L. Amlot (2000). Follicular dendritic cells share a membrane-bound protein with fibroblasts. J. Pathol., 191(2):217–26.
[52] A. K. Szakal, R. L. Gieringer, M. H. Kosco, and J. G. Tew (1985). Isolated follicular dendriticcells: cytochemical antigen localization, Nomarski, SEM, and TEM morphology. J. Immunol.,134(3):1349–59.
[53] E. A. Clark, K. H. Grabstein, and G. L. Shu (1992). Cultured human follicular dendritic cells.Growth characteristics and interactions with B lymphocytes. J. Immunol., 148(11):3327–35.
[54] K. C. Chang, X. Huang, L. J. Medeiros, and D. Jones (2003). Germinal centre-like versusundifferentiated stromal immunophenotypes in follicular lymphoma. J. Pathol., 201(3):404–12.
[55] R. Tsunoda, A. Bosseloir, K. Onozaki, E. Heinen, K. Miyake, H. Okamura, K. Suzuki, T. Fujita,L. J. Simar, and N. Sugai (1997). Human follicular dendritic cells in vitro and follicular dendritic-cell-like cells. Cell Tissue Res., 288(2):381–9.
[56] J. G. Cyster, K. M. Ansel, K. Reif, E. H. Ekland, P. L. Hyman, H. L. Tang, S. A. Luther, andV. N. Ngo (2000). Follicular stromal cells and lymphocyte homing to follicles. Immunol. Rev.,176:181–93.
[57] Z. F. Kapasi, D. Qin, W. G. Kerr, M. H. Kosco-Vilbois, L. D. Shultz, J. G. Tew, and A. K. Szakal(1998). Follicular dendritic cell (FDC) precursors in primary lymphoid tissues. J. Immunol.,160(3):1078–84.
[58] D. V. Kuprash, A. V. Tumanov, D. J. Liepinsh, E. P. Koroleva, M. S. Drutskaya, A. A. Kruglov,A. N. Shakhov, E. Southon, W. J. Murphy, L. Tessarollo, S. I. Grivennikov, and S. A. Nedospasov(2005). Novel tumor necrosis factor-knockout mice that lack Peyer’s patches. Eur. J. Immunol.,35(5):1592–600.
[59] M. Pasparakis, S. Kousteni, J. Peschon, and G. Kollias (2000). Tumor necrosis factor and thep55TNF receptor are required for optimal development of the marginal sinus and for migrationof follicular dendritic cell precursors into splenic follicles. Cell. Immunol., 201(1):33–41.
[60] S. Lee, K. Choi, H. Ahn, K. Song, J. Choe, and I. Lee (2005). Tuj1 (class III beta-tubulin) expres-sion suggests dynamic redistribution of follicular dendritic cells in lymphoid tissue. Eur. J. CellBiol., 84(2-3):453–9.
24
[61] E. Crivellato, A. Vacca, and D. Ribatti (2004). Setting the stage: an anatomist’s view of theimmune system. Trends Immunol., 25(4):210–7.
[62] Y. Wang, J. Wang, Y. Sun, Q. Wu, and Y. X. Fu (2001). Complementary effects of TNF andlymphotoxin on the formation of germinal center and follicular dendritic cells. J. Immunol.,166(1):330–7.
[63] M. A. Chaplain (2000). Mathematical modelling of angiogenesis. J. Neurooncol., 50(1-2):37–51.
[64] M. Chaplain and A. Anderson (2004). Mathematical modelling of tumour-induced angiogenesis:network growth and structure. Cancer Treat. Res., 117:51–75.
[65] R. M. Merks, S. V. Brodsky, M. S. Goligorksy, S. A. Newman, and J. A. Glazier (2006). Cellelongation is key to in silico replication of in vitro vasculogenesis and subsequent remodeling.Dev. Biol., 289(1):44–54.
[66] P. Namy, J. Ohayon, and P. Tracqui (2004). Critical conditions for pattern formation and invitro tubulogenesis driven by cellular traction fields. J. Theor. Biol., 227(1):103–20.
[67] N. F. Neel, E. Schutyser, J. Sai, G. H. Fan, and A. Richmond (2005). Chemokine receptorinternalization and intracellular trafficking. Cytokine Growth Factor Rev., 16(6):637–58.
[68] E. D. Tomhave, R. M. Richardson, J. R. Didsbury, L. Menard, R. Snyderman, and H. Ali (1994).Cross-desensitization of receptors for peptide chemoattractants. Characterization of a new formof leukocyte regulation. J. Immunol., 153(7):3267–75.
[69] H. Arai, F. S. Monteclaro, C. L. Tsou, C. Franci, and I. F. Charo (1997). Dissociation ofchemotaxis from agonist-induced receptor internalization in a lymphocyte cell line transfectedwith CCR2B. Evidence that directed migration does not require rapid modulation of signalingat the receptor level. J. Biol. Chem., 272(40):25037–42.
[70] G. Bardi, M. Lipp, M. Baggiolini, and P. Loetscher (2001). The T cell chemokine receptor CCR7is internalized on stimulation with ELC, but not with SLC. Eur. J. Immunol., 31(11):3291–7.
[71] B. Moser, M. Wolf, A. Walz, and P. Loetscher (2004). Chemokines: multiple levels of leukocytemigration control. Trends Immunol., 25(2):75–84.
[72] M. P. Roy, C. H. Kim, and E. C. Butcher (2002). Cytokine control of memory B cell homingmachinery. J. Immunol., 169(4):1676–82.
[73] M. Casamayor-Palleja, P. Mondiere, C. Verschelde, C. Bella, and T. Defrance (2002). BCRligation reprograms B cells for migration to the T zone and B-cell follicle sequentially. Blood ,99(6):1913–21.
[74] R. Yoshida, M. Nagira, M. Kitaura, N. Imagawa, T. Imai, and O. Yoshie (1998). Sec-ondary lymphoid-tissue chemokine is a functional ligand for the CC chemokine receptor CCR7.J. Biol. Chem., 273(12):7118–22.
25
[75] S. H. Wei, I. Parker, M. J. Miller, and M. D. Cahalan (2003). A stochastic view of lymphocytemotility and trafficking within the lymph node. Immunol. Rev., 195:136–59.
[76] C. H. Kim, L. M. Pelus, J. R. White, E. Applebaum, K. Johanson, and H. E. Broxmeyer(1998). CKβ-11/macrophage inflammatory protein-3β/EBI1-ligand chemokine is an efficaciouschemoattractant for T and B cells. J. Immunol., 160(5):2418–24.
[77] K. Willimann, D. F. Legler, M. Loetscher, R. S. Roos, M. B. Delgado, I. Clark-Lewis, M. Bag-giolini, and B. Moser (1998). The chemokine SLC is expressed in T cell areas of lymph nodesand mucosal lymphoid tissues and attracts activated T cells via CCR7. Eur. J. Immunol.,28(6):2025–34.
[78] E. F. Foxman, E. J. Kunkel, and E. C. Butcher (1999). Integrating conflicting chemotacticsignals. The role of memory in leukocyte navigation. J. Cell. Biol., 147(3):577–88.
[79] B. Heit, S. Tavener, E. Raharjo, and P. Kubes (2002). An intracellular signaling hierarchydetermines direction of migration in opposing chemotactic gradients. J. Cell. Biol., 159(1):91–102.
[80] D. Breitfeld, L. Ohl, E. Kremmer, J. Ellwart, F. Sallusto, M. Lipp, and R. Forster (2000).Follicular B helper T cells express CXC chemokine receptor 5, localize to B cell follicles, andsupport immunoglobulin production. J. Exp. Med., 192(11):1545–52.
[81] K. Reif, E. H. Ekland, L. Ohl, H. Nakano, M. Lipp, R. Forster, and J. G. Cyster (2002).Balanced responsiveness to chemoattractants from adjacent zones determines B-cell position.Nature, 416(6876):94–9.
[82] T. Okada, M. J. Miller, I. Parker, M. F. Krummel, M. Neighbors, S. B. Hartley, A. O’Garra,M. D. Cahalan, and J. G. Cyster (2005). Antigen-engaged B cells undergo chemotaxis towardthe T zone and form motile conjugates with helper T cells. PLoS. Biol., 3(6):e150.
[83] K. M. Ansel, L. J. McHeyzer-Williams, V. N. Ngo, M. G. McHeyzer-Williams, and J. G. Cyster(1999). In vivo-activated CD4 T cells upregulate CXC chemokine receptor 5 and reprogramtheir response to lymphoid chemokines. J. Exp. Med., 190(8):1123–34.
[84] S. Fillatreau and D. Gray (2003). T cell accumulation in B cell follicles is regulated by dendriticcells and is independent of B cell activation. J. Exp. Med., 197(2):195–206.
[85] M. J. Miller, S. H. Wei, I. Parker, and M. D. Cahalan (2002). Two-photon imaging of lymphocytemotility and antigen response in intact lymph node. Science, 296(5574):1869–73.
[86] M. J. Miller, S. H. Wei, M. D. Cahalan, and I. Parker (2003). Autonomous T cell traffick-ing examined in vivo with intravital two-photon microscopy. Proc. Natl. Acad. Sci. U.S.A.,100(5):2604–9.
[87] T. Okada, V. N. Ngo, E. H. Ekland, R. Forster, M. Lipp, D. R. Littman, and J. G. Cyster (2002).Chemokine requirements for B cell entry to lymph nodes and Peyer’s patches. J. Exp. Med.,196(1):65–75.
26
[88] J. Rangel-Moreno, J. Moyron-Quiroz, K. Kusser, L. Hartson, H. Nakano, and T. D. Randall(2005). Role of CXC chemokine ligand 13, CC chemokine ligand (CCL) 19, and CCL21 in theorganization and function of nasal-associated lymphoid tissue. J. Immunol., 175(8):4904–13.
[89] S. A. Luther, A. Bidgol, D. C. Hargreaves, A. Schmidt, Y. Xu, J. Paniyadi, M. Matloubian,and J. G. Cyster (2002). Differing activities of homeostatic chemokines CCL19, CCL21, andCXCL12 in lymphocyte and dendritic cell recruitment and lymphoid neogenesis. J. Immunol.,169(1):424–33.
[90] D. F. Legler, M. Loetscher, R. S. Roos, I. Clark-Lewis, M. Baggiolini, and B. Moser (1998). Bcell-attracting chemokine 1, a human CXC chemokine expressed in lymphoid tissues, selectivelyattracts B lymphocytes via BLR1/CXCR5. J. Exp. Med., 187(4):655–60.
[91] M. D. Gunn, V. N. Ngo, K. M. Ansel, E. H. Ekland, J. G. Cyster, and L. T. Williams (1998). AB-cell-homing chemokine made in lymphoid follicles activates Burkitt’s lymphoma receptor-1.Nature, 391(6669):799–803.
[92] J. L. Gommerman, F. Mackay, E. Donskoy, W. Meier, P. Martin, and J. L. Browning (2002).Manipulation of lymphoid microenvironments in nonhuman primates by an inhibitor of thelymphotoxin pathway. J. Clin. Invest., 110(9):1359–69.
[93] C. Huber, C. Thielen, H. Seeger, P. Schwarz, F. Montrasio, M. R. Wilson, E. Heinen, Y. X. Fu,G. Miele, and A. Aguzzi (2005). Lymphotoxin-beta receptor-dependent genes in lymph nodeand follicular dendritic cell transcriptomes. J. Immunol., 174(9):5526–36.
[94] A. Ohtsuka, A. J. Piazza, T. H. Ermak, and R. L. Owen (1992). Correlation of extracellu-lar matrix components with the cytoarchitecture of mouse Peyer’s patches. Cell Tissue Res.,269(3):403–10.
[95] E. Castanos-Velez, P. Biberfeld, and M. Patarroyo (1995). Extracellular matrix proteins andintegrin receptors in reactive and non-reactive lymph nodes. Immunology , 86(2):270–8.
[96] T. Ushiki, O. Ohtani, and K. Abe (1995). Scanning electron microscopic studies of reticularframework in the rat mesenteric lymph node. Anat. Rec., 241(1):113–22.
[97] T. Katakai, T. Hara, M. Sugai, H. Gonda, and A. Shimizu (2004). Lymph node fibroblasticreticular cells construct the stromal reticulum via contact with lymphocytes. J. Exp. Med.,200(6):783–95.
[98] T. Satoh, R. Takeda, H. Oikawa, and R. Satodate (1997). Immunohistochemical and structuralcharacteristics of the reticular framework of the white pulp and marginal zone in the humanspleen. Anat. Rec., 249(4):486–94.
[99] K. A. Liakka and H. I. Autio-Harmainen (1992). Distribution of the extracellular matrix proteinstenascin, fibronectin, and vitronectin in fetal, infant, and adult human spleens. J. Histochem. Cy-tochem., 40(8):1203–10.
27
[100] M. Maatta, S. Salo, K. Tasanen, Y. Soini, A. Liakka, L. Bruckner-Tuderman, and H. Autio-Harmainen (2004). Distribution of basement membrane anchoring molecules in normal andtransformed endometrium: altered expression of laminin gamma2 chain and collagen type XVIIin endometrial adenocarcinomas. J. Mol. Histol., 35(8-9):715–22.
[101] A. Braun, S. Takemura, A. N. Vallejo, J. J. Goronzy, and C. M. Weyand (2004). Lympho-toxin beta-mediated stimulation of synoviocytes in rheumatoid arthritis. Arthritis Rheum.,50(7):2140–50.
[102] D. Kerjaschki (2005). The crucial role of macrophages in lymphangiogenesis. J. Clin. Invest.,115(9):2316–9.
[103] P. Hamrah, L. Chen, Q. Zhang, and M. R. Dana (2003). Novel expression of vascular endothelialgrowth factor receptor (VEGFR)-3 and VEGF-c on corneal dendritic cells. Am. J. Pathol.,163(1):57–68.
[104] A. B. Aurora, P. Baluk, D. Zhang, S. S. Sidhu, G. M. Dolganov, C. Basbaum, D. M. McDonald,and N. Killeen (2005). Immune complex-dependent remodeling of the airway vasculature inresponse to a chronic bacterial infection. J. Immunol., 175(10):6319–26.
[105] A. Ruddell, P. Mezquita, K. A. Brandvold, A. Farr, and B. M. Iritani (2003). B lymphocyte-specific c-Myc expression stimulates early and functional expansion of the vasculature and lym-phatics during lymphomagenesis. Am. J. Pathol., 163(6):2233–45.
[106] M. Frater-Schroder, W. Risau, R. Hallmann, P. Gautschi, and P. Bohlen (1987). Tumor necro-sis factor type α, a potent inhibitor of endothelial cell growth in vitro, is angiogenic in vivo.Proc. Natl. Acad. Sci. U.S.A., 84(15):5277–81.
[107] A. Corcione, L. Ottonello, G. Tortolina, P. Tasso, F. Ghiotto, I. Airoldi, G. Taborelli,F. Malavasi, F. Dallegri, and V. Pistoia (1997). Recombinant tumor necrosis factor enhancesthe locomotion of memory and naive B lymphocytes from human tonsils through the selectiveengagement of the type II receptor. Blood , 90(11):4493–501.
[108] C. Patterson, M. A. Perrella, W. O. Endege, M. Yoshizumi, M. E. Lee, and E. Haber (1996).Downregulation of vascular endothelial growth factor receptors by tumor necrosis factor-alphain cultured human vascular endothelial cells. J. Clin. Invest., 98(2):490–6.
[109] H. Yoshida, K. Honda, R. Shinkura, S. Adachi, S. Nishikawa, K. Maki, K. Ikuta, and S. I.Nishikawa (1999). IL-7 receptor α+ CD3(-) cells in the embryonic intestine induces the orga-nizing center of Peyer’s patches. Int. Immunol., 11(5):643–55.
[110] H. Hashi, H. Yoshida, K. Honda, S. Fraser, H. Kubo, M. Awane, A. Takabayashi, H. Nakano,Y. Yamaoka, and S. Nishikawa (2001). Compartmentalization of Peyer’s patch anlagen beforelymphocyte entry. J. Immunol., 166(6):3702–9.
[111] D. Kim, R. E. Mebius, J. D. MacMicking, S. Jung, T. Cupedo, Y. Castellanos, J. Rho, B. R.Wong, R. Josien, N. Kim, P. D. Rennert, and Y. Choi (2000). Regulation of peripheral lymphnode genesis by the tumor necrosis factor family member TRANCE. J. Exp. Med., 192(10):1467–78.
28
[112] T. Cupedo, M. F. Vondenhoff, E. J. Heeregrave, A. E. De Weerd, W. Jansen, D. G. Jack-son, G. Kraal, and R. E. Mebius (2004). Presumptive lymph node organizers are differentiallyrepresented in developing mesenteric and peripheral nodes. J. Immunol., 173(5):2968–75.
[113] P. Balogh, Y. Aydar, J. G. Tew, and A. K. Szakal (2001). Ontogeny of the follicular dendriticcell phenotype and function in the postnatal murine spleen. Cell. Immunol., 214(1):45–53.
[114] Y. X. Fu, H. Molina, M. Matsumoto, G. Huang, J. Min, and D. D. Chaplin (1997). Lymphotoxin-alpha (LTalpha) supports development of splenic follicular structure that is required for IgGresponses. J. Exp. Med., 185(12):2111–20.
[115] Y. X. Fu, G. Huang, Y. Wang, and D. D. Chaplin (1998). B lymphocytes induce the forma-tion of follicular dendritic cell clusters in a lymphotoxin α-dependent fashion. J. Exp. Med.,187(7):1009–18.
[116] G. M. Odell, G. Oster, P. Alberch, and B. Burnside (1981). The mechanical basis of morpho-genesis. I. Epithelial folding and invagination. Dev. Biol., 85(2):446–62.
[117] E. Palsson and H. G. Othmer (2000). A model for individual and collective cell movement inDictyostelium discoideum. Proc. Natl. Acad. Sci. U.S.A., 97(19):10448–53.
[118] J. C. Dallon and H. G. Othmer (2004). How cellular movement determines the collective forcegenerated by the Dictyostelium discoideum slug. J. Theor. Biol., 231(2):203–22.
[119] D. Drasdo, R. Kree, and J. S. McCaskill (1995). Monte carlo approach to tissue-cell populations.Phys. Rev. E , 52(6):6635–57.
[120] D. Drasdo, S. D. S. Hohme, and A. Deutsch (2004). Cell-based models of avascular tumorgrowth., pages 367–378. Birkhauser, Basel.
[121] H. Honda, M. Tanemura, and T. Nagai (2004). A three-dimensional vertex dynamics cell model ofspace-filling polyhedra simulating cell behavior in a cell aggregate. J. Theor. Biol., 226(4):439–53.
[122] M. Gunzer, C. Weishaupt, A. Hillmer, Y. Basoglu, P. Friedl, K. E. Dittmar, W. Kolanus,G. Varga, and S. Grabbe (2004). A spectrum of biophysical interaction modes between Tcells and different antigen-presenting cells during priming in 3-D collagen and in vivo. Blood ,104(9):2801–9.
[123] M. E. Meyer-Hermann and P. K. Maini (2005). Interpreting two-photon imaging data of lym-phocyte motility. Phys. Rev. E , 71(6 Pt 1):061912.
[124] E. Albrecht and H. R. Petty (1998). Cellular memory: neutrophil orientation reverses dur-ing temporally decreasing chemoattractant concentrations. Proc. Natl. Acad. Sci. U.S.A.,95(9):5039–44.
[125] M. U. Ehrengruber, D. A. Deranleau, and T. D. Coates (1996). Shape oscillations of human neu-trophil leukocytes: characterization and relationship to cell motility. J. Exp. Biol., 199(4):741–7.
29
[126] F. A. Meineke, C. S. Potten, and M. Loeffler (2001). Cell migration and organization in theintestinal crypt using a lattice-free model. Cell Prolif., 34(4):253–66.
[127] K. Johnson, K. Kendall, and A. Roberts (1971). Surface energy and the contact of elastic solids.Proc. R. Soc. London A, 324(1558):303–13.
[128] S. Schnell and T. E. Turner (2004). Reaction kinetics in intracellular environments with macro-molecular crowding: simulations and rate laws. Prog. Biophys. Mol. Biol., 85(2-3):235–60.
[129] C. B. Thompson, I. Scher, M. E. Schaefer, T. Lindsten, F. D. Finkelman, and J. J. Mond (1984).Size-dependent B lymphocyte subpopulations: relationship of cell volume to surface phenotype,cell cycle, proliferative response, and requirements for antibody production to TNP-Ficoll andTNP-BA. J. Immunol., 133(5):2333–42.
[130] M. Bornens, M. Paintrand, and C. Celati (1989). The cortical microfilament system of lym-phoblasts displays a periodic oscillatory activity in the absence of microtubules: implications forcell polarity. J. Cell Biol., 109(3):1071–83.
[131] W. S. Haston and J. M. Shields (1984). Contraction waves in lymphocyte locomotion. J. CellSci., 68:227–41.
[132] A. R. Bausch, F. Ziemann, A. A. Boulbitch, K. Jacobson, and E. Sackmann (1998). Local mea-surements of viscoelastic parameters of adherent cell surfaces by magnetic bead microrheometry.Biophys. J., 75(4):2038–49.
[133] A. R. Bausch, W. Moller, and E. Sackmann (1999). Measurement of local viscoelasticity andforces in living cells by magnetic tweezers. Biophys. J., 76(1 Pt 1):573–9.
[134] G. Forgacs, R. A. Foty, Y. Shafrir, and M. S. Steinberg (1998). Viscoelastic properties of livingembryonic tissues: a quantitative study. Biophys. J., 74(5):2227–34.
[135] Y. S. Chu, S. Dufour, J. P. Thiery, E. Perez, and F. Pincet (2005). Johnson-Kendall-Robertstheory applied to living cells. Phys. Rev. Lett., 94(2):028102.
[136] A. J. Maniotis, C. S. Chen, and D. E. Ingber (1997). Demonstration of mechanical connec-tions between integrins, cytoskeletal filaments, and nucleoplasm that stabilize nuclear structure.Proc. Natl. Acad. Sci. U.S.A., 94(3):849–54.
[137] A. Hategan, R. Law, S. Kahn, and D. E. Discher (2003). Adhesively-tensed cell membranes:lysis kinetics and atomic force microscopy probing. Biophys. J., 85(4):2746–59.
[138] V. T. Moy, Y. Jiao, T. Hillmann, H. Lehmann, and T. Sano (1999). Adhesion energy of receptor-mediated interaction measured by elastic deformation. Biophys. J., 76(3):1632–8.
[139] C. Verdier (2003). Rheological properties of living materials. From cells to tissues. J. Theo. Med.,5(2):67–91.
[140] N. Q. Balaban, U. S. Schwarz, D. Riveline, P. Goichberg, G. Tzur, I. Sabanay, D. Mahalu,S. Safran, A. Bershadsky, L. Addadi, and B. Geiger (2001). Force and focal adhesion assembly:a close relationship studied using elastic micropatterned substrates. Nature Cell Biol., 3:466–472.
30
[141] K. Burton, J. H. Park, and D. L. Taylor (1999). Keratocytes generate traction forces in twophases. Mol. Biol. Cell , 10(11):3745–69.
[142] U. S. Schwarz, N. Q. Balaban, D. Riveline, A. Bershadsky, B. Geiger, and S. A. Safran (2002).Calculation of forces at focal adhesions from elastic substrate data: the effect of localized forceand the need for regularization. Biophys. J., 83(3):1380–94.
[143] C. G. Galbraith and M. P. Sheetz (1999). Keratocytes pull with similar forces on their dorsaland ventral surfaces. J. Cell. Biol., 147(6):1313–24.
[144] D. A. Lauffenburger and A. F. Horwitz (1996). Cell migration: a physically integrated molecularprocess. Cell , 84(3):359–69.
[145] G. J. Randolph, V. Angeli, and M. A. Swartz (2005). Dendritic-cell trafficking to lymph nodesthrough lymphatic vessels. Nat. Rev. Immunol., 5(8):617–28.
[146] R. Sacca, C. A. Cuff, W. Lesslauer, and N. H. Ruddle (1998). Differential activities of secretedlymphotoxin-alpha3 and membrane lymphotoxin-alpha1beta2 in lymphotoxin-induced inflam-mation: critical role of TNF receptor 1 signaling. J. Immunol., 160(1):485–91.
[147] F. Lin, C. M. Nguyen, S. J. Wang, W. Saadi, S. P. Gross, and N. L. Jeon (2004). Effec-tive neutrophil chemotaxis is strongly influenced by mean IL-8 concentration. Biochem. Bio-phys. Res. Commun., 319(2):576–81.
[148] A. J. Pelletier, L. J. van der Laan, P. Hildbrand, M. A. Siani, D. A. Thompson, P. E. Dawson,B. E. Torbett, and D. R. Salomon (2000). Presentation of chemokine SDF-1 alpha by fibronectinmediates directed migration of T cells. Blood , 96(8):2682–90.
[149] H. Slimani, N. Charnaux, E. Mbemba, L. Saffar, R. Vassy, C. Vita, and L. Gattegno (2003).Binding of the CC-chemokine RANTES to syndecan-1 and syndecan-4 expressed on HeLa cells.Glycobiology , 13(9):623–34.
[150] J. L. Vissers, F. C. Hartgers, E. Lindhout, C. G. Figdor, and G. J. Adema (2001). BLC(CXCL13) is expressed by different dendritic cell subsets in vitro and in vivo. Eur. J. Immunol.,31(5):1544–9.
[151] W.-S. Hu. Stoichiometry and kinetics of cell growth and product formation.URL http://hugroup.cems.umn.edu/Cell_Technology/cd-rom/Stoichiometry%20and%20Kinetics/Stoichiometry%20and%20Cell%20Kinetics.pdf
31


![Direct Organogenesis from Cotyledonary Node Explants of ... · shoot organogenesis in C. peporeported [19] direct organogenesis in Cucumis sativus [20] and reported L. cy-lindrica](https://img.pdfslide.us/doc/110x75/5fac27dc76c37d66627b9b5d/direct-organogenesis-from-cotyledonary-node-explants-of-shoot-organogenesis.jpg)