Embed Size (px)
Citation preview
Mechanisms of invasion and metastasis in colorectal cancer
Xabier García de Albéniz
Aquesta tesi doctoral està subjecta a la llicència Reconeixement 3.0. Espanya de Creative Commons. Esta tesis doctoral está sujeta a la licencia Reconocimiento 3.0. España de Creative Commons. This doctoral thesis is licensed under the Creative Commons Attribution 3.0. Spain License.
Mechanisms of invasion and
metastasis in colorectal cancer
Xabier Garcıa de Albeniz
Institut Clınic de Malalties Hematologiques i Oncologiques. Oncologıa Medica.
Institut de Recerca Biomedica de Barcelona.
Universitat de Barcelona
Tesi presentada per optar al grau de
Doctor en Medicina
Abril 2015

Tesi dirigida per el Dr. Roger Gomis i el Dr. Antoni Castells
ii
Abstract
The metastatic pattern of advanced CRC is somehow homogeneous. Liver
is the most frequently affected organ, followed by the lung, peritoneum and
bone. We studied the mechanisms driving the metastatic spread in CRC,
focusing in the MAPK pathway. We developed in vivo a highly metastatic
cell line using a KRAS-mutated cell line (SW620) in an ortothopic xenograft
mouse model and used both in vivo and in vitro experiments to evaluate the
mechanisms of metastasis. We also used data from two large prospective
cohorts of incident CRC to evaluate the association of an intronic variant
of SMAD7 (rs4939827, 18q21) with the phenotype and molecular charac-
terisitics of CRC. This variant is associated with a lower risk of developing
CRC (odds ratio of 0.88, 95% confidence interval [CI] 0.85 - 0.93) and a
poorer survival after diagnosis (hazards ratio of 1.16, 95% CI 1.06-1.27).
In the first project, where we evaluated the mechanisms of metastasis, we
introduced in the SW620 cell line an expression vector for luciferase, which
allowed us to monitor the kinetics of emergence of liver metastatic lesions
by quantitative bioluminescence imaging. The SW620 luciferase-expressing
cells were inoculated into portal circulation of immunodeficient mice via
intrasplenic injection followed by splenectomy, in order to isolate cell pop-
ulations that target the liver. Second, the SW620-derived liver metastases
were expanded in culture and the resulting population (Liver Metastatic
derivative, LiM1) was subjected to a second round of in vivo selection, pro-
ducing the LiM2 cell population that showed a significant increase in liver
and lung metastatic activity. Comparative transcriptomic analysis identi-
fied 194 genes differentially expressed between the parental and the highly
metastatic cell line. This colon cancer metastatic gene set was contrasted
against a cohort of 267 patients with stage I-III CRC and we investigated
the signaling pathways regulating the expression of a set of genes with in-
creased metastatic capacity. We found pathways of nitrogen metabolism,
cell adhesion molecules and mitogen-activated protein kinases (MAPKs).
We focused on the MAPKs given the KRAS -mutated status of our cell line
(and because patients harboring certain mutations in KRAS/BRAF have
fewer therapeutic options that patients without them), finding that the ac-
tivating phosphorylation of ERK1/ERK2 was increased, the p38 MAPKs
was reduced and the phosphorylation of JNKs did not change. Downregula-
tion of ERK2 (but not of ERK1) in the highly metastatic cell line reverted
its metastatic capacity to the liver, but not to the lung in our mice model.
We thus hypothesized that the ability to metastasize the lung by the highly
metastatic derivative had to be driven by other mechanism.
The analysis of clinical samples evidenced that tumor biopsies with low
phospho-38 MAPK were associated with metastasis to the lung but not to
other organs. Treating mice harboring liver metastasis from the parental
cell line with a p38 MAPK specific inhibitor produced an increase in the
percentage of mice with lung metastasis. We validated this finding with a
different cell line and different experimental setting. Conversely, activation
of the p38 MAPK pathway by expression of MKK6EE (MKK6 is a MAP
kinase-kinase that phosphorylates and activates p38 MAP kinase) dimin-
ished the lung metastatic capacity of the HCT116 cell line.
The expression of parathyroid hormone-like hormone (PTHLH ) was up-
regulated (3.3 fold) in our highly metastatic derivative and was inversely
correlated with the expression of MKK6 in CRC primary tumors. Downreg-
ulation of PHTLH in the highly metastatic derivative decreased its capacity
to colonize the lung without decreasing its capacity to colonize the liver af-
ter intra portal inoculation. Interestingly, tail vein (draining directly to
the lungs) injections of the highly metastatic derivative did not yield any
lung metastasis and silencing PHTLH in LiM2 cells did not affect its growth
when injected directly into the lung. This suggested that the role of PTHLH
in regulating lung metastasis did not depended on growth promotion but
more probably on extravasation. This was supported by an experiment
where we injected in the tail vein LiM2 cells overexpressing or not PTHLH:
mice injected with LiM2 cells overexpressing PTHLH presented a five-fold
increase in the number of cells extravasated in the lungs. We finally ev-
idenced that PTHLH induced apoptosis of human pulmonary endothelial
cells (HPEC) by increasing Ca+ levels that in turn induces mobilization of
the apoptosis-inducing factor mitochondrion-associated 1 (AIFM1), from
the mitochondria to the cytosol, a caspase-independent cell death mecha-
nism. This disrupts the lung vasculature increasing the permeability of the
lung to metastatic cells.
In the second project, where we evaluate the association of the SMAD7
intronic variant with tumor phenotype and several CRC molecular char-
acteristics, we used 1509 CRC cases and 2307 age-matched controls nested
within the Nurses Health Study (NHS) and the Health Professionals Follow-
up Study (HPFS). NHS and HPFS are cohorts of healthy individuals that
record information biennially, with a follow-up greater than 90%. Samples
for DNA extraction (blood or buccal cell specimens) from both cohorts were
obtained in more than 90,000 individuals. Information on CRC is extracted
from medical records from participants who reported CRC in the bien-
nial questionnaires. We randomly selected between one and three controls
(matched on ethnicity, year of birth and month/year of sampling) within
the same cohort from participants who were free of CRC at the same time
the CRC was diagnosed in the cases.
Among the 1509 cases with blood or buccal samples in this study, we were
able to successfully obtain tissue suitable for molecular analyses in 658 cases.
We genotyped rs4939827 (TaqMan R©) successfully in 98% of the samples in
NHS and 99.6% of the samples in HPFS. The phenotipic features evalu-
ated were: TNM stage, grade of differentiation, location of the primary
tumor (colon vs. rectum) and age at diagnosis. The evaluated molecular
characteristics were DNA methylation of RUNX3 and LINE-1 (long inter-
spersed nucleotide element-1), CpG island methylator phenotype (CIMP),
microsatellite instability, TP53 expression by immunohistochemistry and
the mutational status of BRAF, KRAS and PIK3CA.
We modeled each SNP using a log-additive approach, relating genotype dose
(i.e. number of copies of the minor allele) to risk of CRC. We adjusted all
analyses for age at sample collection, race, gender, aspirin use, non-steroidal
anti-inflammatory drugs use, body mass index, physical activity, familial
history of CRC, smoking, alcohol, meat consumption, energy-adjusted cal-
cium and folate intake and type of sample (blood versus cheek). To assess
heterogeneity in the association between rs4939827 and tumors according to
clinical phenotype or molecular characteristics, we used a case-case design
using logistic regression model comparing tumor subtypes.
We found that the minor allele (G) in rs4939827 was associated with a lower
risk of developing tumor stage pT1 or pT2 CRC [multivariate odds ratio
(OR), 0.73; 95% confidence interval (CI) 0.62-0.87] but not tumor stage pT3
or pT4 (multivariate OR, 1.07; 95% CI 0.93-1.23, P for heterogeneity = 1.2
x 10−4). The association between rs4939827 and CRC also significantly
differed by methylation of RUNX3 (P for heterogeneity = 0.005). Among
those with CRC, the minor allele (G) in rs4939827 was significantly associ-
ated with poorer overall survival (hazards ratio, 1.20; 95% CI, 1.02-1.42).
We performed mediation analyses to decompose the total effect of the ex-
posure (rs4939827) on the outcome (T3-T4 tumors) into a “direct effect”
plus an “indirect effect” The “direct effect” can be interpreted as the OR
comparing the risk of T3-T4 tumor stage with the genetic variant present
vs. absent if the mediator (e.g. RUNX3) were what it would have been
without the genetic variant. The “indirect effect” can be interpreted as the
OR for T3-T4 tumor stage for those with the genetic variant present com-
paring the risk if the mediator were what it would have been with versus
without the genetic variant.
The multivariate ORs that estimate the direct effect of rs4939827 were 1.96
(95% CI 1.18-3.25, P-value = 0.009) for one variant allele and 4.46 (95% CI
1.19-16.6, P-value = 0.038) for two variant alleles. The multivariate ORs
estimating the indirect effect of rs4939827 on risk of pT3 and pT4 tumors
was 1.05 (95% CI 0.96-1.15, P = 0.32) for one variant allele and 1.50 (95%
CI 0.44-5.10, P = 0.51) for two variant alleles. We did not found evidence
of neither multiplicative nor additive interaction between rs4939827 and
RUNX3 methylation.
In conclusion, we provide clinical and molecular evidence showing that
ERK2 activation provides colon cancer cells with the ability to seed and col-
onize the liver and reduced p38 MAPK signalling endows cancer cells with
the ability to form lung metastasis from previously established liver lesions.
Downregulation of p38 MAPK signalling results in increased expression of
the cytokine PTHLH, which contributes to colon cancer cell extravasation
to the lung by inducing caspase-independent death in endothelial cells of
the lung microvasculature. We also show that patients with the rs4939827
CRC-susceptibility locus diagnosed with CRC tend to develop tumors with
greater invasiveness (as measured by the pT stage). The variant rs4939827
is differentially associated with RUNX3 methylation status, supporting an
effect of rs4939827 or causal variants tagged by this SNP on carcinogenesis
mediated through the TGFβ pathway. Taken together, these results could
explain, at least in part, the lower risk of CRC associated with the G allele
of rs4939827 yet poorer survival.
Resumen
El patron de metastasis de cancer de colon y recto (CCR) avanzado es rel-
ativamente homogeneo. El hıgado es el organo mas frecuentemente afec-
tado, seguido del pulmon, el peritoneo y huesos. Parte de esta inves-
tigacion consiste en explorar los mecanismos involucrados en el patron
metastatico de CCR, focalizandonos en la vıa biologica de MAPK. Para
ello usamos una lınea celular (SW620) con el gen KRAS mutado como
punto de partida para crear un derivado con alta capacidad metastatica
mediante un modelo animal basado en la inyeccion de celulas tumorales
en la circulacion portal de ratones inmunodeprimidos. Ademas realizamos
experimentos tanto in vivo como in vitro para desarrollar los hallazgos.
Asimismo usamos datos procedentes de dos cohortes en las que se identifi-
caron CCR incidentes, en los que se evaluo la asociacion entre el polimor-
fismo intronico de SMAD7 (rs4939827, 18q21) con el genotipo y carac-
terısticas tumorales. Este polimorfismo esta asociado con un menor riesgo
de desarrollar CCR (odds ratio 0.88, 95% confidence interval [CI] 0.85 -
0.93) y con peor pronostico entre aquellos pacientes diagnosticados con CCR
(hazards ratio of 1.16, 95% CI 1.06-1.27).
En el primer proyecto, donde evaluamos los mecanismos de metastasis, in-
trodujimos en la lınea celular SW620 un vector de expresion de luciferasa, lo
cual permite monitorizar y cuantificar la emergencia de lesiones metastaticas
in vivo mediante bioluminiscencia. Estas celulas marcadas son inoculadas
en la circulacion portal de los ratones inmunodeficientes mediante su in-
yeccion en el bazo, tras lo cual los esplenectomizamos. Cuando el raton
reproduce metastasis hepaticas, se recuperan estas y se aıslan las celulas
metastaticas (que las denominamos LiM1), sometiendolas a otro ciclo identico
de enriquecimiento de su capacidad metastatica mediante una nueva in-
yeccion intraesplenica. Las celulas enriquecidas a partir de las metastasis
resultantes (LiM2) muestran una alta capacidad metastatica a hıgado y a
pulmon.
Mediante analisis de expresion de genes usando chips de transcripcion iden-
tificamos 194 genes diferencialmente expresados entre las lıneas parentales
(SW620) y las celulas altamente metastaticas (LiM2). Esta “firma” genetica
se contrasto con una cohorte clınica de 267 pacientes con CCR estadios I-
III y asimismo investigamos las vıas biologicas que podrıan estar regulando
el conjunto de genes que identificamos como asociados a mayor capaci-
dad metastatica. Encontramos que las siguientes vıas biologicas estaban
involucradas: metabolismo del nitrogeno, moleculas de adhesion celular y
mitogen-activated protein kinases (MAPKs). Decidimos centrarnos en la vıa
de MAPKs ya que las celulas con las que trabajamos tenıan el gen KRAS
mutado y ademas porque los pacientes que sufren un cancer de colon avan-
zado con KRAS mutado tienen menos opciones terapeuticas. Encontramos
que la fosforilacion de ERK1/ERK2 estaba aumentada, que las MAPKs
p38 estaban disminuidas y que la fosforilacion de JNKs no habıa cambiado.
Evidenciamos ademas que, en nuestro modelo animal, el silenciamiento de
ERK2 (pero no de ERK1) en la lınea celular altamente metastatica revierte
su capacidad metastatica al hıgado, pero no al pulmon. Esto nos llevo a
hipotetizar que la capacidad de metastatizar en el pulmon de la lınea celular
altamente metastatica debıa de estar mediado por algun otro mecanismo.
El analisis de muestras clınicas mostro que aquellos pacientes cuyo tumor
presentaba bajos niveles de p38 sufrıan una mayor frecuencia de metastasis
al pulmon, pero no a otros organos. Al tratar ratones que habıan desarrol-
lado metastasis hepaticas derivadas de la lınea celular parental con un in-
hibidor especıfico de p38, vimos que se incrementaba la afinidad metastatica
al pulmon. Este hallazgo lo validamos con una lınea celular diferente
(HCT116) en un modelo animal tambien diferente. Tambien evidenciamos
que si activabamos la vıa de p38 mediante la induccion de MKK6EE (MKK6
es una MAP kinase-kinase que fosforila y activa la kinasa p38), la capacidad
de metastatizar al pulmon de la lınea celular HCT116 disminuıa.
La expresion de PTHLH (parathyroid hormone-like hormone) presentaba
un aumento relativo de 3,3 veces en la lınea celular altamente metastatica
comparada con la lınea parental. Asimismo, PTHLH se correlacionaba in-
versamente con la expresion de MKK6 en tumores primarios de colon. Evi-
denciamos que el silenciamiento de PTHLH en el derivado celular altamente
metastatico disminuıa su capacidad de colonizar el pulmon, sin afectar su
capacidad de colonizar el hıgado tras su inyeccion en el sistema portal.
La inyeccion el la vena de la cola del raton (que drena directamente al
pulmon) del derivado celular altamente metastatico no producıa metastasis
pulmonares y el silenciamiento de PTHLH en estas celulas no afectaba su
crecimiento si se inyectaban directamente en el pulmon. Esto nos llevo a
pensar que el papel de PTHLH en la regulacion de las metastasis hepaticas
no era a traves de un incremento de la proliferacion, sino a traves de un in-
cremento en la capacidad de extravasarse. Para confirmar esto inyectamos
celulas LiM2 que sobreexpresaban o no PTHLH en la cola de los ratones
(drenando directamente al pulmon): encontramos que aquellos ratones a los
que se les inyectaron celulas LiM2 que sobreexpresaban PTHLH presenta-
ban cinco veces mas celulas extravasadas que los ratones a los que se les in-
yectaron celulas LiM2 sin sobreexpresion de PTHLH. Finalmente pudimos
demostrar que PTHLH induce la apoptosis de celulas humanas de endotelio
pulmonar incrementando los niveles de calcio intracelulares, lo que causa
la movilizacion del factor AIFM1(apoptosis-inducing factor mitochondrion-
associated 1 ) de la mitocondria al citoplasma, induciendo la apoptosis celu-
lar mediante un mecanismo independiente de caspasas. Esto desestructura
la vasculatura pulmonar, facilitando que las celulas metastaticas puedan
extravasarse al pulmon.
En el segundo proyecto evaluamos la asociacion de un polimorfismo intronico
del gen SMAD7 con el fenotipo y varias caracterısticas moleculares del tu-
mor. Para ello empleamos 1509 casos de cancer de colon y recto y 2307 con-
troles emparejados anidados en las cohortes Nurses Health Study (NHS) y
Health Professionals Follow-up Study (HPFS). NHS y HPFS son cohortes de
individuos sanos cuando fueron reclutados y que han facilitado informacion
sobre su salud y sus habitos de vida cada dos aos, siendo el seguimiento
superior al 90%. Las muestras para la extraccion del DNA (sangre o frotis
de mejilla) se obtuvieron en mas de 90.000 individuos. En los casos, la in-
formacion sobre el diagnostico del tumor se extrajo de las historias medicas.
Seleccionamos 1-3 controles emparejados en raza, ao de nacimiento y fecha
de muestreo por cada control, dentro de la cohorte de pacientes sin CCR
cuando el caso fue diagnosticado.
De entre los 1509 casos con muestra de DNA, pudimos obtener tejido
tumoral apropiado para realizar su analisis molecular en 658 casos. El
genotipo del polimorfismo rs4939827 (TaqMan R©) se realizo correctamente
en el 98% de las muestras de la cohorte NHS y en el 99.6% de las muestras
de la cohorte HPFS. Los rasgos fenotıpicos que evaluamos fueron: el esta-
dio TNM, grado de diferenciacion, localizacion del tumor primario (colon
vs. recto) y edad al diagnostico. Las caracterısticas moleculares que anal-
izamos fueron la metilacion de RUNX3 y LINE-1 (long interspersed nu-
cleotide element-1), la metilacion de las islas de CpG (CIMP), inestabilidad
de microsatelites, la expresion por inmunohistoquımica de TP53 y el estado
mutaciones de BRAF, KRAS y PIK3CA.
Para el analisis estadıstico modelamos el polimorfismo usando un modelo
log-aditivo que relacionaba la “dosis” de genotipo (el numero de copias del
alelo de menor frecuencia con el riesgo de CCR. Ajustamos los analisis
por la edad en el momento de recogida de la muestra, raza, sexo, uso de
aspirina, uso de antiinflamatorios no esteroideos, ındice de masa corporal,
actividad fısica, historia familiar de CCR, tabaquismo, alcohol, consumo
de carne, consumo de calcio y folato y tipo de muestra para la obtencion
de DNA (sangre o frotis de mejilla). Para evaluar la heterogeneidad en la
asociacion entre el polimorfismo de rs4939827 y los tumores de acuerdo al
fenotipo clınico o caracterısticas moleculares, usamos un diseo “caso-caso”
comparando los diferentes subgrupos tumorales usando regresion logıstica.
Encontramos que el alelo de menor frecuencia de rs4939827 (G) se asociaba
con un menor riesgo de desarrollar un CCR con un estadio pT1 o pT2
[razon de odds (OR) ajustada, 0.73; intervalo de confianza al 95% (CI)
0.62-0.87] pero no con tumores con estadio pT3 o pT4 (OR ajustada, 1.07;
95% CI 0.93-1.23, valor p de heterogeneidad = 1.2 x 10⁻⁴). La asociacion
entre el polimorfismo de rs4939827 y CCR tambien diferıa significativamente
segun la metilacion de RUNX3 (valor p de heterogeneidad = 0.005). Entre
aquellos pacientes diagnosticados con CCR, el alelo de menor frecuencia
de rs4939827 (G) estaba significativamente asociado con pero supervivencia
(hazards ratio, 1.20; 95% CI, 1.02-1.42).
Realizamos ademas un analisis de mediacion para descomponer el efecto
total de la exposicion de interes (rs4939827) en la variable dependiente (tu-
mores pT3-pT4) en un efecto directo mas un efecto indirecto. El efecto
directo se puede interpretar como la razon de odds que compara el riesgo
de presentar un tumor pT3-pT4 estando el polimorfismo de rs4939827 pre-
sente vs. ausente si el valor del mediador (RUNX3) fuera aquel que corre-
sponde a la ausencia del polimorfismo de rs4939827. El efecto indirecto se
puede interpretar como la razon de odds de presentar un tumor pT3-pT4
para aquellos pacientes con la presencia del polimorfismo de rs4939827 com-
parada con el riesgo si el mediador fuera el que corresponde a tener o no
dicho polimorfismo.
La razon de odds ajustada que estima el efecto directo de rs4939827 fue 1.96
(95% CI 1.18-3.25, valor p = 0.009) para la presencia de un alelo y de 4.46
(95% CI 1.19-16.6, valor p = 0.038) para la presencia de dos alelos. La razon
de odds ajustada que estima el efecto indirecto de rs4939827 en el riesgo de
tumores pT3-pT4 fue 1.05 (95% CI 0.96-1.15, P = 0.32) para la presencia
de un alelo y 1.50 (95% CI 0.44-5.10, P = 0.51) para la presencia de dos
alelos. No encontramos evidencia de interaccion en la escala multiplicativa
o aditiva entre rs4939827 y la metilacion de RUNX3.
Como conclusion, en el presente trabajo hemos hallado evidencia que mues-
tra que la activacion de ERK2 hace que las celulas de cancer de colon tengan
la habilidad de colonizar el hıgado y que una disminucion de los niveles de
p38 hace que las celulas tumorales puedan generar metastasis pulmonares
a partir de metastasis hepaticas previamente establecidas. Esta dismin-
ucion de p38 hace que aumente la expresion de la citoquina PTHLH, lo
cual contribuye a facilitar la extravasacion al pulmon mediante la induccion
de muerte celular de las celulas endoteliales de la microvasculatura pul-
monar. Tambien hemos encontrado evidencia de que los pacientes con el
polimorfismo rs4939827 (el cual se asocia a mayor incidencia de CCR) tienen
mayor riesgo de desarrollar tumores mas invasivos (con mayor estadio pT).

Este polimorfismo esta asimismo asociado diferencialmente con el estado de
metilacion de RUNX3, lo cual apoyarıa que el efecto de rs4939827 (o de
polimorfismos causales surrogados por este) puede estar mediado por la vıa
molecular de TGFβ. Estos hallazgos pueden ayudar a explicar por que el
alelo de menor frecuencia de rs4939827 se asocia con menor riesgo de desar-
rollar CCR en individuos sanos, y con peor supervivencia en los pacientes
diagnosticados de CCR.

xiv

A mis seres queridos.

Acknowledgements
Agradezco sinceramente a Jelena, Marc, Esther, Anna, Marıa, Mili, David,
Evarist, Herbert y Hongmei su ayuda. A Roger, Toni y Andy, su tutela.
He podido realizar este trabajo gracias a un Ajut Josep Font otorgado por
el Hospital Clinic y a una Beca para estudios de postgrado otorgada por La
Caixa.
Contents
List of Figures v
List of Tables vii
1 Introduction 1
1.1 Epidemiology of colorectal cancer . . . . . . . . . . . . . . . . . . . . . . 1
1.1.1 Incidence and mortality . . . . . . . . . . . . . . . . . . . . . . . 1
1.1.2 Genetic susceptibility . . . . . . . . . . . . . . . . . . . . . . . . 1
1.1.2.1 Genetic susceptibility due to common variants . . . . . 3
1.1.2.2 Hereditary syndromes . . . . . . . . . . . . . . . . . . . 6
1.2 Biology of colorectal cancer tumor progression . . . . . . . . . . . . . . . 6
1.3 Mechanisms of metastasis . . . . . . . . . . . . . . . . . . . . . . . . . . 8
1.3.1 Angiogenesis . . . . . . . . . . . . . . . . . . . . . . . . . . . . . 8
1.3.2 Stroma activation . . . . . . . . . . . . . . . . . . . . . . . . . . 9
1.3.3 Epithelial to Mesenquimal Transition (EMT) . . . . . . . . . . . 9
1.3.4 Intravasation, Circulation and Extravasation . . . . . . . . . . . 10
1.3.5 Colonization . . . . . . . . . . . . . . . . . . . . . . . . . . . . . 10
1.3.5.1 Survival on arrival . . . . . . . . . . . . . . . . . . . . . 11
1.3.5.2 Stemness . . . . . . . . . . . . . . . . . . . . . . . . . . 11
1.3.5.3 Metastatic Niches . . . . . . . . . . . . . . . . . . . . . 11
1.3.6 Cellular latency . . . . . . . . . . . . . . . . . . . . . . . . . . . . 12
1.4 Clinical Management . . . . . . . . . . . . . . . . . . . . . . . . . . . . . 13
1.4.1 Colon cancer . . . . . . . . . . . . . . . . . . . . . . . . . . . . . 13
1.4.2 Rectal cancer . . . . . . . . . . . . . . . . . . . . . . . . . . . . . 14
iii
CONTENTS
2 Hypothesis 17
2.1 Hypothesis . . . . . . . . . . . . . . . . . . . . . . . . . . . . . . . . . . 17
3 Objectives 19
4 Publications 21
4.1 First publication . . . . . . . . . . . . . . . . . . . . . . . . . . . . . . . 21
4.1.1 Summary . . . . . . . . . . . . . . . . . . . . . . . . . . . . . . . 21
4.2 Second publication . . . . . . . . . . . . . . . . . . . . . . . . . . . . . . 31
4.2.1 Summary . . . . . . . . . . . . . . . . . . . . . . . . . . . . . . . 31
5 Discussion 61
6 Conclusions 65
References 67
iv
List of Figures
1.1 Global age-standardized colorectal cancer incidence rates . . . . . . . . . 2
1.2 Incidence and mortality age-standardized rates by sex for the 10 most
frequent cancers in Spain . . . . . . . . . . . . . . . . . . . . . . . . . . 2
v

LIST OF FIGURES
vi
List of Tables
1.1 SNPs associated with CRC risk . . . . . . . . . . . . . . . . . . . . . . . 4
1.2 GWAS studies identifying rs4939827 as a risk SNP for CRC . . . . . . . 5
vii
GLOSSARY
AIFM1: Apoptosis-inducing factor
mitochondrion-associated 1.
APC: Adenomatous polyposis coli.
CI: Confidence interval.
CCM: Colon cancer metastatic gene
set.
CCR: Cancer de colon y recto.
CIMP: CpG island methylator phe-
notype.
CRC: Colorectal cancer.
DMA: Deoxyribonucleic acid.
EGFR: Epidermal growth factor re-
ceptor.
EMT: Epithelial to mesenquimal
transition.
ERK: Extracellular signal-regulated
kinases.
FAP: Familial adenomatous polypo-
sis.
GWAS: Genome-wide association
study.
HIF: Hypoxia-inducible factor.
HNPCC: Hereditary non-polyposis
colorectal cancer.
HPEC: Human pulmonary endothe-
lial cells.
HPFS: Health professionals follow-
up study.
HR: Hazard ratio.
JNK: c-Jun N-terminal kinases.
KEGG: Kyoto Encyclopedia of
Genes and Genomes.
MAPK: Mitogen-activated protein
kinases.
MET: Mesenchymal to epithelial
transition.
MMR: Mismatch repair.
MSC: Metastatic stem cell.
MSI: Microsatellite instability.
MUTYH: mutY homolog gene.
NHS: Nurses health study.
OR: Odds ratio.
OS: Overall survival.
PTHLH: Parathyroid hormone-like
hormone.
PI3K-Act: phosphatidylinositol 3-
kinases/Akt.
RUNX3: Runt domain transcription
factor 3.
SMAD: A family of proteins that
are involved in the translocation of sig-
nals from TGFβ receptors, bone morpho-
genetic protein receptors and other sur-
face receptors to the cell nucleus.
SNP: Single nucleotide polymorfism.
TCF4: Transcription factor 4.
TGFβ: Transforming growth factor
β.
TNC: Tenascin C .
VEGF: vascular endothelial growth
factor.
viii
1
Introduction
1.1 Epidemiology of colorectal cancer
1.1.1 Incidence and mortality
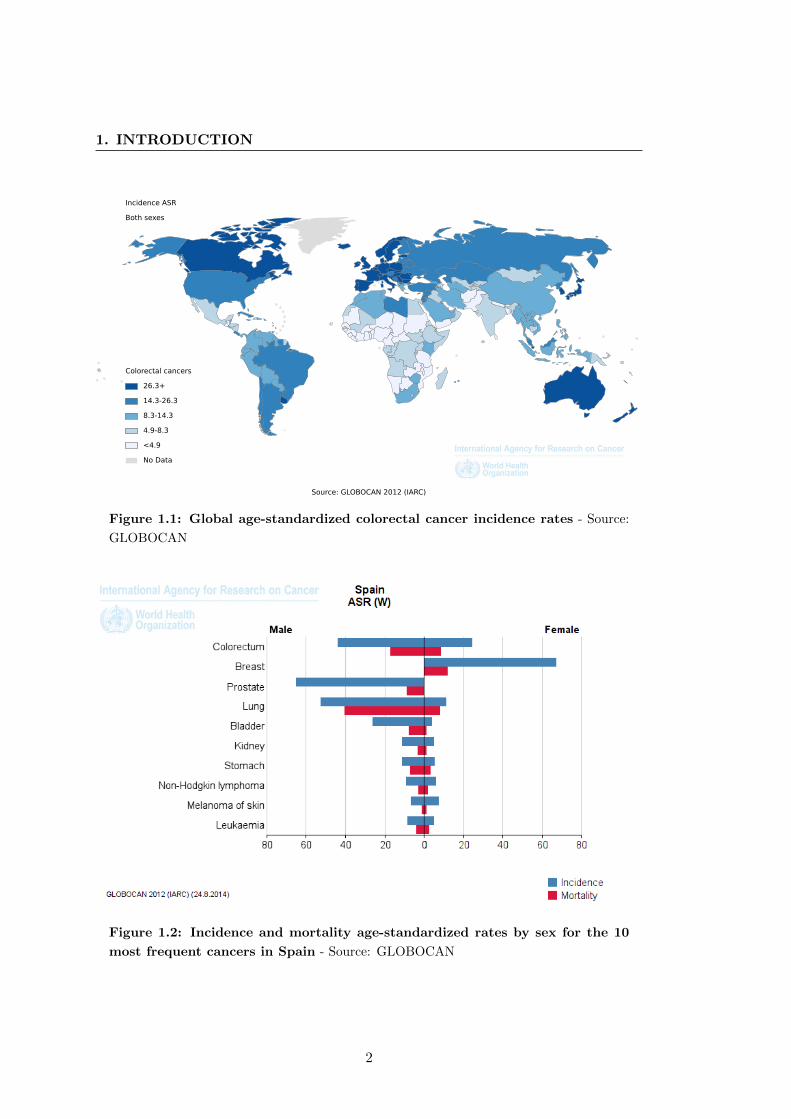
Worldwide, colorectal cancer (CRC) is the second most common cancer in women and
the third most common in men, with 614,000 and 746,000 cases in 2012 respectively. Ge-
ographical variation in incidence across the world is notorious: Australia/New Zealand
harbor the highest estimated incidences (44.8 and 32.2 cases per 100,000 in men and
women respectively) and Western Africa has the lowest estimated incidences (4.5 and
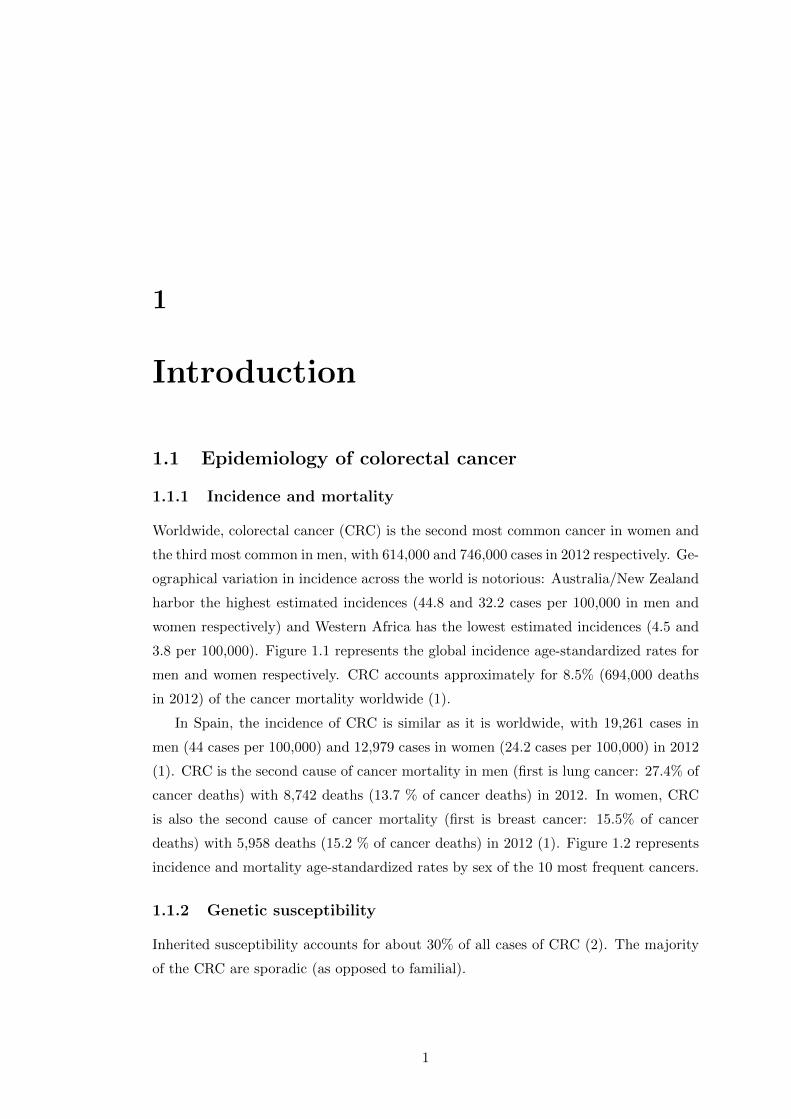
3.8 per 100,000). Figure 1.1 represents the global incidence age-standardized rates for
men and women respectively. CRC accounts approximately for 8.5% (694,000 deaths
in 2012) of the cancer mortality worldwide (1).
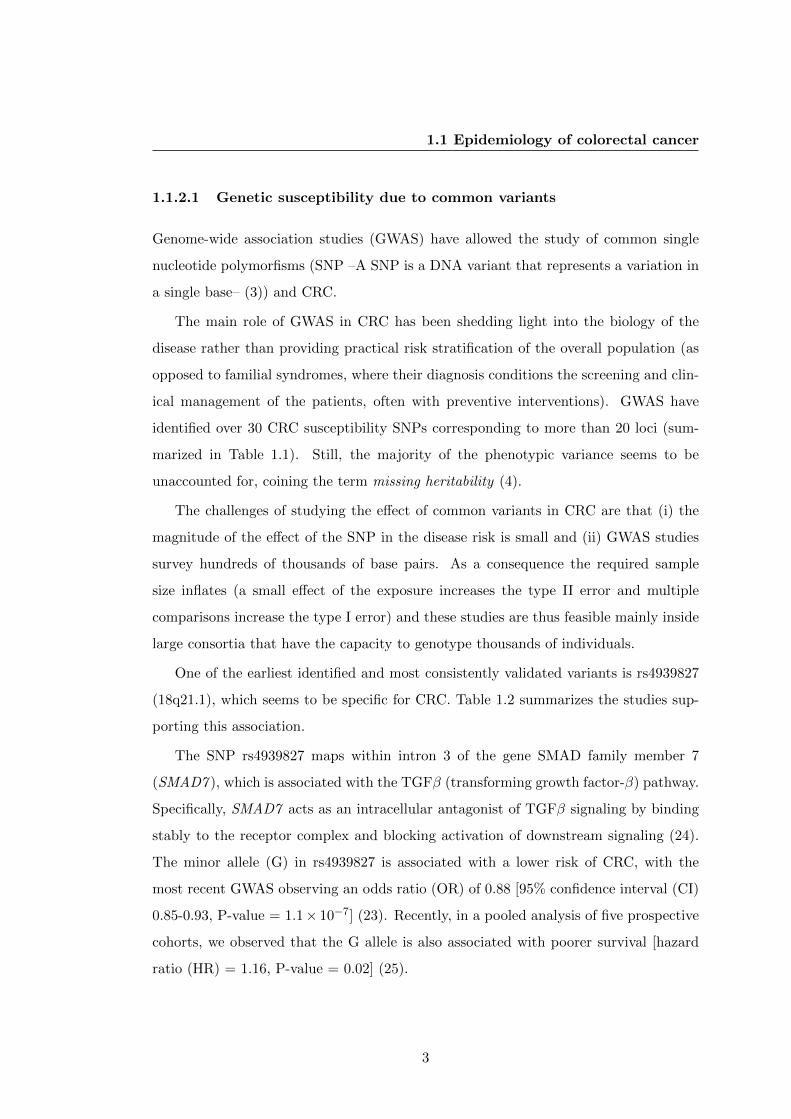
In Spain, the incidence of CRC is similar as it is worldwide, with 19,261 cases in
men (44 cases per 100,000) and 12,979 cases in women (24.2 cases per 100,000) in 2012
(1). CRC is the second cause of cancer mortality in men (first is lung cancer: 27.4% of
cancer deaths) with 8,742 deaths (13.7 % of cancer deaths) in 2012. In women, CRC
is also the second cause of cancer mortality (first is breast cancer: 15.5% of cancer
deaths) with 5,958 deaths (15.2 % of cancer deaths) in 2012 (1). Figure 1.2 represents
incidence and mortality age-standardized rates by sex of the 10 most frequent cancers.
1.1.2 Genetic susceptibility
Inherited susceptibility accounts for about 30% of all cases of CRC (2). The majority
of the CRC are sporadic (as opposed to familial).
1
1. INTRODUCTION
No Data
<4.9
4.9-8.3
8.3-14.3
14.3-26.3
26.3+
Colorectal cancers
Source: GLOBOCAN 2012 (IARC)
Incidence ASR
Both sexes
Figure 1.1: Global age-standardized colorectal cancer incidence rates - Source:
GLOBOCAN
Figure 1.2: Incidence and mortality age-standardized rates by sex for the 10
most frequent cancers in Spain - Source: GLOBOCAN
2
1.1 Epidemiology of colorectal cancer
1.1.2.1 Genetic susceptibility due to common variants
Genome-wide association studies (GWAS) have allowed the study of common single
nucleotide polymorfisms (SNP –A SNP is a DNA variant that represents a variation in
a single base– (3)) and CRC.
The main role of GWAS in CRC has been shedding light into the biology of the
disease rather than providing practical risk stratification of the overall population (as
opposed to familial syndromes, where their diagnosis conditions the screening and clin-
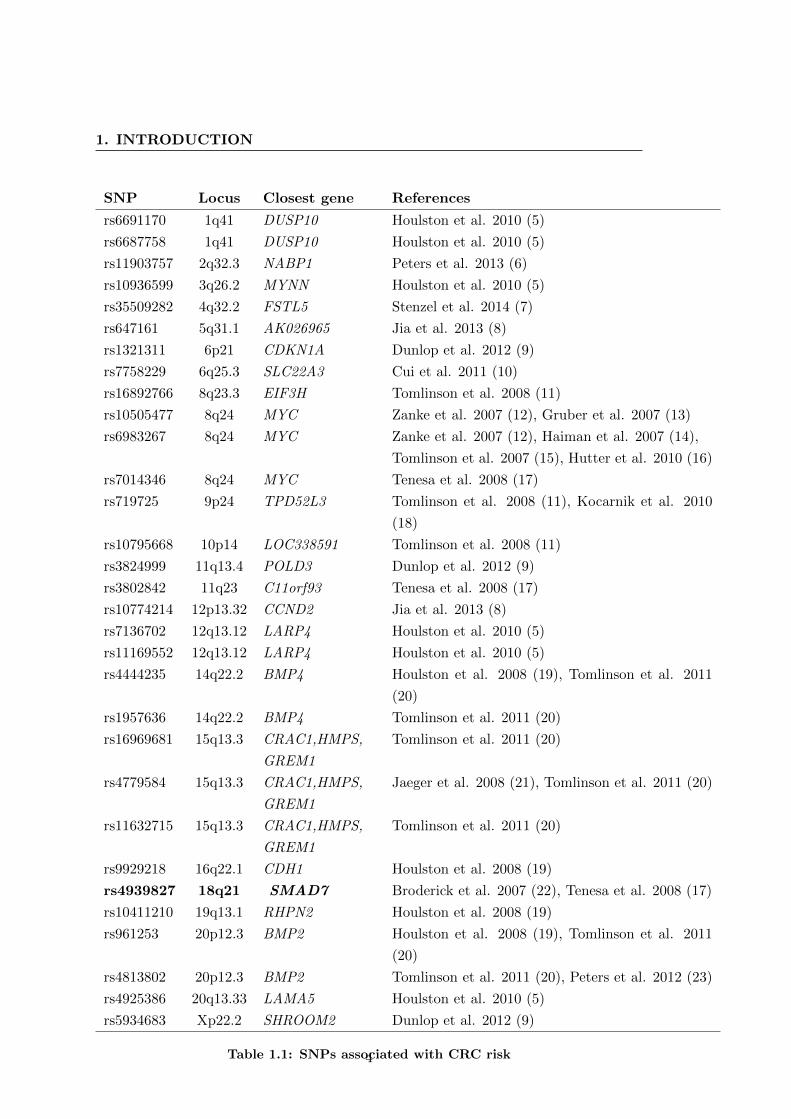
ical management of the patients, often with preventive interventions). GWAS have
identified over 30 CRC susceptibility SNPs corresponding to more than 20 loci (sum-
marized in Table 1.1). Still, the majority of the phenotypic variance seems to be
unaccounted for, coining the term missing heritability (4).
The challenges of studying the effect of common variants in CRC are that (i) the
magnitude of the effect of the SNP in the disease risk is small and (ii) GWAS studies
survey hundreds of thousands of base pairs. As a consequence the required sample
size inflates (a small effect of the exposure increases the type II error and multiple
comparisons increase the type I error) and these studies are thus feasible mainly inside
large consortia that have the capacity to genotype thousands of individuals.
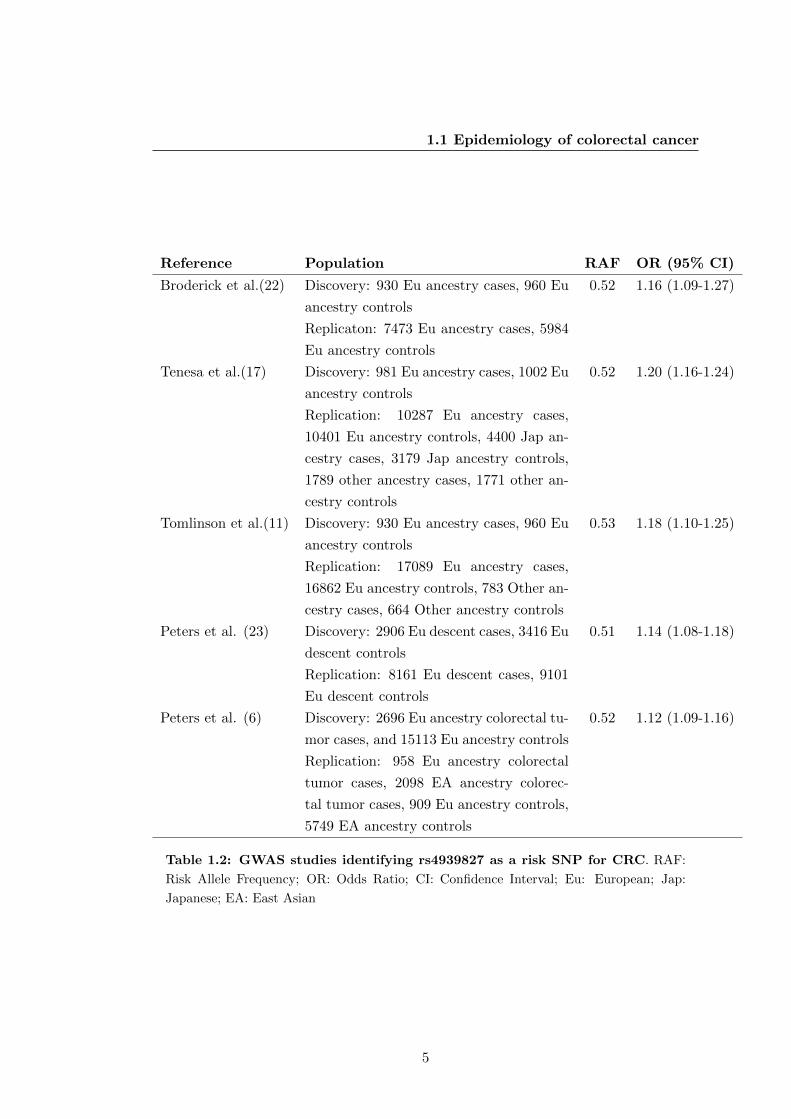
One of the earliest identified and most consistently validated variants is rs4939827
(18q21.1), which seems to be specific for CRC. Table 1.2 summarizes the studies sup-
porting this association.
The SNP rs4939827 maps within intron 3 of the gene SMAD family member 7
(SMAD7 ), which is associated with the TGFβ (transforming growth factor-β) pathway.
Specifically, SMAD7 acts as an intracellular antagonist of TGFβ signaling by binding
stably to the receptor complex and blocking activation of downstream signaling (24).
The minor allele (G) in rs4939827 is associated with a lower risk of CRC, with the
most recent GWAS observing an odds ratio (OR) of 0.88 [95% confidence interval (CI)
0.85-0.93, P-value = 1.1× 10⁻⁷] (23). Recently, in a pooled analysis of five prospective
cohorts, we observed that the G allele is also associated with poorer survival [hazard
ratio (HR) = 1.16, P-value = 0.02] (25).
3
1. INTRODUCTION
SNP Locus Closest gene References
rs6691170 1q41 DUSP10 Houlston et al. 2010 (5)
rs6687758 1q41 DUSP10 Houlston et al. 2010 (5)
rs11903757 2q32.3 NABP1 Peters et al. 2013 (6)
rs10936599 3q26.2 MYNN Houlston et al. 2010 (5)
rs35509282 4q32.2 FSTL5 Stenzel et al. 2014 (7)
rs647161 5q31.1 AK026965 Jia et al. 2013 (8)
rs1321311 6p21 CDKN1A Dunlop et al. 2012 (9)
rs7758229 6q25.3 SLC22A3 Cui et al. 2011 (10)
rs16892766 8q23.3 EIF3H Tomlinson et al. 2008 (11)
rs10505477 8q24 MYC Zanke et al. 2007 (12), Gruber et al. 2007 (13)
rs6983267 8q24 MYC Zanke et al. 2007 (12), Haiman et al. 2007 (14),
Tomlinson et al. 2007 (15), Hutter et al. 2010 (16)
rs7014346 8q24 MYC Tenesa et al. 2008 (17)
rs719725 9p24 TPD52L3 Tomlinson et al. 2008 (11), Kocarnik et al. 2010
(18)
rs10795668 10p14 LOC338591 Tomlinson et al. 2008 (11)
rs3824999 11q13.4 POLD3 Dunlop et al. 2012 (9)
rs3802842 11q23 C11orf93 Tenesa et al. 2008 (17)
rs10774214 12p13.32 CCND2 Jia et al. 2013 (8)
rs7136702 12q13.12 LARP4 Houlston et al. 2010 (5)
rs11169552 12q13.12 LARP4 Houlston et al. 2010 (5)
rs4444235 14q22.2 BMP4 Houlston et al. 2008 (19), Tomlinson et al. 2011
(20)
rs1957636 14q22.2 BMP4 Tomlinson et al. 2011 (20)
rs16969681 15q13.3 CRAC1,HMPS,
GREM1
Tomlinson et al. 2011 (20)
rs4779584 15q13.3 CRAC1,HMPS,
GREM1
Jaeger et al. 2008 (21), Tomlinson et al. 2011 (20)
rs11632715 15q13.3 CRAC1,HMPS,
GREM1
Tomlinson et al. 2011 (20)
rs9929218 16q22.1 CDH1 Houlston et al. 2008 (19)
rs4939827 18q21 SMAD7 Broderick et al. 2007 (22), Tenesa et al. 2008 (17)
rs10411210 19q13.1 RHPN2 Houlston et al. 2008 (19)
rs961253 20p12.3 BMP2 Houlston et al. 2008 (19), Tomlinson et al. 2011
(20)
rs4813802 20p12.3 BMP2 Tomlinson et al. 2011 (20), Peters et al. 2012 (23)
rs4925386 20q13.33 LAMA5 Houlston et al. 2010 (5)
rs5934683 Xp22.2 SHROOM2 Dunlop et al. 2012 (9)
Table 1.1: SNPs associated with CRC risk4
1.1 Epidemiology of colorectal cancer
Reference Population RAF OR (95% CI)
Broderick et al.(22) Discovery: 930 Eu ancestry cases, 960 Eu
ancestry controls
0.52 1.16 (1.09-1.27)
Replicaton: 7473 Eu ancestry cases, 5984
Eu ancestry controls
Tenesa et al.(17) Discovery: 981 Eu ancestry cases, 1002 Eu
ancestry controls
0.52 1.20 (1.16-1.24)
Replication: 10287 Eu ancestry cases,
10401 Eu ancestry controls, 4400 Jap an-
cestry cases, 3179 Jap ancestry controls,
1789 other ancestry cases, 1771 other an-
cestry controls
Tomlinson et al.(11) Discovery: 930 Eu ancestry cases, 960 Eu
ancestry controls
0.53 1.18 (1.10-1.25)
Replication: 17089 Eu ancestry cases,
16862 Eu ancestry controls, 783 Other an-
cestry cases, 664 Other ancestry controls
Peters et al. (23) Discovery: 2906 Eu descent cases, 3416 Eu
descent controls
0.51 1.14 (1.08-1.18)
Replication: 8161 Eu descent cases, 9101
Eu descent controls
Peters et al. (6) Discovery: 2696 Eu ancestry colorectal tu-
mor cases, and 15113 Eu ancestry controls
0.52 1.12 (1.09-1.16)
Replication: 958 Eu ancestry colorectal
tumor cases, 2098 EA ancestry colorec-
tal tumor cases, 909 Eu ancestry controls,
5749 EA ancestry controls
Table 1.2: GWAS studies identifying rs4939827 as a risk SNP for CRC. RAF:
Risk Allele Frequency; OR: Odds Ratio; CI: Confidence Interval; Eu: European; Jap:
Japanese; EA: East Asian
5
1. INTRODUCTION
1.1.2.2 Hereditary syndromes
High-penetrance germ line mutations in known genes account for around 5-7% of the
cases (26). The most relevant are:
1. Lynch syndrome or hereditary non-polyposis colorectal cancer (HN-
PCC). HNPCC is an autosomal dominant syndrome that accounts for approxi-
mately 3 to 5 percent of CRC. Families diagnosed with Lynch syndrome usually
have a germline mutation in one allele of a mismatch repair (MMR) gene, usually
hMLH1, hMSH2, hMSH6, or PMS2. Mutations in EpCAM can induce a MSH2
mono allelic methylation. Phenotypically these are early (mean age at diagnosis
is 48 years) right-sided CRC. Lynch syndrome also increases the risk of cancer in
other locations (endometrium, ovary, stomach, small bowel) (27, 28).
2. Familial adenomatous polyposis (FAP). FAP accounts for less than 1 percent
of CRC. It is caused by germline mutations in the adenomatous polyposis coli
(APC ) gene. Sites of mutation in the APC gene can have different degree of
phenotypic impact. Patients present with multiple polyps in the colon and develop
CRC by age 45 in 90% of the cases (29).
3. MUTYH -associated polyposis. Patients with this disease mimic the FAP
phenotype due to biallelic germline mutations in the base excision repair (the
base excision repair system repairs mutations due to oxidative DNA damage)
gene mutY homolog (MUTYH ) (30).
1.2 Biology of colorectal cancer tumor progression
The transformation of the healthy colorectal mucosa into adenoma and CRC is a well
documented process that involves the sequential alteration of several pathways: Wnt
pathway through the loss of APC or through the accumulation of nuclear β-catenin,
the acquisition of constitutive active mutations of KRAS or BRAF, mutations in the
PI3K pathway, loss of the 18q chromosome and inactivation of SMAD4 and TP53 (31).
Specifically:
1. Adenomatous Polyposis Coli (APC ) gene and Wnt signaling pathway.
APC is a tumor suppressor gene. Somatic mutations in both alleles are present in
6
1.2 Biology of colorectal cancer tumor progression
a high percent of sporadic CRCs. As mentioned above, a single germline mutation
in this gene is responsible for the FAP syndrome. APC loss is considered a very
early event in CRC development (32). The Wnt pathway is an evolutionarily
conserved signal transduction pathway that plays a central role in supporting
intestinal epithelial renewal (33). The main tumor supressor funcion of APC
is to destabilize free β-catenin. Therefore, the loss of APC causes nuclear β-
catenin accumulation. Free β-catenin (either because of loss of APC or because
mutations in β-catenin that stabilized it and cannot be degraded) leads to Wnt
pathway activation (e.g. through activation of Tcf4) and an increase in size of
the proliferating crypt compartment in the colon mucosa.
2. Transfroming growth factor β (TGFβ). TGFβ signaling pathway plays a
role in the control of cell proliferation, migration, differentiation and apoptosis
and is commonly disregulated in CRC. Key elements of this pathway are the three
TGFβ isoforms (TGFβ1-3, being the TGFβ1 the most commonly expressed iso-
form), the TGFβ receptors (TGFβR1 and TGFβR2) and the downstream tran-
scription factors SMAD2, SMAD3 and SMAD4. The activation of the pathway
ends up with a SMAD complexes (SMAD2, SMAD3 and SMAD4) translocat-
ing to the nucleus to regulate several TGFβ-responsive genes. Some of these
TGFβ-responsive genes are important cell cycle checkpoint genes. In normal ep-
ithelium, TGFβ acts as a tumor suppressor. However, once cells are resistant to
TGFβ-mediated proliferative inhibition (i.e. in established tumors), TGFβ ap-
pears to promote metastasis by enhancing angiogenesis and extracellular matrix
disruption and inhibiting infiltrating tumor immune cells (34). SMAD7 acts as
a downstream inhibitor of the action of TGFβ. TGFβ-related ligands can ac-
tivate other pathways beyond SMADs, like MAPK pathway, JNK pathway and
phosphatidylinositol 3-kinases/Akt (PI3K-Act) pathway (35).
3. RAS. Ras proteins are GTPases encoded by different variants of the RAS onco-
gene. These variants are H-ras, K-ras and N-ras. Ras proteins regulate different
signaling pathways involved in the control of cell behavior like proliferation, dif-
ferentiation, migration, survival and apoptosis (36). Best known effectors of Ras
GTPases are Raf kinases and phosphatidylinositol 3-kinases. RAS mutations are
found in up to 50 % of sporadic CRC. K-ras has been reported to be implicated
7
1. INTRODUCTION
in the processes of colorectal cancer invasion and metastasis (37). Mutations of
RAS are clinically relevant because their presence impedes response to mono-
clonal antibodies against the epidermal growth factor receptor (EGFR) (38) like
cetuximab and panitumumab.
1.3 Mechanisms of metastasis
Each tumor type has a characteristic metastatic pattern and latency (e.g. prostate
cancer has a tendency to metastasize to the bone whereas breast cancer spreads mainly
to the bone, lung, brain and liver). In the case of CRC, distant metastasis appear
primarily in the liver and second, by far, in the lung and bones. In some tumours
like breast cancer important advances have been achieved in unveiling the metastatic
process (39). Nevertheless, these cannot be directly extrapolated to CCR given its
different metastatic behaviour.
The vascular drainage of the colon may play a role in this characteristic pattern of
spread (40) as the mesenteric circulation drains to the liver, therefore those CRC cells
detached from the primary tumor reach the liver capillary network as a first station
for colonization. But beyond this passive role of circulation pattern, metastatic cells
must gain additional functions to form macroscopic metastases. The development of
metastasis reflect the evolutionary process involved in cancer, where the mediators of
metastasis act as factors that slightly increase, cell by cell, the probability of successful
completion of one or more steps of the metastatic process. The main steps are the
following.
1.3.1 Angiogenesis
When circulating tumor cells arrive to a distant organ, one of the main stressors that
they face is the lack of oxygen and nutrients. Thus their survival depends on a shift on
the normal balance of angiogenesis. One of the main factors involved in angiogenesis
is the vascular endothelial growth factor (VEGF). Some genes associated with higher
metastatic capacity do so by increasing the angiogenic potential of the invading cells.
As an example, EREG, COX-2 and MMP-1 cooperate in remodeling the vasculature
by allowing neoangiogenesis in models of breast cancer (41). As another example, the
8
1.3 Mechanisms of metastasis
lack of oxygen stabilizes the hypoxia-inducible factor (HIF) which in turn activates me-
diators of angiogenesis (42). Several antiangiogenic drugs have been approved recently
for the treatment of metastatic CRC.
1.3.2 Stroma activation
Tumor cells need to interact with the stroma to enter the circulation and have the
possibility of reaching distant organs (43). They also need to interact with the stroma
of the distant organ in orden to colonize it. Various stromal cell types can induce
signals that cancer cells will use for survival, invasiveness, self-renewal, and migration.
As an example, cancer cells interact with astrocytes in the brain parenquima to form
brain metastasis (44, 45) and with osteoclasts in the bone marrow to form osteoclastic
metastasis (46). This process is well characterized in breast cancer, where the PI3K-
Akt pathway is involved in facilitating bone metastasis (via activation of CXCL12
and IGF1) (47) and the Noch and Wnt pathways are involved in lung metastasis (via
periostin and protein tenascin c interaction) (48). The stroma of the tumor itself can
also promote the attachment of circulating tumor cells favoring its clonal expansion
(tumor self-seeding) (49).
In CRC, cells can become insensitive to the tumor suppressive effect of TGFβ
due to the genetic inactivation of the TGFβ signaling pathway. This allows them to
over express TGFβ. This cytokine can induce the secretion of interleukin 11 from
stromal fibroblasts in the liver and facilitate the development of metastasis (50). Also,
stromal fibroblasts can generate hepatocyte growth factor that enhances Wnt/β-catenin
signaling to promote the stem cell potential of CRC cells (51).
1.3.3 Epithelial to Mesenquimal Transition (EMT)
EMT is a process where epithelial cells switch to a mesenchymal progenitor-cell phe-
notype, in which they de-polarize and become motile. Such transformation can be
induced by reactivation of developmental programs in cancer cells by certain cytokines
(52). Loss of E-cadherin is a requirement for EMT (53), and the pathways involved
in EMT include the TGFβ signaling pathway, the Wnt pathway and multiple tyrosine
kinase receptor pathways like fibroblast growth factor receptor, EGFR and platelet-
derived growth factor receptor (53). EMT transformation allows the cells to gain func-
tions that will favor metastasis, like stemness, motility and even resistance to therapy
9
1. INTRODUCTION
(54), although the role of EMT in metastasis has to be further defined. Transcriptional
regulators that promote EMT can both promote (55) and inhibit (56) metastatic col-
onization. Besides, metastasis usually show epithelial and not mesenchymal features.
A likely explanation is that EMT is a transient estate that allows cancer cells to dis-
seminate, but that has to be reverted by mesenchymal to epithelial transition (MET)
at the metastatic site (57).
1.3.4 Intravasation, Circulation and Extravasation
Cancer cells can enter the circulation until the primary tumor is removed. Tumors can
relesease cancer cells into the circulation in high numbers, as can be inferred from the
presence of circulating tumor cells found in the blood of cancer patients (58). Exper-
imental evidence using a mouse model of mammary tumors shows that macrophages
can facilitate tumor cells intravasation, even in the absence of local angiogenesis (59).
Once in the circulation, cells can be directed to specific organs depending on the site
of origin by circulation patterns (e.g. liver in the case of colon cancer cells entering the
mesenteric circulation). Surviving into circulation also requires the gaining of specific
traits (60), which usually happen by genetic changes ocurring in the primary tumor
(61). Finally, cancer cells have to be able to extravasate once they reach the distant
organ. Several genes that mediate the extravasation of cancer cells to the brain (62),
lungs (41, 63, 64, 65) and liver (64) have been described.
1.3.5 Colonization
Colonization is one of the main bottlenecks for metastasis formation. Colonization
refers to the following steps: survival on arrival, formation of micro metastasis, adoption
of latency, reactivation of growth, recirculation and even formation of tertiary lesions in
the same or different organs. Still, cancer cells die easily at distant sites due to reasons
not completely understood. Contributing factors can be the stress of passing through
endothelial barriers, exposure to the immune system in the distant organ and lack of
survival and proliferation signals in the host tissue.
10
1.3 Mechanisms of metastasis
1.3.5.1 Survival on arrival
Most cells that infiltrate a distant organ do not survive. Specific traits have to be gained
by cancer cells in order to avoid exposure to lethal signals from the reactive stroma,
upregulate cell survival and antiapoptotic pathways. Survival on arrival depends on
a successful interaction with stromal elements like macrophages (66) and on gainig
certain functions like the gain of Src activity of breast cancer cells to be able to survive
on bone marrow (47).
1.3.5.2 Stemness
Cells that reach distant organs do not necessarily have the capacity to create metastasis;
to do so they must be able to recapitulate tumor growth. The term “metastatic stem
cell” (MSC) has been coined to refer to those cells that are able to reinitiate macroscopic
tumor growth in a distant organ. This “stemness” can be present already in the primary
tumor or can be gained through phenotypic plasticity once the MSC have left the
tumor of origin. The fact that MSC can be already present in the primary tumor is
supported by the following: (i) primary tumors that express a stem cell-like signature
are associated with poor prognosis and early distant relapse (67) and (ii) cells isolated
from primary tumors using stem cell markers can generate metastasis in animal models
(68). In the case of CRC, it has been demonstrated that metastasis arise from cells
with stem-like properties like long-term self-renewal capacity, quiescence and resistance
to chemotherapy (69, 70). Epigenetic changes (e.g. methylation) can drive EMT, a
stem-like featured that in this case can be gained once the cell has left the primary
tumor.
1.3.5.3 Metastatic Niches
As pointed out above, metastatic cells need to find a favorable environment (i.e.
stroma) to trhive. The term “metastatic niche” refers to the specific locations and
environments (extracellular matrix proteins, stromal cell types and diffusible signals)
that support the survival and self-renewal of metastatic cells. Three different sources
of metastatic niches have been proposed (71):
• Native stem cell niches, which refer to locations where the stem cells reside under
physiological conditions, like the intestinal epithelium, bone marrow, epidermis
11
1. INTRODUCTION
and brain (72, 73). Recent evidence shows that prostate cancer cells benefit from
an environment that enhances stem cells properties and metastasis in a native
stem cell niche in the bone marrow (74).
• Niche functions provided by stromal cells outside of native stem cell niches. An
example is the perivascular niche: cancer cells typically initiate growth around
blood capillaries. This tendency to settle in perivascular niches is true for glioma,
breast cancer, lung cancer and melanoma cells that infiltrate the brain (75, 76).
Cells proliferate around blood vessels, forming a multilayered sheath that remod-
els the capillary network and becomes the core of an expanding lesion (71). In
the case of brain metastasis, L1CAM -an adhesion molecule and marker of bad
prognosis- plays a key role in allowing cancer cells to settle in this niche location
(77). Beyond providing oxygen and nutrients, perivascular niches can stimulate
growth by paracrine factors. In the case of CRC, this happens via the expression
of Jagged-1 by the endothelial cells (78).
• Stem cell niche components that might be produced by the cancer cells them-
selves. Periostin and tenascin C (TNC) are examples of proteins produced by
cancer cells that contribute to distant spread. Tumor cells can produce TGFβ
that in turn recruits fibroblast that produce periostin which is required for the
initiation of lung metastasis by breast cancer cells in mice (79). TNC can be
expressed by breast cancer cells and regulates several factors that promote tumor
growth (Musashi, Notch and Wnt) and lung metastasis (80).
1.3.6 Cellular latency
“Metastatic latency” is a clinical term to denote the time elapsed from the primary
tumor diagnosis to the detection of overt metastases in imaging techniques. Differ-
ent primary tumors have metastatic latencies of different legths: it is usually long in
prostate cancer, sarcoma and melanoma, and short in lung and some breast cancers.
At the celular level this latency depends both on the equilibrium of cell proliferation
and cell death and on adoption of quiescent states by infiltrating cells (81). Entry in
G0 phase can be a defense under adverse conditions (82, 83). Other mediators of the
transition between dormancy and proliferation are p38 and ERK (mitogen activated
kinases) (84) as well as bone-morphogenetic proteins and their antagonists (85). This
12
1.4 Clinical Management
aspect of metastasis mechanisms biology is not as developed as others, probably in part
due to the difficulty to replicate long latencies in animal models.
1.4 Clinical Management
Clinical management of CRC is based in its classification into four stages (AJCC (86)
stages I to IV) according to the information provided by clinical examination and
imaging techniques. Initial diagnosis is usually done either by screening (i.e. screening
colonoscopy or occult fecal blood test) or driven by symptoms of the primary tumor
(e.g. anemia, gastrointestinal overt bleeding or gastrointestinal symptoms like changes
in bowel habit or even large bowel obstruction). Staging and treatment is different for
colon and rectal cancer.
1.4.1 Colon cancer
Clinical guidelines for the diagnosis and staging of colon cancer recommend the use of
colonoscopy, abdominal and pelvic computed tomography scans and pathologic exami-
nation of the surgical specimen for localized tumors (87, 88, 89). Chest CT scan is not
required (89, 90).
Stages I to III are considered as localized disease (absence of distant organ metas-
tasis), with five-year overall survival ranging from 65% to 95% (91). The mainstay of
treatment for stages I to III is surgical resection. Patients with a tumor that surpasses
muscularis propia in the bowel wall but without regional lymph node involvement after
an adequate evaluation (at least 12 lymph nodes) of the surgical specimen (i.e. stage
II) can be offered treatment with adjuvant (i.e. postoperative) fluorouracil modulated
with leucovorin. The benefits of this adjuvant therapy are modest. A trial that studied
a population with 91% of stage II patients (92) found a 3.6% absolute increase in in
overall survival (OS) at 5 years and no statistically significant benefit in OS among stage
II patients. Three meta-analysis failed to prove a benefit of adjuvant fluoropyrimidine-
based chemotherapy in stage II patients in terms of overall survival (93, 94, 95). As
opposed to treatment of stage III patients (see below), the addition of oxaliplatin to the
adjuvant chemotherapy regimen has proven of no benefit in stage II patients (91, 96).
The standard of care after resection of tumors with lymph nodes involvement and
absence of distant metastasis (i.e. stage III) is oxaliplatin in combination with flu-
13
1. INTRODUCTION
orouracil or capecitabine (91, 96). This regimen showed an statistically significant
increase in OS of 4% at 5 years (91) when compared with an adjuvant therapy based
solely in 5-FU.
In approximately 25% of the cases, CRC presents distant metastasis at diagnosis
(stage IV) and about 30% of the patients with localised stages will suffer from distant
metastasis during follow-up. Patients with metastasis have a median survival that
ranges from 6 to 20 months (97). The main prognostic factors of stage IV CRC patients
are the number, size and location of metastasis (which determine their resectability),
LDH levels and performance status (98).
Treatment of advanced CCR is based on palliative chemotherapy containing 5-
fluorouracil (or capecitabine) plus oxaliplatin or irinotecan. This can be complemented
with monoclonal antibodies directed against EGFR (cetuximab (99), panitumumab
(100)) for those patients with wild type KRAS and NRAS (100, 101). Other active
drugs approved for the treatment of stage IV patients include regorafenib (102) (an
orally active inhibitor of multiple angiogenic and non-angiogenic tyrosine kinases) and
aflibercept (103) (a protein consisting of VEGF binding portions from the human VEGF
receptors 1 and 2 that acts as a decoy receptor preventing pro-angiogenic efectors from
binding to their receptors). The benefit of adding any of these targeted therapies rarely
goes beyond an increment of 2 months in median OS. The role of bevacizumab, a mon-
oclonal antibody against the vascular endothelial growth factor, is not well stablished
since it has not proven to be effective in improving OS (97, 104).
The best way to combine and sequence all the approved drugs for metastatic CRC
to optimize treatment is not yet established.
1.4.2 Rectal cancer
The main difference between the management of colon and rectal cancer relies on the
local staging and local treatment, due to a higher propensity to local relapse in patients
with rectal tumors because of its location. Besides the imaging techniques enumerated
above for the staging of colon cancer, further local staging should be obtained with
endoscopic ultrasonography or preferably, with magnetic resonance imaging.
The standard of care of localized rectal cancer is preoperative concomitant chemo
and radiotherapy (105, 106) followed by surgery using total mesorectal excision (107).
The value of postoperative chemotherapy is not well established, specially for those
14

1.4 Clinical Management
patients that achieve a pathological complete response after preoperative chemo and
radiation (108). Treatment of metastatic rectal cancer does not substantially differ
from that of colon cancer (109).
15

1. INTRODUCTION
16
2
Hypothesis
2.1 Hypothesis
• Germline variants can be associated with different patterns of invasion and or
distant metastasis of CRC.
• Given that the CRC-risk variant rs4939827 is associated with survival in patients
diagnosed with CRC, it may be differentially associated with CRC phenotypic
and/or molecular subtypes.
• Tumor-derived genetic changes can drive the patterns of invasion and/or metas-
tasis
• Cancer cells in stablished metastases can gain functions that allow them colonize
a new distant organ (i.e. metastasis from metastasis).
17

2. HYPOTHESIS
18
3
Objectives
1. To evaluate the association of the germline variant rs4939827 with CRC risk
according to specific clinical phenotypes and molecular characteristics.
2. To develop a murine model for colorectal metastasis and use it to enrich the
metastatic phenotype of CRC lines. Use the highly metastatic cell line to identify
novel mechanisms of invasion and/or metastasis
19

3. OBJECTIVES
20
4
Publications
4.1 First publication
Phenotypic and tumor molecular characterization of colorectal cancer in
relation to a susceptibility SMAD7 variant associated with survival
Xabier Garcia-Albeniz, Hongmei Nan, Linda Valeri, Teppei Morikawa, Aya Kuchiba,
Amanda I. Phipps, Carolyn M. Hutter, Ulrike Peters, Polly A. Newcomb, Charles S.
Fuchs, Edward L. Giovannucci, Shuji Ogino and Andrew T. Chan
Carcinogenesis 2013 Feb;34(2):292-8. doi:10.1093/carcin/bgs335
4.1.1 Summary
The minor allele (G) of rs4939827 -an intronic variant of SMAD7 (18q21)- is associated
with a lower risk of developing CRC (OR of 0.88, 95% CI: 0.85 - 0.93)(23) and poorer
survival after diagnosis (HR of 1.16, 95% CI: 1.06-1.27)(25). We evaluated the associ-
ations of this variant with tumor phenotype and several molecular characteristics. We
used 1509 CRC cases and 2307 age-matched controls nested within the Nurses Health
Study (NHS) and the Health Professionals Follow-up Study (HPFS).
The NHS is a cohort initiated in 1976 with over 120,000 registered nurses. The
HPFS is a cohort initiated in 1986 with over 50,000 male health professionals. In
both cohorts information is updated biennially via questionnaires, with a follow-up
greater than 90%. Samples for DNA extraction (blood or buccal cell specimens) from
both cohorts were obtained in more than 90,000 individuals. Information on CRC is
extracted from medical records by study physicians after obtaining permission from
21
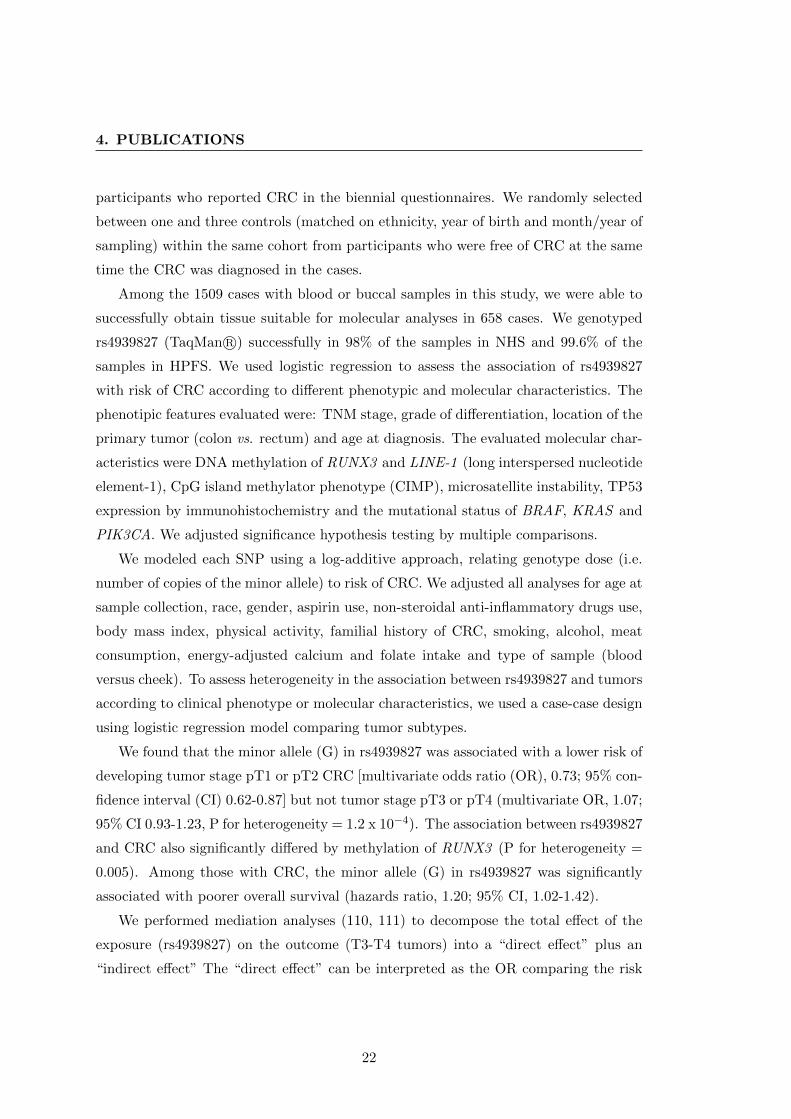
4. PUBLICATIONS
participants who reported CRC in the biennial questionnaires. We randomly selected
between one and three controls (matched on ethnicity, year of birth and month/year of
sampling) within the same cohort from participants who were free of CRC at the same
time the CRC was diagnosed in the cases.
Among the 1509 cases with blood or buccal samples in this study, we were able to
successfully obtain tissue suitable for molecular analyses in 658 cases. We genotyped
rs4939827 (TaqMan R©) successfully in 98% of the samples in NHS and 99.6% of the
samples in HPFS. We used logistic regression to assess the association of rs4939827
with risk of CRC according to different phenotypic and molecular characteristics. The
phenotipic features evaluated were: TNM stage, grade of differentiation, location of the
primary tumor (colon vs. rectum) and age at diagnosis. The evaluated molecular char-
acteristics were DNA methylation of RUNX3 and LINE-1 (long interspersed nucleotide
element-1), CpG island methylator phenotype (CIMP), microsatellite instability, TP53
expression by immunohistochemistry and the mutational status of BRAF, KRAS and
PIK3CA. We adjusted significance hypothesis testing by multiple comparisons.
We modeled each SNP using a log-additive approach, relating genotype dose (i.e.
number of copies of the minor allele) to risk of CRC. We adjusted all analyses for age at
sample collection, race, gender, aspirin use, non-steroidal anti-inflammatory drugs use,
body mass index, physical activity, familial history of CRC, smoking, alcohol, meat
consumption, energy-adjusted calcium and folate intake and type of sample (blood
versus cheek). To assess heterogeneity in the association between rs4939827 and tumors
according to clinical phenotype or molecular characteristics, we used a case-case design
using logistic regression model comparing tumor subtypes.
We found that the minor allele (G) in rs4939827 was associated with a lower risk of
developing tumor stage pT1 or pT2 CRC [multivariate odds ratio (OR), 0.73; 95% con-
fidence interval (CI) 0.62-0.87] but not tumor stage pT3 or pT4 (multivariate OR, 1.07;
95% CI 0.93-1.23, P for heterogeneity = 1.2 x 10⁻⁴). The association between rs4939827
and CRC also significantly differed by methylation of RUNX3 (P for heterogeneity =
0.005). Among those with CRC, the minor allele (G) in rs4939827 was significantly
associated with poorer overall survival (hazards ratio, 1.20; 95% CI, 1.02-1.42).
We performed mediation analyses (110, 111) to decompose the total effect of the
exposure (rs4939827) on the outcome (T3-T4 tumors) into a “direct effect” plus an
“indirect effect” The “direct effect” can be interpreted as the OR comparing the risk
22
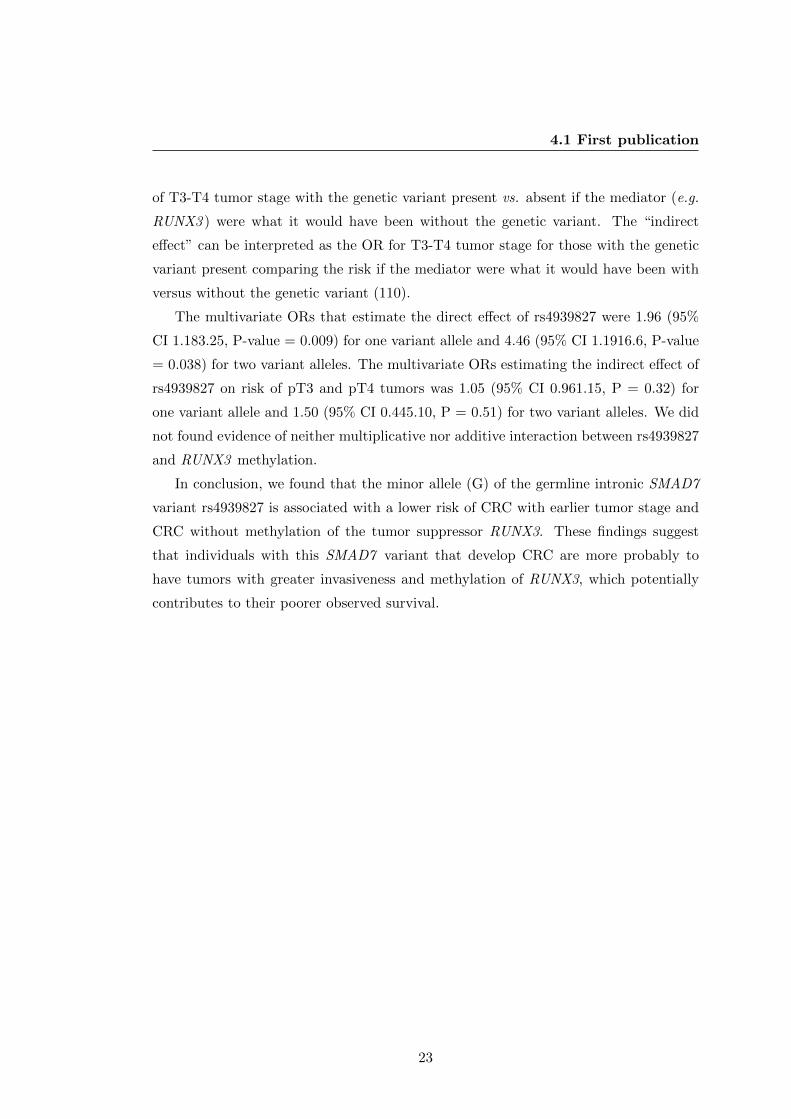
4.1 First publication
of T3-T4 tumor stage with the genetic variant present vs. absent if the mediator (e.g.
RUNX3 ) were what it would have been without the genetic variant. The “indirect
effect” can be interpreted as the OR for T3-T4 tumor stage for those with the genetic
variant present comparing the risk if the mediator were what it would have been with
versus without the genetic variant (110).
The multivariate ORs that estimate the direct effect of rs4939827 were 1.96 (95%
CI 1.183.25, P-value = 0.009) for one variant allele and 4.46 (95% CI 1.1916.6, P-value
= 0.038) for two variant alleles. The multivariate ORs estimating the indirect effect of
rs4939827 on risk of pT3 and pT4 tumors was 1.05 (95% CI 0.961.15, P = 0.32) for
one variant allele and 1.50 (95% CI 0.445.10, P = 0.51) for two variant alleles. We did
not found evidence of neither multiplicative nor additive interaction between rs4939827
and RUNX3 methylation.
In conclusion, we found that the minor allele (G) of the germline intronic SMAD7
variant rs4939827 is associated with a lower risk of CRC with earlier tumor stage and
CRC without methylation of the tumor suppressor RUNX3. These findings suggest
that individuals with this SMAD7 variant that develop CRC are more probably to
have tumors with greater invasiveness and methylation of RUNX3, which potentially
contributes to their poorer observed survival.
23
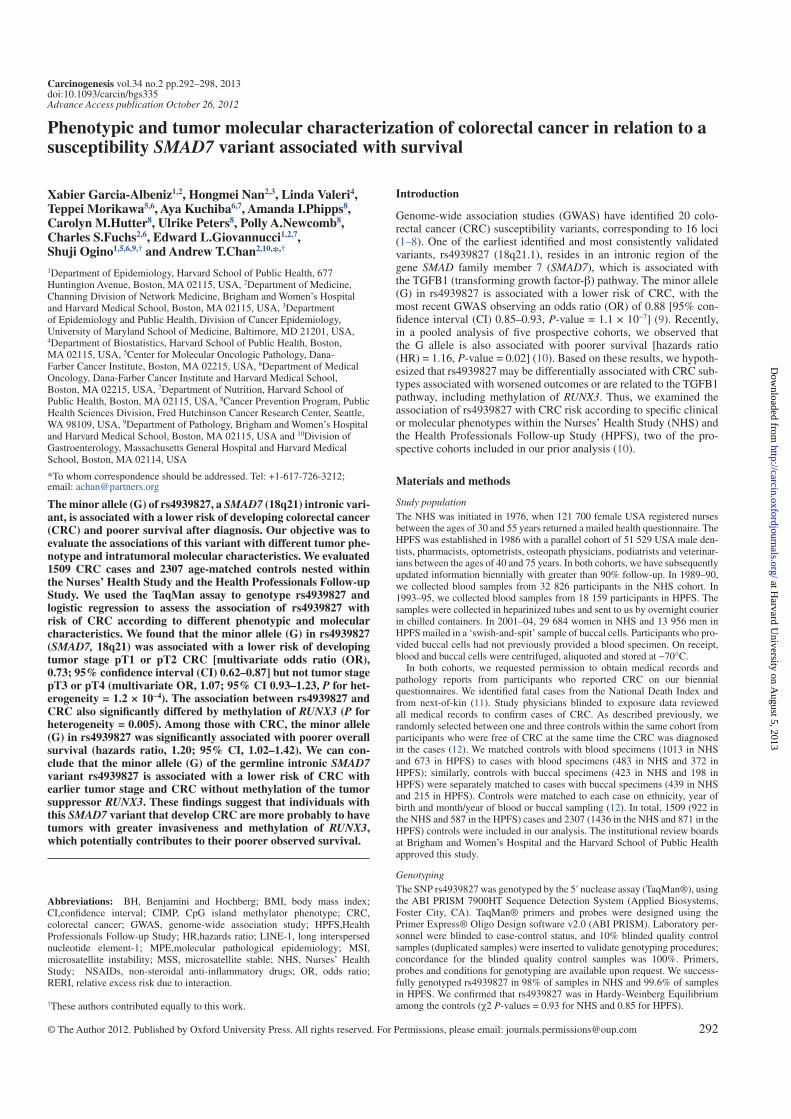
© The Author 2012. Published by Oxford University Press. All rights reserved. For Permissions, please email: [email protected]
Carcinogenesis vol.34 no.2 pp.292–298, 2013doi:10.1093/carcin/bgs335Advance Access publication October 26, 2012
Phenotypic and tumor molecular characterization of colorectal cancer in relation to a susceptibility SMAD7 variant associated with survival
Xabier Garcia-Albeniz1,2, Hongmei Nan2,3, Linda Valeri4, Teppei Morikawa5,6, Aya Kuchiba6,7, Amanda I.Phipps8, Carolyn M.Hutter8, Ulrike Peters8, Polly A.Newcomb8, Charles S.Fuchs2,6, Edward L.Giovannucci1,2,7, Shuji Ogino1,5,6,9,† and Andrew T.Chan2,10,*,† 1Department of Epidemiology, Harvard School of Public Health, 677 Huntington Avenue, Boston, MA 02115, USA, 2Department of Medicine, Channing Division of Network Medicine, Brigham and Women’s Hospital and Harvard Medical School, Boston, MA 02115, USA, 3Department of Epidemiology and Public Health, Division of Cancer Epidemiology, University of Maryland School of Medicine, Baltimore, MD 21201, USA, 4Department of Biostatistics, Harvard School of Public Health, Boston, MA 02115, USA, 5Center for Molecular Oncologic Pathology, Dana-Farber Cancer Institute, Boston, MA 02215, USA, 6Department of Medical Oncology, Dana-Farber Cancer Institute and Harvard Medical School, Boston, MA 02215, USA, 7Department of Nutrition, Harvard School of Public Health, Boston, MA 02115, USA, 8Cancer Prevention Program, Public Health Sciences Division, Fred Hutchinson Cancer Research Center, Seattle, WA 98109, USA, 9Department of Pathology, Brigham and Women’s Hospital and Harvard Medical School, Boston, MA 02115, USA and 10Division of Gastroenterology, Massachusetts General Hospital and Harvard Medical School, Boston, MA 02114, USA
*To whom correspondence should be addressed. Tel: +1-617-726-3212;email: [email protected]
The minor allele (G) of rs4939827, a SMAD7 (18q21) intronic vari-ant, is associated with a lower risk of developing colorectal cancer (CRC) and poorer survival after diagnosis. Our objective was to evaluate the associations of this variant with different tumor phe-notype and intratumoral molecular characteristics. We evaluated 1509 CRC cases and 2307 age-matched controls nested within the Nurses’ Health Study and the Health Professionals Follow-up Study. We used the TaqMan assay to genotype rs4939827 and logistic regression to assess the association of rs4939827 with risk of CRC according to different phenotypic and molecular characteristics. We found that the minor allele (G) in rs4939827 (SMAD7, 18q21) was associated with a lower risk of developing tumor stage pT1 or pT2 CRC [multivariate odds ratio (OR), 0.73; 95% confidence interval (CI) 0.62–0.87] but not tumor stage pT3 or pT4 (multivariate OR, 1.07; 95% CI 0.93–1.23, P for het-erogeneity = 1.2 × 10⁻⁴). The association between rs4939827 and CRC also significantly differed by methylation of RUNX3 (P for heterogeneity = 0.005). Among those with CRC, the minor allele (G) in rs4939827 was significantly associated with poorer overall survival (hazards ratio, 1.20; 95% CI, 1.02–1.42). We can con-clude that the minor allele (G) of the germline intronic SMAD7 variant rs4939827 is associated with a lower risk of CRC with earlier tumor stage and CRC without methylation of the tumor suppressor RUNX3. These findings suggest that individuals with this SMAD7 variant that develop CRC are more probably to have tumors with greater invasiveness and methylation of RUNX3, which potentially contributes to their poorer observed survival.
Introduction
Genome-wide association studies (GWAS) have identified 20 colo-rectal cancer (CRC) susceptibility variants, corresponding to 16 loci (1–8). One of the earliest identified and most consistently validated variants, rs4939827 (18q21.1), resides in an intronic region of the gene SMAD family member 7 (SMAD7), which is associated with the TGFB1 (transforming growth factor-β) pathway. The minor allele (G) in rs4939827 is associated with a lower risk of CRC, with the most recent GWAS observing an odds ratio (OR) of 0.88 [95% con-fidence interval (CI) 0.85–0.93, P-value = 1.1 × 10⁻⁷] (9). Recently, in a pooled analysis of five prospective cohorts, we observed that the G allele is also associated with poorer survival [hazards ratio (HR) = 1.16, P-value = 0.02] (10). Based on these results, we hypoth-esized that rs4939827 may be differentially associated with CRC sub-types associated with worsened outcomes or are related to the TGFB1 pathway, including methylation of RUNX3. Thus, we examined the association of rs4939827 with CRC risk according to specific clinical or molecular phenotypes within the Nurses’ Health Study (NHS) and the Health Professionals Follow-up Study (HPFS), two of the pro-spective cohorts included in our prior analysis (10).
Materials and methods
Study population
The NHS was initiated in 1976, when 121 700 female USA registered nurses between the ages of 30 and 55 years returned a mailed health questionnaire. The HPFS was established in 1986 with a parallel cohort of 51 529 USA male den-tists, pharmacists, optometrists, osteopath physicians, podiatrists and veterinar-ians between the ages of 40 and 75 years. In both cohorts, we have subsequently updated information biennially with greater than 90% follow-up. In 1989–90, we collected blood samples from 32 826 participants in the NHS cohort. In 1993–95, we collected blood samples from 18 159 participants in HPFS. The samples were collected in heparinized tubes and sent to us by overnight courier in chilled containers. In 2001–04, 29 684 women in NHS and 13 956 men in HPFS mailed in a ‘swish-and-spit’ sample of buccal cells. Participants who pro-vided buccal cells had not previously provided a blood specimen. On receipt, blood and buccal cells were centrifuged, aliquoted and stored at −70°C.
In both cohorts, we requested permission to obtain medical records and pathology reports from participants who reported CRC on our biennial questionnaires. We identified fatal cases from the National Death Index and from next-of-kin (11). Study physicians blinded to exposure data reviewed all medical records to confirm cases of CRC. As described previously, we randomly selected between one and three controls within the same cohort from participants who were free of CRC at the same time the CRC was diagnosed in the cases (12). We matched controls with blood specimens (1013 in NHS and 673 in HPFS) to cases with blood specimens (483 in NHS and 372 in HPFS); similarly, controls with buccal specimens (423 in NHS and 198 in HPFS) were separately matched to cases with buccal specimens (439 in NHS and 215 in HPFS). Controls were matched to each case on ethnicity, year of birth and month/year of blood or buccal sampling (12). In total, 1509 (922 in the NHS and 587 in the HPFS) cases and 2307 (1436 in the NHS and 871 in the HPFS) controls were included in our analysis. The institutional review boards at Brigham and Women’s Hospital and the Harvard School of Public Health approved this study.
Genotyping
The SNP rs4939827 was genotyped by the 5′ nuclease assay (TaqMan®), using the ABI PRISM 7900HT Sequence Detection System (Applied Biosystems, Foster City, CA). TaqMan® primers and probes were designed using the Primer Express® Oligo Design software v2.0 (ABI PRISM). Laboratory per-sonnel were blinded to case-control status, and 10% blinded quality control samples (duplicated samples) were inserted to validate genotyping procedures; concordance for the blinded quality control samples was 100%. Primers, probes and conditions for genotyping are available upon request. We success-fully genotyped rs4939827 in 98% of samples in NHS and 99.6% of samples in HPFS. We confirmed that rs4939827 was in Hardy-Weinberg Equilibrium among the controls (χ2 P-values = 0.93 for NHS and 0.85 for HPFS).
Abbreviations: BH, Benjamini and Hochberg; BMI, body mass index; CI,confidence interval; CIMP, CpG island methylator phenotype; CRC, colorectal cancer; GWAS, genome-wide association study; HPFS,Health Professionals Follow-up Study; HR,hazards ratio; LINE-1, long interspersed nucleotide element-1; MPE,molecular pathological epidemiology; MSI, microsatellite instability; MSS, microsatellite stable; NHS, Nurses’ Health Study; NSAIDs, non-steroidal anti-inflammatory drugs; OR, odds ratio; RERI, relative excess risk due to interaction.
†These authors contributed equally to this work.
292
at Harvard U
niversity on August 5, 2013
http://carcin.oxfordjournals.org/D
ownloaded from
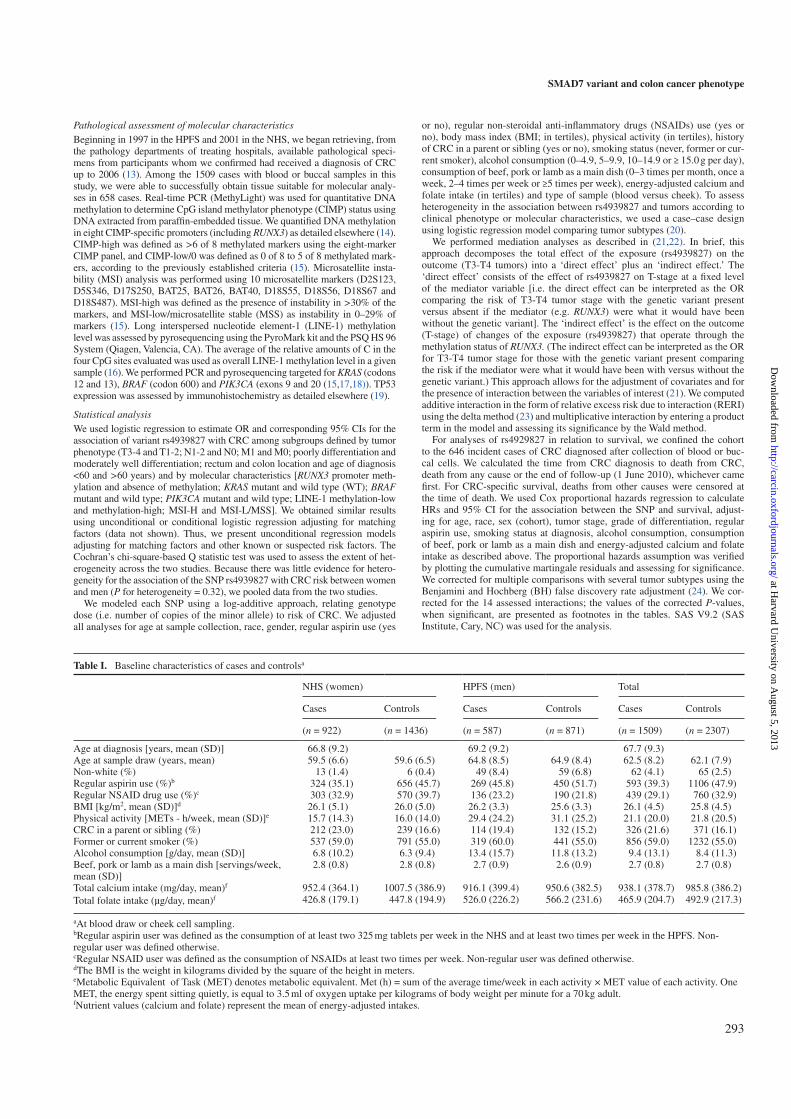
Pathological assessment of molecular characteristics
Beginning in 1997 in the HPFS and 2001 in the NHS, we began retrieving, from the pathology departments of treating hospitals, available pathological speci-mens from participants whom we confirmed had received a diagnosis of CRC up to 2006 (13). Among the 1509 cases with blood or buccal samples in this study, we were able to successfully obtain tissue suitable for molecular analy-ses in 658 cases. Real-time PCR (MethyLight) was used for quantitative DNA methylation to determine CpG island methylator phenotype (CIMP) status using DNA extracted from paraffin-embedded tissue. We quantified DNA methylation in eight CIMP-specific promoters (including RUNX3) as detailed elsewhere (14). CIMP-high was defined as >6 of 8 methylated markers using the eight-marker CIMP panel, and CIMP-low/0 was defined as 0 of 8 to 5 of 8 methylated mark-ers, according to the previously established criteria (15). Microsatellite insta-bility (MSI) analysis was performed using 10 microsatellite markers (D2S123, D5S346, D17S250, BAT25, BAT26, BAT40, D18S55, D18S56, D18S67 and D18S487). MSI-high was defined as the presence of instability in >30% of the markers, and MSI-low/microsatellite stable (MSS) as instability in 0–29% of markers (15). Long interspersed nucleotide element-1 (LINE-1) methylation level was assessed by pyrosequencing using the PyroMark kit and the PSQ HS 96 System (Qiagen, Valencia, CA). The average of the relative amounts of C in the four CpG sites evaluated was used as overall LINE-1 methylation level in a given sample (16). We performed PCR and pyrosequencing targeted for KRAS (codons 12 and 13), BRAF (codon 600) and PIK3CA (exons 9 and 20 (15,17,18)). TP53 expression was assessed by immunohistochemistry as detailed elsewhere (19).
Statistical analysis
We used logistic regression to estimate OR and corresponding 95% CIs for the association of variant rs4939827 with CRC among subgroups defined by tumor phenotype (T3-4 and T1-2; N1-2 and N0; M1 and M0; poorly differentiation and moderately well differentiation; rectum and colon location and age of diagnosis <60 and >60 years) and by molecular characteristics [RUNX3 promoter meth-ylation and absence of methylation; KRAS mutant and wild type (WT); BRAF mutant and wild type; PIK3CA mutant and wild type; LINE-1 methylation-low and methylation-high; MSI-H and MSI-L/MSS]. We obtained similar results using unconditional or conditional logistic regression adjusting for matching factors (data not shown). Thus, we present unconditional regression models adjusting for matching factors and other known or suspected risk factors. The Cochran’s chi-square-based Q statistic test was used to assess the extent of het-erogeneity across the two studies. Because there was little evidence for hetero-geneity for the association of the SNP rs4939827 with CRC risk between women and men (P for heterogeneity = 0.32), we pooled data from the two studies.
We modeled each SNP using a log-additive approach, relating genotype dose (i.e. number of copies of the minor allele) to risk of CRC. We adjusted all analyses for age at sample collection, race, gender, regular aspirin use (yes
or no), regular non-steroidal anti-inflammatory drugs (NSAIDs) use (yes or no), body mass index (BMI; in tertiles), physical activity (in tertiles), history of CRC in a parent or sibling (yes or no), smoking status (never, former or cur-rent smoker), alcohol consumption (0–4.9, 5–9.9, 10–14.9 or ≥ 15.0 g per day), consumption of beef, pork or lamb as a main dish (0–3 times per month, once a week, 2–4 times per week or ≥5 times per week), energy-adjusted calcium and folate intake (in tertiles) and type of sample (blood versus cheek). To assess heterogeneity in the association between rs4939827 and tumors according to clinical phenotype or molecular characteristics, we used a case–case design using logistic regression model comparing tumor subtypes (20).
We performed mediation analyses as described in (21,22). In brief, this approach decomposes the total effect of the exposure (rs4939827) on the outcome (T3-T4 tumors) into a ‘direct effect’ plus an ‘indirect effect.’ The ‘direct effect’ consists of the effect of rs4939827 on T-stage at a fixed level of the mediator variable [i.e. the direct effect can be interpreted as the OR comparing the risk of T3-T4 tumor stage with the genetic variant present versus absent if the mediator (e.g. RUNX3) were what it would have been without the genetic variant]. The ‘indirect effect’ is the effect on the outcome (T-stage) of changes of the exposure (rs4939827) that operate through the methylation status of RUNX3. (The indirect effect can be interpreted as the OR for T3-T4 tumor stage for those with the genetic variant present comparing the risk if the mediator were what it would have been with versus without the genetic variant.) This approach allows for the adjustment of covariates and for the presence of interaction between the variables of interest (21). We computed additive interaction in the form of relative excess risk due to interaction (RERI) using the delta method (23) and multiplicative interaction by entering a product term in the model and assessing its significance by the Wald method.
For analyses of rs4929827 in relation to survival, we confined the cohort to the 646 incident cases of CRC diagnosed after collection of blood or buc-cal cells. We calculated the time from CRC diagnosis to death from CRC, death from any cause or the end of follow-up (1 June 2010), whichever came first. For CRC-specific survival, deaths from other causes were censored at the time of death. We used Cox proportional hazards regression to calculate HRs and 95% CI for the association between the SNP and survival, adjust-ing for age, race, sex (cohort), tumor stage, grade of differentiation, regular aspirin use, smoking status at diagnosis, alcohol consumption, consumption of beef, pork or lamb as a main dish and energy-adjusted calcium and folate intake as described above. The proportional hazards assumption was verified by plotting the cumulative martingale residuals and assessing for significance. We corrected for multiple comparisons with several tumor subtypes using the Benjamini and Hochberg (BH) false discovery rate adjustment (24). We cor-rected for the 14 assessed interactions; the values of the corrected P-values, when significant, are presented as footnotes in the tables. SAS V9.2 (SAS Institute, Cary, NC) was used for the analysis.
Table I. Baseline characteristics of cases and controlsa
NHS (women) HPFS (men) Total
Cases Controls Cases Controls Cases Controls
(n = 922) (n = 1436) (n = 587) (n = 871) (n = 1509) (n = 2307)
Age at diagnosis [years, mean (SD)] 66.8 (9.2) 69.2 (9.2) 67.7 (9.3)Age at sample draw (years, mean) 59.5 (6.6) 59.6 (6.5) 64.8 (8.5) 64.9 (8.4) 62.5 (8.2) 62.1 (7.9)Non-white (%) 13 (1.4) 6 (0.4) 49 (8.4) 59 (6.8) 62 (4.1) 65 (2.5)Regular aspirin use (%)b 324 (35.1) 656 (45.7) 269 (45.8) 450 (51.7) 593 (39.3) 1106 (47.9)Regular NSAID drug use (%)c 303 (32.9) 570 (39.7) 136 (23.2) 190 (21.8) 439 (29.1) 760 (32.9)BMI [kg/m2, mean (SD)]d 26.1 (5.1) 26.0 (5.0) 26.2 (3.3) 25.6 (3.3) 26.1 (4.5) 25.8 (4.5)Physical activity [METs - h/week, mean (SD)]e 15.7 (14.3) 16.0 (14.0) 29.4 (24.2) 31.1 (25.2) 21.1 (20.0) 21.8 (20.5)CRC in a parent or sibling (%) 212 (23.0) 239 (16.6) 114 (19.4) 132 (15.2) 326 (21.6) 371 (16.1)Former or current smoker (%) 537 (59.0) 791 (55.0) 319 (60.0) 441 (55.0) 856 (59.0) 1232 (55.0)Alcohol consumption [g/day, mean (SD)] 6.8 (10.2) 6.3 (9.4) 13.4 (15.7) 11.8 (13.2) 9.4 (13.1) 8.4 (11.3)Beef, pork or lamb as a main dish [servings/week, mean (SD)]
2.8 (0.8) 2.8 (0.8) 2.7 (0.9) 2.6 (0.9) 2.7 (0.8) 2.7 (0.8)
Total calcium intake (mg/day, mean)f 952.4 (364.1) 1007.5 (386.9) 916.1 (399.4) 950.6 (382.5) 938.1 (378.7) 985.8 (386.2)Total folate intake (µg/day, mean)f 426.8 (179.1) 447.8 (194.9) 526.0 (226.2) 566.2 (231.6) 465.9 (204.7) 492.9 (217.3)
aAt blood draw or cheek cell sampling. bRegular aspirin user was defined as the consumption of at least two 325 mg tablets per week in the NHS and at least two times per week in the HPFS. Non-regular user was defined otherwise.cRegular NSAID user was defined as the consumption of NSAIDs at least two times per week. Non-regular user was defined otherwise.dThe BMI is the weight in kilograms divided by the square of the height in meters.eMetabolic Equivalent of Task (MET) denotes metabolic equivalent. Met (h) = sum of the average time/week in each activity × MET value of each activity. One MET, the energy spent sitting quietly, is equal to 3.5 ml of oxygen uptake per kilograms of body weight per minute for a 70 kg adult.fNutrient values (calcium and folate) represent the mean of energy-adjusted intakes.
SMAD7 variant and colon cancer phenotype
293
at Harvard U
niversity on August 5, 2013
http://carcin.oxfordjournals.org/D
ownloaded from
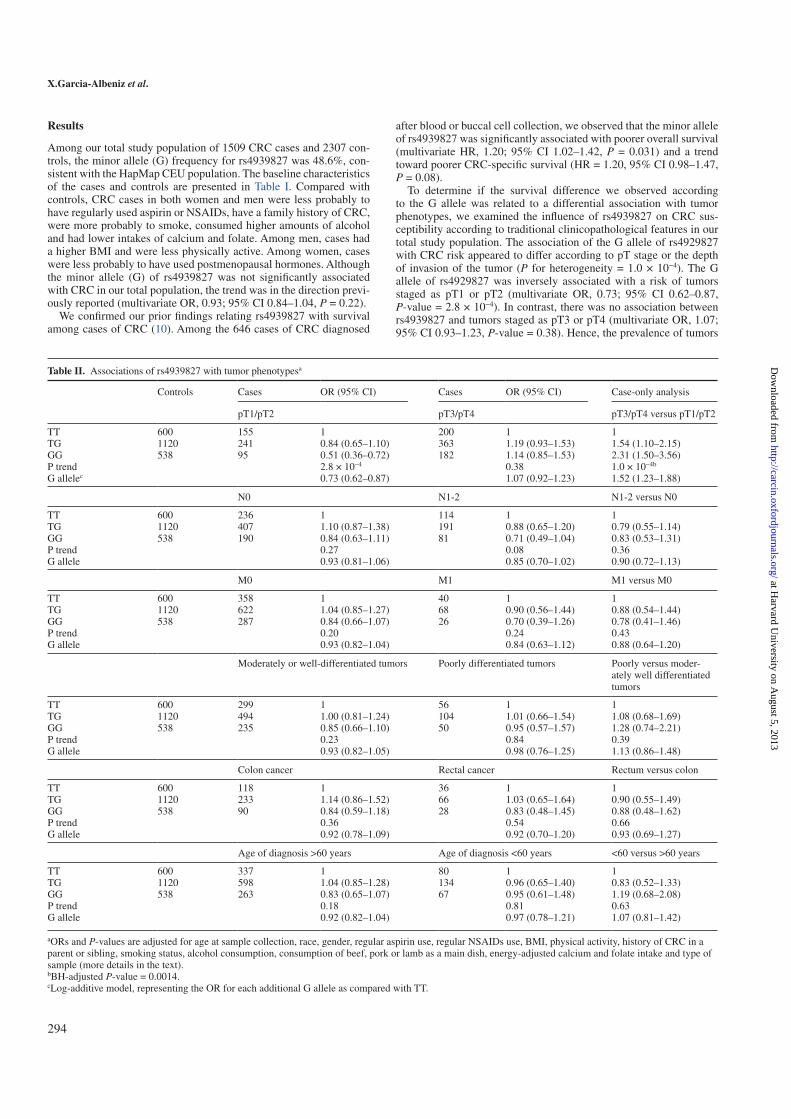
Results
Among our total study population of 1509 CRC cases and 2307 con-trols, the minor allele (G) frequency for rs4939827 was 48.6%, con-sistent with the HapMap CEU population. The baseline characteristics of the cases and controls are presented in Table I. Compared with controls, CRC cases in both women and men were less probably to have regularly used aspirin or NSAIDs, have a family history of CRC, were more probably to smoke, consumed higher amounts of alcohol and had lower intakes of calcium and folate. Among men, cases had a higher BMI and were less physically active. Among women, cases were less probably to have used postmenopausal hormones. Although the minor allele (G) of rs4939827 was not significantly associated with CRC in our total population, the trend was in the direction previ-ously reported (multivariate OR, 0.93; 95% CI 0.84–1.04, P = 0.22).
We confirmed our prior findings relating rs4939827 with survival among cases of CRC (10). Among the 646 cases of CRC diagnosed
after blood or buccal cell collection, we observed that the minor allele of rs4939827 was significantly associated with poorer overall survival (multivariate HR, 1.20; 95% CI 1.02–1.42, P = 0.031) and a trend toward poorer CRC-specific survival (HR = 1.20, 95% CI 0.98–1.47, P = 0.08).
To determine if the survival difference we observed according to the G allele was related to a differential association with tumor phenotypes, we examined the influence of rs4939827 on CRC sus-ceptibility according to traditional clinicopathological features in our total study population. The association of the G allele of rs4929827 with CRC risk appeared to differ according to pT stage or the depth of invasion of the tumor (P for heterogeneity = 1.0 × 10⁻⁴). The G allele of rs4929827 was inversely associated with a risk of tumors staged as pT1 or pT2 (multivariate OR, 0.73; 95% CI 0.62–0.87, P-value = 2.8 × 10⁻⁴). In contrast, there was no association between rs4939827 and tumors staged as pT3 or pT4 (multivariate OR, 1.07; 95% CI 0.93–1.23, P-value = 0.38). Hence, the prevalence of tumors
Table II. Associations of rs4939827 with tumor phenotypesa
Controls Cases OR (95% CI) Cases OR (95% CI) Case-only analysis
pT1/pT2 pT3/pT4 pT3/pT4 versus pT1/pT2
TT 600 155 1 200 1 1TG 1120 241 0.84 (0.65–1.10) 363 1.19 (0.93–1.53) 1.54 (1.10–2.15)GG 538 95 0.51 (0.36–0.72) 182 1.14 (0.85–1.53) 2.31 (1.50–3.56)P trend 2.8 × 10⁻⁴ 0.38 1.0 × 10⁻⁴b
G allelec 0.73 (0.62–0.87) 1.07 (0.92–1.23) 1.52 (1.23–1.88)
N0 N1-2 N1-2 versus N0
TT 600 236 1 114 1 1TG 1120 407 1.10 (0.87–1.38) 191 0.88 (0.65–1.20) 0.79 (0.55–1.14)GG 538 190 0.84 (0.63–1.11) 81 0.71 (0.49–1.04) 0.83 (0.53–1.31)P trend 0.27 0.08 0.36G allele 0.93 (0.81–1.06) 0.85 (0.70–1.02) 0.90 (0.72–1.13)
M0 M1 M1 versus M0
TT 600 358 1 40 1 1TG 1120 622 1.04 (0.85–1.27) 68 0.90 (0.56–1.44) 0.88 (0.54–1.44)GG 538 287 0.84 (0.66–1.07) 26 0.70 (0.39–1.26) 0.78 (0.41–1.46)P trend 0.20 0.24 0.43G allele 0.93 (0.82–1.04) 0.84 (0.63–1.12) 0.88 (0.64–1.20)
Moderately or well-differentiated tumors Poorly differentiated tumors Poorly versus moder-ately well differentiated tumors
TT 600 299 1 56 1 1TG 1120 494 1.00 (0.81–1.24) 104 1.01 (0.66–1.54) 1.08 (0.68–1.69)GG 538 235 0.85 (0.66–1.10) 50 0.95 (0.57–1.57) 1.28 (0.74–2.21)P trend 0.23 0.84 0.39G allele 0.93 (0.82–1.05) 0.98 (0.76–1.25) 1.13 (0.86–1.48)
Colon cancer Rectal cancer Rectum versus colon
TT 600 118 1 36 1 1TG 1120 233 1.14 (0.86–1.52) 66 1.03 (0.65–1.64) 0.90 (0.55–1.49)GG 538 90 0.84 (0.59–1.18) 28 0.83 (0.48–1.45) 0.88 (0.48–1.62)P trend 0.36 0.54 0.66G allele 0.92 (0.78–1.09) 0.92 (0.70–1.20) 0.93 (0.69–1.27)
Age of diagnosis >60 years Age of diagnosis <60 years <60 versus >60 years
TT 600 337 1 80 1 1TG 1120 598 1.04 (0.85–1.28) 134 0.96 (0.65–1.40) 0.83 (0.52–1.33)GG 538 263 0.83 (0.65–1.07) 67 0.95 (0.61–1.48) 1.19 (0.68–2.08)P trend 0.18 0.81 0.63G allele 0.92 (0.82–1.04) 0.97 (0.78–1.21) 1.07 (0.81–1.42)
aORs and P-values are adjusted for age at sample collection, race, gender, regular aspirin use, regular NSAIDs use, BMI, physical activity, history of CRC in a parent or sibling, smoking status, alcohol consumption, consumption of beef, pork or lamb as a main dish, energy-adjusted calcium and folate intake and type of sample (more details in the text). bBH-adjusted P-value = 0.0014.cLog-additive model, representing the OR for each additional G allele as compared with TT.
X.Garcia-Albeniz et al.
294
at Harvard U
niversity on August 5, 2013
http://carcin.oxfordjournals.org/D
ownloaded from
with pT3-4 stage was 65.7% for cases of CRC with two variant alleles, 60.1% for cases of CRC with one variant allele, compared with 56.3% for cases of CRC with no variant alleles of rs4939827 (Mantel–Haenszel P-value = 0.018). The rs4939827 SNP was not sig-nificantly differentially associated with any of other evaluated clinical and pathological phenotypes, including nodal status, presence of dis-tant metastases, tumor grade, anatomic location and age at diagnosis (Table II).
We also examined rs4939827 genotype according to molecu-lar subtypes among 658 cases for whom we had available tumor tissue data. Because rs4939827 is located in an intronic region of SMAD7, which modulates TGFB1 signaling, we evaluated rs4939827 according to promoter methylation of the RUNX3 gene, which is related to the TGFB1 pathway. The G allele of rs4939827 was associated with a lower CRC risk in tumors without meth-ylation of RUNX3 (multivariate OR, 0.84; 95% CI 0.71–0.99, P = 0.035). In contrast, there was a suggestive, although not sta-tistically significant, increased risk of tumors with methylation of RUNX3 associated with the minor allele of rs4939827 (multivari-ate OR, 1.27; 95% CI 0.94–1.74, P = 0.12) (Table III). The differ-ence between rs4939827 and risk of tumors with methylation of RUNX3 compared with tumors without methylation of RUNX3 was statistically significant after adjustment for multiple comparisons (P for heterogeneity = 0.0053, BH-corrected P-value = 0.037). The risk of CRC associated with rs4939827 also appeared to be modi-fied by BRAF mutational status. However, the P for heterogeneity was 0.021, non-significant after adjustment for multiple compari-sons (BH-corrected P-value = 0.10). The association between the rs4939827 SNP and CRC did not significantly differ according to any of the other markers examined, including CIMP status, LINE-1 methylation, KRAS mutation, PIK3CA mutation, MSI status and TP53 mutation.
RUNX3 methylation was associated with a higher risk of pT3 and pT4 tumors (multivariate OR, 2.12; 95% CI 1.18–3.80, P = 0.012) even after adjusting for rs4939827. The multivariate ORs estimating the indirect effect of rs4939827 on risk of pT3 and pT4 tumors was 1.05 (95% CI 0.96–1.15, P = 0.32) for one variant allele and 1.50 (95% CI 0.44–5.10, P = 0.51) for two variant alleles (Table IV). Given the width of the CIs, we cannot exclude a possible indirect effect of rs4939827 through RUNX3 methylation on pT stage. The multivari-ate ORs that estimate the direct effect of rs4939827 were 1.96 (95% CI 1.18–3.25, P-value = 0.009) for one variant allele and 4.46 (95% CI 1.19–16.6, P-value = 0.038) for two variant alleles. There was no evidence of interaction between the SMAD7 variant rs4939827 and RUNX3 methylation in either the additive scale (RERI = 0.48; 95% CI −1.42 to 2.37, P-value = 0.62) or multiplicative scale (OR, 0.93; 95% CI 0.39–2.19, P-value = 0.87).
Discussion
In this large study of 1509 cases of CRC and 2307 controls nested in two prospective cohorts, the CRC-susceptibility locus SMAD7 intronic rs4939827 was associated with a lower risk of CRCs with pT1 and pT2 stage but not pT3 and pT4 stage. Hence, among indi-viduals diagnosed with CRC, those with at least one G allele had 1.5-fold higher odds of having a pT3 or pT4 tumor compared with a pT1 or pT2 tumor. This finding may explain in part observed associations of the G allele of rs4939827 with lower overall risk of incident CRC (9), but worsened survival after diagnosis (10,25).
This study represents a strategy of investigations, which has been recently termed ‘molecular pathological epidemiology’ (MPE) (20,26). MPE is conceptually based on inherent heterogeneity of a disease, which is typically regarded as a single entity in traditional epidemiology studies, including GWAS (20,26). MPE can decipher how risk factors are associated with specific alterations in molecular pathways in cancer. Moreover, the MPE design can be used to help shed insight into the function of susceptibility variants identified by GWAS based upon their association with specific molecular subtypes of CRC (20).
The seemingly contrary associations of this SNP in SMAD7 with decreased risk of incident disease but poorer outcomes in patients with established disease may be due to SMAD7’s known involvement in modulating the TGFB1 pathway. In normal epithelium, TGFB1 functions as a tumor suppressor through induction of cell arrest and inhibition of cell proliferation. However, once cells are resistant to TGFB1-mediated proliferative inhibition (i.e. in established tumors), TGFB1 appears to promote metastasis by enhancing angiogenesis and extracellular matrix disruption and inhibiting infiltrating tumor immune cells. A role for rs4939827 in the TGFB1 pathway is further supported by our findings of significant association of rs4939827 with RUNX3 methylation status in the tumors. RUNX3 is a Runt domain transcription factor 3 involved in TGFB1 signaling by interaction with SMAD transcription factors and is considered a suppressor of solid tumors. The RUNX3 promoter is commonly aberrantly methylated in a CpG island in CRC (27–29), leading to gene inactivation.
Differential methylation of RUNX3 according to rs498327 could plausibly explain the worsened survival among individuals with CRC who have a variant G allele (30). In addition to TGFB1, RUNX3 is involved in WNT regulation by forming a ternary complex with TCF4 and CTNNB1 (β-catenin) (31). Both TGFB1 and WNT signaling are involved in the induction of epithelial-mesenchymal transition, a process that mediates invasion and metastasis in CRC. However, our mediation analysis does not suggest that the association between rs4939827 on risk of CRC according to pT stage is primarily related to RUNX3. Nonetheless, the mediation analysis should be interpreted in the context of some limitations (22), including the assumption of a lack of other, strong unmeasured confounders.
Previous studies of CRC-susceptibility variants and tumor pheno-type have observed only a few significant differential associations between rs4939827 and CRC according to other clinical phenotype or molecular features. A case-only analysis of 1531 cases did not find any association between this variant and pT3-4 compared with pT1–2-staged tumors (P = 0.94) (32). In a study of 1096 patients from the Epicolon I cohort (33), the G allele of rs4939827 was significantly associated with well-differentiated tumors under a log-additive model (HR, 0.67; P-value = 0.027). However, this association was not repli-cated in a validation cohort, EPICOLON II (34). Neither of these two studies found any association between rs4939827 and other tumor features, including grade of differentiation, stage or tumor site. On the other hand, two studies have observed that the G allele of rs4939827 increased the risk of harboring a rectal tumor as compared with colon tumors (35,36).
We also examined several other molecular markers other than RUNX3 and did not observe strong differences in the association with rs4939827. Our findings are consistent with Slattery et al., who did not observe significant heterogeneity in associations of rs4939827 with CIMP status, MSI, KRAS or p53 mutational status (36). Nonetheless, in our study, it is notable that BRAF-status did appear to be differen-tially associated with rs4939827, despite the lack of a significant P for heterogeneity after correction for multiple comparisons. An interplay between TGFB1 and BRAF mutations is biologically plausible (37), and BRAF mutations are strongly associated with CRC prognosis. Thus, given the low frequency of BRAF mutations in CRC, it is pos-sible that statistically significant heterogeneity may be evident with a larger sample size.
Our study has several strengths. First, we used prospectively col-lected, biennially updated, detailed data on CRC risk factors over long-term follow-up. This permitted us to account for the main poten-tial confounders of our associations. Second, our case-control study was nested within two large well-characterized cohorts within which matched controls were selected from the same cohort from which the case developed, minimizing the likelihood of population stratification or selection bias. Third, our findings were consistent between two independent cohorts. Moreover, we have previously demonstrated a consistent association between rs498327 and CRC and overall sur-vival that has been validated by results in other populations (10). Last, among a large number of participants, we had germline DNA as well as available tumor tissue to examine the expression of molecular
SMAD7 variant and colon cancer phenotype
295
at Harvard U
niversity on August 5, 2013
http://carcin.oxfordjournals.org/D
ownloaded from
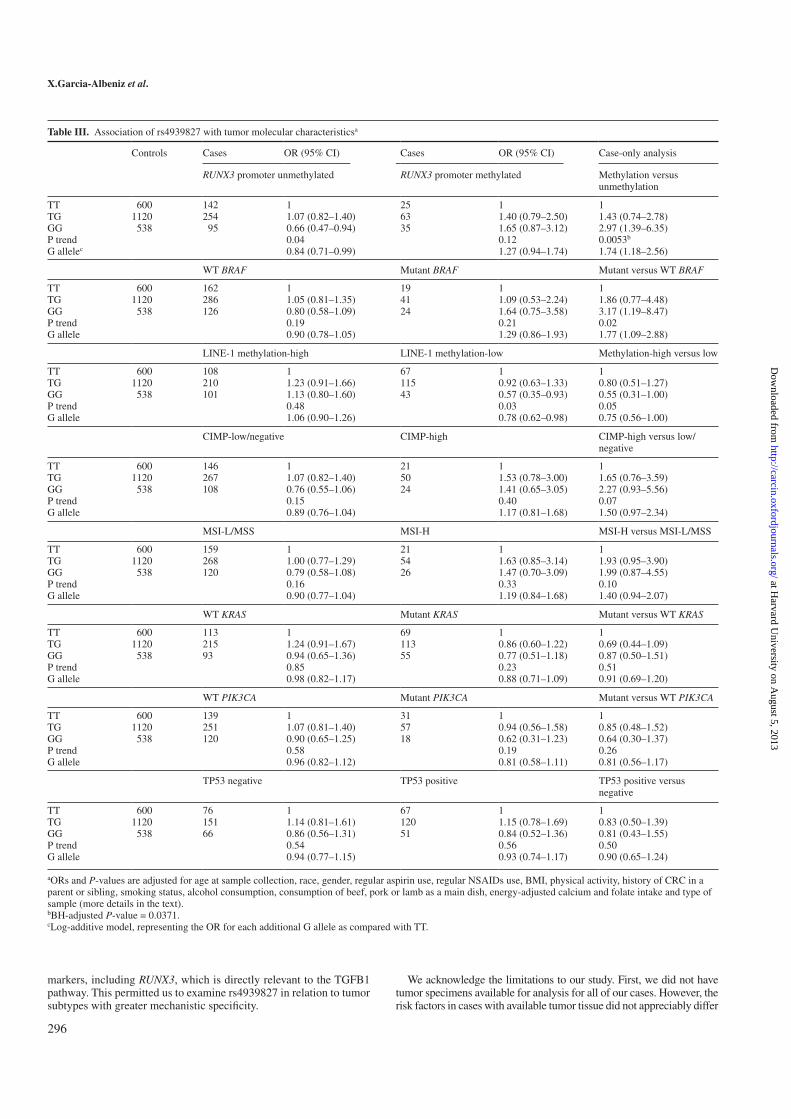
markers, including RUNX3, which is directly relevant to the TGFB1 pathway. This permitted us to examine rs4939827 in relation to tumor subtypes with greater mechanistic specificity.
We acknowledge the limitations to our study. First, we did not have tumor specimens available for analysis for all of our cases. However, the risk factors in cases with available tumor tissue did not appreciably differ
Table III. Association of rs4939827 with tumor molecular characteristicsa
Controls Cases OR (95% CI) Cases OR (95% CI) Case-only analysis
RUNX3 promoter unmethylated RUNX3 promoter methylated Methylation versus unmethylation
TT 600 142 1 25 1 1TG 1120 254 1.07 (0.82–1.40) 63 1.40 (0.79–2.50) 1.43 (0.74–2.78)GG 538 95 0.66 (0.47–0.94) 35 1.65 (0.87–3.12) 2.97 (1.39–6.35)P trend 0.04 0.12 0.0053b
G allelec 0.84 (0.71–0.99) 1.27 (0.94–1.74) 1.74 (1.18–2.56)
WT BRAF Mutant BRAF Mutant versus WT BRAF
TT 600 162 1 19 1 1TG 1120 286 1.05 (0.81–1.35) 41 1.09 (0.53–2.24) 1.86 (0.77–4.48)GG 538 126 0.80 (0.58–1.09) 24 1.64 (0.75–3.58) 3.17 (1.19–8.47)P trend 0.19 0.21 0.02G allele 0.90 (0.78–1.05) 1.29 (0.86–1.93) 1.77 (1.09–2.88)
LINE-1 methylation-high LINE-1 methylation-low Methylation-high versus low
TT 600 108 1 67 1 1TG 1120 210 1.23 (0.91–1.66) 115 0.92 (0.63–1.33) 0.80 (0.51–1.27)GG 538 101 1.13 (0.80–1.60) 43 0.57 (0.35–0.93) 0.55 (0.31–1.00)P trend 0.48 0.03 0.05G allele 1.06 (0.90–1.26) 0.78 (0.62–0.98) 0.75 (0.56–1.00)
CIMP-low/negative CIMP-high CIMP-high versus low/negative
TT 600 146 1 21 1 1TG 1120 267 1.07 (0.82–1.40) 50 1.53 (0.78–3.00) 1.65 (0.76–3.59)GG 538 108 0.76 (0.55–1.06) 24 1.41 (0.65–3.05) 2.27 (0.93–5.56)P trend 0.15 0.40 0.07G allele 0.89 (0.76–1.04) 1.17 (0.81–1.68) 1.50 (0.97–2.34)
MSI-L/MSS MSI-H MSI-H versus MSI-L/MSS
TT 600 159 1 21 1 1TG 1120 268 1.00 (0.77–1.29) 54 1.63 (0.85–3.14) 1.93 (0.95–3.90)GG 538 120 0.79 (0.58–1.08) 26 1.47 (0.70–3.09) 1.99 (0.87–4.55)P trend 0.16 0.33 0.10G allele 0.90 (0.77–1.04) 1.19 (0.84–1.68) 1.40 (0.94–2.07)
WT KRAS Mutant KRAS Mutant versus WT KRAS
TT 600 113 1 69 1 1TG 1120 215 1.24 (0.91–1.67) 113 0.86 (0.60–1.22) 0.69 (0.44–1.09)GG 538 93 0.94 (0.65–1.36) 55 0.77 (0.51–1.18) 0.87 (0.50–1.51)P trend 0.85 0.23 0.51G allele 0.98 (0.82–1.17) 0.88 (0.71–1.09) 0.91 (0.69–1.20)
WT PIK3CA Mutant PIK3CA Mutant versus WT PIK3CA
TT 600 139 1 31 1 1TG 1120 251 1.07 (0.81–1.40) 57 0.94 (0.56–1.58) 0.85 (0.48–1.52)GG 538 120 0.90 (0.65–1.25) 18 0.62 (0.31–1.23) 0.64 (0.30–1.37)P trend 0.58 0.19 0.26G allele 0.96 (0.82–1.12) 0.81 (0.58–1.11) 0.81 (0.56–1.17)
TP53 negative TP53 positive TP53 positive versus negative
TT 600 76 1 67 1 1TG 1120 151 1.14 (0.81–1.61) 120 1.15 (0.78–1.69) 0.83 (0.50–1.39)GG 538 66 0.86 (0.56–1.31) 51 0.84 (0.52–1.36) 0.81 (0.43–1.55)P trend 0.54 0.56 0.50G allele 0.94 (0.77–1.15) 0.93 (0.74–1.17) 0.90 (0.65–1.24)
aORs and P-values are adjusted for age at sample collection, race, gender, regular aspirin use, regular NSAIDs use, BMI, physical activity, history of CRC in a parent or sibling, smoking status, alcohol consumption, consumption of beef, pork or lamb as a main dish, energy-adjusted calcium and folate intake and type of sample (more details in the text).bBH-adjusted P-value = 0.0371.cLog-additive model, representing the OR for each additional G allele as compared with TT.
X.Garcia-Albeniz et al.
296
at Harvard U
niversity on August 5, 2013
http://carcin.oxfordjournals.org/D
ownloaded from
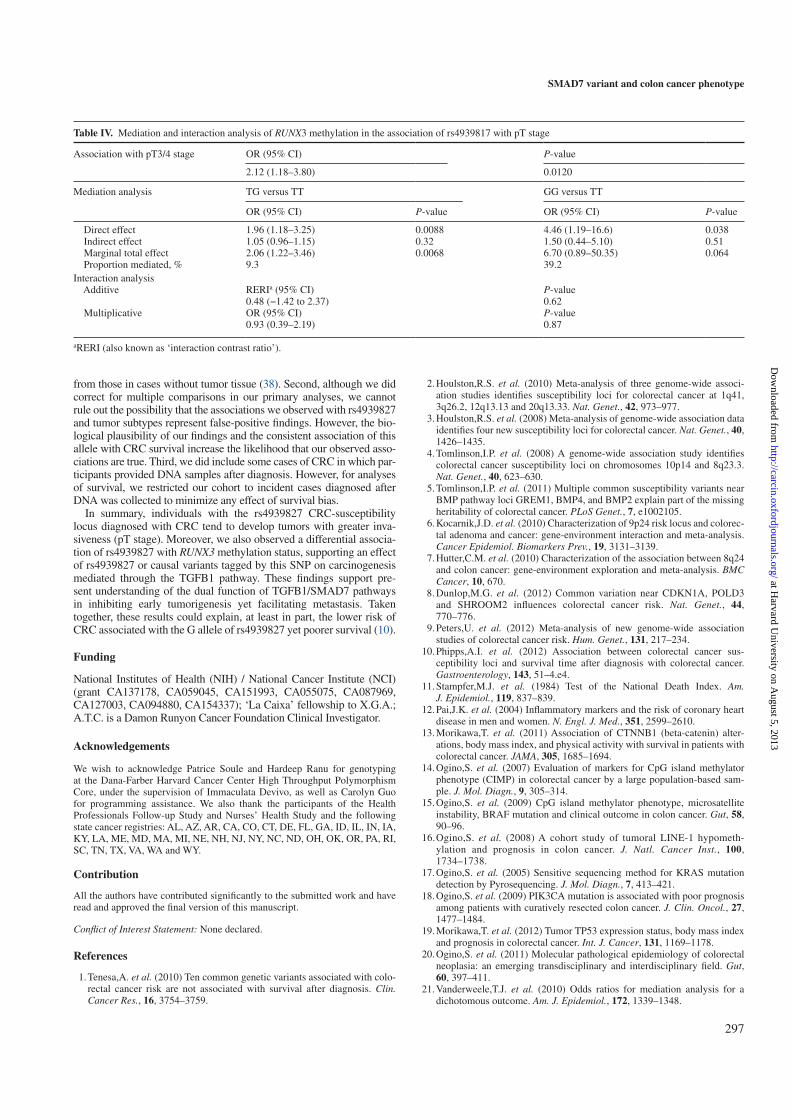
from those in cases without tumor tissue (38). Second, although we did correct for multiple comparisons in our primary analyses, we cannot rule out the possibility that the associations we observed with rs4939827 and tumor subtypes represent false-positive findings. However, the bio-logical plausibility of our findings and the consistent association of this allele with CRC survival increase the likelihood that our observed asso-ciations are true. Third, we did include some cases of CRC in which par-ticipants provided DNA samples after diagnosis. However, for analyses of survival, we restricted our cohort to incident cases diagnosed after DNA was collected to minimize any effect of survival bias.
In summary, individuals with the rs4939827 CRC-susceptibility locus diagnosed with CRC tend to develop tumors with greater inva-siveness (pT stage). Moreover, we also observed a differential associa-tion of rs4939827 with RUNX3 methylation status, supporting an effect of rs4939827 or causal variants tagged by this SNP on carcinogenesis mediated through the TGFB1 pathway. These findings support pre-sent understanding of the dual function of TGFB1/SMAD7 pathways in inhibiting early tumorigenesis yet facilitating metastasis. Taken together, these results could explain, at least in part, the lower risk of CRC associated with the G allele of rs4939827 yet poorer survival (10).
Funding
National Institutes of Health (NIH) / National Cancer Institute (NCI) (grant CA137178, CA059045, CA151993, CA055075, CA087969, CA127003, CA094880, CA154337); ‘La Caixa’ fellowship to X.G.A.; A.T.C. is a Damon Runyon Cancer Foundation Clinical Investigator.
Acknowledgements
We wish to acknowledge Patrice Soule and Hardeep Ranu for genotyping at the Dana-Farber Harvard Cancer Center High Throughput Polymorphism Core, under the supervision of Immaculata Devivo, as well as Carolyn Guo for programming assistance. We also thank the participants of the Health Professionals Follow-up Study and Nurses’ Health Study and the following state cancer registries: AL, AZ, AR, CA, CO, CT, DE, FL, GA, ID, IL, IN, IA, KY, LA, ME, MD, MA, MI, NE, NH, NJ, NY, NC, ND, OH, OK, OR, PA, RI, SC, TN, TX, VA, WA and WY.
Contribution
All the authors have contributed significantly to the submitted work and have read and approved the final version of this manuscript.
Conflict of Interest Statement: None declared.
References
1. Tenesa,A. et al. (2010) Ten common genetic variants associated with colo-rectal cancer risk are not associated with survival after diagnosis. Clin. Cancer Res., 16, 3754–3759.
2. Houlston,R.S. et al. (2010) Meta-analysis of three genome-wide associ-ation studies identifies susceptibility loci for colorectal cancer at 1q41, 3q26.2, 12q13.13 and 20q13.33. Nat. Genet., 42, 973–977.
3. Houlston,R.S. et al. (2008) Meta-analysis of genome-wide association data identifies four new susceptibility loci for colorectal cancer. Nat. Genet., 40, 1426–1435.
4. Tomlinson,I.P. et al. (2008) A genome-wide association study identifies colorectal cancer susceptibility loci on chromosomes 10p14 and 8q23.3. Nat. Genet., 40, 623–630.
5. Tomlinson,I.P. et al. (2011) Multiple common susceptibility variants near BMP pathway loci GREM1, BMP4, and BMP2 explain part of the missing heritability of colorectal cancer. PLoS Genet., 7, e1002105.
6. Kocarnik,J.D. et al. (2010) Characterization of 9p24 risk locus and colorec-tal adenoma and cancer: gene-environment interaction and meta-analysis. Cancer Epidemiol. Biomarkers Prev., 19, 3131–3139.
7. Hutter,C.M. et al. (2010) Characterization of the association between 8q24 and colon cancer: gene-environment exploration and meta-analysis. BMC Cancer, 10, 670.
8. Dunlop,M.G. et al. (2012) Common variation near CDKN1A, POLD3 and SHROOM2 influences colorectal cancer risk. Nat. Genet., 44, 770–776.
9. Peters,U. et al. (2012) Meta-analysis of new genome-wide association studies of colorectal cancer risk. Hum. Genet., 131, 217–234.
10. Phipps,A.I. et al. (2012) Association between colorectal cancer sus-ceptibility loci and survival time after diagnosis with colorectal cancer. Gastroenterology, 143, 51–4.e4.
11. Stampfer,M.J. et al. (1984) Test of the National Death Index. Am. J. Epidemiol., 119, 837–839.
12. Pai,J.K. et al. (2004) Inflammatory markers and the risk of coronary heart disease in men and women. N. Engl. J. Med., 351, 2599–2610.
13. Morikawa,T. et al. (2011) Association of CTNNB1 (beta-catenin) alter-ations, body mass index, and physical activity with survival in patients with colorectal cancer. JAMA, 305, 1685–1694.
14. Ogino,S. et al. (2007) Evaluation of markers for CpG island methylator phenotype (CIMP) in colorectal cancer by a large population-based sam-ple. J. Mol. Diagn., 9, 305–314.
15. Ogino,S. et al. (2009) CpG island methylator phenotype, microsatellite instability, BRAF mutation and clinical outcome in colon cancer. Gut, 58, 90–96.
16. Ogino,S. et al. (2008) A cohort study of tumoral LINE-1 hypometh-ylation and prognosis in colon cancer. J. Natl. Cancer Inst., 100, 1734–1738.
17. Ogino,S. et al. (2005) Sensitive sequencing method for KRAS mutation detection by Pyrosequencing. J. Mol. Diagn., 7, 413–421.
18. Ogino,S. et al. (2009) PIK3CA mutation is associated with poor prognosis among patients with curatively resected colon cancer. J. Clin. Oncol., 27, 1477–1484.
19. Morikawa,T. et al. (2012) Tumor TP53 expression status, body mass index and prognosis in colorectal cancer. Int. J. Cancer, 131, 1169–1178.
20. Ogino,S. et al. (2011) Molecular pathological epidemiology of colorectal neoplasia: an emerging transdisciplinary and interdisciplinary field. Gut, 60, 397–411.
21. Vanderweele,T.J. et al. (2010) Odds ratios for mediation analysis for a dichotomous outcome. Am. J. Epidemiol., 172, 1339–1348.
Table IV. Mediation and interaction analysis of RUNX3 methylation in the association of rs4939817 with pT stage
Association with pT3/4 stage OR (95% CI) P-value
2.12 (1.18–3.80) 0.0120
Mediation analysis TG versus TT GG versus TT
OR (95% CI) P-value OR (95% CI) P-value
Direct effect 1.96 (1.18–3.25) 0.0088 4.46 (1.19–16.6) 0.038 Indirect effect 1.05 (0.96–1.15) 0.32 1.50 (0.44–5.10) 0.51 Marginal total effect 2.06 (1.22–3.46) 0.0068 6.70 (0.89–50.35) 0.064 Proportion mediated, % 9.3 39.2Interaction analysis Additive RERIa (95% CI) P-value
0.48 (−1.42 to 2.37) 0.62 Multiplicative OR (95% CI) P-value
0.93 (0.39–2.19) 0.87
aRERI (also known as ‘interaction contrast ratio’).
SMAD7 variant and colon cancer phenotype
297
at Harvard U
niversity on August 5, 2013
http://carcin.oxfordjournals.org/D
ownloaded from

22. Valeri,L. et al. Mediation analysis allowing for exposure-mediator interac-tions and causal interpretation: theoretical assumptions and implementa-tion with SAS and SPSS macros. Psychol. Methods, in press.
23. Knol,M.J. et al. (2007) Estimating interaction on an additive scale between continuous determinants in a logistic regression model. Int. J. Epidemiol., 36, 1111–1118.
24 Benjamini,Y. et al. (1995) Controlling the false discovery rate: a practical and powerful approach to multiple testing. J. R. Stat. Soc. Series B. Stat. Methodol., 57, 289–300.
25. Passarelli,M.N. et al. (2011) Common colorectal cancer risk variants in SMAD7 are associated with survival among prediagnostic nonsteroidal anti-inflammatory drug users: a population-based study of postmenopausal women. Genes. Chromosomes Cancer, 50, 875–886.
26. Ogino,S. et al. (2010) Lifestyle factors and microsatellite instability in colorectal cancer: the evolving field of molecular pathological epidemi-ology. J. Natl. Cancer Inst., 102, 365–367.
27. Ahlquist,T. et al. (2008) Gene methylation profiles of normal mucosa, and benign and malignant colorectal tumors identify early onset markers. Mol. Cancer, 7, 94.
28. Soong,R. et al. (2009) The expression of RUNX3 in colorectal cancer is asso-ciated with disease stage and patient outcome. Br. J. Cancer, 100, 676–679.
29. Subramaniam,M.M. et al. (2009) RUNX3 inactivation in colorectal pol-yps arising through different pathways of colonic carcinogenesis. Am. J. Gastroenterol., 104, 426–436.
30. Slattery,M.L. et al. (2011) Genetic variation in the transforming growth factor-β signaling pathway and survival after diagnosis with colon and rec-tal cancer. Cancer, 117, 4175–4183.
31. Ito,K. et al. (2008) RUNX3 attenuates beta-catenin/T cell factors in intes-tinal tumorigenesis. Cancer Cell, 14, 226–237.
32. Ghazi,S. et al. (2010) Colorectal cancer susceptibility loci in a population-based study: associations with morphological parameters. Am. J. Pathol., 177, 2688–2693.
33. Piñol,V. et al. (2005) Accuracy of revised Bethesda guidelines, micro-satellite instability, and immunohistochemistry for the identification of patients with hereditary nonpolyposis colorectal cancer. JAMA, 293, 1986–1994.
34. Abulí,A. et al. (2010) Susceptibility genetic variants associated with colo-rectal cancer risk correlate with cancer phenotype. Gastroenterology, 139, 788–96, 796.e1.
35. Lubbe,S.J. et al. (2012) Relationship between 16 susceptibility loci and colorectal cancer phenotype in 3146 patients. Carcinogenesis, 33, 108–112.
36. Slattery,M.L. et al. (2010) Increased risk of colon cancer associated with a genetic polymorphism of SMAD7. Cancer Res., 70, 1479–1485.
37. Fleming,Y.M. et al. (2009) TGF-beta-mediated activation of RhoA signal-ling is required for efficient (V12)HaRas and (V600E)BRAF transform-ation. Oncogene, 28, 983–993.
38. Chan,A.T. et al. (2007) Aspirin and the risk of colorectal can-cer in relation to the expression of COX-2. N. Engl. J. Med., 356, 2131–2142.
Received August 23, 2012; revised October 11, 2012; accepted October 18, 2012
X.Garcia-Albeniz et al.
298
at Harvard U
niversity on August 5, 2013
http://carcin.oxfordjournals.org/D
ownloaded from
4.2 Second publication
4.2 Second publication
Colon cancer cells colonize the lung from established liver metastases through
p38 MAPK signalling and PTHLH
Jelena Urosevic, Xabier Garcia-Albeniz (co-first author), Evarist Planet, Sebastian
Real, Maria Virtudes Cespedes, Marc Guiu, Esther Fernandez, Anna Bellmunt, Sylwia
Gawrzak, Milica Pavlovic, Ramon Mangues, Ignacio Dolado, Francisco M. Barriga,
Cristina Nadal, Nancy Kemeny, Eduard Batlle, Angel R. Nebreda and Roger R. Gomis.
Nature Cell Biology 2014 Jul;16(7):685-94. doi: 10.1038/ncb2977.
4.2.1 Summary
The metastatic pattern of advanced CRC is somehow homogeneous. Liver is the most
frequently affected organ, followed by the lung, peritoneum and bone. We studied
the mechanisms driving the metastatic spread in CRC, focusing in the MAPK path-
way. We developed in vivo a highly metastatic cell line using a KRAS -mutated cell line
(SW620) using an ortothopic xenograft mouse model. First we introduced in these cells
an expression vector for luciferase, which allowed us to monitor the kinetics of emer-
gence of liver metastatic lesions by quantitative bioluminescence imaging. The SW620
luciferase-expressing cells were inoculated into portal circulation of immunodeficient
mice via intrasplenic injection followed by splenectomy, in order to isolate cell popula-
tions that target the liver. Second, the SW620-derived liver metastasis were expanded
in culture and the resulting population (Liver Metastatic derivative, LiM1) were sub-
jected to a second round of in vivo selection, producing the LiM2 cell population that
showed a significant increase in liver and lung metastatic activity. As opposed to the
metastasis originating from the parental cell line that showed wide areas of necrosis,
the LiM2 cells showed a higher stromal response.
Comparative transcriptomic analysis identified 194 genes differentially expressed
between the parental and the highly metastatic cell line. This colon cancer metastatic
(CCM) gene set was contrasted against a cohort of 267 patients with stage I-III CRC,
and those genes that were upregulated were associated with shorter time to relapse.
We investigated the signaling pathways regulating the expression of our set of genes
with increased metastatic capacity. Using KEGG annotated signaling pathways, we
found pathways of nitrogen metabolism, cell adhesion molecules and mitogen-activated
31
4. PUBLICATIONS
protein kinases (MAPKs). These three pathways are relevant in the metastatic pro-
cess by mediating nucleotide synthesis, invasion/migration and modulation of cellular
responses respectively. We focused on the MAPKs given the KRAS -mutated status
of our cell line (and because patients harboring certain mutations in KRAS/BRAF
have fewer therapeutic options that patients without them), finding that the activating
phosphorylation of ERK1/ERK2 was increased, the p38 MAPKs was reduced and the
phosphorylation of JNKs did not change. Downregulation of ERK2 (but not of ERK1)
in the highly metastatic cell line reverted its metastatic capacity to the liver, but not
to the lung in our mice model. We thus hypothesized that the ability to metastasize
the lung by the highly metastatic derivative had to be driven by other mechanism.
The analysis of clinical samples evidenced that tumor biopsies with low phospho-38
MAPK were associated with metastasis to the lung but not to other organs. Treating
mice harboring liver metastasis from the parental cell line with a p38 MAPK specific
inhibitor produced an increase in the percentage of mice with lung metastasis. We
validated this increased capacity to generate lung metastasis with the inhibition of
phospho-38 MAPK using a different cell line (HCT116) and a different experimental
setting (mice intracecum injection). Conversely, activation of the p38 MAPK pathway
by expression of MKK6EE (MKK6 is a MAP kinase-kinase that phosphorylates and
activates p38 MAP kinase) diminished the lung metastatic capacity of the HCT116 cell
line. Of note, inhibition of phospho-38 MAPK did not affect proliferation or apoptosis.
The expression of parathyroid hormone-like hormone (PTHLH) was upregulated
(3.3 fold) in our highly metastatic derivative and was inversely correlated with the ex-
pression of MKK6 in CRC primary tumors. Downregulation of PHTLH in the highly
metastatic derivative decreased its capacity to colonize the lung without decreasing
its capacity to colonize the liver after intra porta inoculation. Interestingly, tail vein
(draining directly to the lungs) injections of the highly metastatic derivative did not
yield any lung metastasis and silencing PHTLH in LiM2 cells did not affect its growth
when injected directly into the lung. This suggested that the role of PTHLH in regu-
lating lung metastasis did not depended on growth promotion but more probably on
extravasation. This was supported by an experiment where we injected in the tail vein
LiM2 cells overexpressing or not PTHLH and quantified extravasation 48 hours later.
Mice injected with LiM2 cells overexpressing PTHLH presented a five-fold increase in
the number of cells extravasated in the lungs.
32

4.2 Second publication
We finally evidenced that PTHLH induced apoptosis of human pulmonary endothe-
lial cells (HPEC) by increasing Ca+ levels that in turn induces mobilization of the
apoptosis-inducing factor mitochondrion-associated 1 (AIFM1), from the mitochondria
to the cytosol, a caspase-independent cell death mechanism. This disrupts the lung
vasculature increasing the permeability of the lung to metastatic cells.
33
ART ICLES
Colon cancer cells colonize the lung from establishedliver metastases through p38 MAPK signallingand PTHLHJelena Urosevic1,8, Xabier Garcia-Albéniz1,2,8, Evarist Planet1, Sebastián Real1, María Virtudes Céspedes3,4,Marc Guiu1, Esther Fernandez1, Anna Bellmunt1, Sylwia Gawrzak1, Milica Pavlovic1, Ramon Mangues3,4,Ignacio Dolado1,7, Francisco M. Barriga1, Cristina Nadal2, Nancy Kemeny5, Eduard Batlle1,6, Angel R. Nebreda1,6and Roger R. Gomis1,6,9
The mechanisms that allow colon cancer cells to form liver and lung metastases, and whether KRAS mutation influences whereand when metastasis occurs, are unknown. We provide clinical and molecular evidence showing that different MAPK signallingpathways are implicated in this process. Whereas ERK2 activation provides colon cancer cells with the ability to seed and colonizethe liver, reduced p38 MAPK signalling endows cancer cells with the ability to form lung metastasis from previously establishedliver lesions. Downregulation of p38 MAPK signalling results in increased expression of the cytokine PTHLH, which contributes tocolon cancer cell extravasation to the lung by inducing caspase-independent death in endothelial cells of the lungmicrovasculature. The concerted acquisition of metastatic traits in the colon cancer cells together with the sequential colonizationof liver and lung highlights the importance of metastatic lesions as a platform for further dissemination.
Colorectal cancer (CRC) metastasis follows an ordered andhierarchical pattern. CRC cells initially spread to the lymph nodesand peritoneal area. When metastases to the liver occur, a substantialnumber of patients develop also lung and less frequently bone orbrain metastases1. Patients with metastasis are treated with systemicchemotherapy, mostly in a palliative manner. Nevertheless, in selectedpatients with isolated liver metastasis, increased 5 year survival canbe achieved by multimodal treatment that includes combination ofsurgery with modern chemotherapy2. However, only about 25% ofpatients can benefit from this type of treatment and the presence ofmetastases in other organs is, in most cases, a contraindication forresection3. After liver, lung is the most frequently involved organ4,5,which highlights the need to understand mechanisms of CRC lungmetastasis to further improve disease control. The metastatic patternin CRC could be partially explained by the fact that the gut-drainingmesenteric vein together with the splenic vein forms the portalsystem that drains directly into the liver. Beyond this simplisticanatomical interpretation, mechanisms that regulate intravasation,
survival in portal circulation, infiltration and colonization of theliver are also likely to contribute to the propensity of CRC metastasisfor the liver6. In addition, there is no explanation for why livermetastasis is accompanied by lung colonization only in some patients.Interestingly, CRC patients who underwent primary tumour resectionshow a different pattern of relapse depending on theKRASmutationalstatus7. In particular, KRAS-mutated CRC has a higher incidenceof lung metastasis. This phenomenon suggests a KRAS-linkedmechanism that favours targeting of colon tumour cells to the lungs8.
RESULTSAn experimental model of colon cancer metastasisTo investigate the hierarchical mechanisms of liver and subsequentlung metastasis in KRAS-mutated CRC, we established an orthotopicxenograft mouse model to select for human CRC cells with enhancedability to colonize the liver and the lungs9,10. We focused on the humancolon adenocarcinoma cell line SW620, which harbours theKRASG12V
mutation. First, we introduced in these cells an expression vector for
1Institute for Research in Biomedicine (IRB Barcelona), 08028 Barcelona, Spain. 2Institut de Malalties Hemato-Oncològiques, Hospital Clínic de Barcelona-IDIBAPSand CIBER-EHD), 08036 Barcelona, Spain. 3Grup d’Oncogenesi i Antitumorals, Hospital de Sant Pau, 08026 Barcelona, Spain. 4Grup d’Oncogenesi i Antitumorals,Institute of Biomedical Research (IIB Sant Pau), Network Research Center on Bioengineering, Biomaterials and Nanomedicine (CIBER-BBN), 08026 Barcelona,Spain. 5Memorial Sloan-Kettering Cancer Center, 10065 New York, USA. 6Institució Catalana de Recerca i Estudis Avançats (ICREA), 08010 Barcelona, Spain.7Molecular Partners AG, 8952 Schlieren, Switzerland. 8These authors contributed equally to this work.9Correspondence should be addressed to R.R.G. (e-mail: [email protected])
Received 17 July 2013; accepted 28 April 2014; published online 1 June 2014; DOI: 10.1038/ncb2977
NATURE CELL BIOLOGY ADVANCE ONLINE PUBLICATION 1
© 2014 Macmillan Publishers Limited. All rights reserved.
ART ICLES
luciferase, which allowed us to monitor the kinetics of emergenceof liver metastatic lesions by quantitative bioluminescence imaging.The SW620 luciferase-expressing cells (parental) were inoculated intothe portal circulation of immunodeficient mice through intrasplenicinjection followed by splenectomy, to isolate cell populations thattarget the liver (Fig. 1a). The initial SW620-derived liver metastasiscells were expanded in culture and the resulting population (LiverMetastatic derivative, LiM1) was subjected to a second round ofin vivo selection, producing the LiM2 cell population that showed asignificant increase in liver metastatic activity (Fig. 1a–d). Within 10weeks post inoculation of LiM2 cells, 15 out of 18mice developed livermetastasis as opposed to 6 out of 18 injectedwith parental SW620 cells,suggesting that LiM2 cells acquired the ability to survive and adjustto the liver environment (Fig. 1b–d). Besides the increased ability toform livermetastasis, LiM2 cells also showed increased lungmetastaticactivity compared with parental SW620 cells (Fig. 1c,e), whereasperitoneal metastasis and ascites production were observed at lowerbut comparable rates in the two populations (Fig. 1c). Histologicalexamination revealed that, in most cases, liver metastatic lesionsderived fromLiM2 cells developed stromal response, as opposed to thetypical necrotic lesions derived from parental SW620 cells (Fig. 1d).Interestingly, LiM2 cells showed an increased invasive capacity invitro compared with parental cells, suggesting the potential gainof metastatic features (Supplementary Fig. 1a). Furthermore, LiM2cells also showed enhanced liver and lung metastatic capabilitiesin orthotopic mouse xenografts, whereas primary tumours grewsimilarly to the parental cell population, indicating that proliferationwas not enhanced in LiM2 cells by the in vivo selection protocol(Supplementary Fig. 1b–d).
Deregulated MAPK signalling in colon cancer cells isassociated with metastatic capacityTo investigate the molecular basis for aggressive concerted liver andlung metastatic behaviour of KRAS-mutated CRC cells, we performedtranscriptomic analysis of the LiM2 and parental SW620 cellpopulations. Comparative genome-wide expression analysis yielded alist of 194 genes that were overexpressed or underexpressed at least2.5-fold in the highly liver metastatic derivative LiM2 (Fig. 2a andSupplementary Table 1). This group of genes showed a concordanttrend of regulation in metastatic derivatives and was named thecolon cancer metastatic (CCM) gene set. We divided the CCM setof genes in two groups depending on whether their expression wasupregulated or downregulated, and performed a cross-validation in acombined expression data set of 267 stage I–III clinically annotatedhuman primary CRC tumours from three independent institutions(combined GSE17537 and GSE14333) (refs 11–13). The outcomeof interest was time to recurrence after primary tumour retrieval.Using gene set enrichment analysis14 (GSEA), we found a strongassociation between the upregulated CCM gene set and an increasedrisk of recurrence (hazard ratio, HR) on treatment (false discovery rate<1×10⁻⁶) (Fig. 2b). In contrast, the downregulated CCMgene set wasnot found to be significantly associatedwith reduced risk of recurrence(Supplementary Fig. 2a). Similar conclusions were obtained usingGSE17537 andGSE14333 expression data sets independently. Survivalanalysis establishing subgroups by the median expression of theupregulated CCM gene set also revealed that this gene set was
associated with reduced time to recurrence (Fig. 2b). Patients in thecombined GSE17537 plus GSE14333 cohort with higher expressionof the CCM gene set had an increment of 120% in the rate ofrecurrence along time (HR = 2.20, 95% CI 1.22–3.98, P = 0.007).Stage- and study-adjustedmultivariate analysis yielded aHR of similarmagnitude (HR = 1.88, 95% CI 1.04–3.36, P=0.037) supporting theindependent predictive capacity of the upregulated CCM gene set.
The integration of different oncogenic hits into particular signallingpathways and cellular functions is key to understand how theexpression of groups of genes is collectively changed in metastatic cellpopulations. Thus, we investigated the signalling pathways predictedto regulate the expression of genes associatedwith increasedmetastaticcapacity of LiM2 cells. By using BGSEA (ref. 14), we found severalpathway-specific gene expression signatures (KEGG gene sets) thatwere differentially represented in the gene expression profiles ofparental and LiM2 cells (Fig. 2c and Supplementary Table 2). Theseincluded the pathways of nitrogen metabolism, which supportsnucleotide synthesis, cell adhesion molecules, which are fundamentalfor invasion and migration, and mitogen-activated protein kinases(MAPKs), which are important modulators of cellular responses15
(Supplementary Table 2). We focused our attention on MAPKsignalling alterations given the KRAS-mutated status of our initialCRC cell population. We analysed the activation status of the threemain MAPK pathways in LiM2 cells and found that the activatingphosphorylation of ERK1/ERK2 was increased, whereas that of p38MAPKs was reduced (Fig. 2d and Supplementary Fig. 2b) and thephosphorylation of JNKs did not change (Fig. 2d). Significantly,when the relative levels of phosphorylated (active) ERK2 and ERK1were compared, we found that phospho-ERK2 levels were specificallyincreased over phospho-ERK1 in CRC tumour biopsies from patientsthat developed metastasis within 2 years post-surgery compared withhealthy mucosa from the same patients (distance from the tumour>10 cm) or to CRC tumours of patients free of metastasis (Fig. 2e).In 6 out of 7 primary tumours from CRC patients that developedmetastasis, the phospho-ERK2/phospho-ERK1 ratio was above 1,whereas only 3 out of 13 non-metastatic CRC primary tumours hadhigher phospho-ERK2 than phospho-ERK1 levels (Fig. 2e, P=0.036).Furthermore, in a set of 20 healthy mucosa samples obtained fromthe same patients as the CRC primary tumours, phospho-ERK2levels were roughly equal to those of phospho-ERK1 in 80% of thesamples similarly to non-metastatic CRC primary tumours (Fig. 2e).Next, we investigated the implication of the p38 MAPK pathway,which was downregulated in LiM2 cells, and found that the reducedlevels of phosphorylated (active) p38 MAPK correlated with thedownregulation of MKK6 (MAP2K6), a key activator of p38 MAPKs(ref. 16; Fig. 2f). Notably, in CRC primary tumours (pooled GSE17537and GSE14333; n = 267 including stages I, II and III), MKK6messenger RNA expression levels were inversely associatedwith a highprobability of relapse in the patients (Fig. 2g). These results supportthat high phospho-ERK2 and low phospho-p38 MAPK activities areassociated with risk of metastasis in CRC patients.
ERK2 mediates colon cancer metastasis to the liverGiven that lung and liver metastatic events are co-selected in CRCpatients (Supplementary Table 3), particularly bearingKRAS-mutatedtumours, we wondered whether concerted changes in signalling
2 NATURE CELL BIOLOGY ADVANCE ONLINE PUBLICATION
© 2014 Macmillan Publishers Limited. All rights reserved.
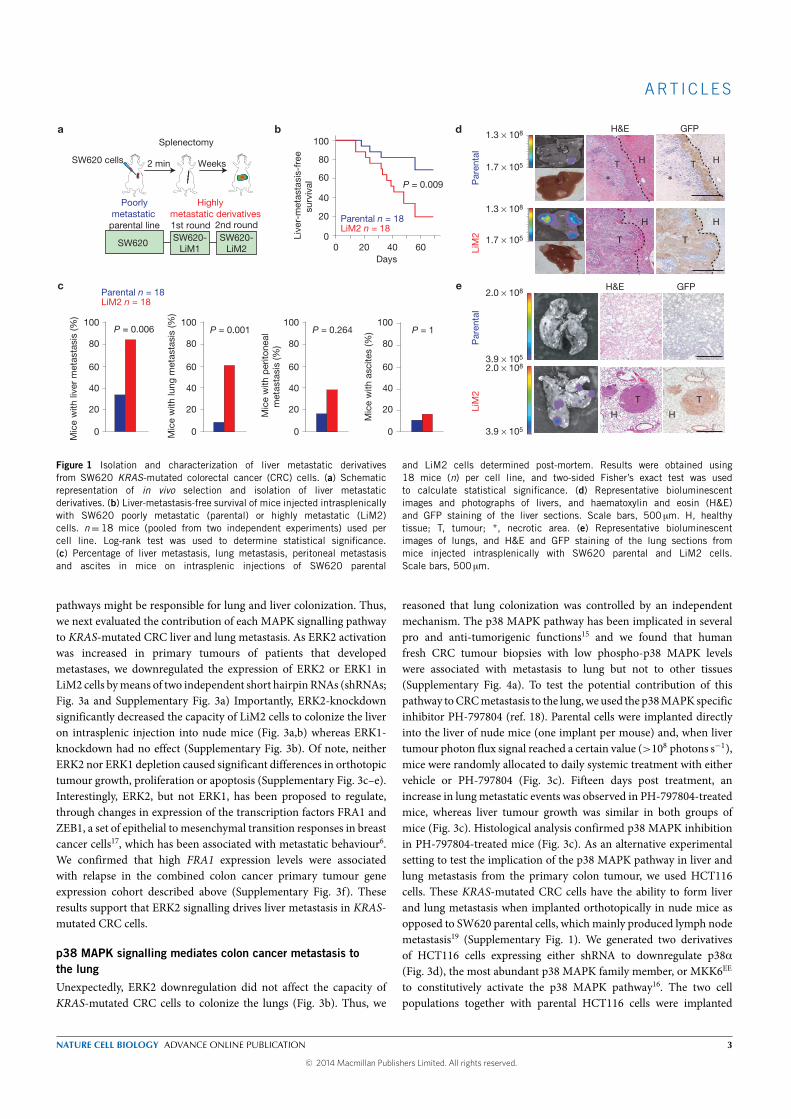
ART ICLES
a
Days
Live
r-m
etas
tasi
s-fr
eesu
rviv
al
6040200
100
80
60
40
20
0
P = 0.009
LiM2 n = 18 Parental n = 18
2 min
Splenectomy
Weeks
SW620 SW620-LiM1
SW620-LiM2
2nd round1st roundparental line
Poorlymetastatic
Highlymetastatic derivatives
SW620 cells
P = 0.001
c
Mic
e w
ith lu
ng m
etas
tasi
s (%
)
Mic
e w
ith li
ver
met
asta
sis
(%)
0
40
20
60
80
100
0
40
20
60
80
100
0
40
20
60
80
100
0
40
20
60
80
100P = 0.006
H&E GFP
Par
enta
l
3.9 × 10⁵
2.0 × 10⁸
2.0 × 10⁸
LiM
2 P
aren
tal
H&E GFP
∗
(ii) (i i)
T
T
H
HH
HT
T
∗
b
1.7 × 10⁵
1.3 × 10⁸
1.7 × 10⁵
1.3 × 10⁸
∗
d
e
LiM
2
Mic
e w
ith p
erito
neal
met
asta
sis
(%)
P = 0.264
Mic
e w
ith a
scite
s (%
) P = 1
3.9 × 10⁵
T T
H H
LiM2 n = 18 Parental n = 18
Figure 1 Isolation and characterization of liver metastatic derivativesfrom SW620 KRAS-mutated colorectal cancer (CRC) cells. (a) Schematicrepresentation of in vivo selection and isolation of liver metastaticderivatives. (b) Liver-metastasis-free survival of mice injected intrasplenicallywith SW620 poorly metastatic (parental) or highly metastatic (LiM2)cells. n= 18 mice (pooled from two independent experiments) used percell line. Log-rank test was used to determine statistical significance.(c) Percentage of liver metastasis, lung metastasis, peritoneal metastasisand ascites in mice on intrasplenic injections of SW620 parental
and LiM2 cells determined post-mortem. Results were obtained using18 mice (n) per cell line, and two-sided Fisher’s exact test was usedto calculate statistical significance. (d) Representative bioluminescentimages and photographs of livers, and haematoxylin and eosin (H&E)and GFP staining of the liver sections. Scale bars, 500 µm. H, healthytissue; T, tumour; *, necrotic area. (e) Representative bioluminescentimages of lungs, and H&E and GFP staining of the lung sections frommice injected intrasplenically with SW620 parental and LiM2 cells.Scale bars, 500 µm.
pathways might be responsible for lung and liver colonization. Thus,we next evaluated the contribution of each MAPK signalling pathwayto KRAS-mutated CRC liver and lung metastasis. As ERK2 activationwas increased in primary tumours of patients that developedmetastases, we downregulated the expression of ERK2 or ERK1 inLiM2 cells bymeans of two independent short hairpin RNAs (shRNAs;Fig. 3a and Supplementary Fig. 3a) Importantly, ERK2-knockdownsignificantly decreased the capacity of LiM2 cells to colonize the liveron intrasplenic injection into nude mice (Fig. 3a,b) whereas ERK1-knockdown had no effect (Supplementary Fig. 3b). Of note, neitherERK2 nor ERK1 depletion caused significant differences in orthotopictumour growth, proliferation or apoptosis (Supplementary Fig. 3c–e).Interestingly, ERK2, but not ERK1, has been proposed to regulate,through changes in expression of the transcription factors FRA1 andZEB1, a set of epithelial to mesenchymal transition responses in breastcancer cells17, which has been associated with metastatic behaviour6.We confirmed that high FRA1 expression levels were associatedwith relapse in the combined colon cancer primary tumour geneexpression cohort described above (Supplementary Fig. 3f). Theseresults support that ERK2 signalling drives liver metastasis in KRAS-mutated CRC cells.
p38 MAPK signalling mediates colon cancer metastasis tothe lungUnexpectedly, ERK2 downregulation did not affect the capacity ofKRAS-mutated CRC cells to colonize the lungs (Fig. 3b). Thus, we
reasoned that lung colonization was controlled by an independentmechanism. The p38 MAPK pathway has been implicated in severalpro and anti-tumorigenic functions15 and we found that humanfresh CRC tumour biopsies with low phospho-p38 MAPK levelswere associated with metastasis to lung but not to other tissues(Supplementary Fig. 4a). To test the potential contribution of thispathway toCRCmetastasis to the lung,we used the p38MAPKspecificinhibitor PH-797804 (ref. 18). Parental cells were implanted directlyinto the liver of nude mice (one implant per mouse) and, when livertumour photon flux signal reached a certain value (>108 photons s−1),mice were randomly allocated to daily systemic treatment with eithervehicle or PH-797804 (Fig. 3c). Fifteen days post treatment, anincrease in lungmetastatic events was observed in PH-797804-treatedmice, whereas liver tumour growth was similar in both groups ofmice (Fig. 3c). Histological analysis confirmed p38 MAPK inhibitionin PH-797804-treated mice (Fig. 3c). As an alternative experimentalsetting to test the implication of the p38 MAPK pathway in liver andlung metastasis from the primary colon tumour, we used HCT116cells. These KRAS-mutated CRC cells have the ability to form liverand lung metastasis when implanted orthotopically in nude mice asopposed to SW620 parental cells, which mainly produced lymph nodemetastasis19 (Supplementary Fig. 1). We generated two derivativesof HCT116 cells expressing either shRNA to downregulate p38α(Fig. 3d), the most abundant p38 MAPK family member, or MKK6EE
to constitutively activate the p38 MAPK pathway16. The two cellpopulations together with parental HCT116 cells were implanted
NATURE CELL BIOLOGY ADVANCE ONLINE PUBLICATION 3
© 2014 Macmillan Publishers Limited. All rights reserved.
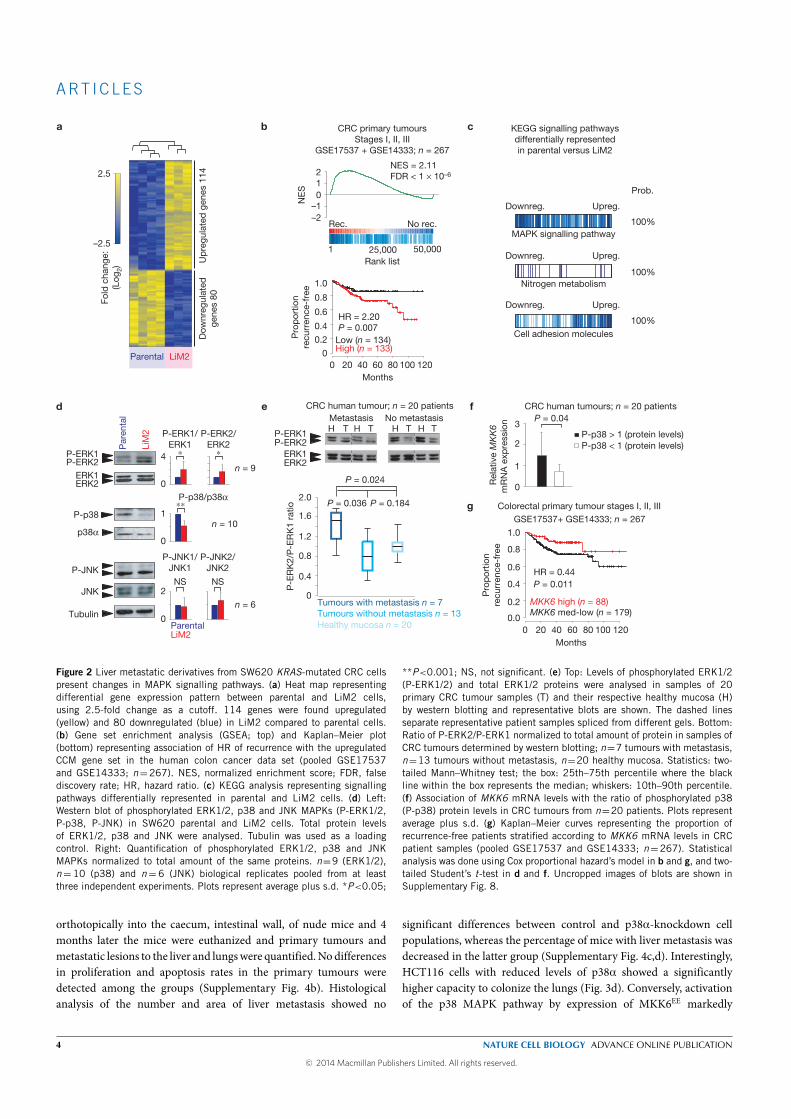
ART ICLES
a b
Fold
cha
nge:
(Log
2)
2.5
–2.5
Dow
nreg
ulat
edge
nes
80
Parental LiM2
Up
regu
late
d g
enes
114
cCRC primary tumoursStages I, II, III
GSE17537 + GSE14333; n = 267
NE
S
012
–1–2
NES = 2.11FDR < 1 × 10⁻⁶
1 25,000 50,000Rank list
Rec. No rec.
100 120
0.2
0.4
0.6
0.8
1.0P
rop
ortio
nre
curr
ence
-fre
e
Months200
040 60 80
HR = 2.20P = 0.007
High (n = 133) Low (n = 134)
Prob.
100%
100%
100%
Downreg. Upreg.
Nitrogen metabolism
MAPK signalling pathway
Downreg. Upreg.
Cell adhesion molecules
Downreg. Upreg.
KEGG signalling pathwaysdifferentially representedin parental versus LiM2
e CRC human tumour; n = 20 patients
P-ERK1P-ERK2
ERK1ERK2
Metastasis No metastasisH H H HT T T T
P-ERK1
P-p38
p38α
Par
enta
l
Tubulin
P-JNK
JNK
P-ERK2ERK1ERK2
LiM
2
P-p38/p38α
0
1
ParentalLiM2
P-ERK1/ERK1
P-ERK2/ERK2
0
4
0
2
P-JNK1/JNK1
P-JNK2/JNK2
∗∗
NS NS
∗∗
d
Tumours with metastasis n = 7Tumours without metastasis n = 13 Healthy mucosa n = 20
P-E
RK
2/P
-ER
K1
ratio
2.0
1.6
1.2
0.8
0.4
0
P = 0.036
P = 0.024
P = 0.184 R
elat
ive
MK
K6
mR
NA
exp
ress
ion 3
P = 0.04
2
1
0
P-p38 > 1 (protein levels)P-p38 < 1 (protein levels)
CRC human tumours; n = 20 patients f
gGSE17537+ GSE14333; n = 267
Colorectal primary tumour stages I, II, III
HR = 0.44 P = 0.011
Months
MKK6 med-low (n = 179) MKK6 high (n = 88)
0.0
0.2
0.4
0.6
0.8
1.0
100 120200 40 60 80
Pro
por
tion
recu
rren
ce-f
ree
n = 9
n = 10
n = 6
Figure 2 Liver metastatic derivatives from SW620 KRAS-mutated CRC cellspresent changes in MAPK signalling pathways. (a) Heat map representingdifferential gene expression pattern between parental and LiM2 cells,using 2.5-fold change as a cutoff. 114 genes were found upregulated(yellow) and 80 downregulated (blue) in LiM2 compared to parental cells.(b) Gene set enrichment analysis (GSEA; top) and Kaplan–Meier plot(bottom) representing association of HR of recurrence with the upregulatedCCM gene set in the human colon cancer data set (pooled GSE17537and GSE14333; n=267). NES, normalized enrichment score; FDR, falsediscovery rate; HR, hazard ratio. (c) KEGG analysis representing signallingpathways differentially represented in parental and LiM2 cells. (d) Left:Western blot of phosphorylated ERK1/2, p38 and JNK MAPKs (P-ERK1/2,P-p38, P-JNK) in SW620 parental and LiM2 cells. Total protein levelsof ERK1/2, p38 and JNK were analysed. Tubulin was used as a loadingcontrol. Right: Quantification of phosphorylated ERK1/2, p38 and JNKMAPKs normalized to total amount of the same proteins. n=9 (ERK1/2),n= 10 (p38) and n= 6 (JNK) biological replicates pooled from at leastthree independent experiments. Plots represent average plus s.d. *P<0.05;
**P<0.001; NS, not significant. (e) Top: Levels of phosphorylated ERK1/2(P-ERK1/2) and total ERK1/2 proteins were analysed in samples of 20primary CRC tumour samples (T) and their respective healthy mucosa (H)by western blotting and representative blots are shown. The dashed linesseparate representative patient samples spliced from different gels. Bottom:Ratio of P-ERK2/P-ERK1 normalized to total amount of protein in samples ofCRC tumours determined by western blotting; n=7 tumours with metastasis,n=13 tumours without metastasis, n=20 healthy mucosa. Statistics: two-tailed Mann–Whitney test; the box: 25th–75th percentile where the blackline within the box represents the median; whiskers: 10th–90th percentile.(f) Association of MKK6 mRNA levels with the ratio of phosphorylated p38(P-p38) protein levels in CRC tumours from n=20 patients. Plots representaverage plus s.d. (g) Kaplan–Meier curves representing the proportion ofrecurrence-free patients stratified according to MKK6 mRNA levels in CRCpatient samples (pooled GSE17537 and GSE14333; n=267). Statisticalanalysis was done using Cox proportional hazard’s model in b and g, and two-tailed Student’s t-test in d and f. Uncropped images of blots are shown inSupplementary Fig. 8.
orthotopically into the caecum, intestinal wall, of nude mice and 4months later the mice were euthanized and primary tumours andmetastatic lesions to the liver and lungswere quantified.Nodifferencesin proliferation and apoptosis rates in the primary tumours weredetected among the groups (Supplementary Fig. 4b). Histologicalanalysis of the number and area of liver metastasis showed no
significant differences between control and p38α-knockdown cellpopulations, whereas the percentage of mice with liver metastasis wasdecreased in the latter group (Supplementary Fig. 4c,d). Interestingly,HCT116 cells with reduced levels of p38α showed a significantlyhigher capacity to colonize the lungs (Fig. 3d). Conversely, activationof the p38 MAPK pathway by expression of MKK6EE markedly
4 NATURE CELL BIOLOGY ADVANCE ONLINE PUBLICATION
© 2014 Macmillan Publishers Limited. All rights reserved.
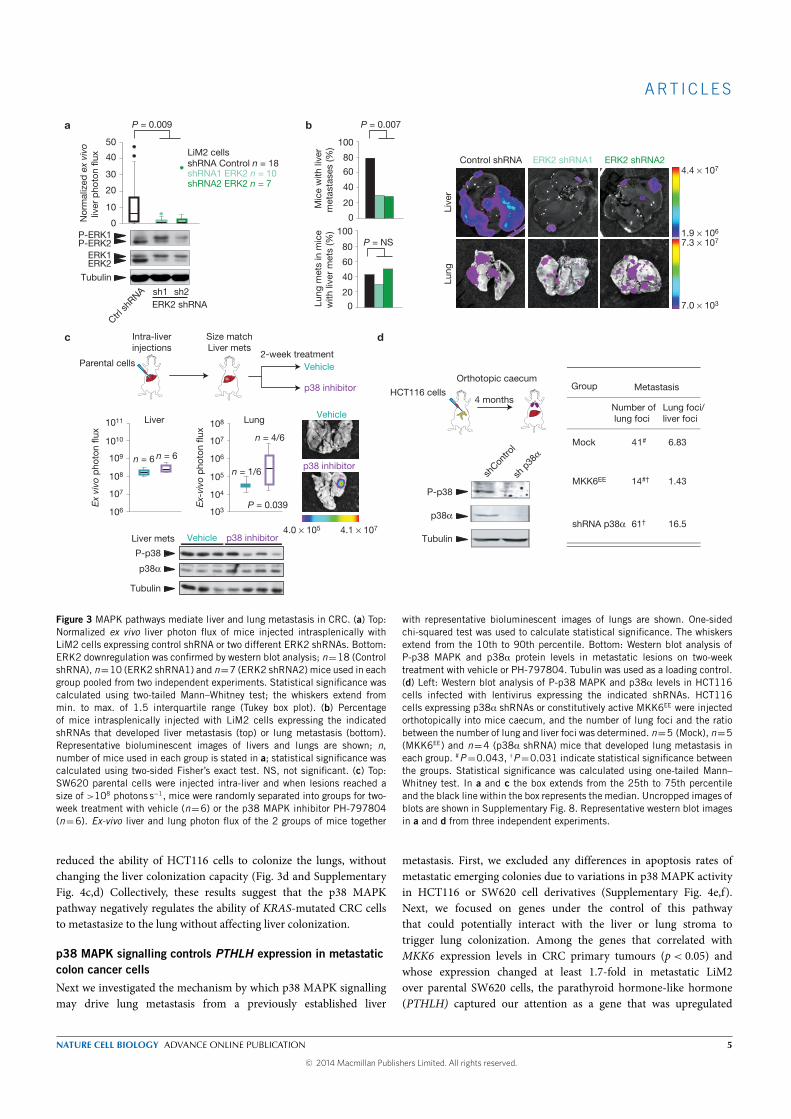
ART ICLES
c
Group
shRNA p38α
MKK6EE
Mock
Tubulin
shCon
trol
sh p
38α
P-p38
Lung foci/liver foci
16.5
Metastasis
Number of lung foci
1#4
14#†
61†
6.83
1.43
4 months
Orthotopic caecum
Intra-liver injections
Size matchLiver mets
p38 inhibitor VehicleLiver mets
P-p38
p38α
Tubulin
Lung
103
104
105
106
107
108
Ex
vivo
pho
ton
flux
Ex-
vivo
pho
ton
flux
4.0 × 10⁵ 4.1 × 10⁷
108
107
106
109
1010
1011 Liver
d
n = 6 n = 6
n = 1/6
n = 4/6
p38α
Vehicle
p38 inhibitor
a
ERK2 shRNAsh1
Ctrl sh
RNA sh2
P-ERK1P-ERK2
ERK1ERK2
Tubulin
Lung
met
s in
mic
ew
ith li
ver
met
s (%
)
0
20
100
40
60
80
shRNA Control n = 18 shRNA1 ERK2 n = 10shRNA2 ERK2 n = 7
P = 0.009
Nor
mal
ized
ex
vivo
liver
pho
ton
flux
30
40
20
10
0
50
b
Mic
e w
ith li
ver
met
asta
ses
(%)
0
20
100
40
60
80
P = 0.007
P = NS
LiM2 cells
7.0 × 10³
7.3 × 10⁷
Control shRNA ERK2 shRNA1 ERK2 shRNA2
1.9 × 10⁶
4.4 × 10⁷
Live
rLu
ng
p38 inhibitor
Vehicle
2-week treatmentParental cells
HCT116 cells
P = 0.039
Figure 3 MAPK pathways mediate liver and lung metastasis in CRC. (a) Top:Normalized ex vivo liver photon flux of mice injected intrasplenically withLiM2 cells expressing control shRNA or two different ERK2 shRNAs. Bottom:ERK2 downregulation was confirmed by western blot analysis; n=18 (ControlshRNA), n=10 (ERK2 shRNA1) and n=7 (ERK2 shRNA2) mice used in eachgroup pooled from two independent experiments. Statistical significance wascalculated using two-tailed Mann–Whitney test; the whiskers extend frommin. to max. of 1.5 interquartile range (Tukey box plot). (b) Percentageof mice intrasplenically injected with LiM2 cells expressing the indicatedshRNAs that developed liver metastasis (top) or lung metastasis (bottom).Representative bioluminescent images of livers and lungs are shown; n,number of mice used in each group is stated in a; statistical significance wascalculated using two-sided Fisher’s exact test. NS, not significant. (c) Top:SW620 parental cells were injected intra-liver and when lesions reached asize of >108 photons s−1, mice were randomly separated into groups for two-week treatment with vehicle (n=6) or the p38 MAPK inhibitor PH-797804(n=6). Ex-vivo liver and lung photon flux of the 2 groups of mice together
with representative bioluminescent images of lungs are shown. One-sidedchi-squared test was used to calculate statistical significance. The whiskersextend from the 10th to 90th percentile. Bottom: Western blot analysis ofP-p38 MAPK and p38α protein levels in metastatic lesions on two-weektreatment with vehicle or PH-797804. Tubulin was used as a loading control.(d) Left: Western blot analysis of P-p38 MAPK and p38α levels in HCT116cells infected with lentivirus expressing the indicated shRNAs. HCT116cells expressing p38α shRNAs or constitutively active MKK6EE were injectedorthotopically into mice caecum, and the number of lung foci and the ratiobetween the number of lung and liver foci was determined. n=5 (Mock), n=5(MKK6EE) and n=4 (p38α shRNA) mice that developed lung metastasis ineach group. #P=0.043, †P=0.031 indicate statistical significance betweenthe groups. Statistical significance was calculated using one-tailed Mann–Whitney test. In a and c the box extends from the 25th to 75th percentileand the black line within the box represents the median. Uncropped images ofblots are shown in Supplementary Fig. 8. Representative western blot imagesin a and d from three independent experiments.
reduced the ability of HCT116 cells to colonize the lungs, withoutchanging the liver colonization capacity (Fig. 3d and SupplementaryFig. 4c,d) Collectively, these results suggest that the p38 MAPKpathway negatively regulates the ability of KRAS-mutated CRC cellsto metastasize to the lung without affecting liver colonization.
p38 MAPK signalling controls PTHLH expression in metastaticcolon cancer cellsNext we investigated the mechanism by which p38 MAPK signallingmay drive lung metastasis from a previously established liver
metastasis. First, we excluded any differences in apoptosis rates ofmetastatic emerging colonies due to variations in p38 MAPK activityin HCT116 or SW620 cell derivatives (Supplementary Fig. 4e,f).Next, we focused on genes under the control of this pathwaythat could potentially interact with the liver or lung stroma totrigger lung colonization. Among the genes that correlated withMKK6 expression levels in CRC primary tumours (p < 0.05) andwhose expression changed at least 1.7-fold in metastatic LiM2over parental SW620 cells, the parathyroid hormone-like hormone(PTHLH) captured our attention as a gene that was upregulated
NATURE CELL BIOLOGY ADVANCE ONLINE PUBLICATION 5
© 2014 Macmillan Publishers Limited. All rights reserved.
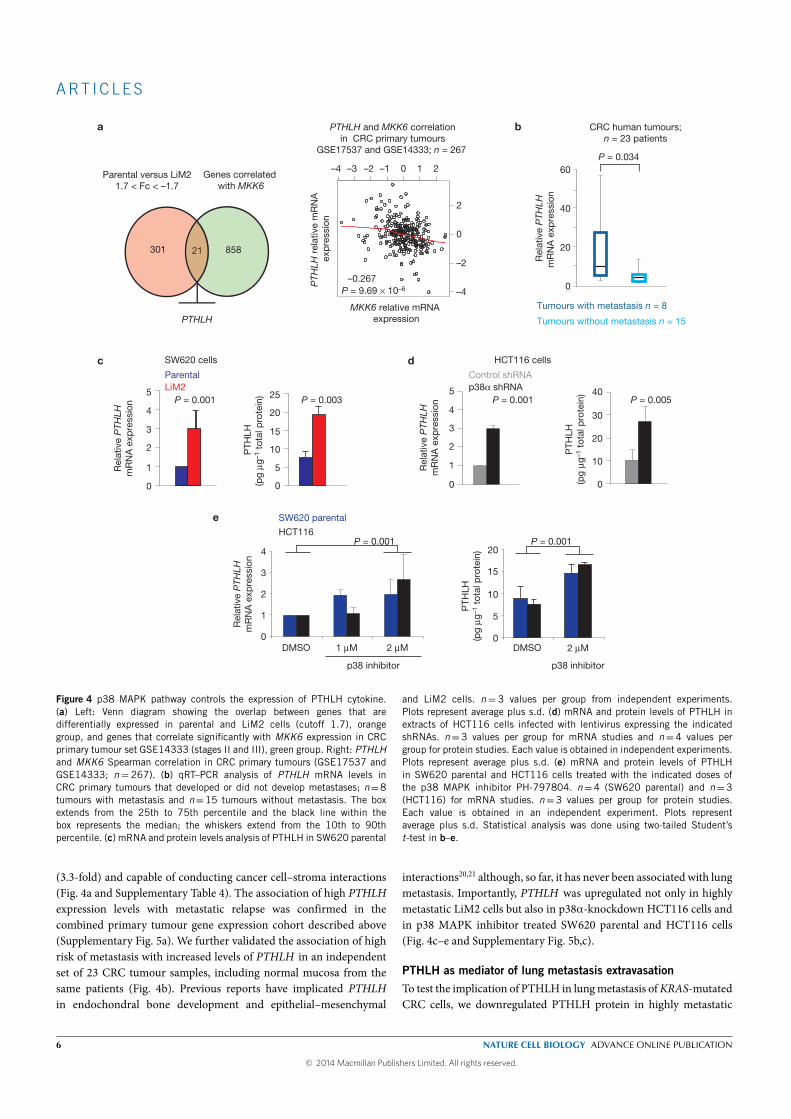
ART ICLES
301 858
Parental versus LiM21.7 < Fc < –1.7
21
PTHLH
–4
–4
–3 –2
–2
–1 0
0
1 2
2
PTH
LH r
elat
ive
mR
NA
ex
pre
ssio
n
MKK6 relative mRNA expression
PTHLH and MKK6 correlationin CRC primary tumours
GSE17537 and GSE14333; n = 267
–0.267P = 9.69 × 10⁻⁶
a
Genes correlated with MKK6
CRC human tumours;n = 23 patients
Tumours with metastasis n = 8
Tumours without metastasis n = 15
Rel
ativ
e P
THLH
mR
NA
exp
ress
ion
0
20
40
60
b
P = 0.034
Rel
ativ
e P
THLH
mR
NA
exp
ress
ion
SW620 parental
4
3
2
0
HCT116
1
DMSO 1 μM 2 μM
e
p38 inhibitor
0DMSO 2 μM
5
10
15
20
PTH
LH(p
g μg
–1 t
otal
pro
tein
)
p38 inhibitor
c
0
1
2
3
4
5
Rel
ativ
e P
THLH
mR
NA
exp
ress
ion
Parental LiM2
SW620 cells HCT116 cells
Control shRNA p38α shRNA
Rel
ativ
e P
THLH
mR
NA
exp
ress
ion
5
4
3
2
1
0
d
PTH
LH(p
g μg
–1 t
otal
pro
tein
)
0
10
20
PTH
LH(p
g μg
–1 t
otal
pro
tein
)
15
5
25
0
10
20
30
40P = 0.003 P = 0.001 P = 0.001 P = 0.005
P = 0.001 P = 0.001
Figure 4 p38 MAPK pathway controls the expression of PTHLH cytokine.(a) Left: Venn diagram showing the overlap between genes that aredifferentially expressed in parental and LiM2 cells (cutoff 1.7), orangegroup, and genes that correlate significantly with MKK6 expression in CRCprimary tumour set GSE14333 (stages II and III), green group. Right: PTHLHand MKK6 Spearman correlation in CRC primary tumours (GSE17537 andGSE14333; n= 267). (b) qRT–PCR analysis of PTHLH mRNA levels inCRC primary tumours that developed or did not develop metastases; n=8tumours with metastasis and n=15 tumours without metastasis. The boxextends from the 25th to 75th percentile and the black line within thebox represents the median; the whiskers extend from the 10th to 90thpercentile. (c) mRNA and protein levels analysis of PTHLH in SW620 parental
and LiM2 cells. n= 3 values per group from independent experiments.Plots represent average plus s.d. (d) mRNA and protein levels of PTHLH inextracts of HCT116 cells infected with lentivirus expressing the indicatedshRNAs. n=3 values per group for mRNA studies and n=4 values pergroup for protein studies. Each value is obtained in independent experiments.Plots represent average plus s.d. (e) mRNA and protein levels of PTHLHin SW620 parental and HCT116 cells treated with the indicated doses ofthe p38 MAPK inhibitor PH-797804. n=4 (SW620 parental) and n=3(HCT116) for mRNA studies. n=3 values per group for protein studies.Each value is obtained in an independent experiment. Plots representaverage plus s.d. Statistical analysis was done using two-tailed Student’st-test in b–e.
(3.3-fold) and capable of conducting cancer cell–stroma interactions(Fig. 4a and Supplementary Table 4). The association of high PTHLHexpression levels with metastatic relapse was confirmed in thecombined primary tumour gene expression cohort described above(Supplementary Fig. 5a). We further validated the association of highrisk of metastasis with increased levels of PTHLH in an independentset of 23 CRC tumour samples, including normal mucosa from thesame patients (Fig. 4b). Previous reports have implicated PTHLHin endochondral bone development and epithelial–mesenchymal
interactions20,21 although, so far, it has never been associated with lungmetastasis. Importantly, PTHLH was upregulated not only in highlymetastatic LiM2 cells but also in p38α-knockdown HCT116 cells andin p38 MAPK inhibitor treated SW620 parental and HCT116 cells(Fig. 4c–e and Supplementary Fig. 5b,c).
PTHLH as mediator of lung metastasis extravasationTo test the implication of PTHLH in lungmetastasis ofKRAS-mutatedCRC cells, we downregulated PTHLH protein in highly metastatic
6 NATURE CELL BIOLOGY ADVANCE ONLINE PUBLICATION
© 2014 Macmillan Publishers Limited. All rights reserved.
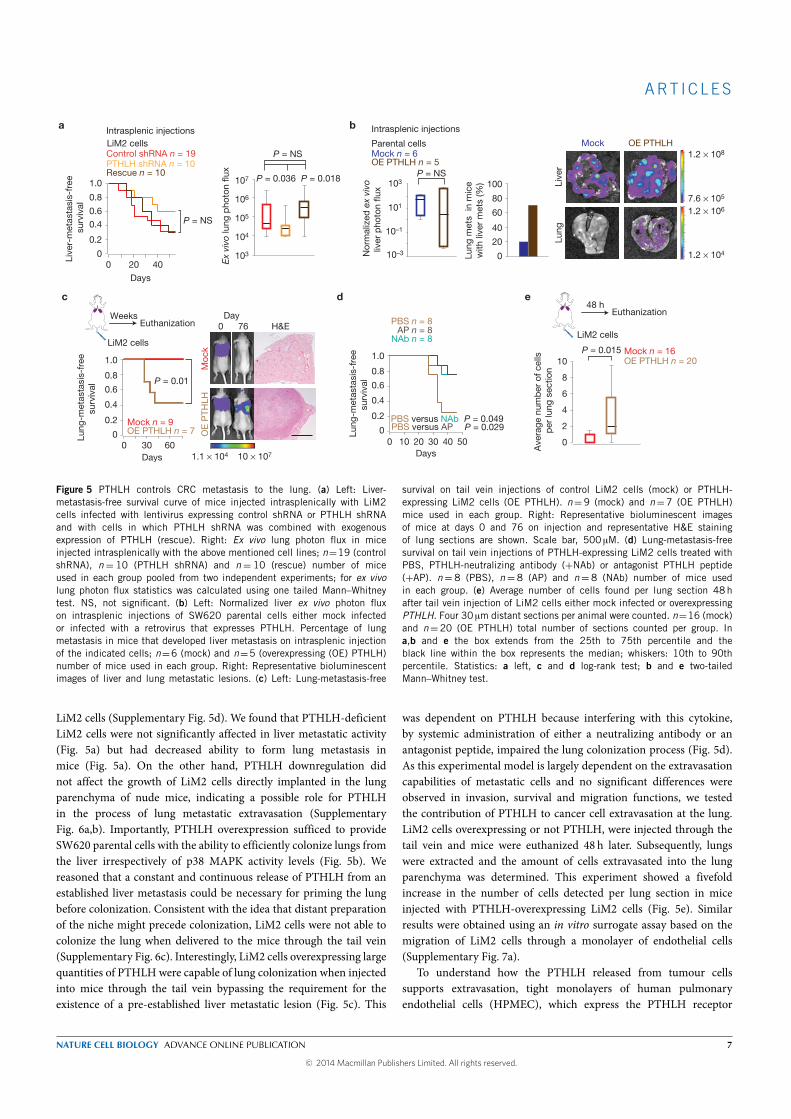
ART ICLES
Days
c
0
10P = 0.015
Ave
rage
num
ber
of c
ells
per
lung
sec
tion
Mock n = 16OE PTHLH n = 20
2
4
6
8
e
Lung
met
s in
mic
ew
ith li
ver
met
s (%
)
20
40
60
80
100
0
Mock n = 6OE PTHLH n = 5
Nor
mal
ized
ex
vivo
liver
pho
ton
flux
10–3
b Intrasplenic injections
10–1
103
101
1.2 × 10⁴
1.2 × 10⁶
7.6 × 10⁵
1.2 × 10⁸Mock OE PTHLH
P = NS
Parental cells
a
0
0.2
0.4
0.6
0.8
1.0
Live
r-m
etas
tasi
s-fr
ee s
urvi
val
P = NS
0 20 40
PTHLH shRNA n = 10 Control shRNA n = 19
Rescue n = 10
Ex
vivo
lung
pho
ton
flux
106
105
104
103
107 P = 0.036
P = NS
P = 0.018
Intrasplenic injections LiM2 cells
Lung
Live
r
48 hEuthanization
LiM2 cells
d
1.0
0
0.2
0.4
0.6
0.8
0Days
6030
P = 0.01
Lung
-met
asta
sis-
free
surv
ival
Mock n = 9OE PTHLH n = 7
LiM2 cells
WeeksEuthanization
Day
Moc
kO
E P
THLH
10 × 107
H&E0 76
1.1 × 10⁴
PBS n = 8AP n = 8
NAb n = 8
0Days
503010 20 40
Lung
-met
asta
sis-
free
surv
ival
1.0
0
0.2
0.4
0.6
0.8
PBS versus NAb P = 0.049PBS versus AP P = 0.029
Figure 5 PTHLH controls CRC metastasis to the lung. (a) Left: Liver-metastasis-free survival curve of mice injected intrasplenically with LiM2cells infected with lentivirus expressing control shRNA or PTHLH shRNAand with cells in which PTHLH shRNA was combined with exogenousexpression of PTHLH (rescue). Right: Ex vivo lung photon flux in miceinjected intrasplenically with the above mentioned cell lines; n=19 (controlshRNA), n= 10 (PTHLH shRNA) and n= 10 (rescue) number of miceused in each group pooled from two independent experiments; for ex vivolung photon flux statistics was calculated using one tailed Mann–Whitneytest. NS, not significant. (b) Left: Normalized liver ex vivo photon fluxon intrasplenic injections of SW620 parental cells either mock infectedor infected with a retrovirus that expresses PTHLH. Percentage of lungmetastasis in mice that developed liver metastasis on intrasplenic injectionof the indicated cells; n=6 (mock) and n=5 (overexpressing (OE) PTHLH)number of mice used in each group. Right: Representative bioluminescentimages of liver and lung metastatic lesions. (c) Left: Lung-metastasis-free
survival on tail vein injections of control LiM2 cells (mock) or PTHLH-expressing LiM2 cells (OE PTHLH). n=9 (mock) and n=7 (OE PTHLH)mice used in each group. Right: Representative bioluminescent imagesof mice at days 0 and 76 on injection and representative H&E stainingof lung sections are shown. Scale bar, 500 µM. (d) Lung-metastasis-freesurvival on tail vein injections of PTHLH-expressing LiM2 cells treated withPBS, PTHLH-neutralizing antibody (+NAb) or antagonist PTHLH peptide(+AP). n= 8 (PBS), n= 8 (AP) and n= 8 (NAb) number of mice usedin each group. (e) Average number of cells found per lung section 48hafter tail vein injection of LiM2 cells either mock infected or overexpressingPTHLH. Four 30 µm distant sections per animal were counted. n=16 (mock)and n=20 (OE PTHLH) total number of sections counted per group. Ina,b and e the box extends from the 25th to 75th percentile and theblack line within the box represents the median; whiskers: 10th to 90thpercentile. Statistics: a left, c and d log-rank test; b and e two-tailedMann–Whitney test.
LiM2 cells (Supplementary Fig. 5d). We found that PTHLH-deficientLiM2 cells were not significantly affected in liver metastatic activity(Fig. 5a) but had decreased ability to form lung metastasis inmice (Fig. 5a). On the other hand, PTHLH downregulation didnot affect the growth of LiM2 cells directly implanted in the lungparenchyma of nude mice, indicating a possible role for PTHLHin the process of lung metastatic extravasation (SupplementaryFig. 6a,b). Importantly, PTHLH overexpression sufficed to provideSW620 parental cells with the ability to efficiently colonize lungs fromthe liver irrespectively of p38 MAPK activity levels (Fig. 5b). Wereasoned that a constant and continuous release of PTHLH from anestablished liver metastasis could be necessary for priming the lungbefore colonization. Consistent with the idea that distant preparationof the niche might precede colonization, LiM2 cells were not able tocolonize the lung when delivered to the mice through the tail vein(Supplementary Fig. 6c). Interestingly, LiM2 cells overexpressing largequantities of PTHLH were capable of lung colonization when injectedinto mice through the tail vein bypassing the requirement for theexistence of a pre-established liver metastatic lesion (Fig. 5c). This
was dependent on PTHLH because interfering with this cytokine,by systemic administration of either a neutralizing antibody or anantagonist peptide, impaired the lung colonization process (Fig. 5d).As this experimental model is largely dependent on the extravasationcapabilities of metastatic cells and no significant differences wereobserved in invasion, survival and migration functions, we testedthe contribution of PTHLH to cancer cell extravasation at the lung.LiM2 cells overexpressing or not PTHLH, were injected through thetail vein and mice were euthanized 48 h later. Subsequently, lungswere extracted and the amount of cells extravasated into the lungparenchyma was determined. This experiment showed a fivefoldincrease in the number of cells detected per lung section in miceinjected with PTHLH-overexpressing LiM2 cells (Fig. 5e). Similarresults were obtained using an in vitro surrogate assay based on themigration of LiM2 cells through a monolayer of endothelial cells(Supplementary Fig. 7a).
To understand how the PTHLH released from tumour cellssupports extravasation, tight monolayers of human pulmonaryendothelial cells (HPMEC), which express the PTHLH receptor
NATURE CELL BIOLOGY ADVANCE ONLINE PUBLICATION 7
© 2014 Macmillan Publishers Limited. All rights reserved.
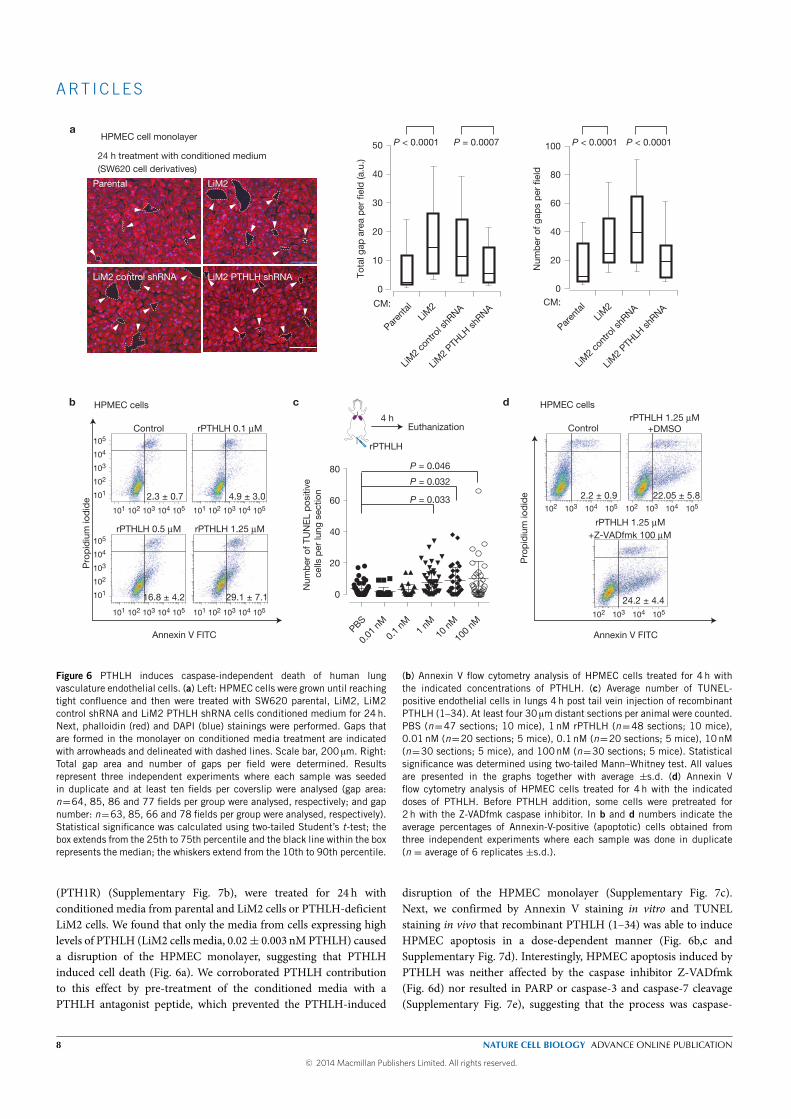
ART ICLES
a
b
24 h treatment with conditioned medium (SW620 cell derivatives)
Annexin V FITC
rPTHLH 0.5 µM
16.8 ± 4.2 29.1 ± 7.1
102
102
103
103
104
104
105
105
4.9 ± 3.0101
102
103
104
105
101
101 102 103 104 105 102 103 104 105 102 103 104 105
102 103 104 105
101
102 103 104 105101 102 103 104 105101
HPMEC cells
Control rPTHLH 0.1 µM
rPTHLH 1.25 µM
2.3 ± 0.7
Pro
pid
ium
iod
ide
HPMEC cell monolayer
LiM2 control shRNA LiM2 PTHLH shRNA
Parental LiM2
40
CM:
20
60
80
100
Num
ber
of g
aps
per
fiel
d
0
10
0
20
30
40
50
CM:
Tota
l gap
are
a p
er fi
eld
(a.u
.)
P < 0.0001 P = 0.0007 P < 0.0001 P < 0.0001
Paren
tal
LiM2
LiM2
PTHLH
shRNA
LiM2
cont
rol s
hRNA
Paren
tal
LiM2
LiM2
PTHLH
shRNA
LiM2
cont
rol s
hRNA
c
rPTHLH
4 hEuthanization
Num
ber
of T
UN
EL
pos
itive
cel
ls p
er lu
ng s
ectio
n
0
20
40
60
80
PBS
0.0
1 nM
0.1
nM1
nM10
nM
100
nM
P = 0.046
P = 0.032
P = 0.033
drPTHLH 1.25 µM
+DMSO
rPTHLH 1.25 µM+Z-VADfmk 100 µM
Control
24.2 ± 4.4
22.05 ± 5.82.2 ± 0.9
Annexin V FITC
Pro
pid
ium
iod
ide
HPMEC cells
Figure 6 PTHLH induces caspase-independent death of human lungvasculature endothelial cells. (a) Left: HPMEC cells were grown until reachingtight confluence and then were treated with SW620 parental, LiM2, LiM2control shRNA and LiM2 PTHLH shRNA cells conditioned medium for 24h.Next, phalloidin (red) and DAPI (blue) stainings were performed. Gaps thatare formed in the monolayer on conditioned media treatment are indicatedwith arrowheads and delineated with dashed lines. Scale bar, 200 µm. Right:Total gap area and number of gaps per field were determined. Resultsrepresent three independent experiments where each sample was seededin duplicate and at least ten fields per coverslip were analysed (gap area:n=64, 85, 86 and 77 fields per group were analysed, respectively; and gapnumber: n=63, 85, 66 and 78 fields per group were analysed, respectively).Statistical significance was calculated using two-tailed Student’s t-test; thebox extends from the 25th to 75th percentile and the black line within the boxrepresents the median; the whiskers extend from the 10th to 90th percentile.
(b) Annexin V flow cytometry analysis of HPMEC cells treated for 4 h withthe indicated concentrations of PTHLH. (c) Average number of TUNEL-positive endothelial cells in lungs 4 h post tail vein injection of recombinantPTHLH (1–34). At least four 30 µm distant sections per animal were counted.PBS (n=47 sections; 10 mice), 1 nM rPTHLH (n=48 sections; 10 mice),0.01 nM (n=20 sections; 5 mice), 0.1 nM (n=20 sections; 5 mice), 10 nM(n=30 sections; 5 mice), and 100nM (n=30 sections; 5 mice). Statisticalsignificance was determined using two-tailed Mann–Whitney test. All valuesare presented in the graphs together with average ±s.d. (d) Annexin Vflow cytometry analysis of HPMEC cells treated for 4 h with the indicateddoses of PTHLH. Before PTHLH addition, some cells were pretreated for2 h with the Z-VADfmk caspase inhibitor. In b and d numbers indicate theaverage percentages of Annexin-V-positive (apoptotic) cells obtained fromthree independent experiments where each sample was done in duplicate(n = average of 6 replicates ±s.d.).
(PTH1R) (Supplementary Fig. 7b), were treated for 24 h withconditioned media from parental and LiM2 cells or PTHLH-deficientLiM2 cells. We found that only the media from cells expressing highlevels of PTHLH (LiM2 cells media, 0.02± 0.003 nM PTHLH) causeda disruption of the HPMEC monolayer, suggesting that PTHLHinduced cell death (Fig. 6a). We corroborated PTHLH contributionto this effect by pre-treatment of the conditioned media with aPTHLH antagonist peptide, which prevented the PTHLH-induced
disruption of the HPMEC monolayer (Supplementary Fig. 7c).Next, we confirmed by Annexin V staining in vitro and TUNELstaining in vivo that recombinant PTHLH (1–34) was able to induceHPMEC apoptosis in a dose-dependent manner (Fig. 6b,c andSupplementary Fig. 7d). Interestingly, HPMEC apoptosis induced byPTHLH was neither affected by the caspase inhibitor Z-VADfmk(Fig. 6d) nor resulted in PARP or caspase-3 and caspase-7 cleavage(Supplementary Fig. 7e), suggesting that the process was caspase-
8 NATURE CELL BIOLOGY ADVANCE ONLINE PUBLICATION
© 2014 Macmillan Publishers Limited. All rights reserved.
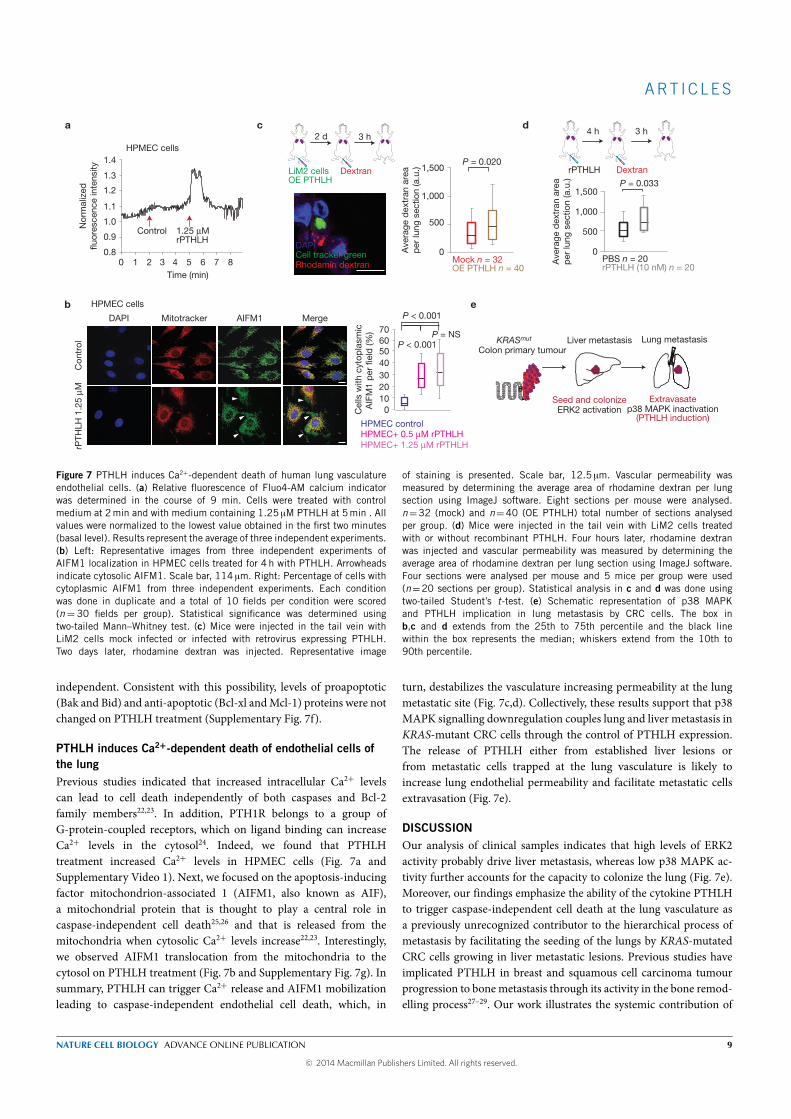
ART ICLES
ca
e
1.0
1.1
1.2
1.3
1.4
0.9
0.80 1 2 3 4 5 6 7 8
Control 1.25 µM rPTHLH
Nor
mal
ized
fluor
esce
nce
inte
nsity
Time (min)
Lung metastasisLiver metastasis
Seed and colonize Extravasatep38 MAPK inactivationERK2 activation
(PTHLH induction)
KRASmut
Colon primary tumour
HPMEC cells
PBS n = 20 rPTHLH (10 nM) n = 20
d
Mock n = 32 OE PTHLH n = 40
0
500
1,000
1,500P = 0.020
Ave
rage
dex
tran
are
ap
er lu
ng s
ectio
n (a
.u.)
0
500
1,000
1,500
Ave
rage
dex
tran
are
ap
er lu
ng s
ectio
n (a
.u.) P = 0.033
4 h 3 h
rPTHLH Dextran
20100
30
Cel
ls w
ith c
ytop
lasm
icA
IFM
1 p
er fi
eld
(%)
P < 0.001
40506070
P < 0.001
HPMEC controlHPMEC+ 0.5 µM rPTHLHHPMEC+ 1.25 µM rPTHLH
Con
trol
rPTH
LH 1
.25
µM
DAPI
HPMEC cells
Mitotracker AIFM1 Merge
2 d 3 h
LiM2 cellsOE PTHLH
Dextran
DAPICell tracker greenRhodamin dextran
P = NS
b
Figure 7 PTHLH induces Ca2+-dependent death of human lung vasculatureendothelial cells. (a) Relative fluorescence of Fluo4-AM calcium indicatorwas determined in the course of 9 min. Cells were treated with controlmedium at 2min and with medium containing 1.25 µM PTHLH at 5min . Allvalues were normalized to the lowest value obtained in the first two minutes(basal level). Results represent the average of three independent experiments.(b) Left: Representative images from three independent experiments ofAIFM1 localization in HPMEC cells treated for 4 h with PTHLH. Arrowheadsindicate cytosolic AIFM1. Scale bar, 114 µm. Right: Percentage of cells withcytoplasmic AIFM1 from three independent experiments. Each conditionwas done in duplicate and a total of 10 fields per condition were scored(n= 30 fields per group). Statistical significance was determined usingtwo-tailed Mann–Whitney test. (c) Mice were injected in the tail vein withLiM2 cells mock infected or infected with retrovirus expressing PTHLH.Two days later, rhodamine dextran was injected. Representative image
of staining is presented. Scale bar, 12.5 µm. Vascular permeability wasmeasured by determining the average area of rhodamine dextran per lungsection using ImageJ software. Eight sections per mouse were analysed.n=32 (mock) and n=40 (OE PTHLH) total number of sections analysedper group. (d) Mice were injected in the tail vein with LiM2 cells treatedwith or without recombinant PTHLH. Four hours later, rhodamine dextranwas injected and vascular permeability was measured by determining theaverage area of rhodamine dextran per lung section using ImageJ software.Four sections were analysed per mouse and 5 mice per group were used(n=20 sections per group). Statistical analysis in c and d was done usingtwo-tailed Student’s t-test. (e) Schematic representation of p38 MAPKand PTHLH implication in lung metastasis by CRC cells. The box inb,c and d extends from the 25th to 75th percentile and the black linewithin the box represents the median; whiskers extend from the 10th to90th percentile.
independent. Consistent with this possibility, levels of proapoptotic(Bak and Bid) and anti-apoptotic (Bcl-xl andMcl-1) proteins were notchanged on PTHLH treatment (Supplementary Fig. 7f).
PTHLH induces Ca2+-dependent death of endothelial cells ofthe lungPrevious studies indicated that increased intracellular Ca2+ levelscan lead to cell death independently of both caspases and Bcl-2family members22,23. In addition, PTH1R belongs to a group ofG-protein-coupled receptors, which on ligand binding can increaseCa2+ levels in the cytosol24. Indeed, we found that PTHLHtreatment increased Ca2+ levels in HPMEC cells (Fig. 7a andSupplementary Video 1). Next, we focused on the apoptosis-inducingfactor mitochondrion-associated 1 (AIFM1, also known as AIF),a mitochondrial protein that is thought to play a central role incaspase-independent cell death25,26 and that is released from themitochondria when cytosolic Ca2+ levels increase22,23. Interestingly,we observed AIFM1 translocation from the mitochondria to thecytosol on PTHLH treatment (Fig. 7b and Supplementary Fig. 7g). Insummary, PTHLH can trigger Ca2+ release and AIFM1 mobilizationleading to caspase-independent endothelial cell death, which, in
turn, destabilizes the vasculature increasing permeability at the lungmetastatic site (Fig. 7c,d). Collectively, these results support that p38MAPK signalling downregulation couples lung and liver metastasis inKRAS-mutant CRC cells through the control of PTHLH expression.The release of PTHLH either from established liver lesions orfrom metastatic cells trapped at the lung vasculature is likely toincrease lung endothelial permeability and facilitate metastatic cellsextravasation (Fig. 7e).
DISCUSSIONOur analysis of clinical samples indicates that high levels of ERK2activity probably drive liver metastasis, whereas low p38 MAPK ac-tivity further accounts for the capacity to colonize the lung (Fig. 7e).Moreover, our findings emphasize the ability of the cytokine PTHLHto trigger caspase-independent cell death at the lung vasculature asa previously unrecognized contributor to the hierarchical process ofmetastasis by facilitating the seeding of the lungs by KRAS-mutatedCRC cells growing in liver metastatic lesions. Previous studies haveimplicated PTHLH in breast and squamous cell carcinoma tumourprogression to bonemetastasis through its activity in the bone remod-elling process27–29. Our work illustrates the systemic contribution of
NATURE CELL BIOLOGY ADVANCE ONLINE PUBLICATION 9
© 2014 Macmillan Publishers Limited. All rights reserved.
ART ICLES
PTHLH released from tumour cells in supporting distant metastaticprocesses by triggering vascular permeability, and provides an expla-nation for the enhanced expression of PTHLH reported in CRC tissuecompared with normal colorectal mucosa or polyps30. Moreover, ourresults suggest that genetic changes that allow the primary metastasisto the livermust be followed by additional genetic alterations that allowsecondary metastases from the liver to the lung, which emphasizesthe concept of metastases from metastases. We provide evidence for adistinct mechanism that relies on different signalling pathways whosehierarchicalmodulation enhances the ability of departing tumour cellsto consecutively seed the liver and the lungs (Fig. 7e). The obser-vation that liver and lung colonization is linked to tumour-specificor circulating cell-specific factors may create opportunities for thedevelopment of targeted therapies to prevent disease disseminationfrom the colon to the liver, and subsequently to the lungs. �
METHODSMethods and any associated references are available in the onlineversion of the paper.
Note: Supplementary Information is available in the online version of the paper
ACKNOWLEDGEMENTSWe would like to thank J. Maurel for providing the data on patients with colonand rectal cancers depicted in Supplementary Table 3. We also thank H. Auer,J. Colombelli and M. Gay from the Functional genomics, Microscopy and Massspectrometry core facilities of IRB Barcelona, respectively. J.U. was supported byFundación BBVA, a Juan de la Cierva grant from Spanish Ministerio de Cienciae Innovación (MICINN) and a grant from Fundación Olga Torres. X.G-A. wassupported by Hospital Clinic-IDIBAPS (Ajut a la Recerca Josep Font) and anASISA-Harvard Fellowship for Excellence in Clinical Research. S.R. was supportedby a S. Borrel contract from Instituto de Salud Carlos III. S.G. and M.P. weresupported by La Caixa Fellowships and A.B. by FPI from MICINN. R.R.G., E.B.and A.R.N. are supported by the Institució Catalana de Recerca i Estudis Avançats(ICREA). Research support was provided by MICINN (BFU2010-17850), theEuropeanCommission FP7 (ERC294665) and the FundaciónBBVA toA.R.N, by theGeneralitat de Catalunya (2009 SGR 1437), MINECO P12/01861 and CIBER-BBNNanoCoMets to R.M., and by the Fundación BBVA,AECC,Generalitat de Catalunya(2009 SGR 1429) and MICINN (SAF2010-21171) to R.R.G.
AUTHOR CONTRIBUTIONSJ.U. designed and performed experiments, analysed data and participated in textwriting. X.G-A designed and established the model system, performed microarraysand participated in text writing and statistical analyses of microarrays andpatient data. E.P. performed statistical analyses of patient data. S.R., I.D. andF.M.B. performed experiments and analysed data on p38 MAPK. M.V.C. andR.M carried out intracaecum injections and analysed the data. A.B. and S.G.contributed to western blots and immunohistochemical analysis. M.G. and M.P.carried out intrasplenic, tail vein and intracaecum injections. E.F. carried outimmunohistochemical analysis. C.N. provided and analysed patient data. N.K, E.B.and A.R.N. participated in data analyses and manuscript writing. R.R.G conceivedthe project, analysed data, supervised the overall project and wrote the manuscript.
COMPETING FINANCIAL INTERESTSThe authors declare no competing financial interests.
Published online at www.nature.com/doifinder/10.1038/ncb2977Reprints and permissions information is available online at www.nature.com/reprints
1. Edge, S. B., Byrd, D. R., Compton, C. C. & Fritz, A. G. AJCC Cancer Staging Manual(Springer, 2009).
2. Gallagher, D. J. & Kemeny, N. Metastatic colorectal cancer: from improved survivalto potential cure. Oncology 78, 237–248 (2010).
3. Wanebo, H. J. et al. Meeting the biologic challenge of colorectal metastases. Clin.Exp. Metastasis 29, 821–839 (2012).
4. Sadahiro, S. et al. Recurrence patterns after curative resection of colorectalcancer in patients followed for a minimum of ten years. Hepatogastroenterology 50,1362–1366 (2003).
5. Kievit, J. Follow-up of patients with colorectal cancer: numbers needed to test andtreat. Eur. J. Cancer 38, 986–999 (2002).
6. Nguyen, D. X., Bos, P. D. & Massagué, J. Metastasis: from dissemination to organ-specific colonization. Nat. Rev. Cancer 9, 274–284 (2009).
7. Tie, J. et al. KRAS mutation is associated with lung metastasis inpatients with curatively resected colorectal cancer. Clin. Cancer Res. 17,1122–1130 (2011).
8. Schlüter, K. et al. Organ-specific metastatic tumor cell adhesion and extravasationof colon carcinoma cells with different metastatic potential. Am. J. Pathol. 169,1064–1073 (2006).
9. Ding, L. et al. Genome remodelling in a basal-like breast cancer metastasis andxenograft. Nature 464, 999–1005 (2010).
10. Fidler, I. J. The pathogenesis of cancer metastasis: the ‘seed and soil’ hypothesisrevisited. Nat. Rev. Cancer 3, 453–458 (2003).
11. Kaiser, S. et al. Transcriptional recapitulation and subversion of embryonic colondevelopment by mouse colon tumor models and human colon cancer. Genome Biol.8, R131 (2007).
12. Smith, J. J. et al. Experimentally derived metastasis gene expression profilepredicts recurrence and death in patients with colon cancer. Gastroenterology 138,958–968 (2010).
13. Merlos-Suárez, A. et al. The intestinal stem cell signature identifiescolorectal cancer stem cells and predicts disease relapse. Cell Stem Cell 8,511–524 (2011).
14. Subramanian, A. et al. Gene set enrichment analysis: a knowledge-based approachfor interpreting genome-wide expression profiles. Proc. Natl Acad. Sci. USA 102,15545–15550 (2005).
15. Wagner, E. F. & Nebreda, A. R. Signal integration by JNK and p38 MAPK pathwaysin cancer development. Nat. Rev. Cancer 9, 537–549 (2009).
16. Cuadrado, A. & Nebreda, A. R. Mechanisms and functions of p38 MAPK signalling.Biochem. J. 429, 403–417 (2010).
17. Shin, S., Dimitri, C. A., Yoon, S-O., Dowdle, W. & Blenis, J. ERK2 but notERK1 induces epithelial-to-mesenchymal transformation via DEF motif-dependentsignaling events. Mol. Cell 38, 114–127 (2010).
18. Xing, L. et al. Discovery and characterization of atropisomer PH-797804, ap38 MAP kinase inhibitor, as a clinical drug candidate. Chem. Med. Chem. 7,273–280 (2012).
19. Céspedes, M. V. et al. Orthotopic microinjection of human colon cancer cells in nudemice induces tumor foci in all clinically relevant metastatic sites. Am. J. Pathol. 170,1077–1085 (2007).
20. Adams, S. L., Cohen, A. J. & Lassová, L. Integration of signaling pathways regulatingchondrocyte differentiation during endochondral bone formation. J. Cell. Physiol.213, 635–641 (2007).
21. Hens, J. R. et al. BMP4 and PTHrP interact to stimulate ductal outgrowth duringembryonic mammary development and to inhibit hair follicle induction. Development134, 1221–1230 (2007).
22. Norberg, E. et al. An increase in intracellular Ca2+ is required for the activationof mitochondrial calpain to release AIF during cell death. Cell Death Differ. 15,1857–1864 (2008).
23. Sanges, D., Comitato, A., Tammaro, R. & Marigo, V. Apoptosis in retinaldegeneration involves cross-talk between apoptosis-inducing factor (AIF) andcaspase-12 and is blocked by calpain inhibitors. Proc. Natl Acad. Sci. USA 103,17366–17371 (2006).
24. Vilardaga, J-P., Romero, G., Friedman, P. A. & Gardella, T. J. Molecular basis ofparathyroid hormone receptor signaling and trafficking: a family B GPCR paradigm.Cell. Mol. Life Sci. 68, 1–13 (2011).
25. Susin, S. A. et al. Two distinct pathways leading to nuclear apoptosis. J. Exp. Med.192, 571–580 (2000).
26. Joza, N. et al. Essential role of the mitochondrial apoptosis-inducing factor inprogrammed cell death. Nature 410, 549–554 (2001).
27. Gallwitz, W. E., Guise, T. A. & Mundy, G. R. Guanosine nucleotides inhibit differentsyndromes of PTHrP excess caused by human cancers in vivo. J. Clin. Invest. 110,1559–1572 (2002).
28. Takayama, Y., Mori, T., Nomura, T., Shibahara, T. & Sakamoto, M. Parathyroid-relatedprotein plays a critical role in bone invasion by oral squamous cell carcinoma. Int. J.Oncol. 36, 1387–1394 (2010).
29. Guise, T. A. Molecular mechanisms of osteolytic bone metastases. Cancer 88,2892–2898 (2000).
30. Malakouti, S., Asadi, F. K., Kukreja, S. C., Abcarian, H. A. & Cintron, J. R. Parathyroidhormone-related protein expression in the human colon: immunohistochemicalevaluation. Am. Surg. 62, 540–544 (1996).
10 NATURE CELL BIOLOGY ADVANCE ONLINE PUBLICATION
© 2014 Macmillan Publishers Limited. All rights reserved.
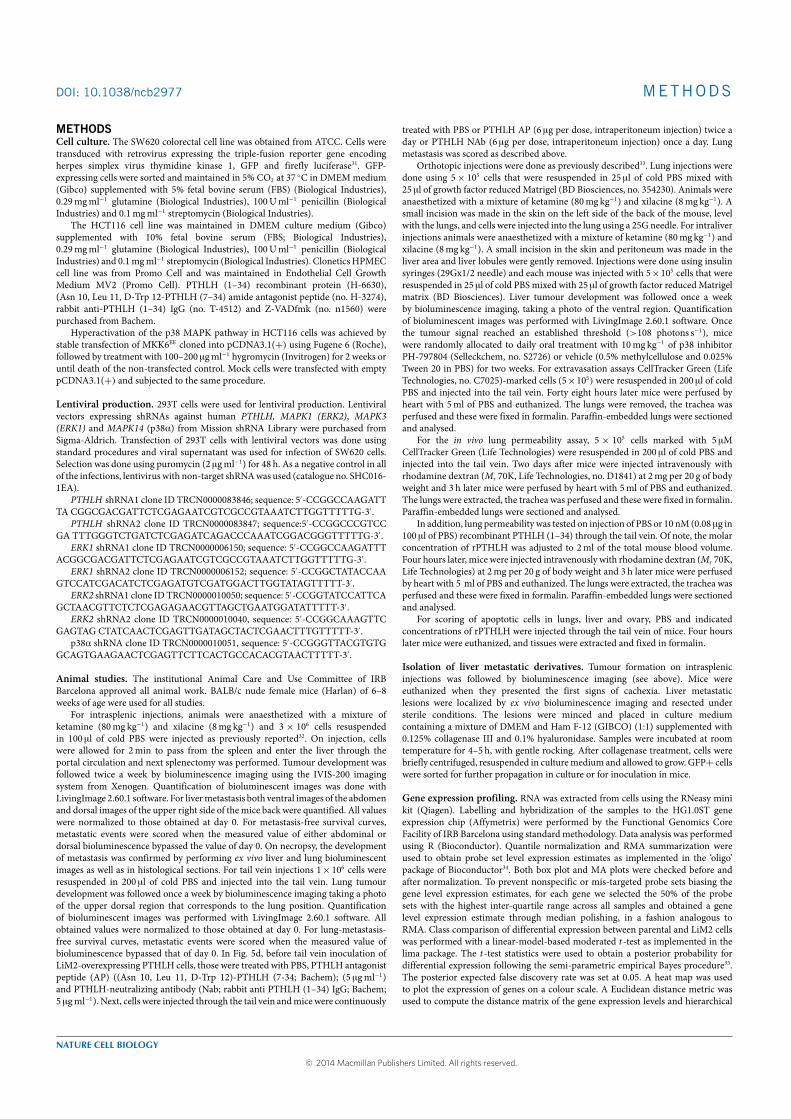
DOI: 10.1038/ncb2977 METHODS
METHODSCell culture. The SW620 colorectal cell line was obtained from ATCC. Cells weretransduced with retrovirus expressing the triple-fusion reporter gene encodingherpes simplex virus thymidine kinase 1, GFP and firefly luciferase31. GFP-expressing cells were sorted and maintained in 5% CO2 at 37 ◦C in DMEMmedium(Gibco) supplemented with 5% fetal bovine serum (FBS) (Biological Industries),0.29mgml−1 glutamine (Biological Industries), 100Uml−1 penicillin (BiologicalIndustries) and 0.1mgml−1 streptomycin (Biological Industries).
The HCT116 cell line was maintained in DMEM culture medium (Gibco)supplemented with 10% fetal bovine serum (FBS; Biological Industries),0.29mgml−1 glutamine (Biological Industries), 100Uml−1 penicillin (BiologicalIndustries) and 0.1mgml−1 streptomycin (Biological Industries). Clonetics HPMECcell line was from Promo Cell and was maintained in Endothelial Cell GrowthMedium MV2 (Promo Cell). PTHLH (1–34) recombinant protein (H-6630),(Asn 10, Leu 11, D-Trp 12-PTHLH (7–34) amide antagonist peptide (no. H-3274),rabbit anti-PTHLH (1–34) IgG (no. T-4512) and Z-VADfmk (no. n1560) werepurchased from Bachem.
Hyperactivation of the p38 MAPK pathway in HCT116 cells was achieved bystable transfection of MKK6EE cloned into pCDNA3.1(+) using Fugene 6 (Roche),followed by treatment with 100–200 µgml−1 hygromycin (Invitrogen) for 2 weeks oruntil death of the non-transfected control. Mock cells were transfected with emptypCDNA3.1(+) and subjected to the same procedure.
Lentiviral production. 293T cells were used for lentiviral production. Lentiviralvectors expressing shRNAs against human PTHLH, MAPK1 (ERK2), MAPK3(ERK1) and MAPK14 (p38α) from Mission shRNA Library were purchased fromSigma-Aldrich. Transfection of 293T cells with lentiviral vectors was done usingstandard procedures and viral supernatant was used for infection of SW620 cells.Selection was done using puromycin (2 µgml−1) for 48 h. As a negative control in allof the infections, lentivirus with non-target shRNAwas used (catalogue no. SHC016-1EA).
PTHLH shRNA1 clone ID TRCN0000083846; sequence: 5′-CCGGCCAAGATTTA CGGCGACGATTCTCGAGAATCGTCGCCGTAAATCTTGGTTTTTG-3′.
PTHLH shRNA2 clone ID TRCN0000083847; sequence:5′-CCGGCCCGTCCGA TTTGGGTCTGATCTCGAGATCAGACCCAAATCGGACGGGTTTTTG-3′.
ERK1 shRNA1 clone ID TRCN0000006150; sequence: 5′-CCGGCCAAGATTTACGGCGACGATTCTCGAGAATCGTCGCCGTAAATCTTGGTTTTTG-3′.
ERK1 shRNA2 clone ID TRCN0000006152; sequence: 5′-CCGGCTATACCAAGTCCATCGACATCTCGAGATGTCGATGGACTTGGTATAGTTTTT-3′.
ERK2 shRNA1 clone ID TRCN0000010050; sequence: 5′-CCGGTATCCATTCAGCTAACGTTCTCTCGAGAGAACGTTAGCTGAATGGATATTTTT-3′.
ERK2 shRNA2 clone ID TRCN0000010040, sequence: 5′-CCGGCAAAGTTCGAGTAG CTATCAACTCGAGTTGATAGCTACTCGAACTTTGTTTTT-3′.
p38α shRNA clone ID TRCN0000010051, sequence: 5′-CCGGGTTACGTGTGGCAGTGAAGAACTCGAGTTCTTCACTGCCACACGTAACTTTTT-3′.
Animal studies. The institutional Animal Care and Use Committee of IRBBarcelona approved all animal work. BALB/c nude female mice (Harlan) of 6–8weeks of age were used for all studies.
For intrasplenic injections, animals were anaesthetized with a mixture ofketamine (80mg kg−1) and xilacine (8mg kg−1) and 3 × 10⁶ cells resuspendedin 100 µl of cold PBS were injected as previously reported32. On injection, cellswere allowed for 2min to pass from the spleen and enter the liver through theportal circulation and next splenectomy was performed. Tumour development wasfollowed twice a week by bioluminescence imaging using the IVIS-200 imagingsystem from Xenogen. Quantification of bioluminescent images was done withLivingImage 2.60.1 software. For livermetastasis both ventral images of the abdomenand dorsal images of the upper right side of themice back were quantified. All valueswere normalized to those obtained at day 0. For metastasis-free survival curves,metastatic events were scored when the measured value of either abdominal ordorsal bioluminescence bypassed the value of day 0. On necropsy, the developmentof metastasis was confirmed by performing ex vivo liver and lung bioluminescentimages as well as in histological sections. For tail vein injections 1×10⁶ cells wereresuspended in 200 µl of cold PBS and injected into the tail vein. Lung tumourdevelopment was followed once a week by bioluminescence imaging taking a photoof the upper dorsal region that corresponds to the lung position. Quantificationof bioluminescent images was performed with LivingImage 2.60.1 software. Allobtained values were normalized to those obtained at day 0. For lung-metastasis-free survival curves, metastatic events were scored when the measured value ofbioluminescence bypassed that of day 0. In Fig. 5d, before tail vein inoculation ofLiM2-overexpressing PTHLH cells, those were treated with PBS, PTHLH antagonistpeptide (AP) ((Asn 10, Leu 11, D-Trp 12)-PTHLH (7-34; Bachem); (5 µgml−1)and PTHLH-neutralizing antibody (Nab; rabbit anti PTHLH (1–34) IgG; Bachem;5 µgml−1). Next, cells were injected through the tail vein andmicewere continuously
treated with PBS or PTHLH AP (6 µg per dose, intraperitoneum injection) twice aday or PTHLH NAb (6 µg per dose, intraperitoneum injection) once a day. Lungmetastasis was scored as described above.
Orthotopic injections were done as previously described33. Lung injections weredone using 5× 10⁵ cells that were resuspended in 25 µl of cold PBS mixed with25 µl of growth factor reducedMatrigel (BD Biosciences, no. 354230). Animals wereanaesthetized with a mixture of ketamine (80mg kg−1) and xilacine (8mg kg−1). Asmall incision was made in the skin on the left side of the back of the mouse, levelwith the lungs, and cells were injected into the lung using a 25G needle. For intraliverinjections animals were anaesthetized with a mixture of ketamine (80mg kg−1) andxilacine (8mg kg−1). A small incision in the skin and peritoneum was made in theliver area and liver lobules were gently removed. Injections were done using insulinsyringes (29Gx1/2 needle) and each mouse was injected with 5×10⁵ cells that wereresuspended in 25 µl of cold PBSmixed with 25 µl of growth factor reducedMatrigelmatrix (BD Biosciences). Liver tumour development was followed once a weekby bioluminescence imaging, taking a photo of the ventral region. Quantificationof bioluminescent images was performed with LivingImage 2.60.1 software. Oncethe tumour signal reached an established threshold (>108 photons s−1), micewere randomly allocated to daily oral treatment with 10mg kg−1 of p38 inhibitorPH-797804 (Selleckchem, no. S2726) or vehicle (0.5% methylcellulose and 0.025%Tween 20 in PBS) for two weeks. For extravasation assays CellTracker Green (LifeTechnologies, no. C7025)-marked cells (5×10⁵) were resuspended in 200 µl of coldPBS and injected into the tail vein. Forty eight hours later mice were perfused byheart with 5ml of PBS and euthanized. The lungs were removed, the trachea wasperfused and these were fixed in formalin. Paraffin-embedded lungs were sectionedand analysed.
For the in vivo lung permeability assay, 5 × 10⁵ cells marked with 5 µMCellTracker Green (Life Technologies) were resuspended in 200 µl of cold PBS andinjected into the tail vein. Two days after mice were injected intravenously withrhodamine dextran (Mr 70K, Life Technologies, no. D1841) at 2mg per 20 g of bodyweight and 3 h later mice were perfused by heart with 5ml of PBS and euthanized.The lungs were extracted, the trachea was perfused and these were fixed in formalin.Paraffin-embedded lungs were sectioned and analysed.
In addition, lung permeability was tested on injection of PBS or 10 nM (0.08 µg in100 µl of PBS) recombinant PTHLH (1–34) through the tail vein. Of note, the molarconcentration of rPTHLH was adjusted to 2ml of the total mouse blood volume.Four hours later, mice were injected intravenously with rhodamine dextran (Mr 70K,Life Technologies) at 2mg per 20 g of body weight and 3 h later mice were perfusedby heart with 5 ml of PBS and euthanized. The lungs were extracted, the trachea wasperfused and these were fixed in formalin. Paraffin-embedded lungs were sectionedand analysed.
For scoring of apoptotic cells in lungs, liver and ovary, PBS and indicatedconcentrations of rPTHLH were injected through the tail vein of mice. Four hourslater mice were euthanized, and tissues were extracted and fixed in formalin.
Isolation of liver metastatic derivatives. Tumour formation on intrasplenicinjections was followed by bioluminescence imaging (see above). Mice wereeuthanized when they presented the first signs of cachexia. Liver metastaticlesions were localized by ex vivo bioluminescence imaging and resected understerile conditions. The lesions were minced and placed in culture mediumcontaining a mixture of DMEM and Ham F-12 (GIBCO) (1:1) supplemented with0.125% collagenase III and 0.1% hyaluronidase. Samples were incubated at roomtemperature for 4–5 h, with gentle rocking. After collagenase treatment, cells werebriefly centrifuged, resuspended in culturemedium and allowed to grow. GFP+ cellswere sorted for further propagation in culture or for inoculation in mice.
Gene expression profiling. RNA was extracted from cells using the RNeasy minikit (Qiagen). Labelling and hybridization of the samples to the HG1.0ST geneexpression chip (Affymetrix) were performed by the Functional Genomics CoreFacility of IRB Barcelona using standard methodology. Data analysis was performedusing R (Bioconductor). Quantile normalization and RMA summarization wereused to obtain probe set level expression estimates as implemented in the ‘oligo’package of Bioconductor34. Both box plot and MA plots were checked before andafter normalization. To prevent nonspecific or mis-targeted probe sets biasing thegene level expression estimates, for each gene we selected the 50% of the probesets with the highest inter-quartile range across all samples and obtained a genelevel expression estimate through median polishing, in a fashion analogous toRMA. Class comparison of differential expression between parental and LiM2 cellswas performed with a linear-model-based moderated t-test as implemented in thelima package. The t-test statistics were used to obtain a posterior probability fordifferential expression following the semi-parametric empirical Bayes procedure35.The posterior expected false discovery rate was set at 0.05. A heat map was usedto plot the expression of genes on a colour scale. A Euclidean distance metric wasused to compute the distance matrix of the gene expression levels and hierarchical
NATURE CELL BIOLOGY
© 2014 Macmillan Publishers Limited. All rights reserved.
METHODS DOI: 10.1038/ncb2977
clustering using a complete agglomeration method was used. Ranks of the data wereused for setting the colour scheme.
GSEA analysis.GSEA analysis was done as implemented in the phenoTest packageof Bioconductor.
BGSEA analysis. Gene set enrichment was assessed through Bayesianenrichment36. We generated 1,000 posterior samples for the differential expressionindicator, according to the posterior probabilities of differential expression obtainedfrom pairwise comparisons. For each gene set we computed the probability ofenrichment as the proportion of posterior samples for which the percentageof differentially expressed genes in the set was larger than the percentage ofdifferentially expressed genes in the rest of the genome.
MKK6 gene expression correlation. Gene expression data of stage II and IIIpatients of theGSE14333 humanCRCcohort were used. A Spearman correlation testwas performed for each gene against MKK6 (MAP2K6). We corrected for multipletesting using the Benjamini and Hochberg method37.
Migration assay. Cells were marked with 5 µM CellTracker Green (LifeTechnologies) following the manufacturer’s instructions and kept overnight inmedium with 0.1% FBS. The next day 5 × 10⁴ cells were seeded on human-fibronectin-coated Biocoat Cell Culture Inserts (BD Biosciences, no. 354543) inmedium with 0.1% FBS, and the wells were loaded with complete medium. Eighthours after the seeding, cells werewashed and fixedwith 4%paraformaldehyde. Cellson the apical side of each insert were scraped off and themigration to the basolateralside was visualized with a Nikon Eclipse TE2000-U fluorescence microscope.
Trans-endothelial migration assay. HPMEC cells (1 × 10⁵) were seeded onhuman-fibronectin-coated Biocoat Cell Culture Inserts (BD Biosciences) andallowed to grow for four days until closing themonolayer. Tumour cells weremarkedwith 5 µM CellTracker Green (Life Technologies) following the manufacturer’sinstructions and then were conditioned overnight in ECGM-MV2 (Promo Cell)medium with 0.1% FBS and without supplements. The next day 5× 10⁴ tumourcells were seeded into Trans-well inserts with an endothelial monolayer inECGM-MV2 medium with 0.1% FBS and the wells were loaded with completemedium. Eight hours after the seeding, cells were washed and fixed with 4%paraformaldehyde. Cells on the apical side of each insert were scraped off and themigration to the basolateral side was visualized with a Nikon Eclipse TE2000-Ufluorescence microscope.
Invasion assay.Cells weremarkedwith 5 µMCellTrackerGreen (Life Technologies)following the manufacturer’s instructions and were kept overnight in mediumwith 0.1% FBS. The next day, 5× 10⁴ cells were seeded on BD BioCoat MatrigelInvasion Chambers in medium with 0.1% FBS, and the wells were loaded withcomplete medium. Eight hours after the seeding, cells were washed and fixed with4% paraformaldehyde. Cells on the apical side of each insert were scraped off andthe migration to the basolateral side was visualized with a Nikon Eclipse TE2000-Ufluorescence microscope.
Flow cytometry analysis. 2× 10⁵ HPMEC cells were seeded in ECGM-MV2(Promo Cell) complete medium. The following day cells were washed with PBS andtreated for 4 h with PTHLH in ECGM-MV2 medium with 0.1%FBS and withoutsupplements. In experiments where Z-VAD-fmk (Bachem) inhibitor was used cellswere pretreated for 2 h with this pan-caspase inhibitor before PTHLH was added.Cells were stainedwithAnnexinVApoptosisDetectionKit (SantaCruz, sc-4252AK)following the manufacturer’s instruction. Data were obtained using a BD FACSAriacell sorter and analysed using FlowJo software.
Western blot analysis. Protein extracts obtained from whole-cell lysates (35 µg)were fractionated in SDS–PAGE gels, transferred onto Immobilion-P (Millipore)membranes, and subjected to immunoblot analysis according to standardprocedures. The following antibodies were used: rabbit polyclonal antibodies tophospho-p38 (Cell Signaling, no. 9211; dilution 1:500), goat polyclonal antibodiesagainst p38α (Santa Cruz, no. sc-525-G; dilution 1:500), a home-made rabbitantiserum against MKK6 (ref. 38), rabbit monoclonal against phospho-ERK1/2(Cell Signaling, no. 4377S; dilution 1:500), rabbit polyclonal against ERK1/2 (CellSignaling no. 9102; dilution 1:500), mouse monoclonal against anti-phospho JNK(BD Transduction Laboratories, no. 612541; dilution 1:500), rabbit polyclonalagainst JNK (Santa Cruz, no. sc-571; dilution 1:500), rabbit polyclonal againstPARP (Cell Signaling no. 9542; dilution 1:500), rabbit polyclonal against caspase-3(Cell Signaling no. 9662; dilution 1:500), rabbit polyclonal against caspase-7 (CellSignaling no. 9492; dilution 1:500), rabbit polyclonal against AIF (AIFM1; CellSignaling no. 4642; dilution 1:500), rabbit polyclonal against Bid (Cell Signaling
no. 2002; dilution 1:1,000), rabbit polyclonal against Bak (Cell Signaling no. 3814;dilution 1:1,000), rabbit monoclonal against Bcl-xl (Cell Signaling no. 2764, clone54H6; dilution 1:500), rabbit monoclonal against Mcl-1 (Cell Signaling no. 5453,clone D35A5; dilution 1:500) and mouse monoclonal antibody against Tom20(Santa Cruz, sc-17764, clone F-10; dilution 1:500) and against tubulin (Sigma no.T5168, clone B-5-1-2; dilution 1:5,000).
Primary antibodies were detected with appropriate HRP-conjugated secondaryantibodies against mouse (Cell Signaling no. 7076, dilution 1:5,000), rabbit (GEHealthcare UK Limited, no. LNA934V dilution 1:5,000) or goat IgGs (Santa Cruz no.sc-2020, dilution 1:5,000). Separation of cytoplasmic and mitochondrial fractionswas done using Mito Isolation Kit for Mammalian Cells (Thermo Scientific)following the manufacturer’s instructions.
Quantitative RT–PCR analysis. Real-time qPCR was performed using TaqManGene Expression Assay PTHLH probe Hs 00174969_m1; MKK6/MAP2K6 probeHs00992389_m1 and ABI Prism Fast 7900HT Instrument. The levels of expressionwere normalized to human B2M (Applied Biosystems) and data were analysed usingthe comparative 1CT method.
Histopathology and immunohistochemistry. Tissues were dissected, fixed in10%-buffered formalin (Sigma) and embedded in paraffin. Sections (2–3 µm thick)were stained with haematoxylin and eosin (H&E). For immunohistochemistry ratpolyclonal rabbit polyclonal antibodies against GFP (Abcam, ab13970; dilution1:2,000) and P-p38 (Cell Signaling, no. 9211; dilution 1:1,000) were used.
Immunofluorescence.HPMEC cells were grown to confluence on glass coverslips.The cells were fixed for 10min in 10% neutral buffered formalin solution (Sigma)at room temperature and incubated for 5 min in 0.1% Triton X-100 in PBS. Next,the samples were blocked with 1% BSA for 30min and then stained for 20min withrhodamine phalloidin (Life Technologies, no. R415) and DAPI (Sigma).
For AIF staining 5× 10⁴ of HPMEC cells were seeded on glass coverslips.The next day, cells were treated for 4 h with 1.25mM PTHLH in 0.1%FBSECGM-MV2 (Promo Cell) medium without supplements and stained with 80 nMMitoTracker Red CMXRos (Lonza no. PA3017) for 15min. Next, cells were fixedin complete growth medium containing 3.7% formaldehyde for 15min at 37 ◦C andpermeabilized for 10min in PBS containing 0.2% Triton X-100. Blocking was donein PBS containing 3%BSA for 1 h at room temperature. Samples were incubatedwithAIF (AIFM1) antibody (Cell Signaling no. 4642; dilution 1:100) overnight at 4 ◦Cand1 h at room temperature with secondary antibody that recognizes rabbit IgGs (AlexaFluor 488, Molecular Probes Invitrogen) and mounted with ProLong Gold antifadereagent with DAPI.
For PTHLH immunofluorescence LiM2 and PTHLH-overexpressing LiM2 cellswere seeded on glass coverslips. Next, cells were fixed with 4% PFA for 15min atroom temperature and permeabilized for 10min in PBS containing 0.2% TritonX-100. Blocking was performed in PBS containing 3% BSA for 1 h at roomtemperature. Samples were incubated with PTHLH antibody (Abcam Ab115488;dilution 1:100) overnight at 4 ◦C and 1 h at room temperature with secondaryantibody that recognizes mouse IgGs and mounted with ProLong Gold antifadereagent with DAPI.
PTHLH ELISA assay. For the ELISA assay, 36.4 µg of total protein lysate was used.ELISA was purchased from Uscn Life Science (USA) and performed following themanufacturer’s instructions.
TUNEL assay. For the TUNEL assay formalin-fixed paraffin-embedded sectionswere used. In Situ Cell Death Detection Kit was purchased from Roche and assaywas used following the manufacturer’s instructions.
Live-cell imaging for intracellular Ca2+ level detection.HPMEC cells (3×10⁵)were seeded on 14mm glass coverslips. The next day, cells were washed and treatedfor 15min with 1 µM Fluo-4 AM (Life Technologies, no. F14201) in ECGM-MV2mediumwithout supplements. Next, the cells weremounted in a special chamber forlive-cell imaging using a Scan∧ROlympus microscope and images were taken everysecond. Obtained videos were analysed using Fiji software.
Human samples. Informed consentwas obtained prospectively before surgery fromeach patient and a total of 23 primary tumours and healthy mucosa were obtained.Patient identifiers were removed from the samples to protect patient confidentialityas per institutional guidelines. All human samples were manipulated with theapproval and following the guidelines of the Ethic Committee of Hospital Clinic deBarcelona and IRB-Barcelona. Information on tumour relapse and follow-up wasextracted from the medical records; patients were followed with CT scan every threemonths. Owing to the lack of material 3 samples could be subjected only to mRNAisolation whereas the rest were subjected to both mRNA and protein isolation.
NATURE CELL BIOLOGY
© 2014 Macmillan Publishers Limited. All rights reserved.
DOI: 10.1038/ncb2977 METHODS
Clinical sample analysis. Authorization was obtained to analyse a database of 100metastatic colorectal cancer (CRC) patients treated with irinotecan and cetuximabinside a phase II translational trial39 and 40 localized patients from a single cohortprospective study40 that relapsed during the study follow-up. Site of metastasiswas extracted and tabulated by primary site (colon versus rectum) with basicdescriptive statistics.
Mass spectrometry analysis. Proteins were digested with trypsin followingstandard protocols. Briefly, 50 µg of sample was reduced with 2mM dithiothreitol.After 1 h at 25 ◦C, iodoacetamide was added to a final concentration of 7mMand the samples were incubated for 30min in the darkness. The reaction wasstopped by adding 2mM dithiothreitol. Then, proteins were digested with trypsinand incubated at 37 ◦C overnight. Digestions were stopped by adding formic acidto a final concentration of 1%. The resulting peptide mixtures were diluted in 1%FA and loaded in a nano-LC–MS/MS system. The nano-LC–MS/MS set up wasas follows. Samples were loaded to a 180 µm ×2 cm C18 Symmetry trap column(Waters) at a flow rate of 15 µl min−1 using a nanoAcquity Ultra Performance LCTMchromatographic system (Waters). Peptides were separated using a C18 analyticalcolumn (BEH130TM75 µm× 10 cm, 1.7 µm,Waters) with a 90min run, comprisingthree consecutive steps with linear gradients from 1 to 35% B in 60min, from35 to 50% B in 5min, and from 50% to 85% B in 3min, followed by isocraticelution at 85% B in 10min and stabilization to initial conditions (A= 0.1% FA inwater, B= 0.1% FA in CH3CN). The column outlet was directly connected to anAdvion TriVersa NanoMate (Advion) fitted to an LTQ-FT Ultra mass spectrometer(Thermo). Spray voltage in theNanoMate sourcewas set to 1.70 kV. Capillary voltageand tube lens on the LTQ-FT were tuned to 40V and 120V. The spectrometer wasworking in positive polarity mode. At least two blank runs before each analysis wereperformed to ensure the absence of cross-contamination from previous samples.To select the PTHLH-targeted ions, the mass spectrometer was operated in a data-dependent acquisition (DDA) mode. Survey MS scans were acquired in the FTwith the resolution (defined at 400m/z) set to 100,000. Up to six of the mostintense ions per scan were fragmented and detected in the linear ion trap. The ioncount target value was 1,000,000 for the survey scan and 50,000 for the MS/MSscan. Target ions already selected for MS/MS were dynamically excluded for 30 s. Adatabase search was performed with Proteome Discoverer software v1.3 (Thermo)using the Sequest search engine and the SwissProt database (human release 12_03)where PTHLH peptide was added. Search parameters included trypsin enzymespecificity, allowing for two missed cleavage sites, carbamidomethyl in cysteineas a static modification and methionine oxidation as dynamic modifications.Peptide mass tolerance was 10 ppm and the MS/MS tolerance was 0.8 Da. Peptideswith a q value lower than 0.1 were considered as positive identifications with ahigh confidence level. One peptide ion was selected for targeted MS/MS analysis:SDQDLR (m/z 366.21). The presence of PTHLH in the samples was determinedby using the same nano-LC–MS/MS system described above. The spectrometricanalysis was performed in a targeted mode, acquiring a full MS/MS scan ofthe precursor ion SDQDLR (m/z 366.21). The quantification was performedwith Xcalibur software versus 2.0SR2 (Thermo Scientific) by using extractedion chromatograms of the optimum MS/MS transitions in terms of sensitivity(SDQDLR, 366.22→ 531.38).
Sample size calculation. An assessment of the number of animals required foreach procedure was performed using Statistical Power Analysis and taking intoconsideration the appropriate statistical tests, significance level of 5% and statisticalpower of 80%. An estimate of variance was inferred from previous experiments,especially considering the variability of tumour xenograft growth.
Method of randomization. A method of randomization was used in theexperiment shown in Fig. 3c. Parental cells were implanted directly into the liverin nude mice (one implant per mouse) and, when the liver tumour signal reached acertain photon flux threshold (>1×10⁸ photons s−1), mice were randomly allocatedto daily systemic treatment with either vehicle or PH-797804.
Group allocation. For the results obtained in Figs 5e, 6c and 7c,d andSupplementary Figs 1a, 3d,e, 4b,e,f and 7a,d the investigator was not aware of groupallocation when assessing the outcome.
Data sets analysed. GSE17538 is a metacohort composed of 177 colon cancerpatients treated at H. Lee Moffitt Cancer Center (Tampa, USA) plus 55 colon cancerpatients treated at Vanderbilt University Medical Center (Vanderbilt, USA; ref. 41).Note that this cohort did not include rectal cancers. GSE14333 contains a pool of290 CRC patients treated at two different hospitals: PeterMacCallumCancer Center(Australia) and H. Lee Moffitt Cancer Center (USA; ref. 42). We combined bothcohorts for a total of 340 CRC expression data sets fromwhich we used 267 (stages I,II and III).Note that theGSE17538 andGSE14333 cohortswere partially overlappingowing to patients treated at H. Lee Moffitt Cancer Center being duplicated in bothdata sets. Duplicated cases were included only once in the final selection. To removebiases due to the data having been collected in different hospitals, we computedz-scores (that is, subtracted the mean and divided by the standard deviation) foreach gene and hospital separately before merging them into a meta-cohort.
Accession number of data set generated for this study (Fig. 2a): GSE33350.
31. Ponomarev, V. et al. A novel triple-modality reporter gene for whole-body fluorescent,bioluminescent, and nuclear noninvasive imaging. Eur. J. Nucl. Med. Mol. Imaging31, 740–751 (2004).
32. Giavazzi, R., Campbell, D. E., Jessup, J. M., Cleary, K. & Fidler, I. J. Metastaticbehavior of tumor cells isolated from primary and metastatic human colorectalcarcinomas implanted into different sites in nude mice. Cancer Res. 46,1928–1933 (1986).
33. Céspedes, M. V. et al. Orthotopic microinjection of human colon cancer cells in nudemice induces tumor foci in all clinically relevant metastatic sites. Am. J. Pathol.170, 1077–1085 (2007).
34. Gentleman, R. C. et al. Bioconductor: open software development for computationalbiology and bioinformatics. Genome Biol. 5, R80 (2004).
35. Rossell, D., Guerra, R. & Scott, C. Semi-parametric differential, expression analysisvia partial mixture estimation. Stat. Appl. Genet. Mol. Biol. 7, Article15 (2008).
36. Mallick, B. K., Gold, D. & Baladandayuthapani, V. Bayesan Analysis of GeneExpression Data (Wiley, 2009).
37. Benjamini, Y. & Hochberg, Y. Controlling the false discovery rate: a practical andpowerful approach to multiple testing. J. Roy. Stat. Soc. Ser. B 57, 289–300 (1995).
38. Alonso, G., Ambrosino, C., Jones, M. & Nebreda, A. R. Differential activation ofp38 mitogen-activated protein kinase isoforms depending on signal strength. J. Biol.Chem. 275, 40641–40648 (2000).
39. Garcia-Albeniz, X. et al. Serum matrilysin correlates with poor survival independentlyof KRAS and BRAF status in refractory advanced colorectal cancer patients treatedwith irinotecan plus cetuximab. Tumour Biol. 32, 417–424 (2011).
40. Martínez-Fernandez, A. et al. Serum matrilysin levels predict outcome in curativelyresected colorectal cancer patients. Ann. Surg. Oncol. 16, 1412–1420 (2009).
41. Smith, J. J. et al. Experimentally derived metastasis gene expression profilepredicts recurrence and death in patients with colon cancer. Gastroenterology 138,958–968 (2010).
42. Jorissen, R. N. et al. Metastasis-associated gene expression changes predict pooroutcomes in patients with dukes stage B and C colorectal cancer. Clin. Cancer Res.15, 7642–7651 (2009).
NATURE CELL BIOLOGY
© 2014 Macmillan Publishers Limited. All rights reserved.
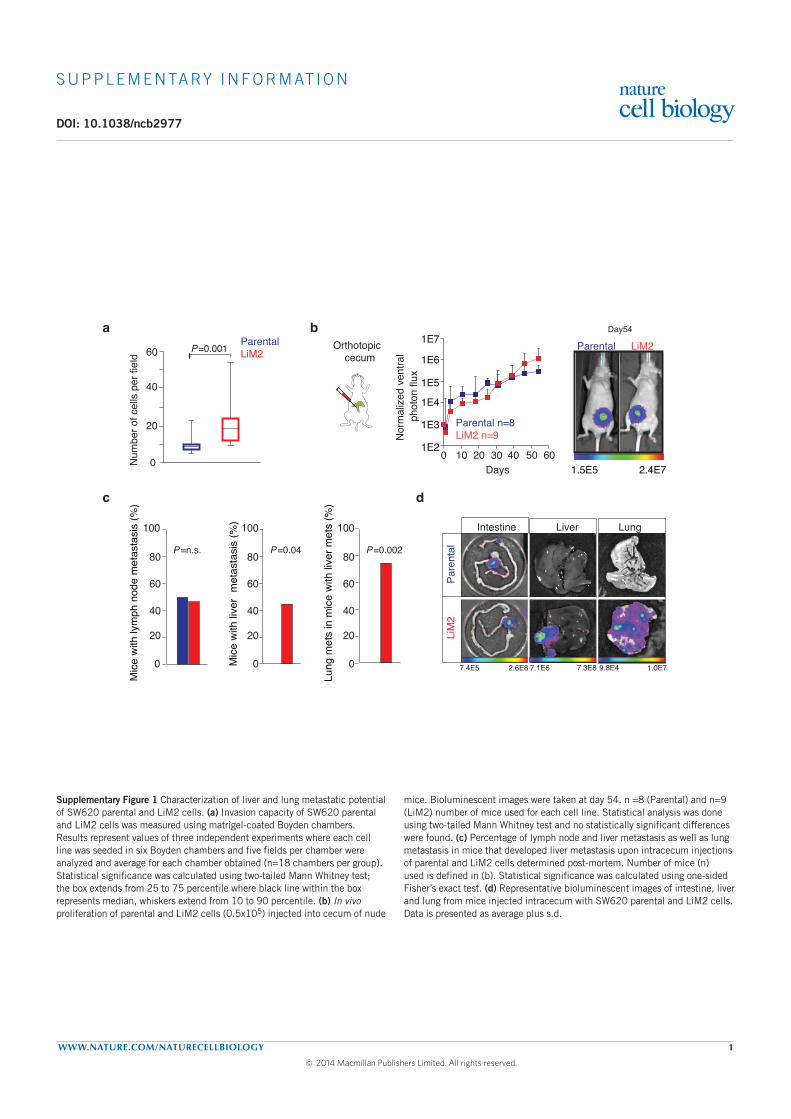
S U P P L E M E N TA RY I N F O R M AT I O N
WWW.NATURE.COM/NATURECELLBIOLOGY 1
DOI: 10.1038/ncb2977N
umbe
r of c
ells
per
fiel
d
P =0.001
0
Parental LiM2
a60
40
20
Orthotopic cecum
Nor
mal
ized
ven
tral
pho
ton
flux
1E2
1E3
1E4
1E5
1E6
1E7
Parental n=8LiM2 n=9
0 10 20 30 40 50 60Days
b
Parental LiM2
2.4E71.5E5
Day54
Mic
e w
ith li
ver
met
asta
sis
(%)
0
40
20
60
80
100
0
40
20
60
80
100
Lun
g m
ets
in m
ice
with
live
r met
s (%
)
0
40
20
60
80
100
Mic
e w
ith ly
mph
nod
e m
etas
tasi
s (%
)c
Pare
ntal
LiM
2
7.4E5 2.6E8 7.3E8 9.8E4 1.0E7
Intestine
7.1E6
Liver Lung
d
Supplementary Figure 1
P =n.s. P =0.002 P =0.04
Supplementary Figure 1 Characterization of liver and lung metastatic potential of SW620 parental and LiM2 cells. (a) Invasion capacity of SW620 parental and LiM2 cells was measured using matrigel-coated Boyden chambers. Results represent values of three independent experiments where each cell line was seeded in six Boyden chambers and five fields per chamber were analyzed and average for each chamber obtained (n=18 chambers per group). Statistical significance was calculated using two-tailed Mann Whitney test; the box extends from 25 to 75 percentile where black line within the box represents median, whiskers extend from 10 to 90 percentile. (b) In vivo proliferation of parental and LiM2 cells (0.5x10⁵) injected into cecum of nude
mice. Bioluminescent images were taken at day 54. n =8 (Parental) and n=9 (LiM2) number of mice used for each cell line. Statistical analysis was done using two-tailed Mann Whitney test and no statistically significant differences were found. (c) Percentage of lymph node and liver metastasis as well as lung metastasis in mice that developed liver metastasis upon intracecum injections of parental and LiM2 cells determined post-mortem. Number of mice (n) used is defined in (b). Statistical significance was calculated using one-sided Fisher’s exact test. (d) Representative bioluminescent images of intestine, liver and lung from mice injected intracecum with SW620 parental and LiM2 cells. Data is presented as average plus s.d.
© 2014 Macmillan Publishers Limited. All rights reserved.
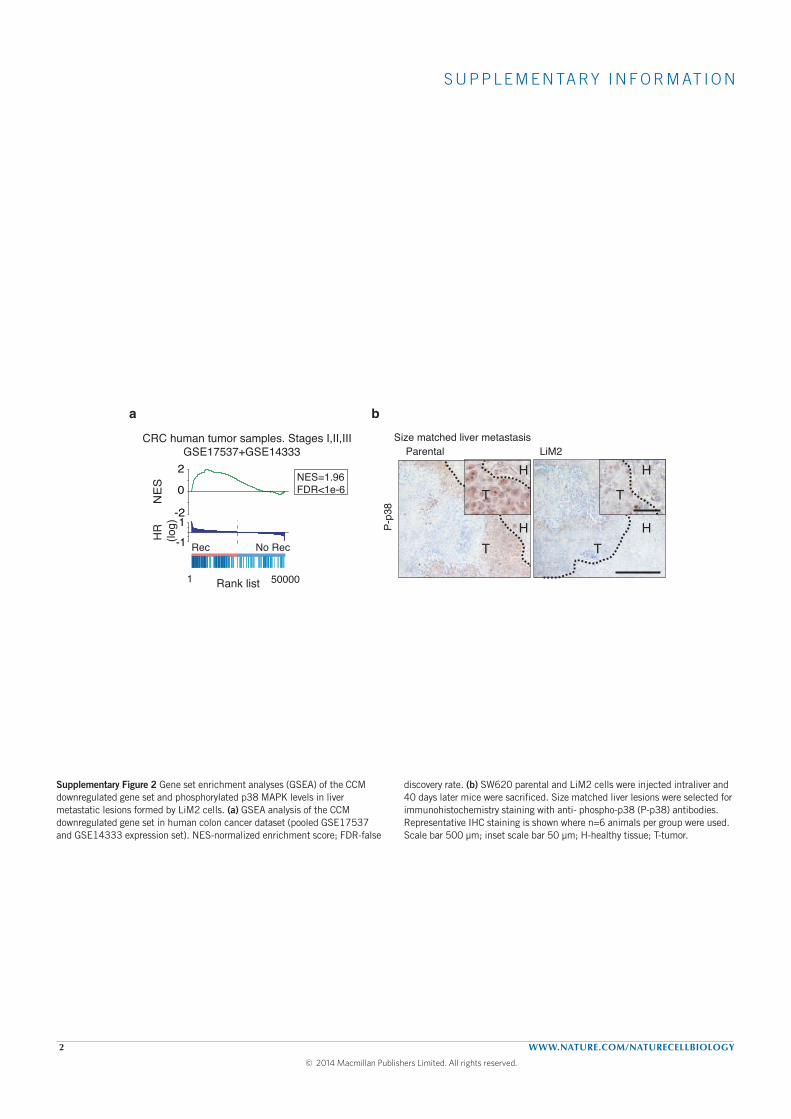
S U P P L E M E N TA RY I N F O R M AT I O N
2 WWW.NATURE.COM/NATURECELLBIOLOGY
Supplementary Figure 2
CRC human tumor samples. Stages I,II,III GSE17537+GSE14333
Rank list1 50000
NES=1.96FDR<1e-6
NE
S 0
HR
(lo
g)
-11
-2
2
Rec No Rec
a b
T TH H
T T
H HParental LiM2
P-p3
8
Size matched liver metastasis
Supplementary Figure 2 Gene set enrichment analyses (GSEA) of the CCM downregulated gene set and phosphorylated p38 MAPK levels in liver metastatic lesions formed by LiM2 cells. (a) GSEA analysis of the CCM downregulated gene set in human colon cancer dataset (pooled GSE17537 and GSE14333 expression set). NES-normalized enrichment score; FDR-false
discovery rate. (b) SW620 parental and LiM2 cells were injected intraliver and 40 days later mice were sacrificed. Size matched liver lesions were selected for immunohistochemistry staining with anti- phospho-p38 (P-p38) antibodies. Representative IHC staining is shown where n=6 animals per group were used. Scale bar 500 μm; inset scale bar 50 μm; H-healthy tissue; T-tumor.
© 2014 Macmillan Publishers Limited. All rights reserved.
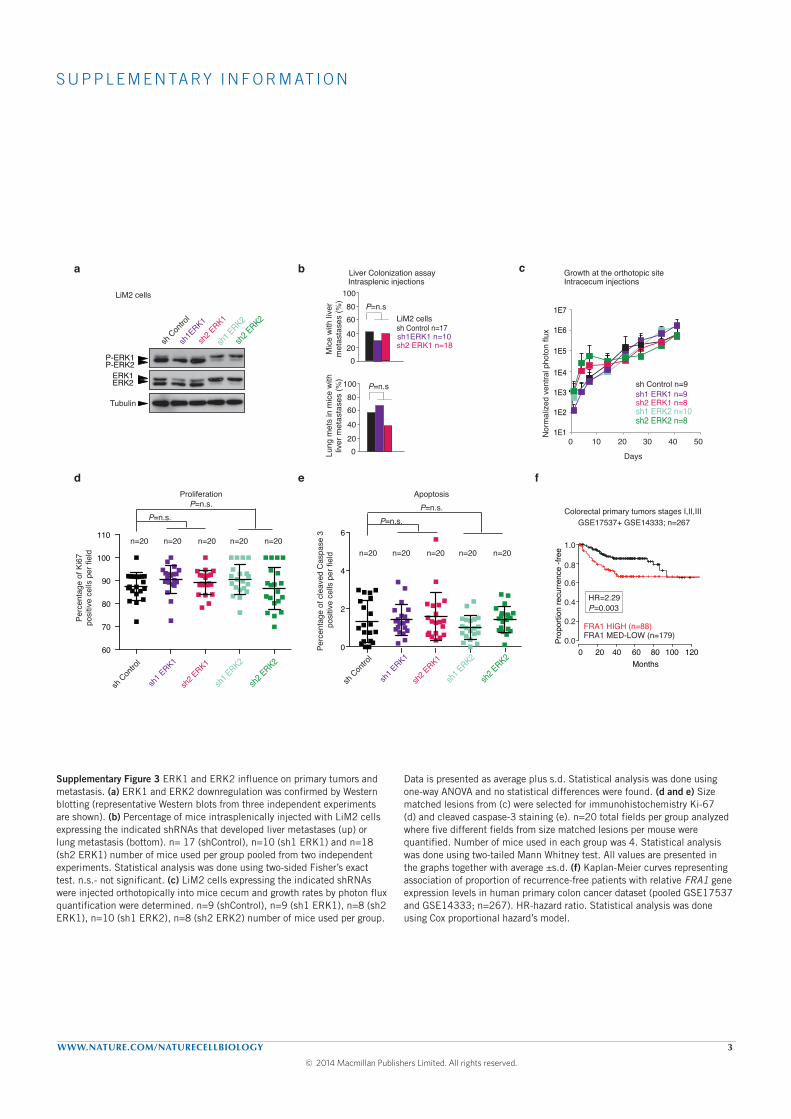
S U P P L E M E N TA RY I N F O R M AT I O N
WWW.NATURE.COM/NATURECELLBIOLOGY 3
d e
a c
N
orm
aliz
ed v
entra
l pho
ton
flux
1E1
1E2
1E3
1E4
1E5
1E6
1E7
Intracecum injections
Days
0 10 20 30 40 50
sh Control n=9sh1 ERK1 n=9sh2 ERK1 n=8sh1 ERK2 n=10sh2 ERK2 n=8
Perc
enta
ge o
f cle
aved
Cas
pase
3
posi
tive
cells
per
fiel
d
0
2
4
6
sh Con
trol
sh1 E
RK1
sh2 E
RK1
sh1 ERK2
sh2 ERK2
n=20 n=20 n=20 n=20 n=20
P=n.s.P=n.s.
Apoptosis
Perc
enta
ge o
f Ki6
7po
sitiv
e ce
lls p
er fi
eld
sh Con
trol
sh1 E
RK1
sh2 E
RK1
sh1 ERK2
sh2 ERK2
n=20 n=20 n=20 n=20 n=20
P=n.s.P=n.s.
Proliferation
60
70
80
90
100
110
b
f
FRA1 MED-LOW (n=179) FRA1 HIGH (n=88)
Months 100 120200 40 60 80
0.0
0.2
0.4
0.6
0.8
1.0Pr
opor
tion
recu
rrenc
e -fr
ee
GSE17537+ GSE14333; n=267 Colorectal primary tumors stages I,II,III
HR=2.29 P=0.003
Growth at the orthotopic siteIntrasplenic injections
Mic
e w
ith li
ver
met
asta
ses
(%)
0 20
100
40
60 80
sh Control n=17LiM2 cells
sh1ERK1 n=10sh2 ERK1 n=18
P=n.s
P=n.s
Lun
g m
ets
in m
ice
with
liv
er m
etas
tase
s (%
)
0 20
100
40
60 80
Liver Colonization assay
sh Con
trol
sh1E
RK1
sh2 E
RK1
sh1 ERK2
sh2 ERK2
P-ERK1 P-ERK2
ERK1 ERK2
Tubulin
LiM2 cells
Supplementary Figure 3
Supplementary Figure 3 ERK1 and ERK2 influence on primary tumors and metastasis. (a) ERK1 and ERK2 downregulation was confirmed by Western blotting (representative Western blots from three independent experiments are shown). (b) Percentage of mice intrasplenically injected with LiM2 cells expressing the indicated shRNAs that developed liver metastases (up) or lung metastasis (bottom). n= 17 (shControl), n=10 (sh1 ERK1) and n=18 (sh2 ERK1) number of mice used per group pooled from two independent experiments. Statistical analysis was done using two-sided Fisher’s exact test. n.s.- not significant. (c) LiM2 cells expressing the indicated shRNAs were injected orthotopically into mice cecum and growth rates by photon flux quantification were determined. n=9 (shControl), n=9 (sh1 ERK1), n=8 (sh2 ERK1), n=10 (sh1 ERK2), n=8 (sh2 ERK2) number of mice used per group.
Data is presented as average plus s.d. Statistical analysis was done using one-way ANOVA and no statistical differences were found. (d and e) Size matched lesions from (c) were selected for immunohistochemistry Ki-67 (d) and cleaved caspase-3 staining (e). n=20 total fields per group analyzed where five different fields from size matched lesions per mouse were quantified. Number of mice used in each group was 4. Statistical analysis was done using two-tailed Mann Whitney test. All values are presented in the graphs together with average ±s.d. (f) Kaplan-Meier curves representing association of proportion of recurrence-free patients with relative FRA1 gene expression levels in human primary colon cancer dataset (pooled GSE17537 and GSE14333; n=267). HR-hazard ratio. Statistical analysis was done using Cox proportional hazard’s model.
© 2014 Macmillan Publishers Limited. All rights reserved.
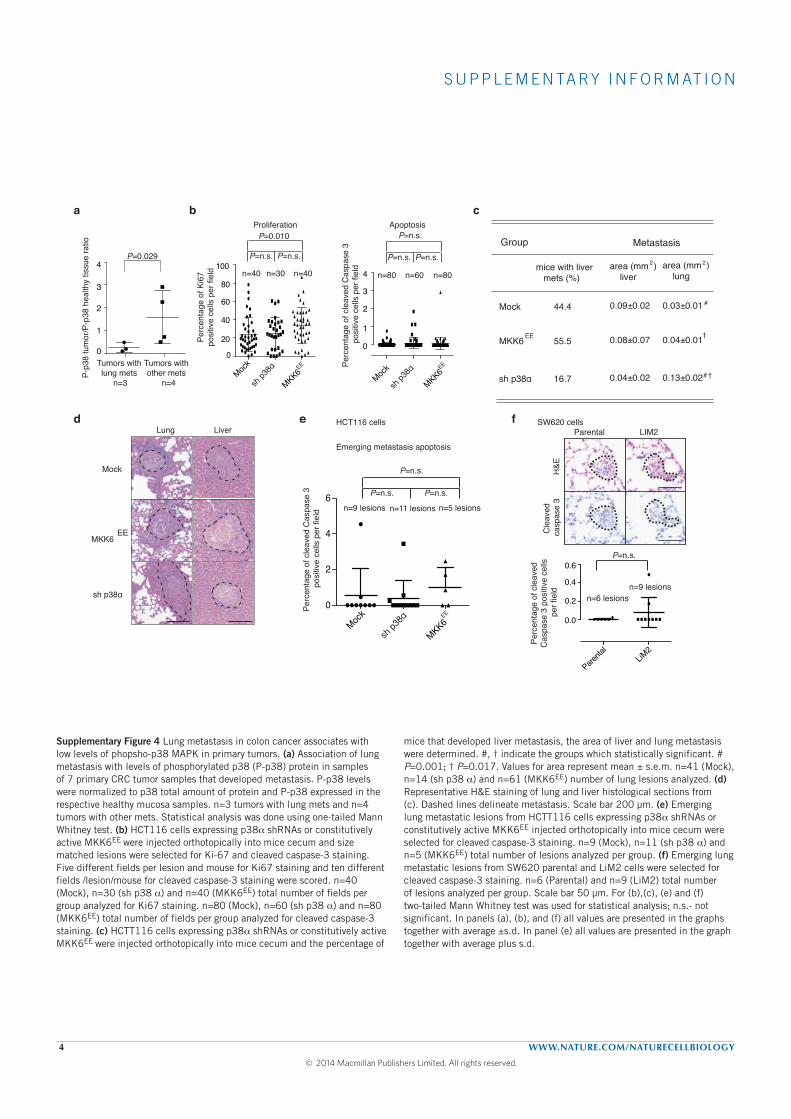
S U P P L E M E N TA RY I N F O R M AT I O N
4 WWW.NATURE.COM/NATURECELLBIOLOGY
Group
EE
sh p38ɑ
MKK6
Mock
mice with liver mets (%)
44.4
16.7
55.5
Metastasis
area (mm ) liver
area (mm ) lung
0.09±0.02
0.08±0.07
0.04±0.02
0.03±0.01
0.04±0.01
0.13±0.02
2 2
c
e
#
#
†
†
a
Mock
EEMKK6
Lung
sh p38ɑ
Liverd f
0
1
2
3
4
P=n.s. P=n.s.
P=n.s.Apoptosis
n=80 n=60 n=80
Mock
sh p3
8ɑ Pe
rcen
tage
of c
leav
ed C
aspa
se 3
po
sitiv
e ce
lls p
er fi
eld
Parental LIM2
H&E
Cle
aved
ca
spas
e 3
Parenta
lLiM
2
P=n.s.
n=6 lesionsn=9 lesions
Perc
enta
ge o
f cle
aved
C
aspa
se 3
pos
itive
cel
ls
per f
ield
0.0
0.2
0.4
0.6
SW620 cells
bProliferation
0
20
40
60
80
100
Mock
MKK6EE
sh p3
8ɑ
P=n.s. P=n.s.
P=0.010
n=40 n=30 n=40
Perc
enta
ge o
f Ki6
7po
sitiv
e ce
lls p
er fi
eld
MKK6EE
Emerging metastasis apoptosis
0
2
4
6n=9 lesions n=11 lesions n=5 lesions
P=n.s. P=n.s.
P=n.s.
Perc
enta
ge o
f cle
aved
Cas
pase
3
posi
tive
cells
per
fiel
d
Mock
MKK6EE
sh p3
8ɑ
HCT116 cells
Supplementary Figure 4
P-p
38 tu
mor
/P-p
38 h
ealth
y tis
sue
ratio
Tumors with lung mets
n=3
Tumors with other mets
n=4
0
1
2
3
4P=0.029
Supplementary Figure 4 Lung metastasis in colon cancer associates with low levels of phopsho-p38 MAPK in primary tumors. (a) Association of lung metastasis with levels of phosphorylated p38 (P-p38) protein in samples of 7 primary CRC tumor samples that developed metastasis. P-p38 levels were normalized to p38 total amount of protein and P-p38 expressed in the respective healthy mucosa samples. n=3 tumors with lung mets and n=4 tumors with other mets. Statistical analysis was done using one-tailed Mann Whitney test. (b) HCT116 cells expressing p38α shRNAs or constitutively active MKK6EE were injected orthotopically into mice cecum and size matched lesions were selected for Ki-67 and cleaved caspase-3 staining. Five different fields per lesion and mouse for Ki67 staining and ten different fields /lesion/mouse for cleaved caspase-3 staining were scored. n=40 (Mock), n=30 (sh p38 α) and n=40 (MKK6EE) total number of fields per group analyzed for Ki67 staining. n=80 (Mock), n=60 (sh p38 α) and n=80 (MKK6EE) total number of fields per group analyzed for cleaved caspase-3 staining. (c) HCTT116 cells expressing p38α shRNAs or constitutively active MKK6EE were injected orthotopically into mice cecum and the percentage of
mice that developed liver metastasis, the area of liver and lung metastasis were determined. #, † indicate the groups which statistically significant. # P=0.001; † P=0.017. Values for area represent mean ± s.e.m. n=41 (Mock), n=14 (sh p38 α) and n=61 (MKK6EE) number of lung lesions analyzed. (d) Representative H&E staining of lung and liver histological sections from (c). Dashed lines delineate metastasis. Scale bar 200 μm. (e) Emerging lung metastatic lesions from HCTT116 cells expressing p38α shRNAs or constitutively active MKK6EE injected orthotopically into mice cecum were selected for cleaved caspase-3 staining. n=9 (Mock), n=11 (sh p38 α) and n=5 (MKK6EE) total number of lesions analyzed per group. (f) Emerging lung metastatic lesions from SW620 parental and LiM2 cells were selected for cleaved caspase-3 staining. n=6 (Parental) and n=9 (LiM2) total number of lesions analyzed per group. Scale bar 50 μm. For (b),(c), (e) and (f) two-tailed Mann Whitney test was used for statistical analysis; n.s.- not significant. In panels (a), (b), and (f) all values are presented in the graphs together with average ±s.d. In panel (e) all values are presented in the graph together with average plus s.d.
© 2014 Macmillan Publishers Limited. All rights reserved.
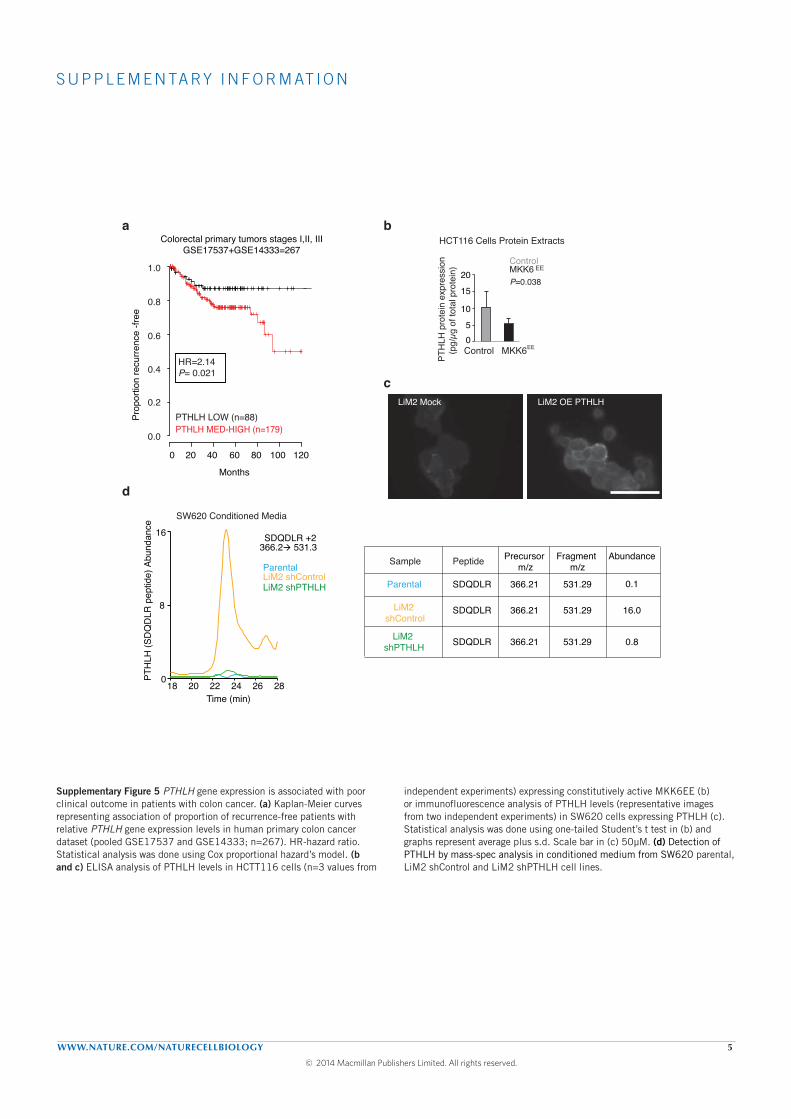
S U P P L E M E N TA RY I N F O R M AT I O N
WWW.NATURE.COM/NATURECELLBIOLOGY 5
18 20 22 24 26 28 Time (min)
0
16
PTH
LH (S
DQ
DLR
pep
tide)
Abu
ndan
ce
8
SDQDLR +2 366.2 531.3
Parental
LiM2 shPTHLHLiM2 shControl
Sample Peptide
Parental
LiM2 shControl
LiM2 shPTHLH
SDQDLR
SDQDLR
SDQDLR
Precursor m/z
Fragment m/z
366.21
366.21
366.21
531.29
531.29
531.29
Abundance
16.0
0.1
0.8
b
d
HR=2.14P= 0.021
Prop
ortio
n re
curre
nce
-free
100 120
Months
200 40 60 80
PTHLH MED-HIGH (n=179)PTHLH LOW (n=88)
0.0
0.2
0.4
0.6
0.8
1.0
a
ControlMKK6 EE
SW620 Conditioned Media
HCT116 Cells Protein ExtractsColorectal primary tumors stages I,II, IIIGSE17537+GSE14333=267
cLiM2 Mock LiM2 OE PTHLH
PTH
LH p
rote
in e
xpre
ssio
n (p
g/µg
of t
otal
pro
tein
)
Control MKK6EE0 5
10
15
20
Supplementary Figure 5
P=0.038
Supplementary Figure 5 PTHLH gene expression is associated with poor clinical outcome in patients with colon cancer. (a) Kaplan-Meier curves representing association of proportion of recurrence-free patients with relative PTHLH gene expression levels in human primary colon cancer dataset (pooled GSE17537 and GSE14333; n=267). HR-hazard ratio. Statistical analysis was done using Cox proportional hazard’s model. (b and c) ELISA analysis of PTHLH levels in HCTT116 cells (n=3 values from
independent experiments) expressing constitutively active MKK6EE (b) or immunofluorescence analysis of PTHLH levels (representative images from two independent experiments) in SW620 cells expressing PTHLH (c). Statistical analysis was done using one-tailed Student’s t test in (b) and graphs represent average plus s.d. Scale bar in (c) 50μM. (d) Detection of PTHLH by mass-spec analysis in conditioned medium from SW620 parental, LiM2 shControl and LiM2 shPTHLH cell lines.
© 2014 Macmillan Publishers Limited. All rights reserved.
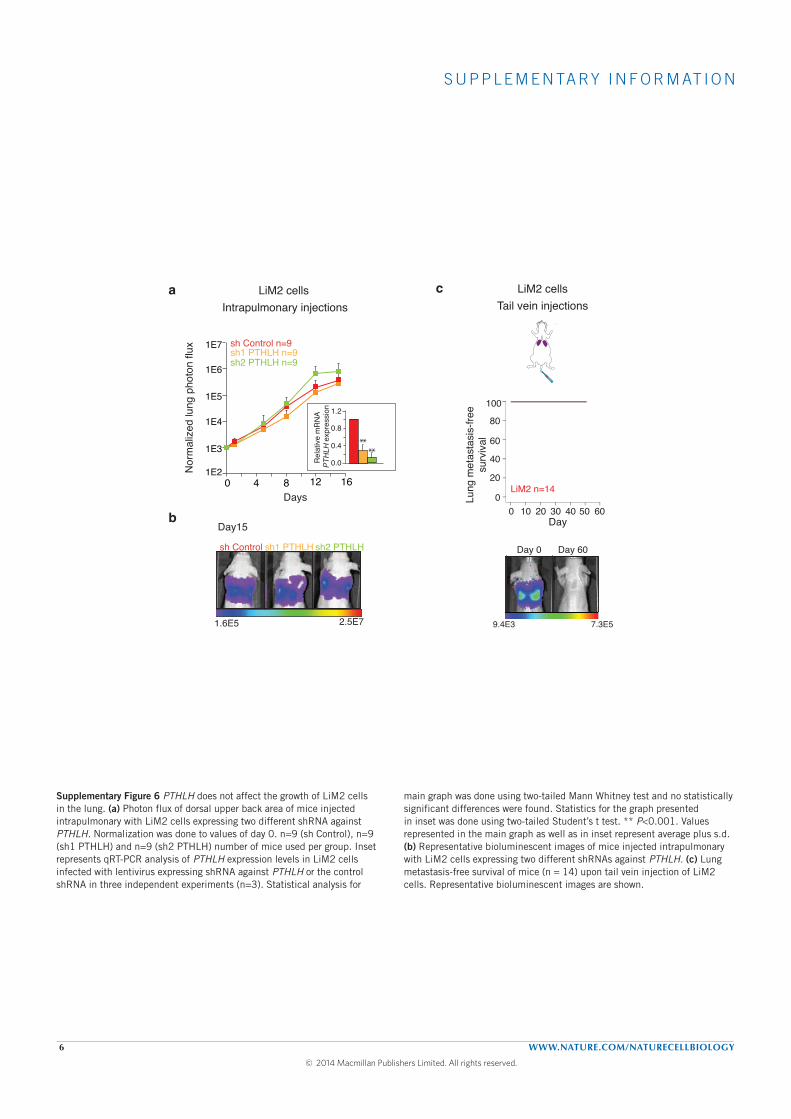
S U P P L E M E N TA RY I N F O R M AT I O N
6 WWW.NATURE.COM/NATURECELLBIOLOGY
sh1 PTHLH n=9 sh Control n=9
Nor
mal
ized
lung
pho
ton
flux
1E6
1E5
1E4
1E3
1E7
1E2
sh2 PTHLH n=9
12840Days
16
Intrapulmonary injections
Day15
sh Control sh1 PTHLH sh2 PTHLH
1.6E5 2.5E7
a
b
LiM2 cells c
Day 60 50 40 30 20 10 0
100
80
60
40
20
0 LiM2 n=14
Lung
met
asta
sis-
free
sur
viva
l
Day 0 Day 60
7.3E59.4E3
Tail vein injectionsLiM2 cells
Supplementary Figure 6
0.0
0.4
Rel
ativ
e m
RN
A PT
HLH
exp
ress
ion
0.8
1.2
**
**
Supplementary Figure 6 PTHLH does not affect the growth of LiM2 cells in the lung. (a) Photon flux of dorsal upper back area of mice injected intrapulmonary with LiM2 cells expressing two different shRNA against PTHLH. Normalization was done to values of day 0. n=9 (sh Control), n=9 (sh1 PTHLH) and n=9 (sh2 PTHLH) number of mice used per group. Inset represents qRT-PCR analysis of PTHLH expression levels in LiM2 cells infected with lentivirus expressing shRNA against PTHLH or the control shRNA in three independent experiments (n=3). Statistical analysis for
main graph was done using two-tailed Mann Whitney test and no statistically significant differences were found. Statistics for the graph presented in inset was done using two-tailed Student’s t test. ** P<0.001. Values represented in the main graph as well as in inset represent average plus s.d. (b) Representative bioluminescent images of mice injected intrapulmonary with LiM2 cells expressing two different shRNAs against PTHLH. (c) Lung metastasis-free survival of mice (n = 14) upon tail vein injection of LiM2 cells. Representative bioluminescent images are shown.
© 2014 Macmillan Publishers Limited. All rights reserved.
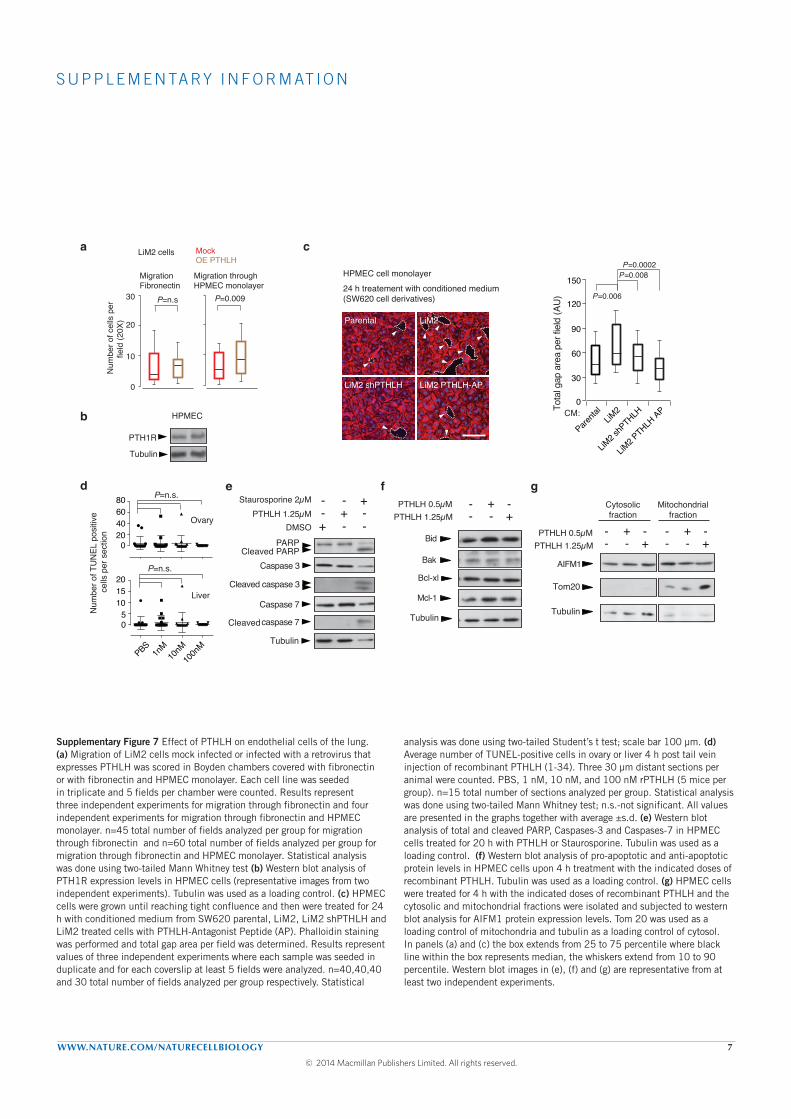
S U P P L E M E N TA RY I N F O R M AT I O N
WWW.NATURE.COM/NATURECELLBIOLOGY 7
b
HPMEC
PTH1R
Tubulin
cOE PTHLH Mock
Migration through HPMEC monolayer
P=0.009
20
10
0
30
Num
ber o
f cel
ls p
er
field
(20X
)
P=n.s
MigrationFibronectin
LiM2 cells a
d
PBS1n
M10
nM10
0nM
05
101520
Num
ber o
f TU
NEL
pos
itive
ce
lls p
er s
ectio
n
P=n.s.
Liver
Ovary
020406080 P=n.s.
Bak
Mcl-1
Bid
- -- -+
+
e
Supplementary Figure 7
Parental LiM2
24 h treatement with conditioned medium (SW620 cell derivatives)
HPMEC cell monolayer
LiM2 shPTHLH
Parental LiM2
LiM2 PTHLH-AP
Tota
l gap
are
a pe
r fie
ld (A
U) P=0.006
150 P=0.008P=0.0002
Parenta
lLiM
2
LiM2 P
THLH AP
LiM2 s
hPTHLH
0CM:
120
30
60
90
AIFM1
Cytosolicfraction
Mitochondrialfraction
g
- -- -+
+ - -- -+
+
Tubulin
Caspase 3
PARPCleaved PARP
Cleaved caspase 3
Caspase 7
Cleaved caspase 7
- -- -- -
++
+f
Tubulin
Bcl-xl
PTHLH 0.5µMPTHLH 1.25µM
PTHLH 0.5µMPTHLH 1.25µM
DMSOPTHLH 1.25µM
Tubulin
Tom20
Staurosporine 2µM
Supplementary Figure 7 Effect of PTHLH on endothelial cells of the lung. (a) Migration of LiM2 cells mock infected or infected with a retrovirus that expresses PTHLH was scored in Boyden chambers covered with fibronectin or with fibronectin and HPMEC monolayer. Each cell line was seeded in triplicate and 5 fields per chamber were counted. Results represent three independent experiments for migration through fibronectin and four independent experiments for migration through fibronectin and HPMEC monolayer. n=45 total number of fields analyzed per group for migration through fibronectin and n=60 total number of fields analyzed per group for migration through fibronectin and HPMEC monolayer. Statistical analysis was done using two-tailed Mann Whitney test (b) Western blot analysis of PTH1R expression levels in HPMEC cells (representative images from two independent experiments). Tubulin was used as a loading control. (c) HPMEC cells were grown until reaching tight confluence and then were treated for 24 h with conditioned medium from SW620 parental, LiM2, LiM2 shPTHLH and LiM2 treated cells with PTHLH-Antagonist Peptide (AP). Phalloidin staining was performed and total gap area per field was determined. Results represent values of three independent experiments where each sample was seeded in duplicate and for each coverslip at least 5 fields were analyzed. n=40,40,40 and 30 total number of fields analyzed per group respectively. Statistical
analysis was done using two-tailed Student’s t test; scale bar 100 μm. (d) Average number of TUNEL-positive cells in ovary or liver 4 h post tail vein injection of recombinant PTHLH (1-34). Three 30 μm distant sections per animal were counted. PBS, 1 nM, 10 nM, and 100 nM rPTHLH (5 mice per group). n=15 total number of sections analyzed per group. Statistical analysis was done using two-tailed Mann Whitney test; n.s.-not significant. All values are presented in the graphs together with average ±s.d. (e) Western blot analysis of total and cleaved PARP, Caspases-3 and Caspases-7 in HPMEC cells treated for 20 h with PTHLH or Staurosporine. Tubulin was used as a loading control. (f) Western blot analysis of pro-apoptotic and anti-apoptotic protein levels in HPMEC cells upon 4 h treatment with the indicated doses of recombinant PTHLH. Tubulin was used as a loading control. (g) HPMEC cells were treated for 4 h with the indicated doses of recombinant PTHLH and the cytosolic and mitochondrial fractions were isolated and subjected to western blot analysis for AIFM1 protein expression levels. Tom 20 was used as a loading control of mitochondria and tubulin as a loading control of cytosol. In panels (a) and (c) the box extends from 25 to 75 percentile where black line within the box represents median, the whiskers extend from 10 to 90 percentile. Western blot images in (e), (f) and (g) are representative from at least two independent experiments.
© 2014 Macmillan Publishers Limited. All rights reserved.
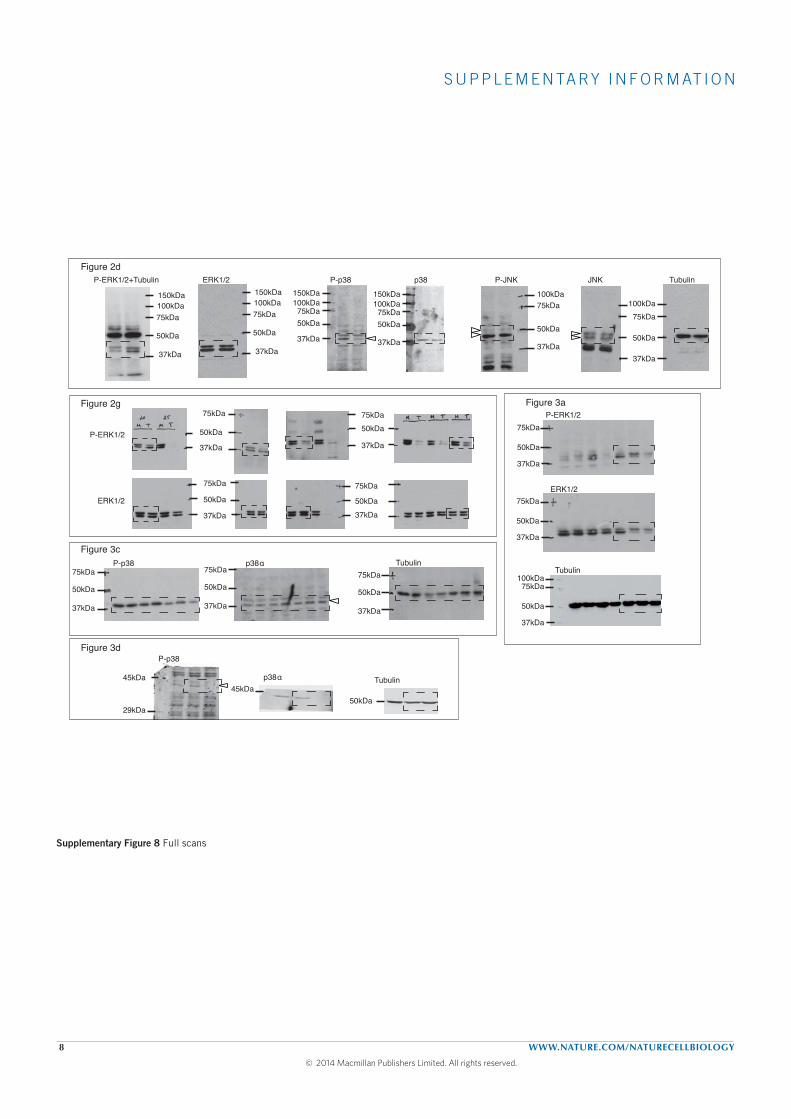
S U P P L E M E N TA RY I N F O R M AT I O N
8 WWW.NATURE.COM/NATURECELLBIOLOGY
Figure 2d P-ERK1/2+Tubulin
50kDa
37kDa
100kDa75kDa
150kDa
50kDa
37kDa
100kDa75kDa
150kDaERK1/2
50kDa
37kDa
100kDa75kDa
150kDa
50kDa
37kDa
100kDa75kDa
150kDa
P-p38 p38 P-JNK
75kDa
50kDa
37kDa
100kDa
JNK
75kDa
50kDa
37kDa
100kDa
Figure 2g
50kDa
37kDa
50kDa
37kDa
ERK1/2
50kDa
37kDa
50kDa37kDa
Figure 3a
Figure 3c
37kDa
50kDa
75kDa
37kDa
50kDa
75kDa
37kDa
50kDa
75kDaP-p38 p38 α Tubulin
37kDa
50kDa
75kDaERK1/2
37kDa
50kDa
75kDa100kDa
37kDa
50kDa
75kDaP-ERK1/2
Tubulin
Figure 3d
45kDa45kDa
50kDa
P-p38
p38 α Tubulin
75kDa
P-ERK1/2
75kDa
75kDa
75kDa
Supplementary Figure 8
Tubulin
ERK1/2
29kDa
Supplementary Figure 8 Full scans
© 2014 Macmillan Publishers Limited. All rights reserved.
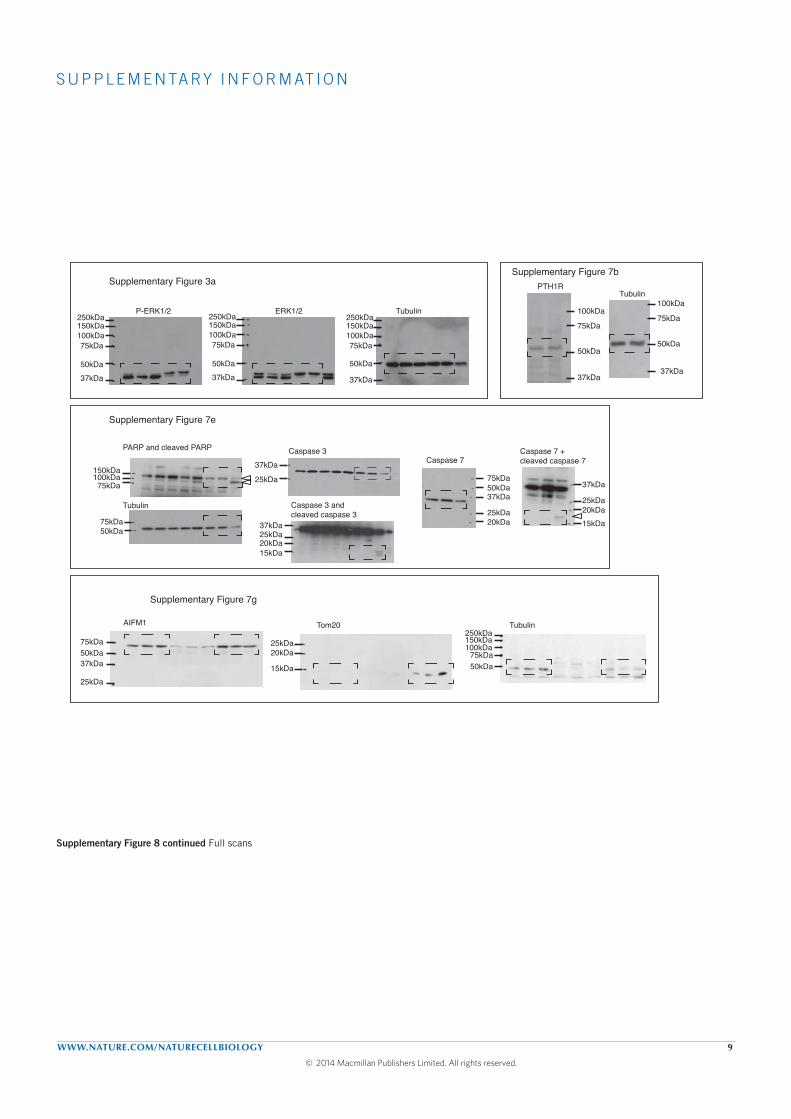
S U P P L E M E N TA RY I N F O R M AT I O N
WWW.NATURE.COM/NATURECELLBIOLOGY 9
Supplementary Figure 7e
37kDa50kDa75kDa
25kDa20kDa
Caspase 7
37kDa
25kDa20kDa15kDa
Caspase 7 +cleaved caspase 737kDa
25kDa
Caspase 3
Caspase 3 and cleaved caspase 3
75kDa100kDa150kDa
PARP and cleaved PARP
75kDa50kDa
Tubulin
Supplementary Figure 7g
Tom20AIFM1 Tubulin
50kDa75kDa
100kDa150kDa250kDa
15kDa
20kDa25kDa
37kDa50kDa75kDa
25kDa
20kDa15kDa
25kDa37kDa
50kDa37kDa
100kDa75kDa
150kDa250kDa
50kDa37kDa
100kDa75kDa
150kDa250kDa
50kDa
37kDa
100kDa75kDa
150kDa250kDa
ERK1/2P-ERK1/2 Tubulin
Supplementary Figure 3a
75kDa
50kDa
37kDa
75kDa
50kDa
37kDa
100kDa100kDa
TubulinPTH1R
Supplementary Figure 7b
Supplementary Figure 8 continued
Supplementary Figure 8 continued Full scans
© 2014 Macmillan Publishers Limited. All rights reserved.

S U P P L E M E N TA RY I N F O R M AT I O N
10 WWW.NATURE.COM/NATURECELLBIOLOGY
Supplementary Video Legend
Supplementary Video 1 PTHLH treatment increases intracellular Ca2+ levels. Cells were treated for 15 min with Fluo4-AM calcium indicator and then imaged for 9 min. First two minutes of imaging were used for determining the basal Ca2+ levels. At min 2, control media was added to cells and at min 5 media with 1.25μM recombinant PTHLH.
Supplementary Table Legends
Supplementary Table 1 Genes differentially expressed between Parental and LiM2 cells. Comparative genome-wide expression analysis of genes that were overexpressed or underexpressed at least 2.5-fold in the highly liver metastatic derivative LiM2 compared to parental cells
Supplementary Table 2 BGSEA for KEGG gene sets (Parental vs. LiM2). By using BGSEA we identified pathway-specific gene expression signatures (KEGG gene sets) that were differentially represented in the gene expression profiles of parental and LiM2 cells.
Supplementary Table 3 Frequency of liver and lung metastasis in a pooled analysis of patients with metastatic colon and rectal cancers. Frequency of liver and lung metastasis in a pooled analysis of patients with metastatic colon and rectal cancers with clinical annotation for the site of metastasis.
Supplementary Table 4 Genes differentially expressed in LiM2 cells compared to Parental that correlated significantly with MKK6 expression in CRC primary tumors. Genes differentially expressed in LiM2 cells compared to Parental (fc>1.7) that correlated significantly (p<0.05) with MKK6 expression in Stage II and III CRC primary tumors.
© 2014 Macmillan Publishers Limited. All rights reserved.
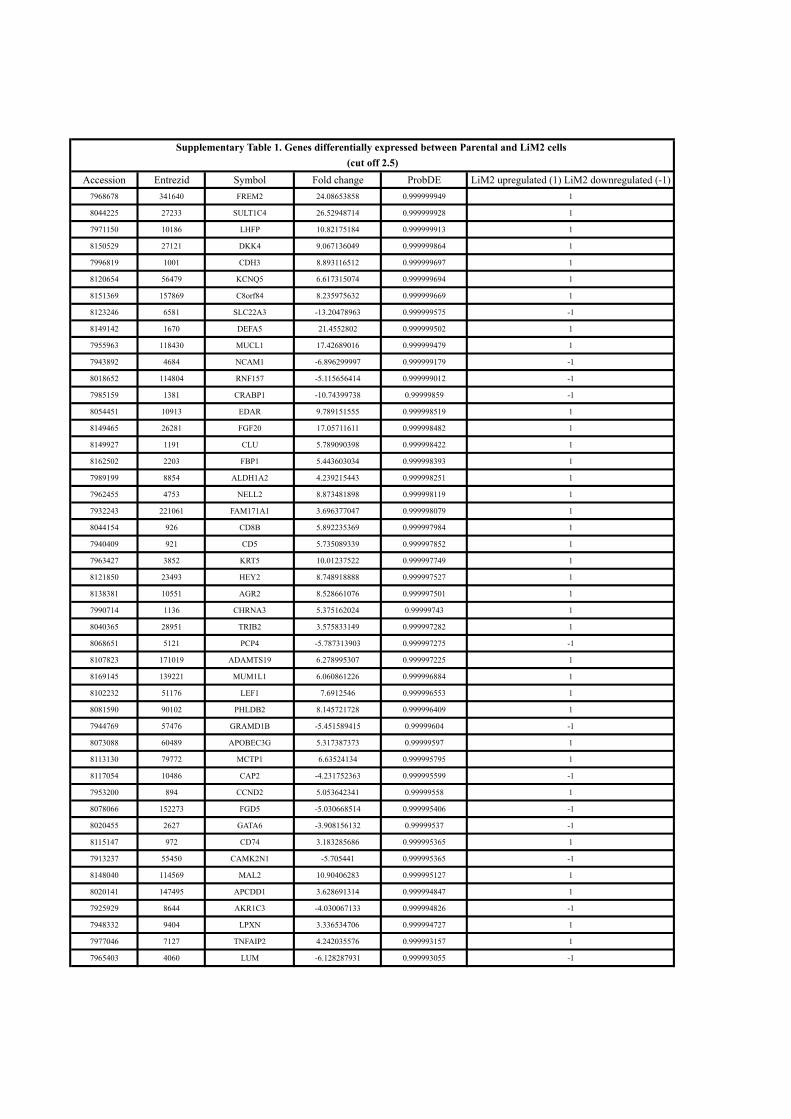
Accession Entrezid Symbol Fold change ProbDE LiM2 upregulated (1) LiM2 downregulated (-1)7968678 341640 FREM2 24.08653858 0.999999949 1
8044225 27233 SULT1C4 26.52948714 0.999999928 1
7971150 10186 LHFP 10.82175184 0.999999913 1
8150529 27121 DKK4 9.067136049 0.999999864 1
7996819 1001 CDH3 8.893116512 0.999999697 1
8120654 56479 KCNQ5 6.617315074 0.999999694 1
8151369 157869 C8orf84 8.235975632 0.999999669 1
8123246 6581 SLC22A3 -13.20478963 0.999999575 -1
8149142 1670 DEFA5 21.4552802 0.999999502 1
7955963 118430 MUCL1 17.42689016 0.999999479 1
7943892 4684 NCAM1 -6.896299997 0.999999179 -1
8018652 114804 RNF157 -5.115656414 0.999999012 -1
7985159 1381 CRABP1 -10.74399738 0.99999859 -1
8054451 10913 EDAR 9.789151555 0.999998519 1
8149465 26281 FGF20 17.05711611 0.999998482 1
8149927 1191 CLU 5.789090398 0.999998422 1
8162502 2203 FBP1 5.443603034 0.999998393 1
7989199 8854 ALDH1A2 4.239215443 0.999998251 1
7962455 4753 NELL2 8.873481898 0.999998119 1
7932243 221061 FAM171A1 3.696377047 0.999998079 1
8044154 926 CD8B 5.892235369 0.999997984 1
7940409 921 CD5 5.735089339 0.999997852 1
7963427 3852 KRT5 10.01237522 0.999997749 1
8121850 23493 HEY2 8.748918888 0.999997527 1
8138381 10551 AGR2 8.528661076 0.999997501 1
7990714 1136 CHRNA3 5.375162024 0.99999743 1
8040365 28951 TRIB2 3.575833149 0.999997282 1
8068651 5121 PCP4 -5.787313903 0.999997275 -1
8107823 171019 ADAMTS19 6.278995307 0.999997225 1
8169145 139221 MUM1L1 6.060861226 0.999996884 1
8102232 51176 LEF1 7.6912546 0.999996553 1
8081590 90102 PHLDB2 8.145721728 0.999996409 1
7944769 57476 GRAMD1B -5.451589415 0.99999604 -1
8073088 60489 APOBEC3G 5.317387373 0.99999597 1
8113130 79772 MCTP1 6.63524134 0.999995795 1
8117054 10486 CAP2 -4.231752363 0.999995599 -1
7953200 894 CCND2 5.053642341 0.99999558 1
8078066 152273 FGD5 -5.030668514 0.999995406 -1
8020455 2627 GATA6 -3.908156132 0.99999537 -1
8115147 972 CD74 3.183285686 0.999995365 1
7913237 55450 CAMK2N1 -5.705441 0.999995365 -1
8148040 114569 MAL2 10.90406283 0.999995127 1
8020141 147495 APCDD1 3.628691314 0.999994847 1
7925929 8644 AKR1C3 -4.030067133 0.999994826 -1
7948332 9404 LPXN 3.336534706 0.999994727 1
7977046 7127 TNFAIP2 4.242035576 0.999993157 1
7965403 4060 LUM -6.128287931 0.999993055 -1
Supplementary Table 1. Genes differentially expressed between Parental and LiM2 cells (cut off 2.5)
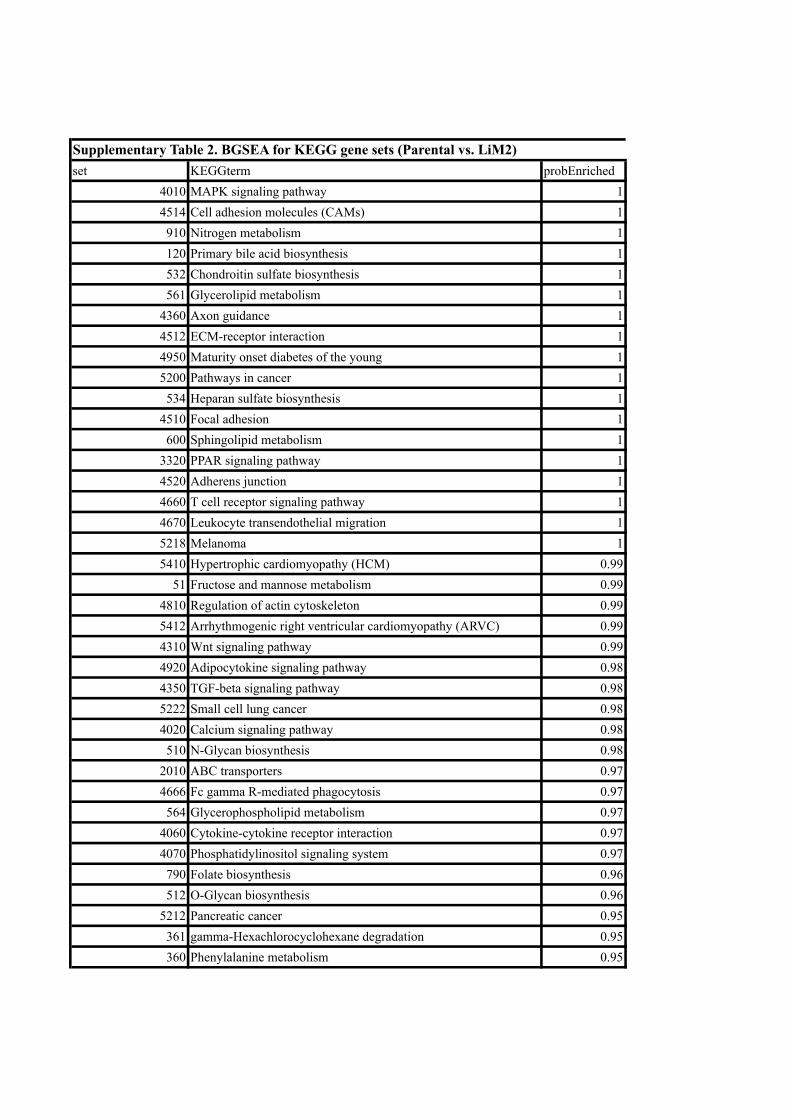
set KEGGterm probEnriched4010 MAPK signaling pathway 14514 Cell adhesion molecules (CAMs) 1910 Nitrogen metabolism 1120 Primary bile acid biosynthesis 1532 Chondroitin sulfate biosynthesis 1561 Glycerolipid metabolism 1
4360 Axon guidance 14512 ECM-receptor interaction 14950 Maturity onset diabetes of the young 15200 Pathways in cancer 1534 Heparan sulfate biosynthesis 1
4510 Focal adhesion 1600 Sphingolipid metabolism 1
3320 PPAR signaling pathway 14520 Adherens junction 14660 T cell receptor signaling pathway 14670 Leukocyte transendothelial migration 15218 Melanoma 15410 Hypertrophic cardiomyopathy (HCM) 0.99
51 Fructose and mannose metabolism 0.994810 Regulation of actin cytoskeleton 0.995412 Arrhythmogenic right ventricular cardiomyopathy (ARVC) 0.994310 Wnt signaling pathway 0.994920 Adipocytokine signaling pathway 0.984350 TGF-beta signaling pathway 0.985222 Small cell lung cancer 0.984020 Calcium signaling pathway 0.98510 N-Glycan biosynthesis 0.98
2010 ABC transporters 0.974666 Fc gamma R-mediated phagocytosis 0.97564 Glycerophospholipid metabolism 0.97
4060 Cytokine-cytokine receptor interaction 0.974070 Phosphatidylinositol signaling system 0.97790 Folate biosynthesis 0.96512 O-Glycan biosynthesis 0.96
5212 Pancreatic cancer 0.95361 gamma-Hexachlorocyclohexane degradation 0.95360 Phenylalanine metabolism 0.95
Supplementary Table 2. BGSEA for KEGG gene sets (Parental vs. LiM2)

Patients with only liver metastasis (%)
Patients with only lung metastasis (%)
Patients with liver and lung metastasis (%)
Total number of patients*
Colon cancer 40 (42.6) 3 (3.2) 23 (24.5) 94Rectal cancer 11 (23.9) 12 (26) 13 (28.3) 46* Some of the patients developed metastasis is sites other than liver and lung.Pooled analysis of patients from references 1 and 2 of supplementary information.
Supplementary Table 3. Frequency of liver and lung metastasis in a pooled analysis of patients with metastatic colon and rectal cancers
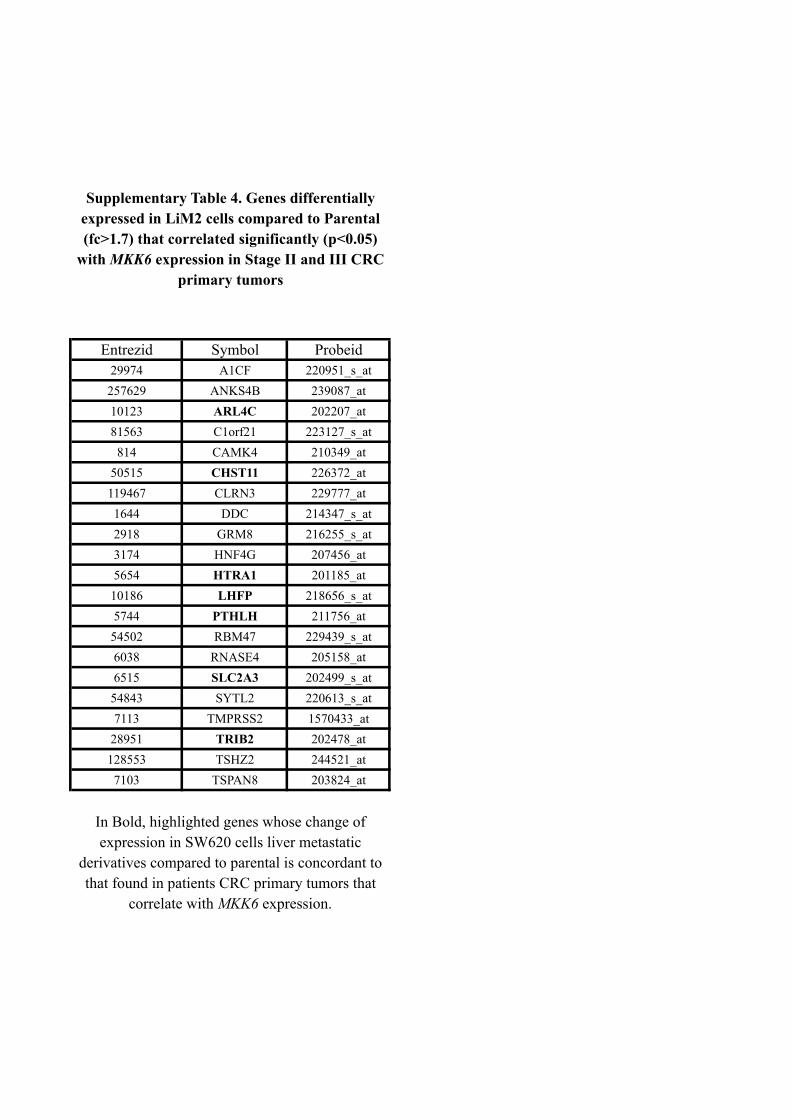
Entrezid Symbol Probeid29974 A1CF 220951_s_at
257629 ANKS4B 239087_at10123 ARL4C 202207_at81563 C1orf21 223127_s_at814 CAMK4 210349_at
50515 CHST11 226372_at119467 CLRN3 229777_at1644 DDC 214347_s_at2918 GRM8 216255_s_at3174 HNF4G 207456_at5654 HTRA1 201185_at
10186 LHFP 218656_s_at5744 PTHLH 211756_at
54502 RBM47 229439_s_at6038 RNASE4 205158_at6515 SLC2A3 202499_s_at
54843 SYTL2 220613_s_at7113 TMPRSS2 1570433_at
28951 TRIB2 202478_at128553 TSHZ2 244521_at7103 TSPAN8 203824_at
Supplementary Table 4. Genes differentially expressed in LiM2 cells compared to Parental (fc>1.7) that correlated significantly (p<0.05)
with MKK6 expression in Stage II and III CRC primary tumors
In Bold, highlighted genes whose change of expression in SW620 cells liver metastatic
derivatives compared to parental is concordant to that found in patients CRC primary tumors that
correlate with MKK6 expression.
5
Discussion
We used two diverse and complementary approaches to shed light on the biology that
drives the clinical behavior of CRC.
In the first place, we have used a modern epidemiology approach combining a
prospective cohort of healthy individuals where we identified incident cases of CRC
with genotyping techniques and histological characterization of the tumors. The use
of a prospectively collected detailed data on CRC risk factors over a long-term follow-
up allowed us to account for the main potential confounders of our association. We
found that in this study, involving 1509 cases of CRC and 2307 controls nested in the
two prospective cohorts, the CRC-susceptibility locus SMAD7 intronic rs4939827 was
associated with a lower risk of CRCs with pT1 and pT2 stage but not pT3 and pT4
stage. Among patients diagnosed with CRC, those with at least one G allele had 1.5 -
fold higher odds of having a pT3 or pT4 tumor compared with a pT1 or pT2 tumor.
This finding may explain in part observed associations of the G allele of rs4939827 with
lower overall risk of incident CRC (23), but worsened survival after diagnosis (25, 112).
The seemingly contrary associations of this SNP in SMAD7 with decreased risk
of incident disease shown in GWAS studies (17, 22) but poorer outcomes in patients
with established disease may be due to SMAD7’s known involvement in modulating
the TGFβ type 1 pathway.
The SMAD7 gene codes for an intracellular protein that interacts with the TGFβ
type 1 receptor, and promotes its degradation in the proteasome therefore inhibiting
TGFβ1-induced phosphorylation of SMAD2/SMAD3 (113). SMAD7 overexpression
has been reported to be associated with the development of lung, pancreatic and skin
61
5. DISCUSSION
cancer and at the same time it can delay hepatocellular carcinoma growth and inhibit
metastasis from melanoma and breast cancer (114). SMAD7 also exerts its function via
TGFβ-independent pathways. Specifically, it downregulates CDC25A (a phosphatase
that regulates cell cycle) at a postranscriptional level (115). In normal epithelium,
TGFβ1 functions as a tumor suppressor through induction of cell arrest and inhibition
of cell proliferation. However, once cells are resistant to TGFβ1-mediated prolifera-
tive inhibition (i.e. in established tumors), TGFβ1 appears to promote metastasis by
enhancing angiogenesis and extracellular matrix disruption and inhibiting infiltrating
tumor immune cells.
We also found an association of rs4939827 with RUNX3 methylation status in the
tumors, which supports a role of rs4939827 in the TGFβ1 pathway. RUNX3 is a Runt
domain transcription factor 3 involved in TGFβ1 signaling by interaction with SMAD
transcription factors and it is considered a suppressor of solid tumors. The RUNX3
promoter is commonly aberrantly methylated in a CpG island in CRC (116, 117, 118),
leading to gene inactivation. RUNX3 is a downstream target of the TGFβ pathway.
Specifically, RUNX3 is involved in mediating TGFβ-induced apoptosis. RUNX3 an-
tagonizes the oncogenic Wnt pathway in CRC carcinogenesis by binding directly to the
T-cell factor 4 (TCF4) and forming a ternary complex with β-catenin that negatively
regulates the transcriptional activity of Wnt target genes (119). RUNX3 also acts as
a downstream target of the bone morphogenetic proteins (proteins that belong to the
TGFβ superfamily with a wide range of functions, including proliferation and apopto-
sis) and exerts its tumor suppressor effect by inhibiting c-Myc (120). RUNX3 SNPs
are associated with survival after a diagnosis of CRC (121). Differential methylation
of RUNX3 according to rs4939827 could help explain the worsened survival among
individuals with CRC who have a variant G allele (121). TGFβ and Wnt signaling are
involved in the induction of epithelial-mesenchymal transition, a process that mediates
invasion and metastasis in CRC. However, our mediation analysis does not suggest that
the association between rs4939827 on risk of CRC according to pT stage is primarily
related to RUNX3. Nonetheless, the mediation analysis should be interpreted in the
context of some limitations (111), including the assumption of a lack of other, strong
unmeasured confounders.
We also examined several other molecular markers besides RUNX3 and did not
observe relevant differences in the association with rs4939827. BRAF status did appear
62
to be differentially associated with rs4939827 (uncorrected p value=0.02), despite the
lack of a significant p value for heterogeneity after correction for multiple comparisons.
Given that an interplay between TGFβ and BRAF mutations is biologically plausible
(122) and that BRAF mutations are relative rare and strongly associated with CRC
prognosis (123, 124), we cannot rule out that in a larger sample size such heterogeneity
might have been more evident. A previous study that also studied the heterogeneity
in associations of rs4939827 with CIMP status, MSI, KRAS or p53 mutational status
did not find any relevant association (121).
In the second place, we used a bench approach based on cell lines and animal models
merged with publically available clinical data to investigate mechanisms of metastasis
in CRC, taking advantadge of high-throughput gene expression technology. Research
on biology of metastasis has progressed in the last decade, throwing light on many of
the processes involved: angiogenesis, the role of the stroma, EMT and mesenchimal-to-
epithelial transition, intravasation, circulation, extravasation, survival upon arrival to
the distant organ, stemness, the role of metastatic niches and celullar latency (71, 81).
Here we describe a novel “metastasis from metastasis” mechanism of CRC spread.
Liver is the predominant site of CRC; nevertheless, a small set of patients with KRAS
mutant tumors can also present lung metastasis with an enrichment of KRAS mutations
(125). We provide evidence for a distinct mechanism that relies on different signalling
pathways whose hierarchical modulation enhances the ability of departing tumour cells
to consecutively seed the liver and the lungs.
After enriching the liver metastatic capacity of a mutant KRAS cell line, colaterally
the lung metastatic capacity was also enhanced. Through mRNA expression and path-
way analysis we identified a high activity of ERK1/2 and low levels of p38 as plausible
mediators. Reinforcing these findings, a low ERK/p38 signal ratio was found in fresh
tumor biopsies from CRC patients with liver metastasis as compared with patients
without metastasis after two years of follow-up from primary tumor surgery. This is
in line with previous studies that have shown that ERK signaling favors circulating
tumor cells colonization and growth (126). Notably, we propose that p38 inhibition
is required for lung colonization exclusively and that this is mediated by the cytokine
PTHLH. Loss of p38 induces PHTLH which in turn induces caspase-independent en-
dothelial cell death allowing extravasation of circulating tumor cells into the lung.
63
5. DISCUSSION
Our study confronts previous evidence claiming “distant metastasis do not metas-
tasize” (127). The study of Holzel et.al. argues, using breast cancer data from a
national tumor registry and analyzing the relationship of metastasis-free survival or
overall survival with primary tumor size and lymph node involvement, that all the
metastasis happen before primary tumor retrieval (127). They do not provide any
experimental evidence to support their claim. Metastatic cancer cells need to gain a
number of functions in order to be able to generate overt metastases (i.e. angiogenesis,
stroma activation, invasion, EMT, intravasation, circulation, extravasation, survival
on the distant organ, stemness, immune evasion, cellular latency, reactivation, special-
ized cooption, recirculation (81)). It seems unlikely that cells that have gained these
functions and have been able to colonize a distant organ cannot repeat the process to
colonize a second one. Experimental evidence shows that metastatic cells can seed the
primary tumor with more efficiency than their corresponding parental lines (49).
Our results indicate that genetic changes that allow cancer cells to efficiently metas-
tatize to the liver must be followed by additional genetic alterations that allow sec-
ondary metastases from the liver to the lung, emphasizing the concept of “metastases
from metastases”. We illustrate the systemic contribution of PTHLH released from
tumor cells in supporting distant metastatic processes by triggering vascular perme-
ability. The expression of PTHLH is higher in CRC tissue than in normal colorectal
mucosa or polyps (128), and our findings emphasize the ability of PTHLH to trigger
caspase-independent cell death at the lung vasculature as a novel contributor to the
hierarchical process of metastasis in CRC. Previous studies have implicated PTHLH
in breast and squamous cell carcinoma tumour progression to bone metastasis through
its activity in the bone remodelling process (129, 130, 131).
The observation that liver and lung colonization are linked to tumour-specific or
circulating cell-specific factors may help create new therapeutic opportunities and also
opens new questions that can help understand the biology of the evolution of CRC.
Based on our results, Bragado et al. hypothesized that, given that TGFβ2 and BMPs
can induce dormancy post extravasation by establishing a low ERK/p38 signaling ratio
(126, 132), our cell line with higher metastatic capacity might have regained sensitivity
to dormancy signals via p38 activation. This opens new research opportunities and
enrich the research field on metastasis of CRC.
64
6
Conclusions
• Patients with the rs4939827 CRC-susceptibility locus diagnosed with CRC tend
to develop tumors with greater invasiveness (as measured by the pT stage).
• The variant rs4939827 is differentially associated with RUNX3 methylation sta-
tus, supporting an effect of rs4939827 or causal variants tagged by this SNP on
carcinogenesis mediated through the TGFβ pathway. Taken together, these re-
sults could explain, at least in part, the lower risk of CRC associated with the G
allele of rs4939827 yet poorer survival.
• ERK2 activation provides colon cancer cells with the ability to seed and colonize
the liver.
• Reduced p38 MAPK signalling endows cancer cells with the ability to form
lung metastasis from previously established liver lesions. Downregulation of p38
MAPK signalling results in increased expression of the cytokine PTHLH, which
contributes to colon cancer cell extravasation to the lung by inducing caspase-
independent death in endothelial cells of the lung microvasculature.
65

6. CONCLUSIONS
66
References
[1] http://globocan.iarc.fr/ (last accessed 08/24/14), ed-
itor. GLOBOCAN 2012. International Agency for
Research on Cancer (World Health Organization), 06
2012. 1
[2] P Lichtenstein, N V Holm, P K Verkasalo, A Iliadou,
J Kaprio, M Koskenvuo, E Pukkala, A Skytthe, and
K Hemminki. Environmental and heritable factors
in the causation of cancer–analyses of cohorts of
twins from Sweden, Denmark, and Finland. N
Engl J Med, 343(2):78–85, Jul 2000. 1
[3] Paul R Burton, Martin D Tobin, and John L Hopper.
Key concepts in genetic epidemiology. Lancet,
366(9489):941–51, 2005. 3
[4] Teri A Manolio, Francis S Collins, Nancy J Cox, David B
Goldstein, Lucia A Hindorff, David J Hunter, Mark I
McCarthy, Erin M Ramos, Lon R Cardon, Aravinda
Chakravarti, Judy H Cho, Alan E Guttmacher, Augustine
Kong, Leonid Kruglyak, Elaine Mardis, Charles N Ro-
timi, Montgomery Slatkin, David Valle, Alice S Whitte-
more, Michael Boehnke, Andrew G Clark, Evan E Eich-
ler, Greg Gibson, Jonathan L Haines, Trudy F C Mackay,
Steven A McCarroll, and Peter M Visscher. Finding
the missing heritability of complex diseases. Na-
ture, 461(7265):747–53, Oct 2009. 3
[5] R S Houlston, J Cheadle, S E Dobbins, A Tenesa,
A M Jones, K Howarth, S L Spain, P Broder-
ick, E Domingo, S Farrington, J G Prendergast,
A M Pittman, E Theodoratou, C G Smith, B Olver,
A Walther, R A Barnetson, M Churchman, E E Jaeger,
S Penegar, E Barclay, L Martin, M Gorman, R Mager,
E Johnstone, R Midgley, I Niittymaki, S Tuupanen, J Col-
ley, S Idziaszczyk, H J Thomas, A M Lucassen, D G
Evans, E R Maher, T Maughan, A Dimas, E Dermitza-
kis, J B Cazier, L A Aaltonen, P Pharoah, D J Kerr, L G
Carvajal-Carmona, H Campbell, M G Dunlop, and I P
Tomlinson. Meta-analysis of three genome-wide
association studies identifies susceptibility loci
for colorectal cancer at 1q41, 3q26.2, 12q13.13
and 20q13.33. Nat Genet, 42(11):973–977, 2010. 4
[6] Ulrike Peters, Shuo Jiao, Fredrick R Schumacher, Car-
olyn M Hutter, Aaron K Aragaki, John A Baron, Sonja I
Berndt, Stephane Bezieau, Hermann Brenner, Katja But-
terbach, Bette J Caan, Peter T Campbell, Christopher S
Carlson, Graham Casey, Andrew T Chan, Jenny Chang-
Claude, Stephen J Chanock, Lin S Chen, Gerhard A Co-
etzee, Simon G Coetzee, David V Conti, Keith R Curtis,
David Duggan, Todd Edwards, Charles S Fuchs, Steven
Gallinger, Edward L Giovannucci, Stephanie M Goga-
rten, Stephen B Gruber, Robert W Haile, Tabitha A
Harrison, Richard B Hayes, Brian E Henderson, Michael
Hoffmeister, John L Hopper, Thomas J Hudson, David J
Hunter, Rebecca D Jackson, Sun Ha Jee, Mark A Jenk-
ins, Wei-Hua Jia, Laurence N Kolonel, Charles Kooper-
berg, Sebastien Kury, Andrea Z Lacroix, Cathy C Laurie,
Cecelia A Laurie, Loic Le Marchand, Mathieu Lemire,
David Levine, Noralane M Lindor, Yan Liu, Jing Ma,
Karen W Makar, Keitaro Matsuo, Polly A Newcomb,
John D Potter, Ross L Prentice, Conghui Qu, Thomas Ro-
han, Stephanie A Rosse, Robert E Schoen, Daniela Sem-
inara, Martha Shrubsole, Xiao-Ou Shu, Martha L Slat-
tery, Darin Taverna, Stephen N Thibodeau, Cornelia M
Ulrich, Emily White, Yongbing Xiang, Brent W Zanke,
Yi-Xin Zeng, Ben Zhang, Wei Zheng, Li Hsu, and Colon
Cancer Family Registry and the Genetics and Epidemiol-
ogy of Colorectal Cancer Consortium. Identification
of Genetic Susceptibility Loci for Colorectal Tu-
mors in a Genome-Wide Meta-analysis. Gastroen-
terology, 144(4):799–807.e24, Apr 2013. 4, 5
[7] Stephanie L Stenzel, Fredrick R Schumacher, Christo-
pher K Edlund, David V Conti, Leon Raskin, Flavio
Lejbkowicz, Mila Pinchev, Hedy S Rennert, Mark A Jenk-
ins, John L Hopper, Daniel D Buchanan, Noralane M
Lindor, Loic Le Marchand, Steven Gallinger, Robert W
Haile, Polly A Newcomb, Shu-Chen Huang, Gad Rennert,
Graham Casey, and Stephen B Gruber. A novel col-
orectal cancer risk locus at 4q32.2 identified from
an international genome-wide association study.
Carcinogenesis, Jul 2014. 4
[8] Wei-Hua Jia, Ben Zhang, Keitaro Matsuo, Aesun Shin,
Yong-Bing Xiang, Sun Ha Jee, Dong-Hyun Kim, Zefang
Ren, Qiuyin Cai, Jirong Long, Jiajun Shi, Wanqing Wen,
Gong Yang, Ryan J Delahanty, Genetics and Epidemiol-
ogy of Colorectal Cancer Consortium (GECCO), Colon
Cancer Family Registry (CCFR), Bu-Tian Ji, Zhi-Zhong
Pan, Fumihiko Matsuda, Yu-Tang Gao, Jae Hwan Oh,
Yoon-Ok Ahn, Eun Jung Park, Hong-Lan Li, Ji Won Park,
Jaeseong Jo, Jin-Young Jeong, Satoyo Hosono, Graham
Casey, Ulrike Peters, Xiao-Ou Shu, Yi-Xin Zeng, and Wei
Zheng. Genome-wide association analyses in East
Asians identify new susceptibility loci for col-
orectal cancer. Nat Genet, 45(2):191–6, Feb 2013.
4
[9] Malcolm G Dunlop, Sara E Dobbins, Susan Mary Far-
rington, Angela M Jones, Claire Palles, Nicola Whif-
fin, Albert Tenesa, Sarah Spain, Peter Broderick, Li-
Yin Ooi, Enric Domingo, Claire Smillie, Marc Henrion,
Matthew Frampton, Lynn Martin, Graeme Grimes, Mag-
gie Gorman, Colin Semple, Yusanne P Ma, Ella Bar-
clay, James Prendergast, Jean-Baptiste Cazier, Bianca
Olver, Steven Penegar, Steven Lubbe, Ian Chander,
Luis G Carvajal-Carmona, Stephane Ballereau, Amy
Lloyd, Jayaram Vijayakrishnan, Lina Zgaga, Igor Rudan,
Evropi Theodoratou, Colorectal Tumour Gene Iden-
tification (CORGI) Consortium, John M Starr, Ian
Deary, Iva Kirac, Dujo Kovacevic, Lauri A Aaltonen,
Laura Renkonen-Sinisalo, Jukka-Pekka Mecklin, Koichi
Matsuda, Yusuke Nakamura, Yukinori Okada, Steven
Gallinger, David J Duggan, David Conti, Polly New-
comb, John Hopper, Mark A Jenkins, Fredrick Schu-
macher, Graham Casey, Douglas Easton, Mitul Shah,
Paul Pharoah, Annika Lindblom, Tao Liu, Swedish Low-
Risk Colorectal Cancer Study Group, Christopher G
Smith, Hannah West, Jeremy P Cheadle, COIN Collab-
orative Group, Rachel Midgley, David J Kerr, Harry
Campbell, Ian P Tomlinson, and Richard S Houlston.
Common variation near CDKN1A, POLD3 and
67
REFERENCES
SHROOM2 influences colorectal cancer risk. Nat
Genet, 44(7):770–6, Jul 2012. 4
[10] R Cui, Y Okada, S G Jang, J L Ku, J G Park, Y Kamatani,
N Hosono, T Tsunoda, V Kumar, C Tanikawa, N Kamatani,
R Yamada, M Kubo, Y Nakamura, and K Matsuda. Com-
mon variant in 6q26-q27 is associated with dis-
tal colon cancer in an Asian population. Gut,
60(6):799–805, June 2011. 4
[11] Ian P M Tomlinson, Emily Webb, Luis Carvajal-Carmona,
Peter Broderick, Kimberley Howarth, Alan M Pittman,
Sarah Spain, Steven Lubbe, Axel Walther, Kate Sulli-
van, Emma Jaeger, Sarah Fielding, Andrew Rowan, Ja-
yaram Vijayakrishnan, Enric Domingo, Ian Chandler, Zoe
Kemp, Mobshra Qureshi, Susan M Farrington, Albert
Tenesa, James G D Prendergast, Rebecca A Barnetson,
Steven Penegar, Ella Barclay, Wendy Wood, Lynn Mar-
tin, Maggie Gorman, Huw Thomas, Julian Peto, D Tim-
othy Bishop, Richard Gray, Eamonn R Maher, Anneke
Lucassen, David Kerr, D Gareth R Evans, Clemens Schaf-
mayer, Stephan Buch, Henry Volzke, Jochen Hampe,
Stefan Schreiber, Ulrich John, Thibaud Koessler, Paul
Pharoah, Tom van Wezel, Hans Morreau, Juul T Wij-
nen, John L Hopper, Melissa C Southey, Graham G Giles,
Gianluca Severi, Sergi Castellvı-Bel, Clara Ruiz-Ponte,
Angel Carracedo, Antoni Castells, Asta Forsti, Kari
Hemminki, Pavel Vodicka, Alessio Naccarati, Lara Lip-
ton, Judy W C Ho, K K Cheng, Pak C Sham, J Luk,
Jose A G Agundez, Jose M Ladero, Miguel de la Hoya,
Trinidad Caldes, Iina Niittymaki, Sari Tuupanen, Auli
Karhu, Lauri Aaltonen, Jean-Baptiste Cazier, Harry
Campbell, Malcolm G Dunlop, and Richard S Houlston.
A genome-wide association study identifies col-
orectal cancer susceptibility loci on chromosomes
10p14 and 8q23.3. Nature genetics, 40(5):623–30,
May 2008. 4, 5
[12] Brent W Zanke, Celia M T Greenwood, Jagadish
Rangrej, Rafal Kustra, Albert Tenesa, Susan M
Farrington, James Prendergast, Sylviane Olschwang,
Theodore Chiang, Edgar Crowdy, Vincent Ferretti,
Philippe Laflamme, Saravanan Sundararajan, Stephanie
Roumy, Jean-Francois Olivier, Frederick Robidoux,
Robert Sladek, Alexandre Montpetit, Peter Camp-
bell, Stephane Bezieau, Anne Marie O’Shea, George Zo-
gopoulos, Michelle Cotterchio, Polly Newcomb, John
McLaughlin, Ban Younghusband, Roger Green, Jane
Green, Mary E M Porteous, Harry Campbell, He-
lene Blanche, Mourad Sahbatou, Emmanuel Tubacher,
Catherine Bonaiti-Pellie, Bruno Buecher, Elio Riboli,
Sebastien Kury, Stephen J Chanock, John Potter, Gilles
Thomas, Steven Gallinger, Thomas J Hudson, and Mal-
colm G Dunlop. Genome-wide association scan
identifies a colorectal cancer susceptibility locus
on chromosome 8q24. Nat Genet, 39(8):989–94, Aug
2007. 4
[13] Stephen B Gruber, Victor Moreno, Laura S Rozek,
Hedy S Rennerts, Flavio Lejbkowicz, Joseph D Bonner,
Joel K Greenson, Thomas J Giordano, Eric R Fearson,
and Gad Rennert. Genetic variation in 8q24 asso-
ciated with risk of colorectal cancer. Cancer Biol
Ther, 6(7):1143–7, Jul 2007. 4
[14] Christopher A Haiman, Loıc Le Marchand, Jennifer
Yamamato, Daniel O Stram, Xin Sheng, Laurence N
Kolonel, Anna H Wu, David Reich, and Brian E Hender-
son. A common genetic risk factor for colorectal
and prostate cancer. Nat Genet, 39(8):954–6, Aug
2007. 4
[15] Ian Tomlinson, Emily Webb, Luis Carvajal-Carmona, Pe-
ter Broderick, Zoe Kemp, Sarah Spain, Steven Pene-
gar, Ian Chandler, Maggie Gorman, Wendy Wood, Ella
Barclay, Steven Lubbe, Lynn Martin, Gabrielle Sell-
ick, Emma Jaeger, Richard Hubner, Ruth Wild, Andrew
Rowan, Sarah Fielding, Kimberley Howarth, CORGI Con-
sortium, Andrew Silver, Wendy Atkin, Kenneth Muir,
Richard Logan, David Kerr, Elaine Johnstone, Oliver
Sieber, Richard Gray, Huw Thomas, Julian Peto, Jean-
Baptiste Cazier, and Richard Houlston. A genome-
wide association scan of tag SNPs identifies a
susceptibility variant for colorectal cancer at
8q24.21. Nat Genet, 39(8):984–8, Aug 2007. 4
[16] Carolyn M Hutter, Martha L Slattery, David J Duggan,
Jill Muehling, Karen Curtin, Li Hsu, Shirley A A Beres-
ford, Aleksandar Rajkovic, Gloria E Sarto, James R
Marshall, Nazik Hammad, Robert Wallace, Karen W
Makar, Ross L Prentice, Bette J Caan, John D Potter,
and Ulrike Peters. Characterization of the asso-
ciation between 8q24 and colon cancer: gene-
environment exploration and meta-analysis. BMC
cancer, 10:670, January 2010. 4
[17] Albert Tenesa, Susan M Farrington, James G D Pren-
dergast, Mary E Porteous, Marion Walker, Naila Haq,
Rebecca A Barnetson, Evropi Theodoratou, Roseanne
Cetnarskyj, Nicola Cartwright, Colin Semple, An-
drew J Clark, Fiona J L Reid, Lorna A Smith, Kostas
Kavoussanakis, Thibaud Koessler, Paul D P Pharoah,
Stephan Buch, Clemens Schafmayer, Jurgen Tepel,
Stefan Schreiber, Henry Volzke, Carsten O Schmidt,
Jochen Hampe, Jenny Chang-Claude, Michael Hoffmeis-
ter, Hermann Brenner, Stefan Wilkening, Federico
Canzian, Gabriel Capella, Victor Moreno, Ian J Deary,
John M Starr, Ian P M Tomlinson, Zoe Kemp, Kimber-
ley Howarth, Luis Carvajal-Carmona, Emily Webb, Peter
Broderick, Jayaram Vijayakrishnan, Richard S Houlston,
Gad Rennert, Dennis Ballinger, Laura Rozek, Stephen B
Gruber, Koichi Matsuda, Tomohide Kidokoro, Yusuke
Nakamura, Brent W Zanke, Celia M T Greenwood, Ja-
gadish Rangrej, Rafal Kustra, Alexandre Montpetit,
Thomas J Hudson, Steven Gallinger, Harry Campbell,
and Malcolm G Dunlop. Genome-wide association
scan identifies a colorectal cancer susceptibility
locus on 11q23 and replicates risk loci at 8q24
and 18q21. Nature genetics, 40(5):631–7, May 2008.
4, 5, 61
[18] Jonathan D Kocarnik, Carolyn M Hutter, Martha L
Slattery, Sonja I Berndt, Li Hsu, David J Duggan,
Jill Muehling, Bette J Caan, Shirley A A Beresford,
Aleksandar Rajkovic, Gloria E Sarto, James R Mar-
shall, Nazik Hammad, Robert B Wallace, Karen W
Makar, Ross L Prentice, John D Potter, Richard B
Hayes, and Ulrike Peters. Characterization of 9p24
risk locus and colorectal adenoma and can-
cer: gene-environment interaction and meta-
analysis. Cancer epidemiology, biomarkers & preven-
tion, 19(12):3131–9, December 2010. 4
[19] Richard S Houlston, Emily Webb, Peter Broderick,
Alan M Pittman, Maria Chiara Di Bernardo, Steven
Lubbe, Ian Chandler, Jayaram Vijayakrishnan, Kate Sul-
livan, Steven Penegar, Luis Carvajal-Carmona, Kim-
berley Howarth, Emma Jaeger, Sarah L Spain, Axel
68
REFERENCES
Walther, Ella Barclay, Lynn Martin, Maggie Gor-
man, Enric Domingo, Ana S Teixeira, David Kerr, Jean-
Baptiste Cazier, Iina Niittymaki, Sari Tuupanen, Auli
Karhu, Lauri A Aaltonen, Ian P M Tomlinson, Su-
san M Farrington, Albert Tenesa, James G D Pren-
dergast, Rebecca A Barnetson, Roseanne Cetnarskyj,
Mary E Porteous, Paul D P Pharoah, Thibaud Koessler,
Jochen Hampe, Stephan Buch, Clemens Schafmayer, Ju-
rgen Tepel, Stefan Schreiber, Henry Volzke, Jenny
Chang-Claude, Michael Hoffmeister, Hermann Brenner,
Brent W Zanke, Alexandre Montpetit, Thomas J Hud-
son, Steven Gallinger, Harry Campbell, and Malcolm G
Dunlop. Meta-analysis of genome-wide associa-
tion data identifies four new susceptibility loci
for colorectal cancer. Nature genetics, 40(12):1426–
35, December 2008. 4
[20] Ian P M Tomlinson, Luis G Carvajal-Carmona, Sara E
Dobbins, Albert Tenesa, Angela M Jones, Kimber-
ley Howarth, Claire Palles, Peter Broderick, Emma
E M Jaeger, Susan Farrington, Annabelle Lewis, James
G D Prendergast, Alan M Pittman, Evropi Theodor-
atou, Bianca Olver, Marion Walker, Steven Penegar,
Ella Barclay, Nicola Whiffin, Lynn Martin, Stephane
Ballereau, Amy Lloyd, Maggie Gorman, Steven Lubbe,
Bryan Howie, Jonathan Marchini, Clara Ruiz-Ponte,
Ceres Fernandez-Rozadilla, Antoni Castells, Angel
Carracedo, Sergi Castellvi-Bel, David Duggan, David
Conti, Jean-Baptiste Cazier, Harry Campbell, Oliver
Sieber, Lara Lipton, Peter Gibbs, Nicholas G Martin,
Grant W Montgomery, Joanne Young, Paul N Baird,
Steven Gallinger, Polly Newcomb, John Hopper, Mark A
Jenkins, Lauri A Aaltonen, David J Kerr, Jeremy Chea-
dle, Paul Pharoah, Graham Casey, Richard S Houl-
ston, and Malcolm G Dunlop. Multiple Common
Susceptibility Variants near BMP Pathway Loci
GREM1, BMP4, and BMP2 Explain Part of the
Missing Heritability of Colorectal Cancer. PLoS
genetics, 7(6):e1002105, June 2011. 4
[21] Emma Jaeger, Emily Webb, Kimberley Howarth, Luis
Carvajal-Carmona, Andrew Rowan, Peter Broderick,
Axel Walther, Sarah Spain, Alan Pittman, Zoe Kemp,
Kate Sullivan, Karl Heinimann, Steven Lubbe, Enric
Domingo, Ella Barclay, Lynn Martin, Maggie Gorman,
Ian Chandler, Jayaram Vijayakrishnan, Wendy Wood,
Elli Papaemmanuil, Steven Penegar, Mobshra Qureshi,
CORGI Consortium, Susan Farrington, Albert Tenesa,
Jean-Baptiste Cazier, David Kerr, Richard Gray, Julian
Peto, Malcolm Dunlop, Harry Campbell, Huw Thomas,
Richard Houlston, and Ian Tomlinson. Common ge-
netic variants at the CRAC1 (HMPS) locus on
chromosome 15q13.3 influence colorectal cancer
risk. Nat Genet, 40(1):26–8, Jan 2008. 4
[22] Peter Broderick, Luis Carvajal-Carmona, Alan M
Pittman, Emily Webb, Kimberley Howarth, Andrew
Rowan, Steven Lubbe, Sarah Spain, Kate Sullivan, Sarah
Fielding, Emma Jaeger, Jayaram Vijayakrishnan, Zoe
Kemp, Maggie Gorman, Ian Chandler, Elli Papaemmanuil,
Steven Penegar, Wendy Wood, Gabrielle Sellick, Mob-
shra Qureshi, Ana Teixeira, Enric Domingo, Ella Bar-
clay, Lynn Martin, Oliver Sieber, David Kerr, Richard
Gray, Julian Peto, Jean-Baptiste Cazier, Ian Tomlinson,
and Richard S Houlston. A genome-wide associa-
tion study shows that common alleles of SMAD7
influence colorectal cancer risk. Nature genetics,
39(11):1315–7, November 2007. 4, 5, 61
[23] Ulrike Peters, Carolyn M Hutter, Li Hsu, Fredrick R
Schumacher, David V Conti, Christopher S Carl-
son, Christopher K Edlund, Robert W Haile, Steven
Gallinger, Brent W Zanke, Mathieu Lemire, Jagadish
Rangrej, Raakhee Vijayaraghavan, Andrew T Chan,
Aditi Hazra, David J Hunter, Jing Ma, Charles S Fuchs,
Edward L Giovannucci, Peter Kraft, Yan Liu, Lin Chen,
Shuo Jiao, Karen W Makar, Darin Taverna, Stephen B
Gruber, Gad Rennert, Victor Moreno, Cornelia M Ul-
rich, Michael O Woods, Roger C Green, Patrick S Par-
frey, Ross L Prentice, Charles Kooperberg, Rebecca D
Jackson, Andrea Z Lacroix, Bette J Caan, Richard B
Hayes, Sonja I Berndt, Stephen J Chanock, Robert E
Schoen, Jenny Chang-Claude, Michael Hoffmeister,
Hermann Brenner, Bernd Frank, Stephane Bezieau,
Sebastien Kury, Martha L Slattery, John L Hopper,
Mark A Jenkins, Loic Le Marchand, Noralane M Lin-
dor, Polly A Newcomb, Daniela Seminara, Thomas J Hud-
son, David J Duggan, John D Potter, and Graham Casey.
Meta-analysis of new genome-wide association
studies of colorectal cancer risk. Human Genetics,
131(2):217–34, February 2012. 3, 4, 5, 21, 61
[24] Peter ten Dijke and Caroline S Hill. New insights
into TGF-beta-Smad signalling. Trends Biochem
Sci, 29(5):265–73, May 2004. 3
[25] Amanda I Phipps, Polly A Newcomb, Xabier Garcia-
Albeniz, Carolyn M Hutter, Emily White, Charles S
Fuchs, Aditi Hazra, Shuji Ogino, Hongmei Nan, Jing Ma,
Peter T Campbell, Jane C Figueiredo, Ulrike Peters,
and Andrew T Chan. Association between colorectal
cancer susceptibility Loci and survival time after
diagnosis with colorectal cancer. Gastroenterology,
143(1):51–54.e4, July 2012. 3, 21, 61
[26] Lauri Aaltonen, Louise Johns, Heikki Jarvinen, Jukka-
Pekka Mecklin, and Richard Houlston. Explaining
the familial colorectal cancer risk associated with
mismatch repair (MMR)-deficient and MMR-
stable tumors. Clin Cancer Res, 13(1):356–61, Jan
2007. 6
[27] Yvonne M C Hendriks, Andrea E de Jong, Hans Morreau,
Carli M J Tops, Hans F Vasen, Juul Th Wijnen, Martijn H
Breuning, and Annette H J T Brocker-Vriends. Diag-
nostic approach and management of Lynch syn-
drome (hereditary nonpolyposis colorectal carci-
noma): a guide for clinicians. CA Cancer J Clin,
56(4):213–25, 2006. 6
[28] Jan J Koornstra, Marian Je Mourits, Rolf H Sijmons,
Annemarie M Leliveld, Harry Hollema, and Jan H
Kleibeuker. Management of extracolonic tumours
in patients with Lynch syndrome. Lancet Oncol,
10(4):400–8, Apr 2009. 6
[29] Polymnia Galiatsatos and William D Foulkes. Famil-
ial adenomatous polyposis. Am J Gastroenterol,
101(2):385–98, Feb 2006. 6
[30] Malcolm G Dunlop and Susan M Farrington. MUTYH-
associated polyposis and colorectal cancer. Surg
Oncol Clin N Am, 18(4):599–610, Oct 2009. 6
[31] A. Walther, E. Johnstone, C. Swanton, R. Midgley,
I. Tomlinson, and D. Kerr. Genetic prognostic and
predictive markers in colorectal cancer. Nat Rev
Cancer, 9(7):489–99, 2009. 6
69
REFERENCES
[32] L N Spirio, W Samowitz, J Robertson, M Robertson, R W
Burt, M Leppert, and R White. Alleles of APC mod-
ulate the frequency and classes of mutations that
lead to colon polyps. Nat Genet, 20(4):385–8, Dec
1998. 7
[33] M. Bienz and H. Clevers. Linking colorectal cancer
to Wnt signaling. Cell, 103(2):311–320, Oct 2000. 7
[34] G. C. Blobe, W. P. Schiemann, and H. F. Lodish. Role of
transforming growth factor beta in human dis-
ease. N Engl J Med, 342(18):1350–1358, May 2000.
7
[35] Rebecca L. Elliott and Gerard C. Blobe. Role of
transforming growth factor Beta in human can-
cer. J Clin Oncol, 23(9):2078–2093, Mar 2005. 7
[36] Klaudia Giehl. Oncogenic Ras in tumour progres-
sion and metastasis. Biol Chem, 386(3):193–205,
Mar 2005. 7
[37] E Miranda, A Destro, A Malesci, E Balladore, P Bianchi,
E Baryshnikova, G Franchi, E Morenghi, L Laghi,
L Gennari, and M Roncalli. Genetic and epi-
genetic changes in primary metastatic and
nonmetastatic colorectal cancer. Br J Cancer,
95(8):1101–7, Oct 2006. 8
[38] C. S. Karapetis, S. Khambata-Ford, D. J. Jonker, C. J.
O’Callaghan, D. Tu, N. C. Tebbutt, R. J. Simes,
H. Chalchal, J. D. Shapiro, S. Robitaille, T. J. Price,
L. Shepherd, H. J. Au, C. Langer, M. J. Moore, and J. R.
Zalcberg. K-ras mutations and benefit from ce-
tuximab in advanced colorectal cancer. N Engl J
Med, 359(17):1757–65, 2008. 8
[39] A. C. Chiang and J. Massague. Molecular basis of
metastasis. N Engl J Med, 359(26):2814–23, 2008. 8
[40] D. X. Nguyen, P. D. Bos, and J. Massague. Metasta-
sis: from dissemination to organ-specific colo-
nization. Nat Rev Cancer, 9(4):274–84, 2009. 8
[41] Gaorav P Gupta, Don X Nguyen, Anne C Chiang, Paula D
Bos, Juliet Y Kim, Roger R Gomis, Katia Manova-
Todorova, and Joan Massague. Mediators of vascular
remodelling co-opted for sequential steps in lung
metastasis. Nature, 446(7137):765–70, Apr 2007. 8,
10
[42] Jacques Pouyssegur, Frederic Dayan, and Nathalie M
Mazure. Hypoxia signalling in cancer and ap-
proaches to enforce tumour regression. Nature,
441(7092):437–43, May 2006. 9
[43] Evanthia T Roussos, John S Condeelis, and Antonia Pat-
sialou. Chemotaxis in cancer. Nat Rev Cancer,
11(8):573–87, Aug 2011. 9
[44] Sun-Jin Kim, Jang-Seong Kim, Eun Sung Park, Ju-Seog
Lee, Qingtang Lin, Robert R Langley, Marva Maya, Jun-
qin He, Seung-Wook Kim, Zhang Weihua, Krishnakumar
Balasubramanian, Dominic Fan, Gordon B Mills, Mien-
Chie Hung, and Isaiah J Fidler. Astrocytes upregu-
late survival genes in tumor cells and induce pro-
tection from chemotherapy. Neoplasia, 13(3):286–
98, Mar 2011. 9
[45] Fei Xing, Aya Kobayashi, Hiroshi Okuda, Misako Watabe,
Sudha K Pai, Puspa R Pandey, Shigeru Hirota, Andrew
Wilber, Yin-Yuan Mo, Brian E Moore, Wen Liu, Koji
Fukuda, Megumi Iiizumi, Sambad Sharma, Yin Liu, Kerui
Wu, Elizabeth Peralta, and Kounosuke Watabe. Reac-
tive astrocytes promote the metastatic growth of
breast cancer stem-like cells by activating Notch
signalling in brain. EMBO Mol Med, 5(3):384–96,
Mar 2013. 9
[46] Theresa A Guise. Breaking down bone: new insight
into site-specific mechanisms of breast cancer os-
teolysis mediated by metalloproteinases. Genes
Dev, 23(18):2117–23, Sep 2009. 9
[47] X. H. Zhang, Q. Wang, W. Gerald, C. A. Hudis, L. Norton,
M. Smid, J. A. Foekens, and J. Massague. Latent bone
metastasis in breast cancer tied to Src-dependent
survival signals. Cancer Cell, 16(1):67–78, 2009.
Zhang, Xiang H-F Wang, Qiongqing Gerald, William
Hudis, Clifford A Norton, Larry Smid, Marcel Foekens,
John A Massague, Joan U54 CA126518/CA/NCI NIH
HHS/United States U54 CA126518-030002/CA/NCI
NIH HHS/United States Howard Hughes Medical In-
stitute/United States Research Support, N.I.H., Extra-
mural Research Support, Non-U.S. Gov’t United States
Cancer cell Cancer Cell. 2009 Jul 7;16(1):67-78. 9, 11
[48] Thordur Oskarsson, Swarnali Acharyya, Xiang H-F
Zhang, Sakari Vanharanta, Sohail F Tavazoie, Patrick G
Morris, Robert J Downey, Katia Manova-Todorova, Edi
Brogi, and Joan Massague. Breast cancer cells pro-
duce tenascin C as a metastatic niche component
to colonize the lungs. Nat Med, 17(7):867–74, Jul
2011. 9
[49] Mi-Young Kim, Thordur Oskarsson, Swarnali Acharyya,
Don X Nguyen, Xiang H-F Zhang, Larry Norton, and
Joan Massague. Tumor self-seeding by circulating
cancer cells. Cell, 139(7):1315–26, Dec 2009. 9, 64
[50] Alexandre Calon, Elisa Espinet, Sergio Palomo-Ponce,
Daniele V F Tauriello, Mar Iglesias, Marıa Virtudes
Cespedes, Marta Sevillano, Peter Jung, Xiang H-F
Zhang, Daniel Byrom, Antoni Riera, David Rossell,
Ramon Mangues, Joan Massague, Elena Sancho, and Ed-
uard Batlle. Dependency of Colorectal Cancer
on a TGF-B-Driven Program in Stromal Cells
for Metastasis Initiation. Cancer Cell, 22(5):571–
84, Nov 2012. 9
[51] Louis Vermeulen, Felipe De Sousa E Melo, Maartje
van der Heijden, Kate Cameron, Joan H de Jong, Ti-
jana Borovski, Jurriaan B Tuynman, Matilde Todaro,
Christian Merz, Hans Rodermond, Martin R Sprick, Kris-
tel Kemper, Dick J Richel, Giorgio Stassi, and Jan Paul
Medema. Wnt activity defines colon cancer stem
cells and is regulated by the microenvironment.
Nat Cell Biol, 12(5):468–76, May 2010. 9
[52] Jing Yang and Robert A Weinberg. Epithelial-
mesenchymal transition: at the crossroads of
development and tumor metastasis. Dev Cell,
14(6):818–29, Jun 2008. 9
[53] Muh-Hwa Yang, Min-Zu Wu, Shih-Hwa Chiou, Po-Min
Chen, Shyue-Yih Chang, Chung-Ji Liu, Shu-Chun Teng,
and Kou-Juey Wu. Direct regulation of TWIST by
HIF-1alpha promotes metastasis. Nat Cell Biol,
10(3):295–305, Mar 2008. 9
70
REFERENCES
[54] Sendurai A Mani, Wenjun Guo, Mai-Jing Liao, Elinor Ng
Eaton, Ayyakkannu Ayyanan, Alicia Y Zhou, Mary
Brooks, Ferenc Reinhard, Cheng Cheng Zhang, Michail
Shipitsin, Lauren L Campbell, Kornelia Polyak, Cathrin
Brisken, Jing Yang, and Robert A Weinberg. The
epithelial-mesenchymal transition generates cells
with properties of stem cells. Cell, 133(4):704–15,
May 2008. 10
[55] Jing Yang, Sendurai A Mani, Joana Liu Donaher, Srid-
har Ramaswamy, Raphael A Itzykson, Christophe Come,
Pierre Savagner, Inna Gitelman, Andrea Richardson, and
Robert A Weinberg. Twist, a master regulator of
morphogenesis, plays an essential role in tumor
metastasis. Cell, 117(7):927–39, Jun 2004. 10
[56] Oscar H Ocana, Rebeca Corcoles, Angels Fabra, Gema
Moreno-Bueno, Herve Acloque, Sonia Vega, Alejandro
Barrallo-Gimeno, Amparo Cano, and M Angela Nieto.
Metastatic colonization requires the repression
of the epithelial-mesenchymal transition inducer
Prrx1. Cancer Cell, 22(6):709–24, Dec 2012. 10
[57] Manav Korpal, Brian J Ell, Francesca M Buffa, Toni
Ibrahim, Mario A Blanco, Toni Celia-Terrassa, Laura
Mercatali, Zia Khan, Hani Goodarzi, Yuling Hua, Yong
Wei, Guohong Hu, Benjamin A Garcia, Jiannis Ragoussis,
Dino Amadori, Adrian L Harris, and Yibin Kang. Di-
rect targeting of Sec23a by miR-200s influences
cancer cell secretome and promotes metastatic
colonization. Nat Med, 17(9):1101–8, Sep 2011. 10
[58] Irene Baccelli, Andreas Schneeweiss, Sabine Riethdorf,
Albrecht Stenzinger, Anja Schillert, Vanessa Vogel,
Corinna Klein, Massimo Saini, Tobias Bauerle, Markus
Wallwiener, Tim Holland-Letz, Thomas Hofner, Martin
Sprick, Martina Scharpff, Frederik Marme, Hans Pe-
ter Sinn, Klaus Pantel, Wilko Weichert, and Andreas
Trumpp. Identification of a population of blood
circulating tumor cells from breast cancer pa-
tients that initiates metastasis in a xenograft as-
say. Nat Biotechnol, 31(6):539–544, Jun 2013. 10
[59] Jeffrey B. Wyckoff, Yarong Wang, Elaine Y. Lin, Jiu-
feng Li, Sumanta Goswami, E Richard Stanley, Jeffrey E.
Segall, Jeffrey W. Pollard, and John Condeelis. Di-
rect visualization of macrophage-assisted tumor
cell intravasation in mammary tumors. Cancer
Res, 67(6):2649–2656, Mar 2007. 10
[60] Elsa Quintana, Elena Piskounova, Mark Shackleton,
Daniel Weinberg, Ugur Eskiocak, Douglas R. Fullen,
Timothy M. Johnson, and Sean J. Morrison. Human
melanoma metastasis in NSG mice correlates
with clinical outcome in patients. Sci Transl Med,
4(159):159ra149, Nov 2012. 10
[61] Shinichi Yachida, Sian Jones, Ivana Bozic, Tibor Antal,
Rebecca Leary, Baojin Fu, Mihoko Kamiyama, Ralph H.
Hruban, James R. Eshleman, Martin A. Nowak, Victor E.
Velculescu, Kenneth W. Kinzler, Bert Vogelstein, and
Christine A. Iacobuzio-Donahue. Distant metastasis
occurs late during the genetic evolution of pan-
creatic cancer. Nature, 467(7319):1114–1117, Oct
2010. 10
[62] Paula D. Bos, Xiang H-F. Zhang, Cristina Nadal, Weip-
ing Shu, Roger R. Gomis, Don X. Nguyen, Andy J. Minn,
Marc J. van de Vijver, William L. Gerald, John A.
Foekens, and Joan Massague. Genes that mediate
breast cancer metastasis to the brain. Nature,
459(7249):1005–1009, Jun 2009. 10
[63] David Padua, Xiang H-F. Zhang, Qiongqing Wang,
William L. Gerald, Roger R. Gomis, and Joan Massague.
TGFbeta primes breast tumors for lung metas-
tasis seeding through angiopoietin-like 4. Cell,
133(1):66–77, Apr 2008. 10
[64] Sara Weis, Jianhua Cui, Leo Barnes, and David
Cheresh. Endothelial barrier disruption by
VEGF-mediated Src activity potentiates tumor
cell extravasation and metastasis. J Cell Biol,
167(2):223–229, Oct 2004. 10
[65] Monika Julia Wolf, Alexandra Hoos, Judith Bauer,
Steffen Boettcher, Markus Knust, Achim Weber,
Nicole Simonavicius, Christoph Schneider, Matthias
Lang, Michael Sturzl, Roland S. Croner, Andreas Kon-
rad, Markus G. Manz, Holger Moch, Adriano Aguzzi,
Geert van Loo, Manolis Pasparakis, Marco Prinz, Lu-
bor Borsig, and Mathias Heikenwalder. Endothelial
CCR2 signaling induced by colon carcinoma cells
enables extravasation via the JAK2-Stat5 and
p38MAPK pathway. Cancer Cell, 22(1):91–105, Jul
2012. 10
[66] Qing Chen, Xiang H-F. Zhang, and Joan Massague.
Macrophage binding to receptor VCAM-1 trans-
mits survival signals in breast cancer cells that
invade the lungs. Cancer Cell, 20(4):538–549, Oct
2011. 11
[67] A. Merlos-Suarez, F. M. Barriga, P. Jung, M. Iglesias,
M. V. Cespedes, D. Rossell, M. Sevillano, X. Hernando-
Momblona, V. da Silva-Diz, P. Munoz, H. Clevers, E. San-
cho, R. Mangues, and E. Batlle. The intestinal stem
cell signature identifies colorectal cancer stem
cells and predicts disease relapse. Cell Stem Cell,
8(5):511–24, 2011. 11
[68] Roberta Pang, Wai Lun Law, Andrew C Y Chu, Jensen T
Poon, Colin S C Lam, Ariel K M Chow, Lui Ng, Leonard
W H Cheung, Xiao R Lan, Hui Y Lan, Victoria P Y
Tan, Thomas C Yau, Ronnie T Poon, and Benjamin C Y
Wong. A subpopulation of CD26+ cancer stem
cells with metastatic capacity in human colorec-
tal cancer. Cell Stem Cell, 6(6):603–15, Jun 2010. 11
[69] Sebastian M Dieter, Claudia R Ball, Christopher M
Hoffmann, Ali Nowrouzi, Friederike Herbst, Oksana
Zavidij, Ulrich Abel, Anne Arens, Wilko Weichert,
Karsten Brand, Moritz Koch, Jurgen Weitz, Manfred
Schmidt, Christof von Kalle, and Hanno Glimm. Dis-
tinct types of tumor-initiating cells form human
colon cancer tumors and metastases. Cell Stem
Cell, 9(4):357–65, Oct 2011. 11
[70] Antonija Kreso, Catherine A O’Brien, Peter van Galen,
Olga I Gan, Faiyaz Notta, Andrew M K Brown, Karen
Ng, Jing Ma, Erno Wienholds, Cyrille Dunant, Aaron
Pollett, Steven Gallinger, John McPherson, Charles G
Mullighan, Darryl Shibata, and John E Dick. Vari-
able clonal repopulation dynamics influence
chemotherapy response in colorectal cancer. Sci-
ence, 339(6119):543–8, Feb 2013. 11
[71] Thordur Oskarsson, Eduard Batlle, and Joan Massague.
Metastatic stem cells: sources, niches, and vital
pathways. Cell Stem Cell, 14(3):306–321, Mar 2014.
11, 12, 63
71
REFERENCES
[72] Hans Clevers. The intestinal crypt, a prototype
stem cell compartment. Cell, 154(2):274–284, Jul
2013. 12
[73] Ya-Chieh Hsu and Elaine Fuchs. A family business:
stem cell progeny join the niche to regulate
homeostasis. Nat Rev Mol Cell Biol, 13(2):103–114,
Feb 2012. 12
[74] Yusuke Shiozawa, Elisabeth A. Pedersen, Aaron M.
Havens, Younghun Jung, Anjali Mishra, Jeena Joseph,
Jin Koo Kim, Lalit R. Patel, Chi Ying, Anne M.
Ziegler, Michael J. Pienta, Junhui Song, Jingcheng Wang,
Robert D. Loberg, Paul H. Krebsbach, Kenneth J. Pienta,
and Russell S. Taichman. Human prostate cancer
metastases target the hematopoietic stem cell
niche to establish footholds in mouse bone mar-
row. J Clin Invest, 121(4):1298–1312, Apr 2011. 12
[75] Nikki Charles and Eric C. Holland. The perivascular
niche microenvironment in brain tumor progres-
sion. Cell Cycle, 9(15):3012–3021, Aug 2010. 12
[76] Yvonne Kienast, Louisa von Baumgarten, Martin
Fuhrmann, Wolfgang E F. Klinkert, Roland Goldbrun-
ner, Jochen Herms, and Frank Winkler. Real-time
imaging reveals the single steps of brain metas-
tasis formation. Nat Med, 16(1):116–122, Jan 2010.
12
[77] Manuel Valiente, Anna C. Obenauf, Xin Jin, Qing Chen,
Xiang H-F. Zhang, Derek J. Lee, Jamie E. Chaft, Mark G.
Kris, Jason T. Huse, Edi Brogi, and Joan Massague. Ser-
pins promote cancer cell survival and vascular
co-option in brain metastasis. Cell, 156(5):1002–
1016, Feb 2014. 12
[78] Jia Lu, Xiangcang Ye, Fan Fan, Ling Xia, Rajat Bhat-
tacharya, Seth Bellister, Federico Tozzi, Eric Sceusi,
Yunfei Zhou, Isamu Tachibana, Dipen M. Maru, David H.
Hawke, Janusz Rak, Sendurai A. Mani, Patrick Zweidler-
McKay, and Lee M. Ellis. Endothelial cells pro-
mote the colorectal cancer stem cell phenotype
through a soluble form of Jagged-1. Cancer Cell,
23(2):171–185, Feb 2013. 12
[79] Ilaria Malanchi, Hector Peinado, Deepika Kassen,
Thomas Hussenet, Daniel Metzger, Pierre Chambon,
Marcel Huber, Daniel Hohl, Amparo Cano, Walter
Birchmeier, and Joerg Huelsken. Cutaneous cancer
stem cell maintenance is dependent on beta-
catenin signalling. Nature, 452(7187):650–653, Apr
2008. 12
[80] A. J. Minn, G. P. Gupta, P. M. Siegel, P. D. Bos, W. Shu,
D. D. Giri, A. Viale, A. B. Olshen, W. L. Gerald, and
J. Massague. Genes that mediate breast cancer
metastasis to lung. Nature, 436(7050):518–24, 2005.
12
[81] Sakari Vanharanta and Joan Massague. Origins of
metastatic traits. Cancer Cell, 24(4):410–421, Oct
2013. 12, 63, 64
[82] Dalit Barkan, Jeffrey E. Green, and Ann F. Chambers.
Extracellular matrix: a gatekeeper in the transi-
tion from dormancy to metastatic growth. Eur J
Cancer, 46(7):1181–1188, May 2010. 12
[83] Paul E. Goss and Ann F. Chambers. Does tumour dor-
mancy offer a therapeutic target? Nat Rev Cancer,
10(12):871–877, Dec 2010. 12
[84] Julio A. Aguirre-Ghiso, Liliana Ossowski, and Sarah K.
Rosenbaum. Green fluorescent protein tagging
of extracellular signal-regulated kinase and p38
pathways reveals novel dynamics of pathway ac-
tivation during primary and metastatic growth.
Cancer Res, 64(20):7336–7345, Oct 2004. 12
[85] Hua Gao, Goutam Chakraborty, Ai Ping Lee-Lim, Qianx-
ing Mo, Markus Decker, Alin Vonica, Ronglai Shen, Edi
Brogi, Ali H. Brivanlou, and Filippo G. Giancotti. The
BMP inhibitor Coco reactivates breast cancer
cells at lung metastatic sites. Cell, 150(4):764–779,
Aug 2012. 12
[86] SB Edge, DR Byrd, C C Compton, and AG Fritz. AJCC
Cancer Staging Manual. Springer, 2009. 13
[87] A B Benson, M A Choti, A M Cohen, J H Doroshow,
C Fuchs, K Kiel, E W Martin, C McGinn, N J Petrelli,
J A Posey, J M Skibber, A Venook, and T J Yeatman.
NCCN Practice Guidelines for Colorectal Can-
cer. Oncology (Williston Park, N.Y.), 14(11A):203–12,
November 2000. 13
[88] Paul F Engstrom, Al B Benson, and Leonard Saltz.
Colon cancer. Clinical practice guidelines in on-
cology. Journal of the National Comprehensive Cancer
Network : JNCCN, 1(1):40–53, January 2003. 13
[89] R Labianca, B Nordlinger, G D Beretta, S Mosconi,
M Mandala, A Cervantes, and D Arnold. Early colon
cancer: ESMO Clinical Practice Guidelines for
diagnosis, treatment and follow-up. Annals of on-
cology, 24 Suppl 6(April 2002):vi64–72, October 2013.
13
[90] Hye Young Kim, Soon Jin Lee, Gilsun Lee, Limwha Song,
Su-A Kim, Jin Yong Kim, Dong Kyung Chang, Poong-
Lyul Rhee, Jae J Kim, Jong Chul Rhee, Ho-Kyung Chun,
and Young-Ho Kim. Should Preoperative Chest CT
Be Recommended to All Colon Cancer Patients?
Annals of surgery, February 2013. 13
[91] T. Andre, C. Boni, M. Navarro, J. Tabernero, T. Hick-
ish, C. Topham, A. Bonetti, P. Clingan, J. Bridgewa-
ter, F. Rivera, and A. de Gramont. Improved overall
survival with oxaliplatin, fluorouracil, and leu-
covorin as adjuvant treatment in stage II or III
colon cancer in the MOSAIC trial. J Clin Oncol,
27(19):3109–16, 2009. 13, 14
[92] Quasar Collaborative Group, Richard Gray, Jennifer
Barnwell, Christopher McConkey, Robert K Hills,
Norman S Williams, and David J Kerr. Adjuvant
chemotherapy versus observation in patients
with colorectal cancer: a randomised study.
Lancet, 370(9604):2020–9, Dec 2007. 13
[93] (IMPACT) investigators. Efficacy of adjuvant fluo-
rouracil and folinic acid in colon cancer. Inter-
national Multicentre Pooled Analysis of Colon
Cancer Trials . Lancet, 345(8955):939–944, Apr 1995.
13
72
REFERENCES
[94] Sharlene Gill, Charles L. Loprinzi, Daniel J. Sargent,
Stephan D. Thome, Steven R. Alberts, Daniel G. Haller,
Jacqueline Benedetti, Guido Francini, Lois E. Shep-
herd, Jean Francois Seitz, Roberto Labianca, Wei Chen,
Stephen S. Cha, Michael P. Heldebrant, and Richard M.
Goldberg. Pooled analysis of fluorouracil-based
adjuvant therapy for stage II and III colon can-
cer: who benefits and by how much? J Clin Oncol,
22(10):1797–1806, May 2004. 13
[95] Al B Benson, 3rd, Deborah Schrag, Mark R. Somer-
field, Alfred M. Cohen, Alvaro T. Figueredo, Patrick J.
Flynn, Monika K. Krzyzanowska, Jean Maroun, Pamela
McAllister, Eric Van Cutsem, Melissa Brouwers, Manya
Charette, and Daniel G. Haller. American Society
of Clinical Oncology recommendations on adju-
vant chemotherapy for stage II colon cancer. J
Clin Oncol, 22(16):3408–3419, Aug 2004. 13
[96] Greg Yothers, Michael J O’Connell, Carmen J Alle-
gra, J Philip Kuebler, Linda H Colangelo, Nicholas J
Petrelli, and Norman Wolmark. Oxaliplatin as adju-
vant therapy for colon cancer: updated results of
NSABP C-07 trial, including survival and subset
analyses. J Clin Oncol, 29(28):3768–74, Oct 2011. 13,
14
[97] L. B. Saltz, S. Clarke, E. Diaz-Rubio, W. Scheithauer,
A. Figer, R. Wong, S. Koski, M. Lichinitser, T. S. Yang,
F. Rivera, F. Couture, F. Sirzen, and J. Cassidy. Beva-
cizumab in combination with oxaliplatin-based
chemotherapy as first-line therapy in metastatic
colorectal cancer: a randomized phase III study.
J Clin Oncol, 26(12):2013–9, 2008. 14
[98] V Alonso-Orduna, M Marmol, P Escudero, A Salud,
MJ Safont, JC Mendez, A Garcia Giron, M Martin,
C Fernandez-Martos, X. Garcia-Albeniz, J Feliu, and
J Maurel. A validation of current prognostic
scores in metastatic colorectal cancer (mCRC)
and a new prognostic score (A GEMCAD study).
Annals of Oncology, 25(s4):167–209, 2014. 14
[99] Eric Van Cutsem, Claus-Henning Kohne, Erika Hitre,
Jerzy Zaluski, Chung-Rong Chang Chien, Anatoly
Makhson, Geert D’Haens, Tamas Pinter, Robert Lim,
Gyorgy Bodoky, Jae Kyung Roh, Gunnar Folprecht,
Paul Ruff, Christopher Stroh, Sabine Tejpar, Michael
Schlichting, Johannes Nippgen, and Philippe Rougier.
Cetuximab and chemotherapy as initial treat-
ment for metastatic colorectal cancer. N Engl J
Med, 360(14):1408–17, Apr 2009. 14
[100] Jean-Yves Douillard, Kelly S. Oliner, Salvatore Siena,
Josep Tabernero, Ronald Burkes, Mario Barugel, Yves
Humblet, Gyorgy Bodoky, David Cunningham, Jacek
Jassem, Fernando Rivera, Ilona Kocakova, Paul Ruff,
Maria B lasi?ska-Morawiec, Martin Smakal, Jean Luc
Canon, Mark Rother, Richard Williams, Alan Rong,
Jeffrey Wiezorek, Roger Sidhu, and Scott D. Patter-
son. Panitumumab-FOLFOX4 treatment and
RAS mutations in colorectal cancer. N Engl J Med,
369(11):1023–1034, Sep 2013. 14
[101] R. G. Amado, M. Wolf, M. Peeters, E. Van Cutsem,
S. Siena, D. J. Freeman, T. Juan, R. Sikorski, S. Suggs,
R. Radinsky, S. D. Patterson, and D. D. Chang. Wild-
type KRAS is required for panitumumab efficacy
in patients with metastatic colorectal cancer. J
Clin Oncol, 26(10):1626–34, 2008. 14
[102] Axel Grothey, Eric Van Cutsem, Alberto Sobrero, Sal-
vatore Siena, Alfredo Falcone, Marc Ychou, Yves Hum-
blet, Olivier Bouche, Laurent Mineur, Carlo Barone,
Antoine Adenis, Josep Tabernero, Takayuki Yoshino,
Heinz-Josef Lenz, Richard M. Goldberg, Daniel J. Sar-
gent, Frank Cihon, Lisa Cupit, Andrea Wagner, Dirk
Laurent, and C. O. R. R. E. C. T Study Group . Re-
gorafenib monotherapy for previously treated
metastatic colorectal cancer (CORRECT): an in-
ternational, multicentre, randomised, placebo-
controlled, phase 3 trial. Lancet, 381(9863):303–
312, Jan 2013. 14
[103] Eric Van Cutsem, Josep Tabernero, Radek Lakomy, Hans
Prenen, Jana Prausova, Teresa Macarulla, Paul Ruff,
Guy A. van Hazel, Vladimir Moiseyenko, David Ferry, Joe
McKendrick, Jonathan Polikoff, Alexia Tellier, Remi
Castan, and Carmen Allegra. Addition of aflibercept
to fluorouracil, leucovorin, and irinotecan im-
proves survival in a phase III randomized trial in
patients with metastatic colorectal cancer previ-
ously treated with an oxaliplatin-based regimen.
J Clin Oncol, 30(28):3499–3506, Oct 2012. 14
[104] Niall C Tebbutt, Kate Wilson, Val J Gebski, Michelle M
Cummins, Diana Zannino, Guy A van Hazel, Bridget
Robinson, Adam Broad, Vinod Ganju, Stephen P Ack-
land, Garry Forgeson, David Cunningham, Mark P Saun-
ders, Martin R Stockler, Yujo Chua, John R Zalcberg,
R John Simes, and Timothy J Price. Capecitabine,
bevacizumab, and mitomycin in first-line treat-
ment of metastatic colorectal cancer: results of
the Australasian Gastrointestinal Trials Group
Randomized Phase III MAX Study. J Clin Oncol,
28(19):3191–8, Jul 2010. 14
[105] Rolf Sauer, Heinz Becker, Werner Hohenberger, Claus
Rodel, Christian Wittekind, Rainer Fietkau, Peter Mar-
tus, Jorg Tschmelitsch, Eva Hager, Clemens F. Hess,
Johann-H. Karstens, Torsten Liersch, Heinz Schmid-
berger, Rudolf Raab, and German Rectal Cancer
Study Group . Preoperative versus postoperative
chemoradiotherapy for rectal cancer. N Engl J
Med, 351(17):1731–1740, Oct 2004. 14
[106] C Fernandez-Martos and X Garcia-Albeniz. Should
upfront chemotherapy precede preoperative
chemoradiation and surgery? In V Valentini,
HJ Schmoll, and CJH Van de Velde, editors, Multidisci-
plinary management of rectal cancer: questions and an-
swers, pages 193–204. Heidelberg:Springer, 2012. 14
[107] A. L. Martling, T. Holm, L. E. Rutqvist, B. J. Moran,
R. J. Heald, and B. Cedemark. Effect of a surgical
training programme on outcome of rectal can-
cer in the County of Stockholm. Stockholm Col-
orectal Cancer Study Group, Basingstoke Bowel
Cancer Research Project. Lancet, 356(9224):93–96,
Jul 2000. 14
[108] Xabier Garcıa-Albeniz, Rosa Gallego, Ralf Dieter
Hofheinz, Gloria Fernandez-Esparrach, Juan Ramon
Ayuso-Colella, Josep Antoni Bombı, Carles Conill,
Miriam Cuatrecasas, Salvadora Delgado, Angels Gines,
Rosa Miquel, Mario Pages, Estela Pineda, Veronica
Pereira, Aaron Sosa, Oscar Reig, Ivan Victoria, Luis
Feliz, Antonio Marıa de Lacy, Antoni Castells, Iris
Burkholder, Andreas Hochhaus, and Joan Maurel. Ad-
juvant therapy sparing in rectal cancer achieving
complete response after chemoradiation. World J
Gastroenterol, 20(42):15820–9, Nov 2014. 15
73
REFERENCES
[109] National Comprehensive Cancer Network. Colon
Cancer (Version 1.2012). 15
[110] Tyler J Vanderweele and Stijn Vansteelandt. Odds
ratios for mediation analysis for a dichoto-
mous outcome. American journal of epidemiology,
172(12):1339–48, December 2010. 22, 23
[111] Linda Valeri and Tyler J Vanderweele. Mediation
analysis allowing for exposure-mediator interac-
tions and causal interpretation: theoretical as-
sumptions and implementation with SAS and
SPSS macros. Psychol Methods, 18(2):137–50, Jun
2013. 22, 62
[112] M.N. Passarelli, A.E. Coghill, C.M. Hutter, Yingye
Zheng, K.W. Makar, J.D. Potter, and P.A. New-
comb. Common colorectal cancer risk variants in
SMAD7 are associated with survival among pre-
diagnostic nonsteroidal anti-inflammatory drug
users: A population-based study of post-
menopausal women. Genes, Chromosomes and Can-
cer, 50(July):875–886, 2011. 61
[113] A Nakao, M Afrakhte, A Moren, T Nakayama, J L Chris-
tian, R Heuchel, S Itoh, M Kawabata, N E Heldin, C H
Heldin, and P ten Dijke. Identification of Smad7, a
TGFbeta-inducible antagonist of TGF-beta sig-
nalling. Nature, 389(6651):631–5, Oct 1997. 61
[114] Marco A Briones-Orta, Angeles C Tecalco-Cruz,
Marcela Sosa-Garrocho, Cassandre Caligaris, and Ma-
rina Macıas-Silva. Inhibitory Smad7: emerging
roles in health and disease. Curr Mol Pharmacol,
4(2):141–53, Jun 2011. 62
[115] C Stolfi, V De Simone, A Colantoni, E Franze, E Ribi-
chini, M C Fantini, R Caruso, I Monteleone, G S Sica,
P Sileri, T T MacDonald, F Pallone, and G Monteleone.
A functional role for Smad7 in sustaining colon
cancer cell growth and survival. Cell Death Dis,
5:e1073, 2014. 62
[116] Terje Ahlquist, Guro E Lind, Vera L Costa, Gunn I Mel-
ing, Morten Vatn, Geir S Hoff, Torleiv O Rognum, Rolf I
Skotheim, Espen Thiis-Evensen, and Ragnhild A Lothe.
Gene methylation profiles of normal mucosa, and
benign and malignant colorectal tumors identify
early onset markers. Molecular cancer, 7:94, January
2008. 62
[117] R Soong, N Shah, B K Peh, P Y Chong, S S Ng, N Zeps,
D Joseph, M Salto-Tellez, B Iacopetta, and Y Ito. The
expression of RUNX3 in colorectal cancer is as-
sociated with disease stage and patient outcome.
British journal of cancer, 100(5):676–9, March 2009. 62
[118] Manish M Subramaniam, Jason Y Chan, Richie Soong,
Kosei Ito, Khay G Yeoh, Reuben Wong, Thomas Guen-
ther, Olivia Will, Chee L Chen, Marian P Kumarasinghe,
Yoshiaki Ito, and Manuel Salto-Tellez. RUNX3 inac-
tivation in colorectal polyps arising through dif-
ferent pathways of colonic carcinogenesis. The
American journal of gastroenterology, 104(2):426–36,
February 2009. 62
[119] Kosei Ito, Anthony Chee-Beng Lim, Manuel Salto-
Tellez, Lena Motoda, Motomi Osato, Linda Shyue Huey
Chuang, Cecilia Wei Lin Lee, Dominic Chih-Cheng Voon,
Jason Kin Wai Koo, Huajing Wang, Hiroshi Fuka-
machi, and Yoshiaki Ito. RUNX3 attenuates beta-
catenin/T cell factors in intestinal tumorigene-
sis. Cancer cell, 14(3):226–37, September 2008. 62
[120] Cecilia Wei Lin Lee, Kosei Ito, and Yoshiaki Ito. Role of
RUNX3 in bone morphogenetic protein signaling
in colorectal cancer. Cancer Res, 70(10):4243–52,
May 2010. 62
[121] Martha L Slattery, Abbie Lundgreen, Jennifer S Her-
rick, Roger K Wolff, and Bette J Caan. Genetic vari-
ation in the transforming growth factor-beta sig-
naling pathway and survival after diagnosis with
colon and rectal cancer. Cancer, 117(18):4175–83,
September 2011. 62, 63
[122] Y M Fleming, G J Ferguson, L C Spender, J Lars-
son, S Karlsson, B W Ozanne, R Grosse, and G J In-
man. TGF-beta-mediated activation of RhoA
signalling is required for efficient (V12)HaRas
and (V600E)BRAF transformation. Oncogene,
28(7):983–93, February 2009. 63
[123] Xabier Garcia-Albeniz, Carles Pericay, Virginia Alonso-
Espinaco, Vicente Alonso, Pilar Escudero, Carlos
Fernandez-Martos, Rosa Gallego, Pere Gascon, Sergi
Castellvı-Bel, and Joan Maurel. Serum matrilysin
correlates with poor survival independently of
KRAS and BRAF status in refractory advanced
colorectal cancer patients treated with irinote-
can plus cetuximab. Tumour Biol, 32(2):417–424,
Apr 2011. 63
[124] Timothy J Price, Jennifer E Hardingham, Chee K Lee,
Andrew Weickhardt, Amanda R Townsend, Joseph W
Wrin, Ann Chua, Aravind Shivasami, Michelle M Cum-
mins, Carmel Murone, and Niall C Tebbutt. Impact of
KRAS and BRAF Gene Mutation Status on Out-
comes From the Phase III AGITG MAX Trial of
Capecitabine Alone or in Combination With Be-
vacizumab and Mitomycin in Advanced Colorec-
tal Cancer. J Clin Oncol, Jun 2011. 63
[125] Jeanne Tie, Lara Lipton, Jayesh Desai, Peter Gibbs,
Robert N. Jorissen, Michael Christie, Katharine J. Drum-
mond, Benjamin N J. Thomson, Valery Usatoff, Peter M.
Evans, Adrian W. Pick, Simon Knight, Peter W G.
Carne, Roger Berry, Adrian Polglase, Paul McMur-
rick, Qi Zhao, Dana Busam, Robert L. Strausberg, En-
ric Domingo, Ian P M. Tomlinson, Rachel Midgley, David
Kerr, and Oliver M. Sieber. KRAS mutation is as-
sociated with lung metastasis in patients with
curatively resected colorectal cancer. Clin Cancer
Res, 17(5):1122–1130, Mar 2011. 63
[126] Paloma Bragado, Yeriel Estrada, Falguni Parikh, Sarah
Krause, Carla Capobianco, Hernan G. Farina, Denis M.
Schewe, and Julio A. Aguirre-Ghiso. TGF-β2 dictates
disseminated tumour cell fate in target organs
through TGF-β-RIII and p38α/β signalling. Nat
Cell Biol, 15(11):1351–1361, Nov 2013. 63, 64
[127] Dieter Holzel, Renate Eckel, Rebecca T. Emeny, and
Jutta Engel. Distant metastases do not metasta-
size. Cancer Metastasis Rev, 29(4):737–750, Dec 2010.
64
74
REFERENCES
[128] S. Malakouti, F. K. Asadi, S. C. Kukreja, H. A. Abcar-
ian, and J. R. Cintron. Parathyroid hormone-related
protein expression in the human colon: immuno-
histochemical evaluation. Am Surg, 62(7):540–4;
discussion 544–5, Jul 1996. 64
[129] Wolfgang E. Gallwitz, Theresa A. Guise, and Gregory R.
Mundy. Guanosine nucleotides inhibit different
syndromes of PTHrP excess caused by human
cancers in vivo. J Clin Invest, 110(10):1559–1572,
Nov 2002. 64
[130] Yuki Takayama, Taisuke Mori, Takeshi Nomura, Takahiko
Shibahara, and Michiie Sakamoto. Parathyroid-
related protein plays a critical role in bone in-
vasion by oral squamous cell carcinoma. Int J
Oncol, 36(6):1387–1394, Jun 2010. 64
[131] T. A. Guise. Molecular mechanisms of osteolytic
bone metastases. Cancer, 88(12 Suppl):2892–2898,
Jun 2000. 64
[132] Aya Kobayashi, Hiroshi Okuda, Fei Xing, Puspa R. Pandey,
Misako Watabe, Shigeru Hirota, Sudha K. Pai, Wen Liu,
Koji Fukuda, Christopher Chambers, Andrew Wilber,
and Kounosuke Watabe. Bone morphogenetic pro-
tein 7 in dormancy and metastasis of prostate
cancer stem-like cells in bone. J Exp Med,
208(13):2641–2655, Dec 2011. 64
75