Embed Size (px)
Citation preview
NeuroImage 65 (2013) 109–118
Contents lists available at SciVerse ScienceDirect
NeuroImage
j ourna l homepage: www.e lsev ie r .com/ locate /yn img
Mechanisms of enhancing visual–speech recognition by prior auditory information
Helen Blank ⁎, Katharina von KriegsteinMax Planck Institute for Human Cognitive and Brain Sciences, Stephanstr. 1A, 04103 Leipzig, Germany
Abbreviations: STS, superior temporal sulcus; fMRI, fuimaging.⁎ Corresponding author. Fax: +49 341 9940 2448.
E-mail address: [email protected] (H. Blank).
1053-8119/$ – see front matter © 2012 Elsevier Inc. Allhttp://dx.doi.org/10.1016/j.neuroimage.2012.09.047
a b s t r a c t
a r t i c l e i n f oArticle history:Accepted 20 September 2012Available online 27 September 2012
Keywords:fMRILip-readingMultisensoryPredictive codingSpeech reading
Speech recognition from visual-only faces is difficult, but can be improved by prior information about what is said.Here,we investigated how the humanbrain uses prior information fromauditory speech to improve visual–speechrecognition. In a functionalmagnetic resonance imaging study, participants performed a visual–speech recognitiontask, indicating whether the word spoken in visual-only videos matched the preceding auditory-onlyspeech, and a control task (face-identity recognition) containing exactly the same stimuli. We localized avisual–speech processing network by contrasting activity during visual–speech recognition with the con-trol task. Within this network, the left posterior superior temporal sulcus (STS) showed increased activityand interacted with auditory–speech areas if prior information from auditory speech did not match thevisual speech. This mismatch-related activity and the functional connectivity to auditory–speech areaswere specific for speech, i.e., they were not present in the control task. The mismatch-related activity correlatedpositively with performance, indicating that posterior STS was behaviorally relevant for visual–speech recogni-tion. In linewith predictive coding frameworks, these findings suggest that prediction error signals are producedif visually presented speech does not match the prediction from preceding auditory speech, and that this mech-anism plays a role in optimizing visual–speech recognition by prior information.
© 2012 Elsevier Inc. All rights reserved.
Introduction
Visual–speech recognition is an essential skill in human communica-tion that helps us to better understand what a speaker is saying. For ex-ample, if we are in a noisy environment, such as a crowded pub, theinformation from the moving face helps us “hear” what is said (Ross etal., 2007; Sumby and Pollack, 1954). In addition, for hearing-impairedor deaf people, visual–speech recognition is a central means of commu-nication (Giraud et al., 2001; Rouger et al., 2007; Strelnikov et al., 2009).
Previous functional magnetic resonance imaging (fMRI) studies haveshown that frontal and temporal lobe areas are involved in visual–speechrecognition based on contrasts containing different stimulus material,such as “viewing visual speech vs. viewing facial gestures” (Besle et al.,2008; Hall et al., 2005; Nishitani and Hari, 2002; Okada and Hickok,2009). Our first aim was to refine this network and investigate whethera subset of areas is activated, when contrasting visual–speech recogni-tionwith a control task (i.e. face-identity recognition) containing exactlythe same stimulusmaterial, thereby avoiding any confounddue to differ-ence in stimulus material.
Visual–speech recognition from visual–only faces is very difficult(Altieri et al., 2011; Summerfield, 1992). However, it can be improvedif one has prior information about what is said (Alegria et al., 1999;
nctional magnetic resonance
rights reserved.
Gregory, 1987), and it can also be influenced by auditory speech(Baart and Vroomen, 2010; Nath and Beauchamp, 2011). Our secondaim in this study was to investigate how the human brain uses priorinformation from auditory speech, and combines it with the visual in-formation, in order to improve visual–speech recognition. How audi-tory and visual information are combined in the human brain iscurrently a matter of debate (Beauchamp et al., 2004b; Driver andNoesselt, 2008; Ghazanfar et al., 2005; Noesselt et al., 2010). Thereis evidence that interactions between simultaneously presented audi-tory and visual stimuli occur in the multisensory posterior STS(Amedi et al., 2005; Beauchamp et al., 2004b; Stevenson and James,2009). When only auditory–speech or only visual–speech stimuliare presented, it has been shown that input in one modality alsoleads to activation of cortices related to another modality [e.g., auditoryspeech activates visual–speech processing areas in the visual left poste-rior STS (von Kriegstein et al., 2008) and vice versa, visual speech acti-vates auditory regions (Calvert et al., 1997; van Wassenhove et al.,2005)]. Here, we investigated whether predictions from auditory-onlyspeech influence processing of subsequently presented visual speechin the left posterior STS during visual–speech recognition (i.e., lip-reading) of visual-only videos, using activity and connectivity analyses.
To do this, we used an event-related fMRI design in which auditory-only speech and visual-only speech stimuli were presented in amatch-mismatch paradigm (Fig. 1). Participants performed a visual–speech recognition task and indicated whether the word spoken invisual-only videosmatched preceding auditory-only speech. The designadditionally included task-based and stimulus-based control conditions
110 H. Blank, K. von Kriegstein / NeuroImage 65 (2013) 109–118
(see Fig. 1 and Materials and methods). We expected three findings.Firstly, amismatch of auditory information and facial movement shouldcause high prediction error signals in left face-movement sensitive and/or multisensory STS. This prediction error signal can be measured as in-creased activity during visual–speech recognition if there is a mismatchof auditory and visual speech. Secondly, the strength of the predictionerror signal in STS should correlate with the ability to recognize visualspeech (visual–speech recognition performance). Thirdly, we expectedincreased functional connectivity between those areas that processauditory–speech and those that generate the prediction error signal ifthe auditory and visual speech does notmatch.We interpret our findingsin line with predictive coding frameworks where predictions are thecause for a higher prediction error signal in response to a non-matchingstimulus (Friston and Kiebel, 2009; Rao and Ballard, 1999).
Materials and methods
Subjects
Twenty-one healthy volunteers (10 female; mean age 26.9 years,age range 23–34 years; all right handers [Edinburgh questionnaire;(Oldfield, 1971)]) participated in the study. Written informed consentwas collected from all participants according to procedures approvedby the Research Ethics Committee of the University of Leipzig. Two sub-jects were excluded from the analysis: one because of difficulties withacquiring the field-map during fMRI and the other because he did notfollow the task instructions. Furthermore, one subject's behavioralresults had to be excluded due to intermittent technical problemswith the response box. Therefore, the analysis of the fMRI data wasbased on 19 subjects and the analysis of the behavioral data wasbased on 18 subjects.
Stimuli
Stimuli consisted of videos, with and without audio-stream, and ofauditory-onlyfiles. Stimuliwere createdby recording threemale speakers
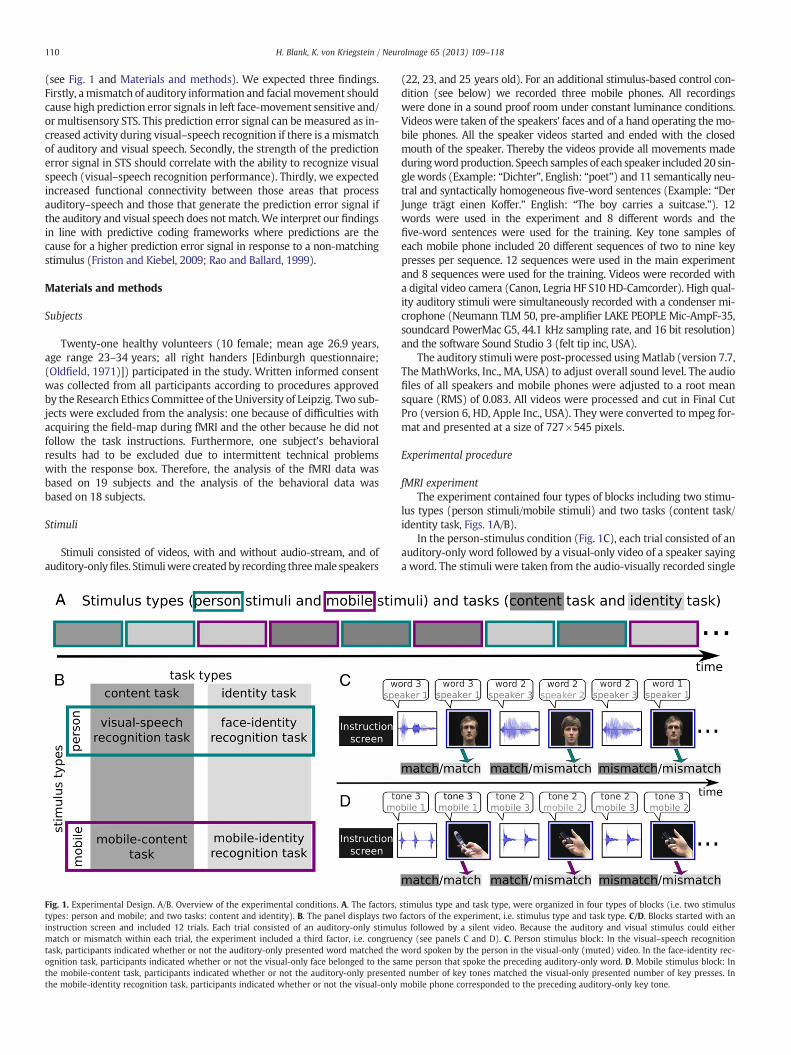
Fig. 1. Experimental Design. A/B. Overview of the experimental conditions. A. The factors,types: person and mobile; and two tasks: content and identity). B. The panel displays twoinstruction screen and included 12 trials. Each trial consisted of an auditory-only stimulmatch or mismatch within each trial, the experiment included a third factor, i.e. congruetask, participants indicated whether or not the auditory-only presented word matched theognition task, participants indicated whether or not the visual-only face belonged to the sathe mobile-content task, participants indicated whether or not the auditory-only presentethe mobile-identity recognition task, participants indicated whether or not the visual-only
(22, 23, and 25 years old). For an additional stimulus-based control con-dition (see below) we recorded three mobile phones. All recordingswere done in a sound proof room under constant luminance conditions.Videos were taken of the speakers' faces and of a hand operating themo-bile phones. All the speaker videos started and ended with the closedmouth of the speaker. Thereby the videos provide all movements madeduringword production. Speech samples of each speaker included 20 sin-glewords (Example: “Dichter”, English: “poet”) and 11 semantically neu-tral and syntactically homogeneous five-word sentences (Example: “DerJunge trägt einen Koffer.” English: “The boy carries a suitcase.”). 12words were used in the experiment and 8 different words and thefive-word sentences were used for the training. Key tone samples ofeach mobile phone included 20 different sequences of two to nine keypresses per sequence. 12 sequences were used in the main experimentand 8 sequences were used for the training. Videos were recorded witha digital video camera (Canon, Legria HF S10 HD-Camcorder). High qual-ity auditory stimuli were simultaneously recorded with a condenser mi-crophone (Neumann TLM 50, pre-amplifier LAKE PEOPLE Mic-AmpF-35,soundcard PowerMac G5, 44.1 kHz sampling rate, and 16 bit resolution)and the software Sound Studio 3 (felt tip inc, USA).
The auditory stimuli were post-processed usingMatlab (version 7.7,The MathWorks, Inc., MA, USA) to adjust overall sound level. The audiofiles of all speakers and mobile phones were adjusted to a root meansquare (RMS) of 0.083. All videos were processed and cut in Final CutPro (version 6, HD, Apple Inc., USA). They were converted to mpeg for-mat and presented at a size of 727×545 pixels.
Experimental procedure
fMRI experimentThe experiment contained four types of blocks including two stimu-
lus types (person stimuli/mobile stimuli) and two tasks (content task/identity task, Figs. 1A/B).
In the person-stimulus condition (Fig. 1C), each trial consisted of anauditory-only word followed by a visual-only video of a speaker sayinga word. The stimuli were taken from the audio-visually recorded single
stimulus type and task type, were organized in four types of blocks (i.e. two stimulusfactors of the experiment, i.e. stimulus type and task type. C/D. Blocks started with anus followed by a silent video. Because the auditory and visual stimulus could eitherncy (see panels C and D). C. Person stimulus block: In the visual–speech recognitionword spoken by the person in the visual-only (muted) video. In the face-identity rec-me person that spoke the preceding auditory-only word. D. Mobile stimulus block: Ind number of key tones matched the visual-only presented number of key presses. Inmobile phone corresponded to the preceding auditory-only key tone.
111H. Blank, K. von Kriegstein / NeuroImage 65 (2013) 109–118
words. In the mobile-stimulus condition (Fig. 1D), each trial consistedof an auditory-only presentation of key tones followed by a visual-only video of a hand pressing the keys of a mobile phone.
In addition to the factors, stimulus type and task, there was a thirdfactor, congruency, because auditory and visual stimulus could eithermatch or mismatch within each subsequent auditory and visual stim-ulus pair.
Subjectswere asked to perform two types of tasks on the person andmobile stimuli, i.e. content and an identity task. In the content task dur-ing person stimulus conditions (Fig. 1C), participants were requested toindicate, via button press, whether the visual-only silently spokenwordin the video matched the preceding auditory-only presented word ornot. This task required visual–speech recognition during the visual-stimulus presentation; therefore this task is henceforth referred to asthe visual–speech recognition task. Similarly, in the content task duringmobile-stimulus conditions (Fig. 1D), participants indicated, via buttonpress, whether or not the number of pressed mobile keys matched thenumber of the previously heard auditory-only key tones.
In the identity task during person stimulus conditions (Fig. 1C), par-ticipants indicated, via button press, whether or not the visual-only faceand the preceding auditory-only voice belonged to the same person.This task required recognizing the identity of the face in the video;therefore this task is henceforth referred to as the “face-identity recog-nition” task. Similarly, for the identity task during mobile stimulus con-ditions (Fig. 1D), participants indicated whether the visual-only mobilephone and the auditory-only key-tones belonged to the samemobile ornot. The identity associationswere learned prior to the fMRI experiment(for a detailed description of this training see below).
The experiment contained 12 different speech stimuli which wereeach randomly repeated three times per condition. While these stimuliwere presented repeatedly across two tasks, none were systematicallypresented as the first item in either task. Because of this randomizedpresentation, contrasting brain activation between tasks controlled forpotential stimulus repetition effects.
Within each trial, afixation cross occurred between the auditory-onlystimulus and the visual-only stimulus. It was presented for a jittered du-ration lasting an average of 1.6 s and a range of 1.2 to 2.2 s. The auditoryand visual stimuli were presented for 1.6 s on average. A blue frameappeared around the visual stimulus to indicate the response phase(see Figs. 1 C andD). The response phase lasted 2.3 s and startedwith be-ginning of the visual stimulus within each trial. Also, a fixation cross waspresented between trials for a jittered duration (average 1.6 s; range 1.2to 2.2 s). One third of the stimuli were null events of 1.6 s duration, ran-domly presented within the experiment (Friston et al., 1999). The trialsfor each of the four types of blocks were grouped into 24 blocks of 12 tri-als (84 s) of the same task (i.e., content or identity recognition task) tominimize the time spent instructing the subjects on which task to per-form. This also had the advantage that subjects did not frequently switchbetween different task-related mechanisms. Blocks were presented insemi-random order, not allowing neighboring blocks of the same typeof block. All blockswere preceded by a short task instruction. Thewrittenwords “Wort” (Eng. “word”) and “Anzahl der Tastentöne” (Eng. “keypress”) indicated the content task, whereas, “Person” (Eng. “person”)and “Handy” (Eng. “mobile phone”) indicated the identity task. Each in-struction was presented for 2.7 s. The whole experiment consisted oftwo 16.8 min scanning sessions. Between the sessions, subjects wereallowed to rest for approximately two minutes. Before the experiment,subjects received a short familiarization with all tasks.
Aside from the factors task (content/identity), stimulus (person/mobile) and congruency (match and mismatch), the whole experi-ment included a fourth factor (auditory-only first/visual-only first).The “auditory-only first” condition has been described above. Thesetup for the “visual-only first” condition was exactly like that ofthe “auditory-only first” condition, with the difference that the firststimulus was the visual-only video and the second stimulus wasauditory-only. This condition was part of a different research question
and the results will be described in detail elsewhere. However, thecondition contributed to the defining of the functional localizers(see below) and was used to show that visual–speech recognitionwas significantly better when the auditory-only speech precededthe visual-only speech than when the visual-only speech precededthe auditory-only speech (see Results).
TrainingTo enable the participants to do the identity tasks during fMRI
scanning, they were trained on the audio-visual identity of threespeakers and three mobile phones, directly before they went intothe MRI-scanner. The stimulus material used in training was differentfrom the material used in the fMRI experiment. Participants learnedthe speakers by watching audio-visual videos taken of the speakers'faces while they recited 36 five word sentences. Participants learnedthe mobile phones by watching audio-visual videos showing a handpressing keys on a mobile phone. 36 sequences with different num-bers of key presses were used. After the training, recognition perfor-mance was tested. In the test, participants first saw silent videos ofa person (or mobile phone) and subsequently listened to a voice (ora key tone). They were asked to indicate whether the auditory voice(or key tone) belonged to the face (or mobile phone) in the video.Subjects received feedback about correct, incorrect, and “too slow” re-sponses. The training, including the learning and the test, took 25 mi-nutes. Training was repeated twice for all participants (50 minutes intotal). If a participant performed less than 80% correct after the sec-ond training session, the training was repeated a third time.
Image acquisition
Functional images and structural T1-weighted images were acquiredon a 3 T Siemens Tim Trio MR scanner (Siemens Healthcare, Erlangen,Germany).
For the functionalMRI, a gradient-echo EPI (echo planar imaging) se-quence was used (TE 30 ms, flip angle 90 degrees, TR 2.79 s, 42 slices,whole brain coverage, acquisition bandwidth 116 kHz, 2 mmslice thick-ness, 1 mm interslice gap, in-plane resolution3 mm×3 mm).Geometricdistortions were characterized by a B0 field-map scan. The field-mapscan consisted of gradient-echo readout (24 echoes, inter-echo time0.95 ms) with standard 2D phase encoding. The B0 field was obtainedby a linear fit to the unwrapped phases of all odd echoes.
The structural images were acquired with a T1-weightedmagnetization-prepared rapid gradient echo sequence (3D MP-RAGE)with selective water excitation and linear phase encoding. Magneti-zation preparation consisted of a non-selective inversion pulse. Theimaging parameters were TI=650 ms, TR=1300 ms, TE=3.93 ms,alpha=10°, spatial resolution of 1 mm3, two averages. To avoid aliasing,oversampling was performed in the read direction (head–foot).
Data analysis
BehavioralBehavioral data (visual–speech recognition performance)were ana-
lyzed with Matlab (version 7.7, The MathWorks, Inc., MA, USA). To testwhether our experimental contrasts were influenced by an effect of dif-ficulty, we computed a repeatedmeasures two-way analysis of variance(ANOVA) with the factors task and congruency.
We used a paired t-test to assesswhether visual–speech recognitionwas improved by prior auditory information, i.e., whether visual–speech recognition performance was significantly better when theauditory-only speech preceded the visual-only speech, as opposed toif the visual-only speech preceded the auditory-only speech.
Functional MRIFunctional MRI data were analyzed with statistical parametric map-
ping (SPM8, Wellcome Trust Centre for Neuroimaging, UCL, UK, http://
112 H. Blank, K. von Kriegstein / NeuroImage 65 (2013) 109–118
www.fil.ion.ucl.ac.uk/spm), using standard spatial pre-processing proce-dures (realignment and unwarp, normalization to Montreal NeurologicalInstitute (MNI) standard stereotactic space, and smoothing with an iso-tropic Gaussian filter, 8 mmat FWHM). Geometric distortions due to sus-ceptibility gradients were corrected by an interpolation procedure basedon the B0map (the field-map). Statistical parametricmapswere generat-ed bymodeling the evoked hemodynamic response for the different con-ditions as boxcars convolved with a synthetic hemodynamic responsefunction in the context of the general linear model (Friston et al., 2007).The population-level inferences using BOLD signal changes between con-ditions of interest were based on a random-effects model that estimatedthe second-level t statistic at each voxel (Friston et al., 2007).
The Anatomy Toolbox in SPM was used for assigning labels to theregions in Tables 1, 3, and 4 (Eickhoff et al., 2005).
Definition of experimental contrasts of interestTo assess regions that were involved in the task of visual–speech rec-
ognition, we used the contrast “visual–speech recognition>face-identityrecognition”. We expected that a mismatch of auditory information andfacial movement would cause high prediction error signals in face-movement sensitive and/or multisensory STS (Arnal et al., 2009; Nathand Beauchamp, 2011). We used two functional contrasts to investigateprediction error signals during presentation of the visual stimulus, whenauditory and visual speech did not match: first, a mismatch contrast(“mismatch>match, during visual–speech recognition”), and second amore controlled mismatch-interaction contrast (“[mismatch>match]during visual–speech recognition>[mismatch>match] during face-identity recognition”). We will refer to these contrasts as mismatch con-trast andmismatch-interaction contrast, respectively. For the experimen-tal contrasts, we modeled the second event in each trial. Only events,when the auditory stimulus was presented first were included. This wasdone to equate the contrasted conditions with regard to behavioral diffi-culty at the group level (see Table 2b). When the visual stimulus waspresented before the auditory stimulus visual–speech recognition wasmore difficult than any of the other tasks. This condition was thereforenot included in any experimental contrast.
Definition of functional localizers for activity and connectivity analysesWe defined functional localizer contrasts to test whether activity
and connectivity results were located in specific regions (visual–faceand/or multisensory STS, auditory–speech areas). Localizers werebased on contrasts within the main experiment (Friston et al., 2006).For localizer contrasts we used only the first event in each trial (visualor auditory) to avoid modeling exactly the same events for the localizerand the experimental contrast (which was computed on the secondevent in each trial). This means that the visual events used in thelocalizer contrasts (for visual–face and multisensory areas) were fromtrials that were separate and independent of the trials used for the ex-perimental contrasts. Although the auditory events used in the localizercontrasts (for the multisensory and auditory–speech areas) and the vi-sual events for the experimental contrasts were two successive events
Table 1Coordinates for the contrast “visual–speech recognition>face-identity recognition”a.
Region Peak locationx, y, z (mm)
PeakZ
ApproximateBrodmann's area
Cluster sizenumber of voxels
Right SMA 12 11 67 4.05 area 6 146Left SMA −9 14 61 3.99 area 6Right SMA 6 5 67 3.54 area 6
Right PCG 57 −1 43 4.00 area 6 20Left PCG −54 −4 46 3.92 area 6 15Left IFG −60 14 13 3.82 area 44 8Left pSTG −54 −43 10 3.50 area 42 33
Left pSTG −48 −40 19 3.42 area 42
a Indented rows indicate maxima within same cluster. SMA=supplementary motorarea, PCG=precentral gyrus, IFG=inferior frontal gyrus, pSTG=posterior superiortemporal gyrus.
from the same trial, they were designed to be independent: the exper-imental contrasts involved taking the difference between conditionswhich were both preceded by the auditory stimuli used in the localizercontrasts. Therefore any potential effect of a correlated mean isaccounted for.
To localize visual–face areas in left posterior STS, we used the con-trast “faces>mobiles” (including all tasks). For localizing multisenso-ry regions, we combined activation for “faces and voices” (includingall tasks) in a conjunction analyses. This corresponds to the widelyused approach to localize multisensory areas by combining activationfor visual and auditory stimuli (Beauchamp et al., 2010; Noesselt etal., 2010; Stevenson and James, 2009). As a localizer for auditory–speech areas we used the contrast “voices>tones, both during thecontent task”. The auditory–speech localizer was consistent with thelocation of auditory–speech areas in the left anterior temporal lobereported in previous literature [pb0.001, FWE-corrected for regions ofinterest taken from (Obleser et al., 2007) and from a meta-analysis onword length auditory–speech processing (DeWitt and Rauschecker,2012)]. Regions of interest for the small volume correctionwere definedby the visual, auditory–speech, andmultisensory localizers (visual–facecluster in STS: x=−54, y=−34, z=10, k=30; multisensory clusterin STS: x=−60, y=−37, z=7, k=57; auditory–speech cluster inSTS:−x=63, y=−31, z=−11, k=12). The visual–face area localizerwas relatively unspecific (i.e. contrasting faces against objects) whileour hypothesis was specific for the left STS visual face-movementarea; we therefore complemented the visual–face area localizer bya coordinate that has been shown to be specifically activated byface-movement (“moving faces vs. static faces”) (von Kriegstein etal., 2008).
Significance thresholds for fMRI dataActivity in regions, for which we had an a-priori anatomical hy-
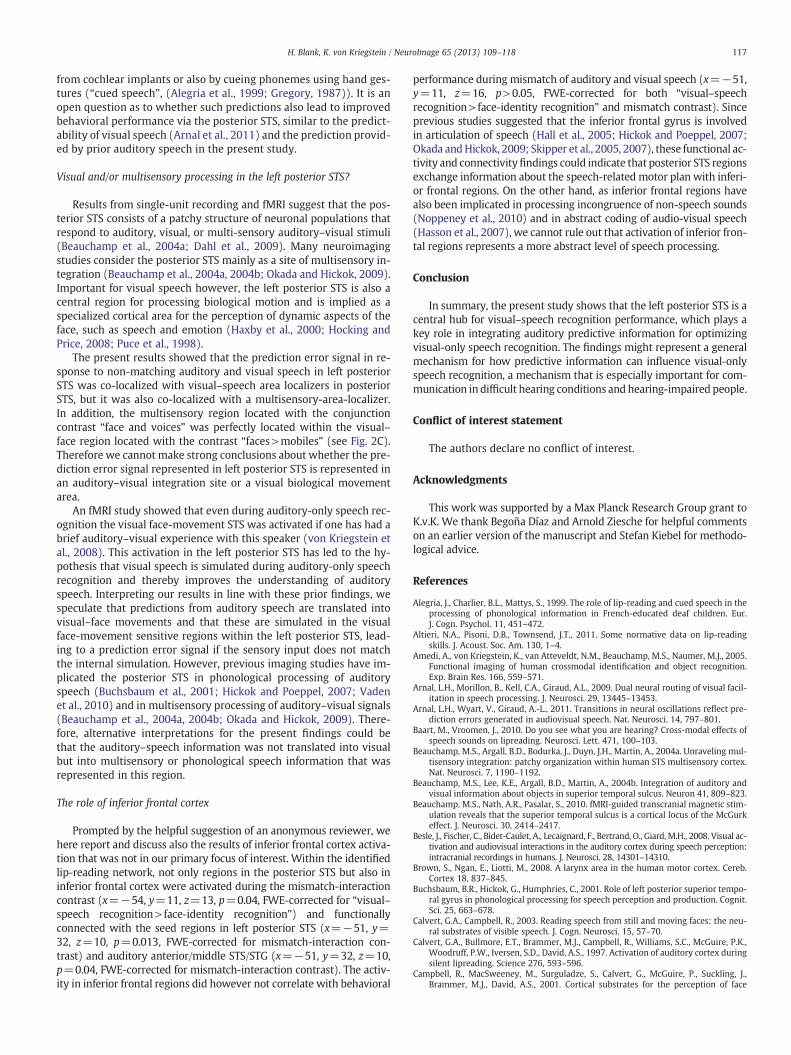
pothesis, [i.e. responses of areas usually reported for lip-reading(Calvert et al., 1997; Calvert and Campbell, 2003; Campbell et al.,2001; Hall et al., 2005; Okada and Hickok, 2009)] was considered sig-nificant at pb0.001, uncorrected. To test whether mismatch-relatedactivity was located within specific regions of interest in the posteriorSTS (e.g. multisensory, visual–face) we used the localizers describedabove. Activity was considered to be within a region of interest if itwas present at pb0.05 FWE-corrected for the region of interest. Allother effects were considered significant at pb0.05 FWE-correctedfor the whole brain. In the Results section, we only refer to the regionsthat adhere to these significance criteria. For completeness and as anoverview for interested readers, activations in regions for which wedid not have an a-priori anatomical hypothesis are listed inTables 1, 3, and 4 at pb0.001, uncorrected; with a cluster extend of5 voxels. None of them reached the significance threshold of pb0.05FWE-corrected for the whole brain. For display purposes only, inFigs. 2 A and B, BOLD response from the contrast “visual–speechrecognition>face-identity recognition” was overlaid on the groupmean structural image, at pb0.005, uncorrected with a voxel thresh-old of 20 voxels.
Correlation analysisTo investigate whether the amount of mismatch-related activity
correlated with behavioral performance, we correlated activity dur-ing the mismatch contrast (“mismatch>match, during visual–speechrecognition”) with behavioral performance during visual–speech rec-ognition over subjects. Behavioral performance was included in theSPM analysis as a covariate at the second level. Significance wasassessed with SPM. Only to obtain a Pearson's r we subsequently an-alyzed the data in Matlab.
Psychophysiological interactions analysis (PPI)To investigate the functional connectivity between auditory–speech
regions and posterior STS regions during visual–speech recognition, we
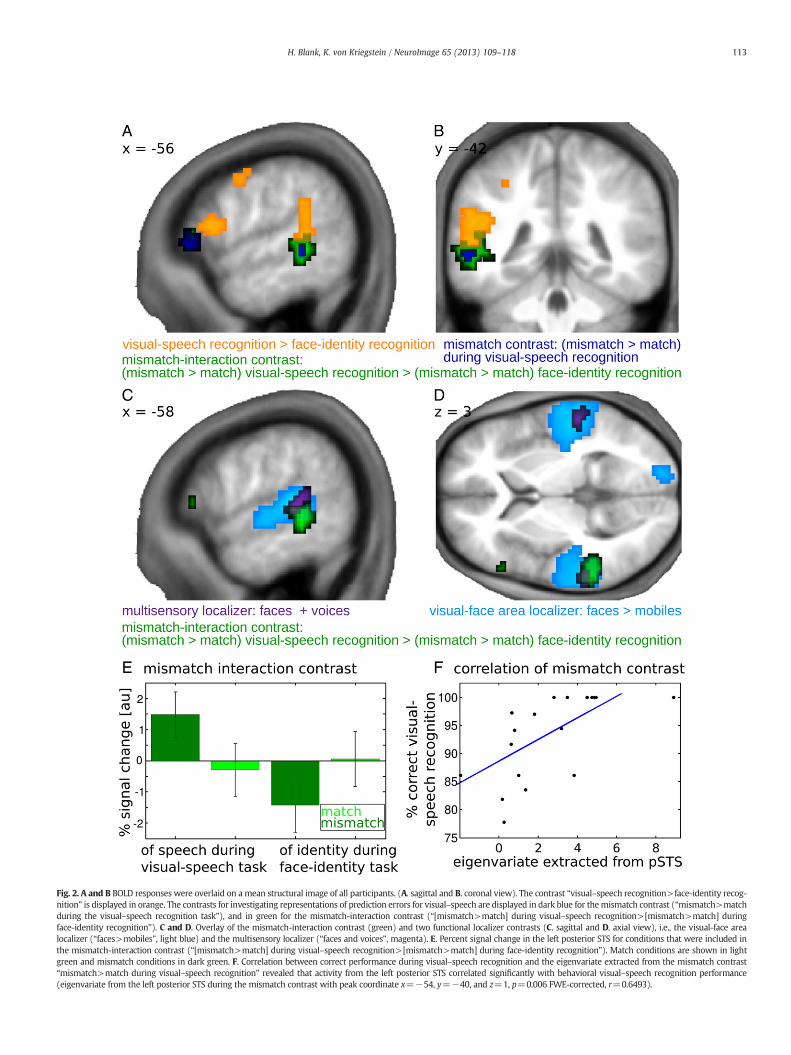
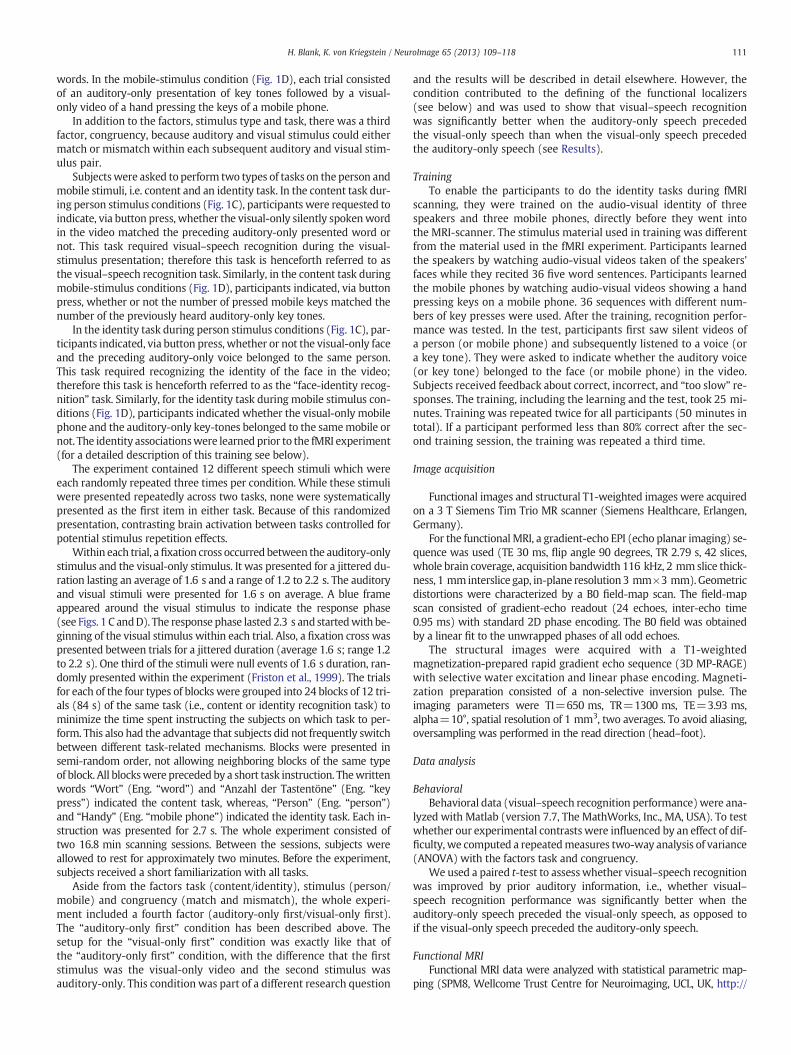
Fig. 2. A and B BOLD responses were overlaid on a mean structural image of all participants. (A. sagittal and B. coronal view). The contrast “visual–speech recognition>face-identity recog-nition” is displayed in orange. The contrasts for investigating representations of prediction errors for visual–speech are displayed in dark blue for themismatch contrast (“mismatch>matchduring the visual–speech recognition task”), and in green for the mismatch-interaction contrast (“[mismatch>match] during visual–speech recognition>[mismatch>match] duringface-identity recognition”). C and D. Overlay of the mismatch-interaction contrast (green) and two functional localizer contrasts (C. sagittal and D. axial view), i.e., the visual-face arealocalizer (“faces>mobiles”, light blue) and the multisensory localizer (“faces and voices”, magenta). E. Percent signal change in the left posterior STS for conditions that were included inthe mismatch-interaction contrast (“[mismatch>match] during visual–speech recognition>[mismatch>match] during face-identity recognition”). Match conditions are shown in lightgreen and mismatch conditions in dark green. F. Correlation between correct performance during visual–speech recognition and the eigenvariate extracted from the mismatch contrast“mismatch>match during visual–speech recognition” revealed that activity from the left posterior STS correlated significantly with behavioral visual–speech recognition performance(eigenvariate from the left posterior STS during the mismatch contrast with peak coordinate x=−54, y=−40, and z=1, p=0.006 FWE-corrected, r=0.6493).
113H. Blank, K. von Kriegstein / NeuroImage 65 (2013) 109–118
114 H. Blank, K. von Kriegstein / NeuroImage 65 (2013) 109–118
conducted PPI analyses (Friston et al., 1997). We performed the PPI fol-lowing standard procedures (Friston et al., 1997; O'Reilly et al., 2012).These included modeling the psychological variable and the firsteigenvariate as regressors in addition to the psychophysiological inter-action term at the single subject level. Including the psychological vari-able and the first eigenvariate in the PPI analysis assured that onlyconnectivity effects that are neither explained by task nor eigenvariateare present in the results. We extracted time courses from the regionsof interest (i.e., posterior STS, as defined by the mismatch-interactioncontrast, and auditory–speech regions defined by the contrast “voices>tones, both during the content task”). The psychological variable wasthe mismatch-interaction contrast. Population-level inferences aboutBOLD signal changes were based on a random-effects model that esti-mated the second-level statistic at each voxel using a one-samplet-test. Results were considered significant if they were present atpb0.05, FWE-corrected for the region of interest. In Fig. 3, for displaypurposes only, the PPI results were presented at pb0.01, uncorrectedwith a voxel threshold of 20 voxels.
Results
Identifying areas involved in visual–speech recognition: “visual–speechrecognition>face-identity recognition” (Figs. 2A and B, orange)
The contrast “visual–speech recognition>face-identity recognition”revealed activation of left superior temporal gyrus (STG, x=−54,y=−43, z=10), left supplementary motor area (SMA, x=−9, y=14, z=61), left precentral gyrus (PCG, x=−54, y=−4, z=46), andthe inferior frontal gyrus (IFG, x=−60, y=14, z=13; Figs. 2A and B,orange, and Table 1). The location of these areas is in line with brain re-gions involved in visual–speech recognition, as reported in previousstudies (Brown et al., 2008; Chainay et al., 2004; Hall et al., 2005;Nishitani and Hari, 2002; Okada and Hickok, 2009). The activity didnot seem to be primarily caused by difficulty level differences betweenthe conditions, since the visual–speech recognition and face-identityrecognition task did not differ in difficulty on the group level (pairedt-test: 93.09 vs. 92.57, t=0.22, df=17, p=0.8285; Tables 2a, 2b).There was also no higher variability in one of the task conditions(Levene's Test for Equality of Variances: F(1, 34)=0.0760, p=0.7845). Since both tasks were performed at ceiling we applied therationalized arcsine transformation (Sherbecoe and Studebaker,2004; Studebaker, 1985) and repeated the analysis with theserau-transformed performance scores. The results of this analysiswere qualitatively similar to the one with raw performance scores(t=0.3464, df=17, p=0.7333).
Mismatch of auditory speech and visual speech increases activity invisual–speech recognition area (Figs. 2A–E, green and dark blue)
The mismatch contrast, and the more controlled mismatch-interaction contrast revealed increased activity in left posterior STS(mismatch contrast: “mismatch>match, during visual–speech recog-nition”, Figs. 2A and B, dark blue, and Table 3; mismatch-interactioncontrast “[mismatch>match] during visual–speech recognition>[mismatch>match] during face-identity recognition”, Figs. 2A–E,green, and Table 4, pb0.001 uncorrected). The mismatch-interactioncontrast resulted in a more extended cluster than the mismatch con-trast, but they both had the same peak coordinate (x=−57, y=−40,z=−2). The plot (Fig. 2E) shows that at this coordinate there wasnot only higher activation for “speech mismatch vs. speech match,”but also for “face-identitymatch vs. face-identitymismatch”. The differ-ence between “face-identity match vs. face-identity mismatch” washowever not significant at a corrected significance threshold thatwould be necessary for such an unexpected result. It also did notreach the more lenient threshold of 0.001 uncorrected (x=−57,y=−40, z=−2, p=0.002, uncorrected). The results indicate that
activation in the left posterior STS was predominantly increased whenthe visual–speech information did not match the auditory–speechinput when the task emphasizes speech processing. Furthermore, themismatch-interaction contrast controlled for regions being activatedby any generalmismatch between vocal and facial information. Activityelicited by bothmismatch contrasts did not seem to be primarily causedby an effect of difficulty, since therewas neither amain effect of congru-ency nor of task in the behavioral data (repeated measures two-wayANOVA, for the factor congruency: F(1,17)=2.425, p=0.1378, andfor the factor task: F(1,17)=0.044, p=0.8365, Tables 2a, 2b). Therewas also no interaction between mismatch and task (repeated mea-sures two-way analysis of variance test, F(1,17)=0.022, p=0.8843,Tables 2a, 2b).
As hypothesized the activity in left posterior STS for the mismatch-interaction contrast was located in a visual–face area (x=−60,y=−34, z=−4, p=0.009, FWE-corrected for visual–face arealocalizer) and also in a more specific face-movement area (x=−54,y=−55, z=7, p=0.009, FWE-corrected with localizer from vonKriegstein et al., 2008). Furthermore the activity in left posterior STSfor the mismatch-interaction contrast overlapped with the activity ofthe contrast “visual–speech recognition>face-identity recognition”(at x=−51, y=−43, z=13, p=0.014, FWE-corrected).
It is however not possible to conclude that the left posterior STSarea that reacted to mismatch conditions corresponds more to a visu-al face-movement area than a multisensory area, because there wasconsiderable overlap also with the multisensory localizer (p=0.004,FWE-corrected for multisensory localizer, Figs. 2C and D).
Themismatch-related activity in posterior STS correlates with visual–speechrecognition ability (Fig. 2F)
Performance during visual–speech recognition and the mismatch-related activity in left posterior STS correlated significantly (x=−54,y=−40, and x=1, p=0.006, FWE-corrected for mismatch contrast;Pearson's r=0.6493, p=0.0035, n=18). Post hoc analysis confirmedthat this correlation was not affected by the subject with the highesteigenvariate-value in the posterior STS (x=−54, y=−40, and x=1,p=0.006, FWE-corrected for mismatch contrast; Pearson's r=0.6672, p=0.0034, n=17). The correlation indicates that the activationof this area was behaviorally relevant for visual–speech recognition.
Auditory–speech and visual–speech recognition areas are functionallyconnected during visual-only speech recognition (Fig. 3, Table 4)
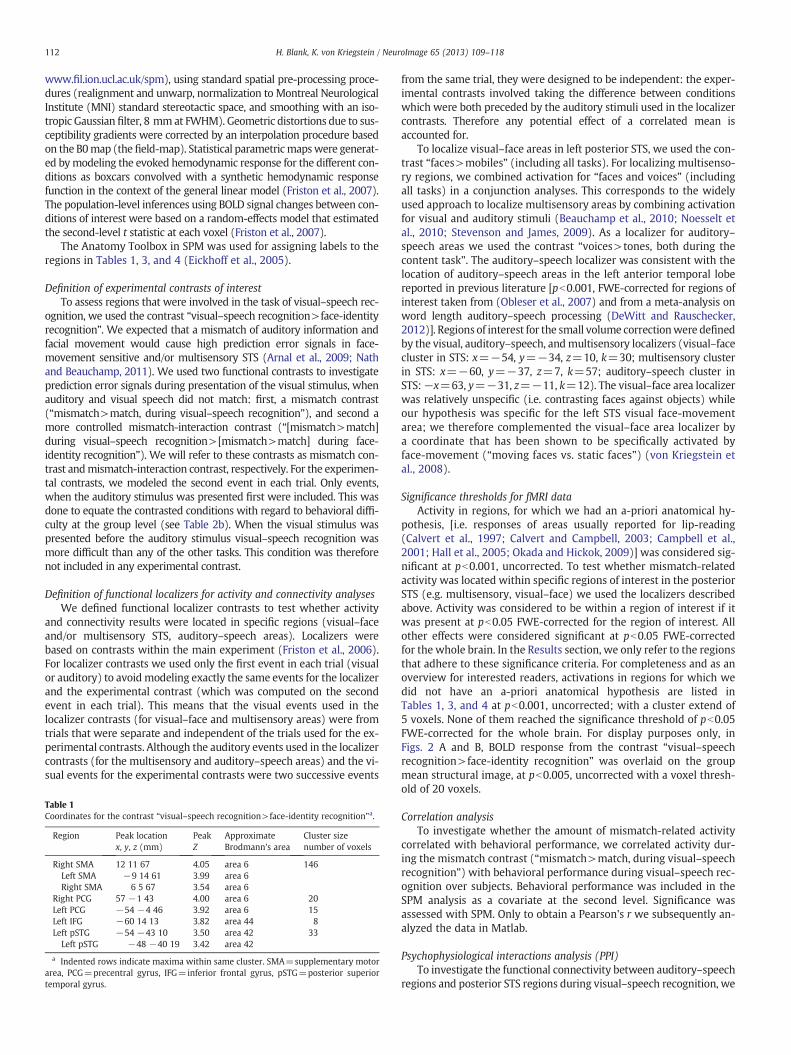
We used PPI analyses to investigate whether there was increasedfunctional connectivity between the areas that processed auditory–speech and those that generated the mismatch-related activity if theauditory and visual speech did not match. We found functional con-nectivity of the areas that generated the mismatch-related activityin the left posterior STS, localized with the mismatch-interaction con-trast, and auditory–speech areas (p=0.04, FWE-corrected with theauditory–speech area localizer). Vice versa we found functional con-nectivity between auditory–speech areas in anterior/middle STS/STG, and left posterior STS areas (p=0.046, FWE-corrected withmismatch-interaction contrast). Both functional connectivity analy-ses included as psychological variable themismatch-interaction con-trast (i.e., “[mismatch>match] during visual–speech recognition>[mismatch>match] during face-identity recognition”).
Auditory predictions improve visual–speech recognition performance
Visual–speech recognition was significantly better, when theauditory-only speech preceded the visual-only speech, in contrast toif the visual-only speech preceded the auditory-only speech (pairedt-test: t=5.3136, df=17, pb0.00001, Tables 2a, 2b).
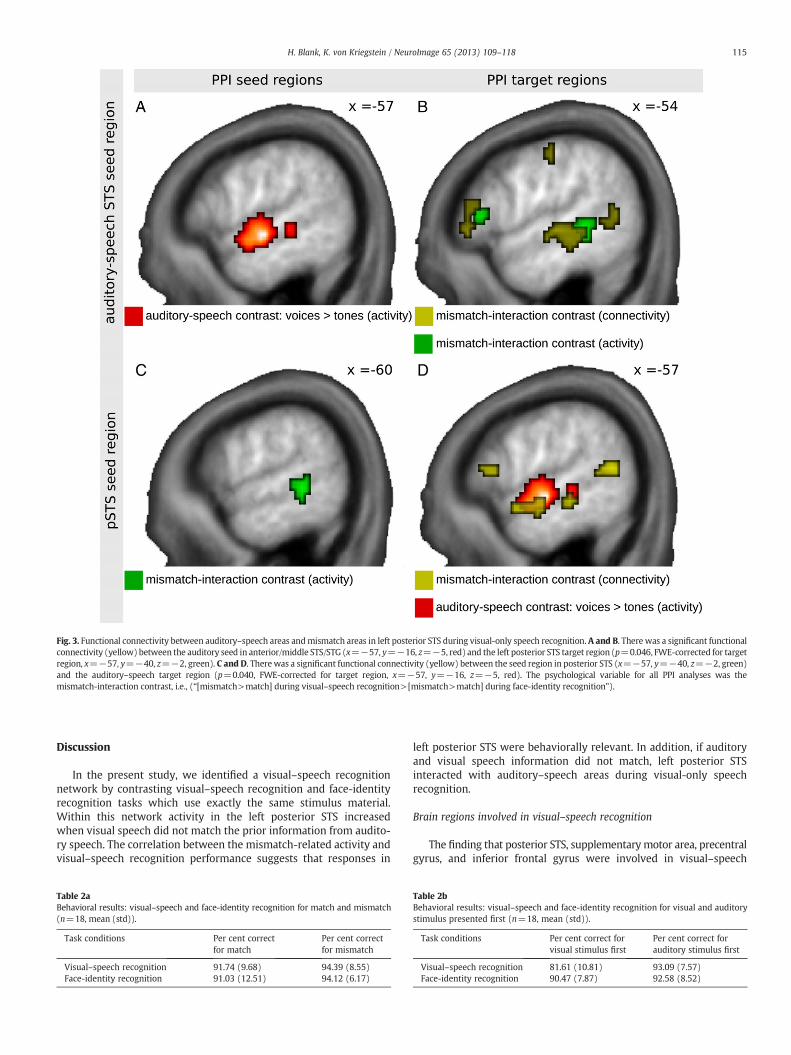
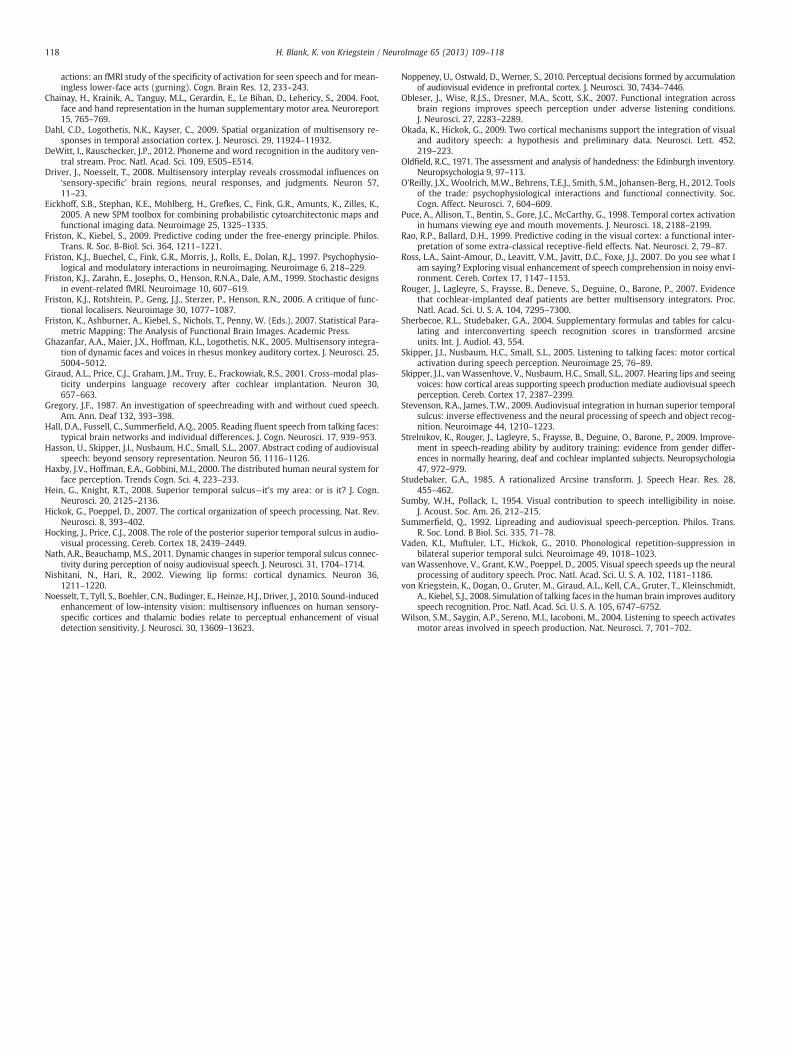
Fig. 3. Functional connectivity between auditory–speech areas andmismatch areas in left posterior STS during visual-only speech recognition. A and B. There was a significant functionalconnectivity (yellow) between the auditory seed in anterior/middle STS/STG (x=−57, y=−16, z=−5, red) and the left posterior STS target region (p=0.046, FWE-corrected for targetregion, x=−57, y=−40, z=−2, green). C and D. There was a significant functional connectivity (yellow) between the seed region in posterior STS (x=−57, y=−40, z=−2, green)and the auditory–speech target region (p=0.040, FWE-corrected for target region, x=−57, y=−16, z=−5, red). The psychological variable for all PPI analyses was themismatch-interaction contrast, i.e., (“[mismatch>match] during visual–speech recognition>[mismatch>match] during face-identity recognition”).
115H. Blank, K. von Kriegstein / NeuroImage 65 (2013) 109–118
Discussion
In the present study, we identified a visual–speech recognitionnetwork by contrasting visual–speech recognition and face-identityrecognition tasks which use exactly the same stimulus material.Within this network activity in the left posterior STS increasedwhen visual speech did not match the prior information from audito-ry speech. The correlation between the mismatch-related activity andvisual–speech recognition performance suggests that responses in
Table 2aBehavioral results: visual–speech and face-identity recognition for match and mismatch(n=18, mean (std)).
Task conditions Per cent correctfor match
Per cent correctfor mismatch
Visual–speech recognition 91.74 (9.68) 94.39 (8.55)Face-identity recognition 91.03 (12.51) 94.12 (6.17)
left posterior STS were behaviorally relevant. In addition, if auditoryand visual speech information did not match, left posterior STSinteracted with auditory–speech areas during visual-only speechrecognition.
Brain regions involved in visual–speech recognition
The finding that posterior STS, supplementary motor area, precentralgyrus, and inferior frontal gyrus were involved in visual–speech
Table 2bBehavioral results: visual–speech and face-identity recognition for visual and auditorystimulus presented first (n=18, mean (std)).
Task conditions Per cent correct forvisual stimulus first
Per cent correct forauditory stimulus first
Visual–speech recognition 81.61 (10.81) 93.09 (7.57)Face-identity recognition 90.47 (7.87) 92.58 (8.52)
Table 3Coordinates for the mismatch contrast “mismatch>match during the visual–speechrecognition task”a.
Region Peak locationx, y, z (mm)
PeakZ
ApproximateBrodmann's area
Cluster sizenumber of voxels
Left IFG −54 29 4 5.06 area 44/45 63Left IFG −51 23 −5 3.88 area 44/45
Left STG −45 −22 −8 3.92 6Right MTG 54 −13 −11 3.71 11Right CG 21 −100 −2 3.56 area 17/18 7
a Indented rows indicate maxima within same cluster. IFG=inferior frontal gyrusSTG=superior temporal gyrus, MTG=middle temporal gyrus, CG=cingulum
116 H. Blank, K. von Kriegstein / NeuroImage 65 (2013) 109–118
recognition is in line with previous research. However, studies haveused different stimulus material, e.g., contrasts between conditionswith talking faces and conditions with meaningless face movements(e.g., “gurning”), or with still faces (Calvert et al., 1997; Calvert andCampbell, 2003; Campbell et al., 2001; Hall et al., 2005; Okada andHickok, 2009), or with more basic stimuli, such as check patterns(Puce et al., 1998). This might explain why most previous studiesalso found additional regions activated, such as occipital and fusiformgyrus, calcarine sulcus, middle and superior temporal gyrus, and pari-etal cortex (Calvert and Campbell, 2003; Campbell et al., 2001; Hall etal., 2005), Heschl's gyrus and also subcortical regions like the amygda-la and the insula (Calvert et al., 1997) or the thalamus (Calvert andCampbell, 2003; Hall et al., 2005). Because in the present study therewere no stimulus differences and also performance was matchedover the group for the contrast (“visual–speech recognition>face-identity recognition”), we assume that the areas found were involvedin the task of visual–speech recognition. The network of four corticalregions includes areas that are involved in perception of faces, speech,and biological motion (inferior frontal gyrus and superior temporalgyrus; (Hall et al., 2005; Okada and Hickok, 2009; Skipper et al.,2005; Skipper et al., 2007), for a review see (Hein and Knight,2008)), as well as areas that are involved in the active performanceof mouth movements (supplementary motor area and precentralgyrus; (Brown et al., 2008; Chainay et al., 2004)). This supports thesuggestion that the same system is involved in perception, as well asaction of lip movements (Skipper et al., 2007; Wilson et al., 2004).
Prediction error signals are represented in left posterior STS
The present findings showed that the left posterior STS was notonly involved in visual-only speech recognition, but also respondedto a greater extent if the visual sensory information did not matchthe preceding auditory information. We interpret the changes inBOLD activity as reflecting a prediction error signal, as defined by pre-dictive coding theories (Friston and Kiebel, 2009; Rao and Ballard,1999). In this view, predictions about the visual speech input, thatin our study were based on the preceding auditory stimulus, werepresent in the left posterior STS. These predictions were the cause
Table 4Coordinates for the mismatch-interaction contrast “(mismatch>match) during visual–speech recognition>(mismatch>match) during face-identity recognition” a.
Region Peak locationx, y, z (mm)
PeakT
ApproximateBrodmann's area
Cluster sizenumber of voxels
Left MTG −57 −40 −2 4.16 83Right PCG 54 2 28 3.92 area 6/44 12Left IFG −54 29 7 3.75 area 44/45 25
Left IFG −48 23 13 3.26 area 44/45Left STG −45 −22 −8 3.42 5Right MTG 48 −70 1 3.35 area 37 16
a Indented rows indicate maxima within same cluster. MTG=middle temporalgyrus, PCG=precentral gyrus, IFG=inferior frontal gyrus STG=superior temporalgyrus.
for a higher prediction error signal to the non-matching visualstimulus.
Investigating brain function with mismatching stimuli entails aparticular difficulty: that the mismatch effect could be present forany kind of mismatching stimuli, not necessarily only for speech.Here, we addressed this by computing a mismatch-interaction contrastin which we contrasted the mismatch in auditory and visual speechwith a mismatch in auditory and visual identity (“[mismatch>match]during visual–speech recognition>[mismatch>match] during face-identity recognition”). This implies that the mismatch responses wefound in left posterior STS were relatively specific to speech and not acommon prediction error signal in response to mismatching auditoryand visual stimuli in general. Our results are consistent with a recentMEG/fMRI-study, showing that activity in left posterior STS correlatedwith the predictability of the visual stimuli during the presentation ofincongruent audio-visual videos of a speaker pronouncing syllables(Arnal et al., 2011). The present results extend these findings and sug-gest that it is not only visual predictability that elicits high activity inleft posterior STS for a mismatching stimulus, but that the predictionscan also be derived from preceding auditory speech.
Interaction of auditory–speech areas with visual–speech recognitionareas in the left posterior STS
Functional connectivity between the left posterior STS and auditory–speech areas in left anterior and middle STS/STG was increasedwhen the visual speech did not match the predictions from the pre-ceding auditory–speech sample. The location of the auditory–speech area is in line with previous studies on speech intelligibly[corrected for regions of interest taken from (Obleser et al., 2007)and from a meta-analysis on word length auditory–speech process-ing (DeWitt and Rauschecker, 2012)]. A recent study showed in-creased connectivity between left posterior STS and auditorycortex when the auditory information was less noisy than the visualinformation [and vice versa for the visual modality; (Nath andBeauchamp, 2011)]. While this previous study investigated connec-tivity from posterior STS regions to primary auditory cortex, weinvestigated the connectivity from posterior STS to auditory higher-level speech regions. Both the connectivity findings regarding primaryauditory cortex and our results integrate well with the predictive cod-ing framework. Here, this framework would assume that auditory–speech regions send predictions about the expected speech input tovisual–speech regions and vice versa that visual–speech regions sendback prediction errors, i.e. the residual errors between the predictionsand the actual visual–speech input. We therefore speculate that theincreased functional connectivity between mismatch and auditory–speech regions is a result of sending the prediction error signal fromleft posterior STS back to auditory–speech areas in more anterior andmiddle parts of the left temporal lobe.
The mismatch-related activity in left posterior STS is behaviorallyrelevant
The activity in left posterior STS in response to mismatching speechstimuli was positively correlated with the behavioral performance ofsubjects, indicating that this signal was relevant for visual–speech rec-ognition performance. This is in line with a previous study on visual–speech recognition that showed that the extent of activation in leftSTG increased as a function of lip-reading ability (Hall et al., 2005).As expected, predictions from the auditory modality significantlyimproved the behavioral performance in matching the visual andthe auditory–speech signals in the present study. In communicationthat is entirely based on visual–speech recognition, e.g., in hearingimpaired prior information is used to improve visual–speech recog-nition success (Giraud et al., 2001; Rouger et al., 2007; Strelnikovet al., 2009). This can be done in several ways e.g. by auditory cues
117H. Blank, K. von Kriegstein / NeuroImage 65 (2013) 109–118
from cochlear implants or also by cueing phonemes using hand ges-tures (“cued speech”, (Alegria et al., 1999; Gregory, 1987)). It is anopen question as to whether such predictions also lead to improvedbehavioral performance via the posterior STS, similar to the predict-ability of visual speech (Arnal et al., 2011) and the prediction provid-ed by prior auditory speech in the present study.
Visual and/or multisensory processing in the left posterior STS?
Results from single-unit recording and fMRI suggest that the pos-terior STS consists of a patchy structure of neuronal populations thatrespond to auditory, visual, or multi-sensory auditory–visual stimuli(Beauchamp et al., 2004a; Dahl et al., 2009). Many neuroimagingstudies consider the posterior STS mainly as a site of multisensory in-tegration (Beauchamp et al., 2004a, 2004b; Okada and Hickok, 2009).Important for visual speech however, the left posterior STS is also acentral region for processing biological motion and is implied as aspecialized cortical area for the perception of dynamic aspects of theface, such as speech and emotion (Haxby et al., 2000; Hocking andPrice, 2008; Puce et al., 1998).
The present results showed that the prediction error signal in re-sponse to non-matching auditory and visual speech in left posteriorSTS was co-localized with visual–speech area localizers in posteriorSTS, but it was also co-localized with a multisensory-area-localizer.In addition, the multisensory region located with the conjunctioncontrast “face and voices” was perfectly located within the visual–face region located with the contrast “faces>mobiles” (see Fig. 2C).Therefore we cannot make strong conclusions about whether the pre-diction error signal represented in left posterior STS is represented inan auditory–visual integration site or a visual biological movementarea.
An fMRI study showed that even during auditory-only speech rec-ognition the visual face-movement STS was activated if one has had abrief auditory–visual experience with this speaker (von Kriegstein etal., 2008). This activation in the left posterior STS has led to the hy-pothesis that visual speech is simulated during auditory-only speechrecognition and thereby improves the understanding of auditoryspeech. Interpreting our results in line with these prior findings, wespeculate that predictions from auditory speech are translated intovisual–face movements and that these are simulated in the visualface-movement sensitive regions within the left posterior STS, lead-ing to a prediction error signal if the sensory input does not matchthe internal simulation. However, previous imaging studies have im-plicated the posterior STS in phonological processing of auditoryspeech (Buchsbaum et al., 2001; Hickok and Poeppel, 2007; Vadenet al., 2010) and in multisensory processing of auditory–visual signals(Beauchamp et al., 2004a, 2004b; Okada and Hickok, 2009). There-fore, alternative interpretations for the present findings could bethat the auditory–speech information was not translated into visualbut into multisensory or phonological speech information that wasrepresented in this region.
The role of inferior frontal cortex
Prompted by the helpful suggestion of an anonymous reviewer, wehere report and discuss also the results of inferior frontal cortex activa-tion that was not in our primary focus of interest. Within the identifiedlip-reading network, not only regions in the posterior STS but also ininferior frontal cortex were activated during the mismatch-interactioncontrast (x=−54, y=11, z=13, p=0.04, FWE-corrected for “visual–speech recognition>face-identity recognition”) and functionallyconnected with the seed regions in left posterior STS (x=−51, y=32, z=10, p=0.013, FWE-corrected for mismatch-interaction con-trast) and auditory anterior/middle STS/STG (x=−51, y=32, z=10,p=0.04, FWE-corrected for mismatch-interaction contrast). The activ-ity in inferior frontal regions did however not correlate with behavioral
performance during mismatch of auditory and visual speech (x=−51,y=11, z=16, p>0.05, FWE-corrected for both “visual–speechrecognition>face-identity recognition” and mismatch contrast). Sinceprevious studies suggested that the inferior frontal gyrus is involvedin articulation of speech (Hall et al., 2005; Hickok and Poeppel, 2007;Okada andHickok, 2009; Skipper et al., 2005, 2007), these functional ac-tivity and connectivityfindings could indicate that posterior STS regionsexchange information about the speech-related motor plan with inferi-or frontal regions. On the other hand, as inferior frontal regions havealso been implicated in processing incongruence of non-speech sounds(Noppeney et al., 2010) and in abstract coding of audio-visual speech(Hasson et al., 2007), we cannot rule out that activation of inferior fron-tal regions represents a more abstract level of speech processing.
Conclusion
In summary, the present study shows that the left posterior STS is acentral hub for visual–speech recognition performance, which plays akey role in integrating auditory predictive information for optimizingvisual-only speech recognition. The findings might represent a generalmechanism for how predictive information can influence visual-onlyspeech recognition, a mechanism that is especially important for com-munication in difficult hearing conditions and hearing-impaired people.
Conflict of interest statement
The authors declare no conflict of interest.
Acknowledgments
This work was supported by a Max Planck Research Group grant toK.v.K. We thank Begoña Díaz and Arnold Ziesche for helpful commentson an earlier version of the manuscript and Stefan Kiebel for methodo-logical advice.
References
Alegria, J., Charlier, B.L., Mattys, S., 1999. The role of lip-reading and cued speech in theprocessing of phonological information in French-educated deaf children. Eur.J. Cogn. Psychol. 11, 451–472.
Altieri, N.A., Pisoni, D.B., Townsend, J.T., 2011. Some normative data on lip-readingskills. J. Acoust. Soc. Am. 130, 1–4.
Amedi, A., von Kriegstein, K., van Atteveldt, N.M., Beauchamp, M.S., Naumer, M.J., 2005.Functional imaging of human crossmodal identification and object recognition.Exp. Brain Res. 166, 559–571.
Arnal, L.H., Morillon, B., Kell, C.A., Giraud, A.L., 2009. Dual neural routing of visual facil-itation in speech processing. J. Neurosci. 29, 13445–13453.
Arnal, L.H., Wyart, V., Giraud, A.-L., 2011. Transitions in neural oscillations reflect pre-diction errors generated in audiovisual speech. Nat. Neurosci. 14, 797–801.
Baart, M., Vroomen, J., 2010. Do you see what you are hearing? Cross-modal effects ofspeech sounds on lipreading. Neurosci. Lett. 471, 100–103.
Beauchamp, M.S., Argall, B.D., Bodurka, J., Duyn, J.H., Martin, A., 2004a. Unraveling mul-tisensory integration: patchy organization within human STS multisensory cortex.Nat. Neurosci. 7, 1190–1192.
Beauchamp, M.S., Lee, K.E., Argall, B.D., Martin, A., 2004b. Integration of auditory andvisual information about objects in superior temporal sulcus. Neuron 41, 809–823.
Beauchamp, M.S., Nath, A.R., Pasalar, S., 2010. fMRI-guided transcranial magnetic stim-ulation reveals that the superior temporal sulcus is a cortical locus of the McGurkeffect. J. Neurosci. 30, 2414–2417.
Besle, J., Fischer, C., Bidet-Caulet, A., Lecaignard, F., Bertrand, O., Giard, M.H., 2008. Visual ac-tivation and audiovisual interactions in the auditory cortex during speech perception:intracranial recordings in humans. J. Neurosci. 28, 14301–14310.
Brown, S., Ngan, E., Liotti, M., 2008. A larynx area in the human motor cortex. Cereb.Cortex 18, 837–845.
Buchsbaum, B.R., Hickok, G., Humphries, C., 2001. Role of left posterior superior tempo-ral gyrus in phonological processing for speech perception and production. Cognit.Sci. 25, 663–678.
Calvert, G.A., Campbell, R., 2003. Reading speech from still and moving faces: the neu-ral substrates of visible speech. J. Cogn. Neurosci. 15, 57–70.
Calvert, G.A., Bullmore, E.T., Brammer, M.J., Campbell, R., Williams, S.C., McGuire, P.K.,Woodruff, P.W., Iversen, S.D., David, A.S., 1997. Activation of auditory cortex duringsilent lipreading. Science 276, 593–596.
Campbell, R., MacSweeney, M., Surguladze, S., Calvert, G., McGuire, P., Suckling, J.,Brammer, M.J., David, A.S., 2001. Cortical substrates for the perception of face
118 H. Blank, K. von Kriegstein / NeuroImage 65 (2013) 109–118
actions: an fMRI study of the specificity of activation for seen speech and for mean-ingless lower-face acts (gurning). Cogn. Brain Res. 12, 233–243.
Chainay, H., Krainik, A., Tanguy, M.L., Gerardin, E., Le Bihan, D., Lehericy, S., 2004. Foot,face and hand representation in the human supplementary motor area. Neuroreport15, 765–769.
Dahl, C.D., Logothetis, N.K., Kayser, C., 2009. Spatial organization of multisensory re-sponses in temporal association cortex. J. Neurosci. 29, 11924–11932.
DeWitt, I., Rauschecker, J.P., 2012. Phoneme and word recognition in the auditory ven-tral stream. Proc. Natl. Acad. Sci. 109, E505–E514.
Driver, J., Noesselt, T., 2008. Multisensory interplay reveals crossmodal influences on‘sensory-specific’ brain regions, neural responses, and judgments. Neuron 57,11–23.
Eickhoff, S.B., Stephan, K.E., Mohlberg, H., Grefkes, C., Fink, G.R., Amunts, K., Zilles, K.,2005. A new SPM toolbox for combining probabilistic cytoarchitectonic maps andfunctional imaging data. Neuroimage 25, 1325–1335.
Friston, K., Kiebel, S., 2009. Predictive coding under the free-energy principle. Philos.Trans. R. Soc. B-Biol. Sci. 364, 1211–1221.
Friston, K.J., Buechel, C., Fink, G.R., Morris, J., Rolls, E., Dolan, R.J., 1997. Psychophysio-logical and modulatory interactions in neuroimaging. Neuroimage 6, 218–229.
Friston, K.J., Zarahn, E., Josephs, O., Henson, R.N.A., Dale, A.M., 1999. Stochastic designsin event-related fMRI. Neuroimage 10, 607–619.
Friston, K.J., Rotshtein, P., Geng, J.J., Sterzer, P., Henson, R.N., 2006. A critique of func-tional localisers. Neuroimage 30, 1077–1087.
Friston, K., Ashburner, A., Kiebel, S., Nichols, T., Penny, W. (Eds.), 2007. Statistical Para-metric Mapping: The Analysis of Functional Brain Images. Academic Press.
Ghazanfar, A.A., Maier, J.X., Hoffman, K.L., Logothetis, N.K., 2005. Multisensory integra-tion of dynamic faces and voices in rhesus monkey auditory cortex. J. Neurosci. 25,5004–5012.
Giraud, A.L., Price, C.J., Graham, J.M., Truy, E., Frackowiak, R.S., 2001. Cross-modal plas-ticity underpins language recovery after cochlear implantation. Neuron 30,657–663.
Gregory, J.F., 1987. An investigation of speechreading with and without cued speech.Am. Ann. Deaf 132, 393–398.
Hall, D.A., Fussell, C., Summerfield, A.Q., 2005. Reading fluent speech from talking faces:typical brain networks and individual differences. J. Cogn. Neurosci. 17, 939–953.
Hasson, U., Skipper, J.I., Nusbaum, H.C., Small, S.L., 2007. Abstract coding of audiovisualspeech: beyond sensory representation. Neuron 56, 1116–1126.
Haxby, J.V., Hoffman, E.A., Gobbini, M.I., 2000. The distributed human neural system forface perception. Trends Cogn. Sci. 4, 223–233.
Hein, G., Knight, R.T., 2008. Superior temporal sulcus—it's my area: or is it? J. Cogn.Neurosci. 20, 2125–2136.
Hickok, G., Poeppel, D., 2007. The cortical organization of speech processing. Nat. Rev.Neurosci. 8, 393–402.
Hocking, J., Price, C.J., 2008. The role of the posterior superior temporal sulcus in audio-visual processing. Cereb. Cortex 18, 2439–2449.
Nath, A.R., Beauchamp, M.S., 2011. Dynamic changes in superior temporal sulcus connec-tivity during perception of noisy audiovisual speech. J. Neurosci. 31, 1704–1714.
Nishitani, N., Hari, R., 2002. Viewing lip forms: cortical dynamics. Neuron 36,1211–1220.
Noesselt, T., Tyll, S., Boehler, C.N., Budinger, E., Heinze, H.J., Driver, J., 2010. Sound-inducedenhancement of low-intensity vision: multisensory influences on human sensory-specific cortices and thalamic bodies relate to perceptual enhancement of visualdetection sensitivity. J. Neurosci. 30, 13609–13623.
Noppeney, U., Ostwald, D., Werner, S., 2010. Perceptual decisions formed by accumulationof audiovisual evidence in prefrontal cortex. J. Neurosci. 30, 7434–7446.
Obleser, J., Wise, R.J.S., Dresner, M.A., Scott, S.K., 2007. Functional integration acrossbrain regions improves speech perception under adverse listening conditions.J. Neurosci. 27, 2283–2289.
Okada, K., Hickok, G., 2009. Two cortical mechanisms support the integration of visualand auditory speech: a hypothesis and preliminary data. Neurosci. Lett. 452,219–223.
Oldfield, R.C., 1971. The assessment and analysis of handedness: the Edinburgh inventory.Neuropsychologia 9, 97–113.
O'Reilly, J.X., Woolrich, M.W., Behrens, T.E.J., Smith, S.M., Johansen-Berg, H., 2012. Toolsof the trade: psychophysiological interactions and functional connectivity. Soc.Cogn. Affect. Neurosci. 7, 604–609.
Puce, A., Allison, T., Bentin, S., Gore, J.C., McCarthy, G., 1998. Temporal cortex activationin humans viewing eye and mouth movements. J. Neurosci. 18, 2188–2199.
Rao, R.P., Ballard, D.H., 1999. Predictive coding in the visual cortex: a functional inter-pretation of some extra-classical receptive-field effects. Nat. Neurosci. 2, 79–87.
Ross, L.A., Saint-Amour, D., Leavitt, V.M., Javitt, D.C., Foxe, J.J., 2007. Do you see what Iam saying? Exploring visual enhancement of speech comprehension in noisy envi-ronment. Cereb. Cortex 17, 1147–1153.
Rouger, J., Lagleyre, S., Fraysse, B., Deneve, S., Deguine, O., Barone, P., 2007. Evidencethat cochlear-implanted deaf patients are better multisensory integrators. Proc.Natl. Acad. Sci. U. S. A. 104, 7295–7300.
Sherbecoe, R.L., Studebaker, G.A., 2004. Supplementary formulas and tables for calcu-lating and interconverting speech recognition scores in transformed arcsineunits. Int. J. Audiol. 43, 554.
Skipper, J.I., Nusbaum, H.C., Small, S.L., 2005. Listening to talking faces: motor corticalactivation during speech perception. Neuroimage 25, 76–89.
Skipper, J.I., vanWassenhove, V., Nusbaum, H.C., Small, S.L., 2007. Hearing lips and seeingvoices: how cortical areas supporting speech production mediate audiovisual speechperception. Cereb. Cortex 17, 2387–2399.
Stevenson, R.A., James, T.W., 2009. Audiovisual integration in human superior temporalsulcus: inverse effectiveness and the neural processing of speech and object recog-nition. Neuroimage 44, 1210–1223.
Strelnikov, K., Rouger, J., Lagleyre, S., Fraysse, B., Deguine, O., Barone, P., 2009. Improve-ment in speech-reading ability by auditory training: evidence from gender differ-ences in normally hearing, deaf and cochlear implanted subjects. Neuropsychologia47, 972–979.
Studebaker, G.A., 1985. A rationalized Arcsine transform. J. Speech Hear. Res. 28,455–462.
Sumby, W.H., Pollack, I., 1954. Visual contribution to speech intelligibility in noise.J. Acoust. Soc. Am. 26, 212–215.
Summerfield, Q., 1992. Lipreading and audiovisual speech-perception. Philos. Trans.R. Soc. Lond. B Biol. Sci. 335, 71–78.
Vaden, K.I., Muftuler, L.T., Hickok, G., 2010. Phonological repetition-suppression inbilateral superior temporal sulci. Neuroimage 49, 1018–1023.
van Wassenhove, V., Grant, K.W., Poeppel, D., 2005. Visual speech speeds up the neuralprocessing of auditory speech. Proc. Natl. Acad. Sci. U. S. A. 102, 1181–1186.
von Kriegstein, K., Dogan, O., Gruter, M., Giraud, A.L., Kell, C.A., Gruter, T., Kleinschmidt,A., Kiebel, S.J., 2008. Simulation of talking faces in the human brain improves auditoryspeech recognition. Proc. Natl. Acad. Sci. U. S. A. 105, 6747–6752.
Wilson, S.M., Saygin, A.P., Sereno, M.I., Iacoboni, M., 2004. Listening to speech activatesmotor areas involved in speech production. Nat. Neurosci. 7, 701–702.