Embed Size (px)
Citation preview
Using Mechanical Turk as a Subject Recruitment Tool for Experimental Research
Adam J. Berinsky
Massachusetts Institute of Technology Associate Professor
Department of Political Science [email protected]
Gregory A. Huber Yale University
Associate Professor Department of Political Science
Institution for Social and Policy Studies [email protected]
Gabriel S. Lenz
Massachusetts Institute of Technology Associate Professor
Department of Political Science [email protected]
September 17, 2010
We investigate Amazon.com’s Mechanical Turk (MTurk) interface as a means for performing experimental political science research. After describing the MTurk interface and its promise as vehicle for performing low cost and easily fielded experiments, we investigate sample characteristics. Benchmarking MTurk respondents to important published experimental work in political science, we show that respondents recruited in this manner are more representative than in-person convenience samples—the modal sample in published experimental political science—but modestly less representative than subjects in internet-based panels or national probability samples. We investigate two important concerns about MTurk samples: whether they are unengaged or frequent subjects. Additionally, we provide a tool to conduct panel surveys using the MTurk interface, discuss panel retention rates, and demonstrate that MTurk subjects are vastly less expensive than anything other than uncompensated student samples.
1
In recent years, there has been increased interest in experiments in political science
(citations). But experiments are neither cheap nor easy to implement, particularly when those
experiments involve non-student adult subjects. Amazon.com’s Mechanical Turk (MTurk) has
the potential to facilitate low-cost experiments in political science with a diverse subject pool.
MTurk is an online web-based platform for recruiting and paying subjects to perform
tasks. The benefit of using MTurk for subject recruitment is clear, Relative to other experimental
pools, MTurk is extremely cheap; it is possible to run studies where subjects are paid as little as
10 or 15 cents. Not surprisingly, scholars across the social sciences have taken an interest in
using MTurk to recruit research subjects to participate in online surveys, particularly surveys
with embedded experimental manipulations.1
However, despite this burgeoning line of research, the benefits and potential limitations
of subject recruitment and research using MTurk remain relatively unexplored (though see
Buhrmester, Kwang, and Gosling In press; Horton, Rand, Zeckhauser 2010).2 This paper
answers a simple but important question: Is Amazon’s Mechanical Turk a valid tool for
conducting research on the nature of public opinion and related questions in political science?
Our answer is a qualified “yes.” In particular, the demographic characteristics of MTurk
users, we show, are more representative and diverse than the corresponding student and
convenience samples typically used in experimental political science studies. Although MTurk
samples do not fare as well against high-quality and expensive representative samples, the
1 At the time of writing, Google Scholar lists 231 social sciences articles with the phrase “Mechanical Turk.” Relevant studies by economists include, e.g., Chandler and Kapelner 2010, Chen and Horton 2010; Horton and Chilton 2010. Computer scientists have also tested MTurk’s suitability as a source of data for training machine learning algorithms (e.g., Sheng et al., 2008; Sorokin and Forsyth, 2008). For example, Snow et al. (2008) assessed the quality of MTurkers responses to several classic human language problems, finding that the quality was no worse than the expert data that most researchers use. 2 Analyses have generally found that experiments on Internet samples yield results similar to traditional samples. Based on a comprehensive analysis, for example, Gosling et al. (2004) conclude that Internet samples tend to be diverse, are not adversely affected by nonserious or repeat responders, and produce findings consistent with traditional methods.
2
MTurk samples are – in informal terms – at least as representative, if not more so, than the
convenience samples typically used in political science experiments.
We begin by providing an overview of the subject-recruitment and research gathering
choices involved in using MTurk. Next, we describe results from a series of surveys we
undertook to measure MTurk subjects’ demographic and political characteristics. We compare
our MTurk sample to those used in experiments published in leading political science journals, to
a high-quality, internet panel sample, and to random-stratified samples used in the Current
Population Survey (CPS) and the American National Election Studies (ANES). We demonstrate
that the effects of experimental manipulations observed in the MTurk population comport well
with those found in other studies. We also address two concerns raised about on-line samples:
Whether sample pools are dominated by subjects who participate in numerous experiments (or
participate more than once in a given experiment) and whether those subjects are effectively
engaged with the survey stimuli. Finally, we describe methods for using MTurk to implement a
panel survey. We show that it is possible to recontact respondents through MTurk at reasonably
high rates and at minimal costs.
Recruiting Experimental Subjects via Mechanical Turk
A core problem for experimental researchers in political science is the difficulty and
prohibitive cost of recruiting adult subjects. The high cost of subject recruitment has several
undesirable effects, including a tendency to rely on convenience samples that are often
dominated by student populations, which raise important external validity concerns about
whether observed relationships would persist for non-student samples (Sears 1986, though see
Druckman and Kam 2010). These concerns have led to important innovations to enable broader
access to representative populations for experimental work, including the NSF-funded Time-
3
Sharing Experiments in the Social Sciences (TESS) initiative, but access to these resources
remains limited.
Amazon.com’s Mechanical Turk is a promising vehicle for experimental subject
recruitment. Amazon.com markets MTurk as a means to recruit individuals to undertake tasks In
practice, those tasks involve a wide array of jobs requiring human intelligence, such as coding
the attributes of product pictures for Amazon.com or transcribing handwriting, but they can also
include taking surveys with embedded experimental manipulations at extremely low cost – as
little as 10 cents per subject for a 5-minute experiment.
To initiate a survey using MTurk, a researcher – or, to use Amazon’s language,
“Requester” – establishes an account (www.mturk.com), places funds into her account, and then
posts using the MTurk web interface a “job listing” that describes the Human Interaction Task
(HIT) to be completed and the compensation to be paid. At this stage, the researcher can set
requirements for subjects, including country of residence and “approval rate” – the percent of
prior HITs submitted by the respondent that were subsequently accepted by Requesters. When a
MTurk “worker” who meets these eligibility requirements logs onto their account, they can
review the list of HITs available to them and choose to undertake any task for which they are
eligible.
The MTurk interface gives the researcher a great deal of flexibility with which to conduct
a study. In addition to using MTurk’s embedded workspace to set up simple tasks, the researcher
can also refer subjects to an external website to perform tasks – for instance, taking a survey with
an embedded experimental manipulation. If subjects are referred to an external website, the site
can be programmed to provide the subject with a unique code to enter in the MTurk website to
4
demonstrate that they have completed the task.3 Additionally, outside websites make it easy to
condition participation on informed consent, to debrief after a manipulation, and to collect
detailed information about the survey process, including response times for items and
respondents’ location when taking the survey (on the basis of the MTurker’s Internet Protocol, or
IP, address).
The final stage for the researcher is compensating subjects. If the subject has entered a
valid code from an external website, the researcher can simply authorize payment for the task
through the MTurk interface. Additionally, if the researcher has arranged for the external website
to produce a unique identifier, she can also now review that particular worker’s task behavior to
assess whether it is of the necessary quality. For example, if the experiment included mandatory
filter questions or questions designed to verify the subject was reading instructions, the worker’s
compensation can be made contingent on responses to those questions.
Benchmarking MTurk Samples
MTurk makes it possible to easily conduct experimental studies. At the same time, we
presently know little about the types of subjects who are available through MTurk relative to
other subject pools. To assess the value for research of the MTurk subject pool we compare
measured characteristics of MTurk survey participants to those characteristics in three distinct
types of research samples: (a) convenience samples used in experiments published in leading
political science journals, (b) a sample generated by a high-quality internet panel, and (c)
probability samples of U.S. residents.
3 We have successfully used websites like SurveyGizmo and Qualtrics for this process, and any web survey service that can produce a unique worker code should perform equally well.
5
To learn about the characteristics of the MTurk population, we interviewed 587
individuals in February and March of 2010. We advertised the survey as taking about 10 minutes
and paid respondents 50 cents each. Because we are benchmarking MTurk against samples of
adult U.S. citizens, we restricted the survey to individuals MTurk classified as 18 or older and
living in the U.S.4 We also excluded individuals with approval rates below 95 percent on
previous MTurk tasks. As an additional check on U.S. residency, we verified that respondents
took the survey from U.S. IP addresses and excluded 32 individuals (5.8 percent) who did not.5
Comparison of Respondent Characteristics: Local Convenience Samples
Local convenience samples are the modal means of subject recruitment among recent
published survey and lab experimental research in political science. In particular, we examined
all issues of the American Political Science Review, the American Journal of Political Science,
and the Journal of Politics from January 2005 to June 2010. Of the 961 articles in these issues,
51 used experimental data. Forty-four of these articles used U.S. subjects exclusively (the
complete list of these articles, as well as a summary of subject recruitment methods, appears in
Appendix 1). Of these 44 articles, more than half used convenience samples for subjects
(including student samples, local intercept samples, or temporary agencies).
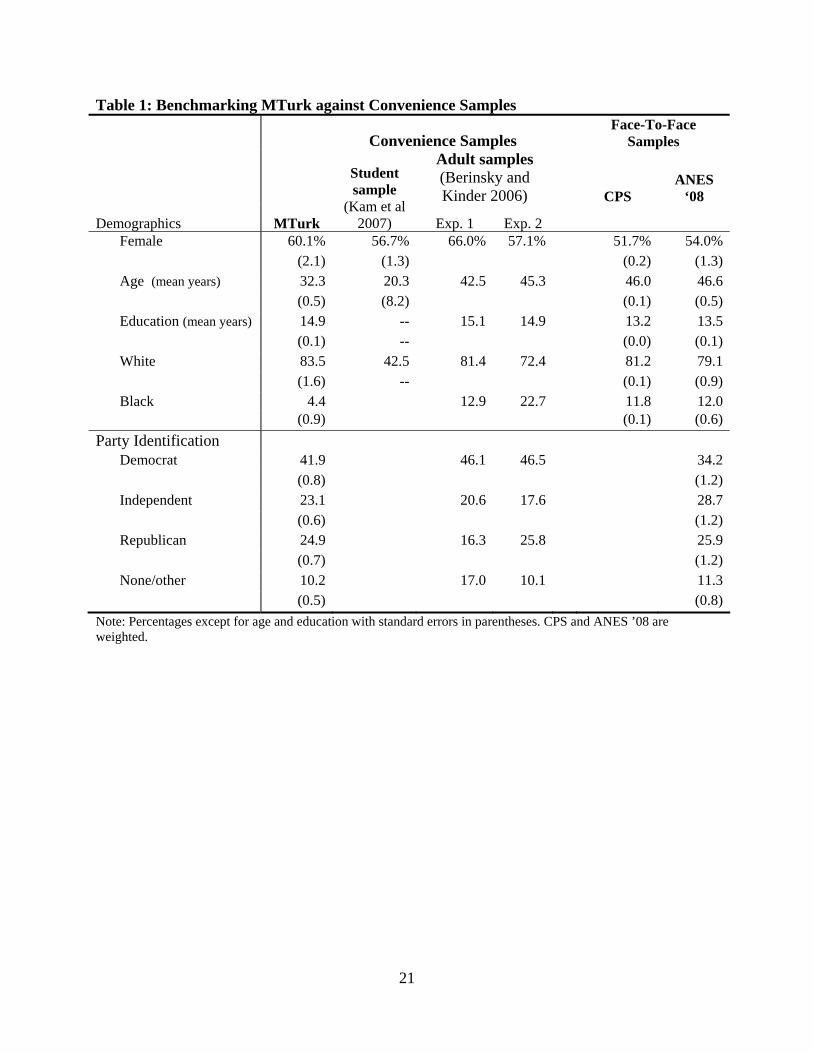
Table 1 compares our MTurk sample to several convenience samples. After displaying
the demographics of our MTurk sample, it displays the average characteristics from student
samples collected by Kam, Wilking, and Zechmeister (2007). Next, the table lists characteristics
of two adult convenience samples used in Berinsky and Kinder (2006) – one of the handful of
articles that describes the characteristics of its convenience samples. One of these samples is 4 MTurk classifies individuals as 18 or older based on self reports. MTurk does not reveal how it classifies individuals as living in a particular country, but may rely on mailing addresses and credit card billing addresses. 5 These individuals may reside in the U.S., but be traveling or studying abroad. Additionally, although IP address locators seem reliable, we are unaware of research benchmarking their accuracy. Still, so as to provide as conservative a picture of our sample as is possible, we excluded these questionable respondents.
6
from around Princeton, New Jersey and the other is from around Ann Arbor, Michigan. Finally,
to compare all of these to representative samples, the table also includes statistics from the
Current Population Study (CPS) and the 2008 American National Elections Study (ANES).
These latter two studies use face-to-face probability samples and are widely considered the “gold
standard” for general opinion poll sampling.
In terms of demographic representativeness, the MTurk sample fares well in comparison
with these convenience samples, especially the student sample.6 Not surprisingly, relative to an
average student sample, the MTurk population is substantially older, but it is younger than the
two Berinsky and Kinder samples. Focusing on the Berinsky and Kinder samples, the skew in
the gender distribution of those samples was no better than the MTurk sample and, in fact, was
worse in the Ann Arbor sample. More importantly for the purposes of political science
experiments, the party identification skew was almost identical in the MTurk and Ann Arbor
samples. Of course, our point is not to single out Berinsky and Kinder – the distribution of
relevant demographic and political variables in their study was, in fact, more representative than
that found in several other studies. Moreover, many other studies do not report any information
about sample characteristics. Instead, we simply wish to emphasize that, when compared to the
practical and publishable alternatives, the MTurk respondent pool has attractive characteristics –
even before considering issues of cost.
Comparison of Respondent Characteristics: Knowledge Networks/ANESP
Apart from local convenience samples, the other dominant form of sample selection in
the published experimental studies discussed above is internet-based surveys. Since political
scientists are increasingly using existing Internet panels from which to draw subjects, we
6 Other researchers have surveyed MTurk respondents and found a similar demographic profile (e.g., Ross et al. 2010).
7
benchmark MTurk against a high-quality Internet survey, the American National Election 2008-
2009 Panel Study (ANESP). The firm Knowledge Networks conducted the ANESP by recruiting
respondents through a random-digit-dial method for a 21-wave internet-based panel survey (10
waves of the survey concerned political matters; the other 11 waves did not).7 Since we are
treating the ANESP not as a best estimate of true population parameters, but rather as an
example of a high-quality Internet sample, we present unweighted results from this survey.
Comparing our MTurk survey with the ANESP has an additional advantage. Since both are
Internet surveys, we hold the “mode” of survey constant. Additionally, in designing the MTurk
survey, we followed the ANESP as closely as possible, using identical wordings and branching
formats.
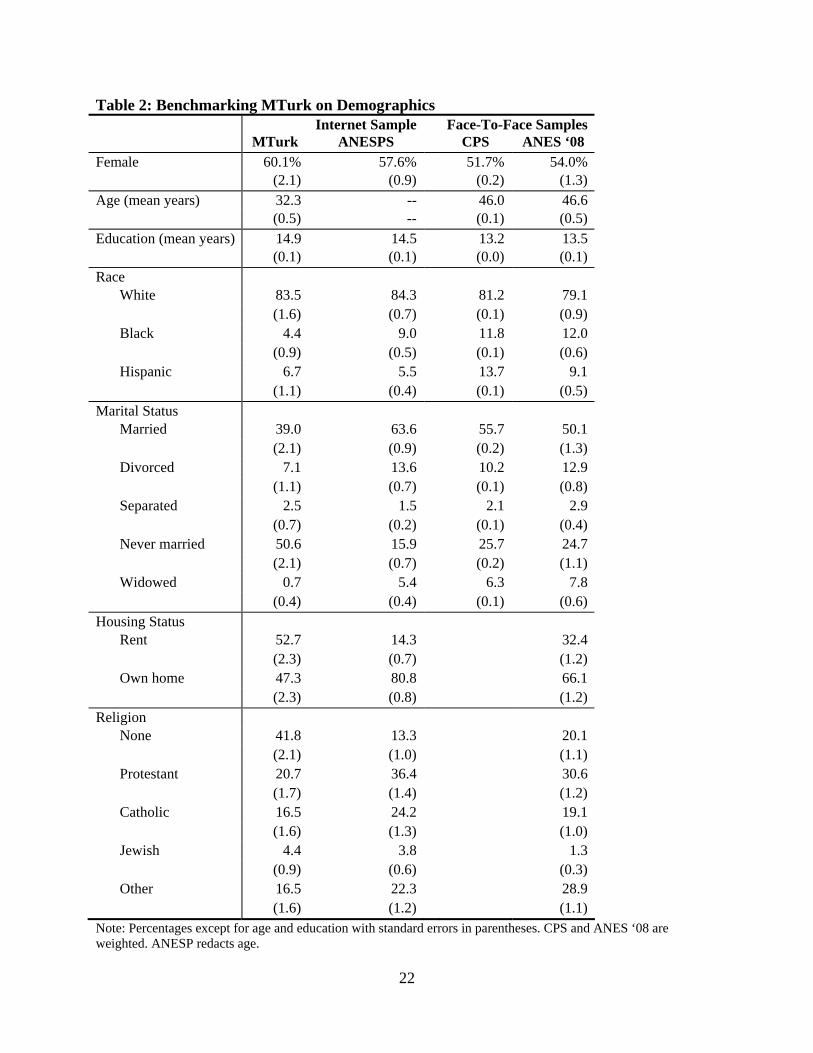
On many demographics, the MTurk sample is not substantially less representative of the
population than the ANESP. These detailed demographic comparisons appear in Table 2. MTurk
is only slightly more female, 60 versus 58 percent, and only slightly more educated, 14.9 versus
14.5 years. On race, MTurk’s characteristics are mixed: It is closer to the CPS on percent white
than is the ANESP, but is considerably worse on percent black, four versus nine percent. MTurk
fares worse on age-related demographics, such as marital status, homeownership, and religious
preference.8
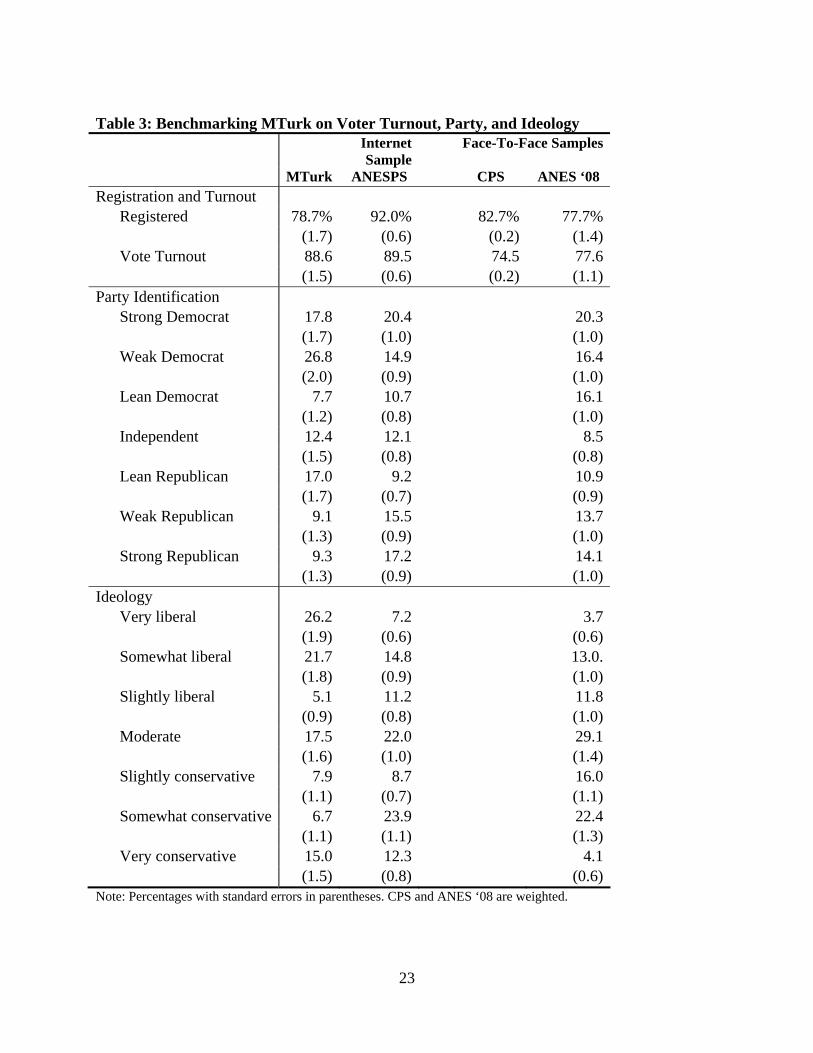
On key political measures, MTurk subjects fair reasonably well by comparison with the
ANESP. We present analysis for different outcomes in Table 3-Table 5. They register at about
the same rate as do those in the 2008 ANES and CPS, about 80 percent, while respondents in the
ANESP report a much higher 92 percent registration rate (Table 3). Among registered
respondents, MTurk subjects report voting at about the same rate as the ANESP, 89 versus 90
7 Prospective respondents were offered $10 per month to complete surveys on the Internet for 30 minutes each month. 8 The ANESP redacts age.
8
percent. They are also slightly more Democratic in their partisan identification than ANESP
respondents, and are substantially more extreme on ideology (Table 3).
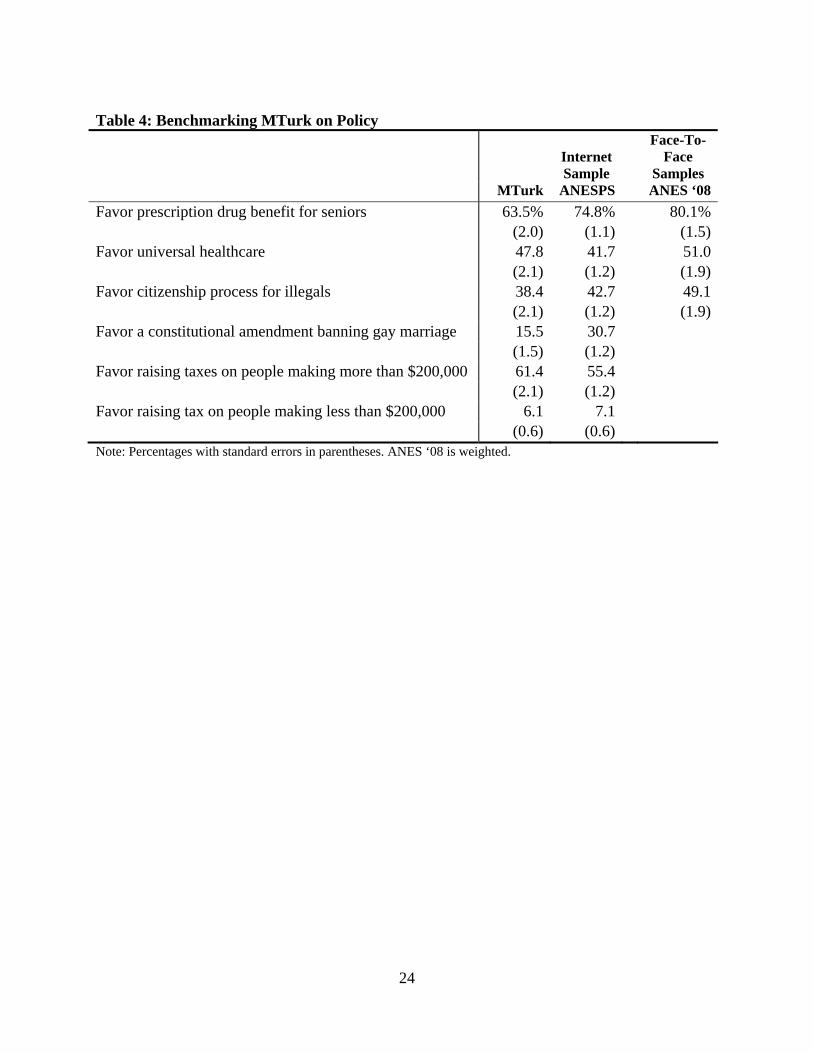
We also asked the MTurk sample several attitudinal questions that mirrored questions on
the ANESP and the ANES (Table 4). These questions asked about support for the prescription
drug benefit for seniors, universal healthcare, and a citizenship process for illegal immigrants.
The MTurk responses match the ANES well on universal health care – about 50 percent of both
samples support it – while those in the ANESP are somewhat less supportive at 42 percent.
MTurk also compares reasonably well on the question about a citizenship process for illegal
immigrants. Perhaps as a function of the age skew of the sample or a different political
environment after the political discussions surrounding the Obama health care initiative, MTurk
respondents were less supportive of the prescription drug benefit for seniors compared to the
ANES and ANESP—64 percent of MTurk respondents favored the benefit, compared to 75
percent of ANESP and 80 percent of ANES respondents.
Our MTurk survey also included three additional policy questions on the ANESP that
were not included on the 2008 ANES. These asked about support for a constitutional amendment
banning gay marriage, raising taxes on people making more than $200,000, and raising taxes on
people making less than $200,000. Compared to the ANESP, MTurk subjects express somewhat
more liberal views on all three items, with only 16 percent supporting a constitutional
amendment banning gay marriage, compared to 31 percent in the ANESP (Table 4).9 On both tax
increase items, MTurk subjects are only a few percentage points more liberal in their views.
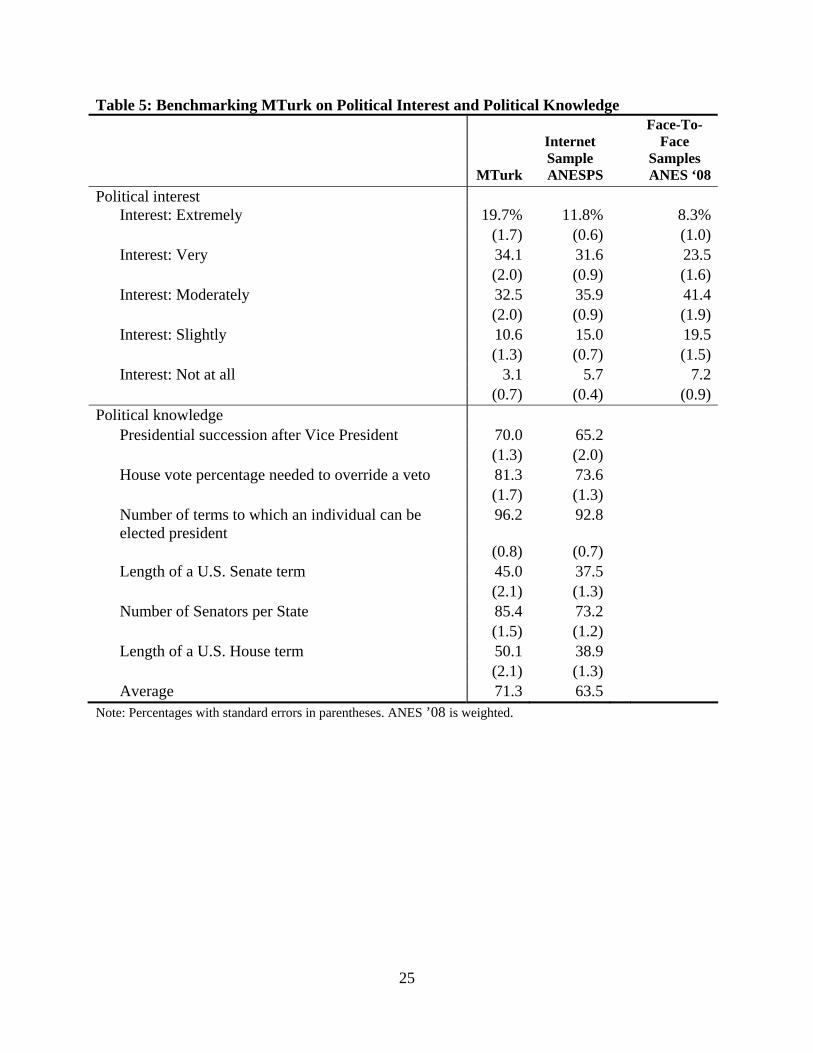
We also compared political interest and knowledge across the different samples.
Individuals likely visit MTurk to make money, not because they are interested in politics.
However, we found that MTurk respondents were somewhat more interested than ANESP 9 As with the drug benefit, this difference may be due to age or differences in political circumstances.
9
respondents, and both samples were considerably more interested than ANES respondents (Table
5). These differences may be due to advertising the survey as about “public affairs.” We also
administered a battery of six political knowledge items from the ANESP. This battery includes
questions about the line of succession for the presidency, the length of a U.S. Senate term, and
the number of federal senators per state. Just before asking these questions, we instructed
respondents to provide just their best guess and not to look up answers. For each item, we
offered four answer options in a multiple-choice format. Given this format, only about a quarter
should answer each question correctly if randomly guessing. Based on their responses, MTurk
subjects appear more knowledgeable than ANESP respondents, but the gap is not large (Table 5).
Averaging across the six items common to both surveys, MTurk subjects correctly answer about
71 percent while ANESP respondents get 64 percent right.10
All told, these comparisons reinforce the conclusion that the MTurk sample does not
perfectly match the demographic and attitudinal characteristics of the U.S. population, but also
does not present a wildly distorted view of the U.S. population either. It will often be more
diverse than convenience samples and always more diverse than student samples. If we treat the
MTurk sample as a vehicle for drawing internally valid inferences , instead of a representative
sample, the MTurk respondent pool is very attractive.
Benchmarking Via Replication of Experimental Effects
To further assess MTurk’s usefulness as a vehicle for experimental research, we also
attempted to replicate the results reported in two well-known social science experiments. The 10 To check whether MTurk subjects looked up answers to knowledge questions on the Internet, we asked two additional questions of much greater difficulty: who was the first Catholic to be a major party candidate for president and who was Woodrow Wilson's vice president. Without cheating, we expected respondents to do no better than chance. On the question about the first Catholic candidate, MTurk subjects did worse than chance with only 10 percent answering correctly (Alfred Smith, many chose an obvious but wrong answer, John F. Kennedy). About a quarter did correctly answer the vice presidential question (Thomas Marshall), what one would expect by chance. These results suggest political knowledge is not inflated much by cheating on MT.
10
first is a classic study on the sensitivity of public opinion to question wording. The second is a
framing experiment. In both cases, the experimental results found using the MTurk sample are
highly similar to those found in prior research.
Rasinski (1989) reports results from the question wording experiment study that asked
representative samples from the General Social Surveys (GSS) whether too much or too little
was being spent on either “welfare” or “assistance to the poor.” Even though these terms are
thought by policy experts to refer to the same policy, the study found important differences in
levels of support. While 20 to 25 percent of the respondents in each year said that too little was
being spent on “welfare,” 63 to 65 percent said that too little was being spent on “assistance to
the poor” (Rasinski 1989, 391). The GSS has continued to ask the spending experiment and the
gap remains similar over time, ranging from 28 percent to 50 percent, with an average difference
of 37 percent (Green and Kern 2010). When we ran the same experiment on MTurk, we found a
similarly-sized gap of 38 percentage points. Only 17 percent said too little was being spent on
“welfare,” while 55 percent said too little was being spent on “assistance to the poor.
On a separate MTurk survey, we also replicated a classic framing experiment – the
“Asian Disease Problem” reported in Tversky and Kahneman (1981). In this experiment, all
respondents were initially given the following scenario:
“Imagine that your country is preparing for the outbreak of an unusual disease, which is expected to kill 600 people. Two alternative programs to combat the disease have been proposed. Assume that the exact scientific estimate of the consequences of the programs are as follows:”
They were then randomly assigned to one of the two following conditions: Condition 1, Lives Saved: If Program A is adopted, 200 people will be saved. If Program B is adopted, there is 1/3 probability that 600 people will be saved, and 2/3 probability that no people will be saved.
11
Condition 2, Lives Lost: If Program A is adopted 400 people will die. If Program B is adopted there is 1/3 probability that nobody will die, and 2/3 probability that 600 people will die.
These scenarios are exactly the same in their description of the expected consequences of
each program, but differ in framing. In condition 1, the two reported programs were described in
terms of likelihood of positive outcomes, namely the lives saved by the programs. In condition 2,
by contrast, the two programs were described in terms of likelihood of negative outcomes – the
lives lost by the different options. Kahneman and Tversky report that when the problem was
framed in terms of “lives lost,” respondents were more likely to pick the certain choice, while
when it was frame in terms of “lives saved,” respondents were more likely to pick the risky
choice. Framing the outcomes in positive terms therefore produced a reversal of participants’
revealed preferences for the two programs compared to when it was presented in negative terms.
In the original Kahneman and Tversky experiment, 72 percent of respondents picked the certain
choice in the “lives saved” condition, as compared to 22 percent who picked the certain choice in
the “lives lost” condition. We find a similar pattern among our MTurk sample: 74 percent picked
the certain choice in the “lives saved” condition, and 38 percent selected the certain choice in the
“lives lost” condition. Combined with other replications of well-known experiments,11 these
findings provide further validation for MTurk as an experimental platform.
Do “Repeat Customers” Dominate the MTurk Subject pool?
One concern with any self-selected sample is the potential for “repeat customers.” If the
same subjects repeatedly take several surveys, there is the potential for cross-experiment stimuli
contamination (Transue et al. 2009). To assess the severity of this problem, we asked our
11 Horton, Rand, and Zeckhauser (2010), for instance, replicate several experimental findings in economics. Gabriele Paolacci’s Experimental Turk blog (http://experimentalturk.wordpress.com/) has collected reports of successful replications of several canonical experiments from a diverse group of researchers, including the Asian Disease Problem discussed in this section and other examples from Psychology and Behavioral Economics.
12
respondents how many political surveys they had taken in the last month on MTurk. The mean
was 1.7. Thirty nine percent of the respondents took no other survey, while 78 percent took two
or fewer surveys.
We also assessed the prevalence of “repeaters” by examining a broad range of
experiments run on MTurk. We gathered the unique MTurk ID number for all workers who
participated in each of six studies conducted from January 2010 to April 2010.12 The
compensation for these studies ranged from 10 cents to 50 cents, and the N ranged from 200 to
447. Across the six experiments, there were a total of 1301 unique subjects. Of these subjects, 76
percent participated in only one experiment; another 15 percent participated in two experiments.
Only one percent of the subjects participated in 5 or 6 experiments. While this set of experiments
represents only a small slice of the experiments conducted on MTurk, our findings call
illuminate broader trends. Although there are certainly a handful of respondents who participate
repeatedly in experiments, repeat subjects do not appear to be a widespread problem.
Finally, we also sought to assess whether a given respondent took our survey more than
once. When we put our study into the field, we specified that each HIT (survey) had to be
completed by a unique worker. However, an individual could potentially subvert this process by
opening multiple MTurk accounts (though this behavior would violate the terms of the MTurk
user agreement). They could then take the survey once from each account. Given the relatively
low pay rate of our studies and the availability of other paid work, we do not believe our work is
likely to encourage such behavior. Nevertheless, we did check to see if multiple responses came
from a single IP address. We found that a total of 7 IP addresses produced two responses each
(i.e., 14 of 587 responses or 2.4 percent of the total responses). This pattern is not necessarily
evidence of repeat survey taking. It could, for example, be the case that these IP addresses were 12 This set of experiments did not include the March survey described above.
13
assigned dynamically to different users at different points in time or that multiple people took the
survey from the same large company. But even if these are cases of repeat survey taking, only a
handful of responses would be contaminated, suggesting that repeat survey taking is not a large
problem in the MTurk system.13
Attention and Demand
Given their incentives, MTurk respondents may generally pay greater attention to
experimental instruments and survey questions than do other subjects. Since Requesters often
specify at least a 95 percent prior “approval rate” – that is, previous Requesters accepted 95
percent or more of the HITs submitted by an individual – respondents have an incentive to read
instructions carefully and consider their responses.
Our experiences are consistent with this expectation. In a study conducted by one of the
authors, subjects were asked to identify the political office held by a person mentioned in a story
they had just read. The format of this question was a multiple choice item with five possible
responses. On the Mechanical Turk study, 60 percent of the respondents answered the question
correctly. An identical question concerning the same article was also included on experiments
run through Polimetrix/YouGov, another high-quality internet panel, and with a sample collected
by Survey Sampling International (SSI). The correct answer rates on these platforms were
markedly lower than in the Mechanical Turk sample – 49 percent on Polimetrix/YouGov and 46
percent on SSI.
While a concern for pleasing the researcher has benefits, it may also have some costs.
MTurk respondents may pay close attention to experimental stimuli, but they may also exhibit
experimental demand characteristics to a greater degree than do respondents in other subject
13 Researchers can reject and block future work by suspected retakers, or simply exclude duplicate work from their analysis.
14
pools, divining the experimenter’s intent and behaving accordingly (Orne 1962). To avoid this
problem and the resulting external validity concerns, we believe subjects should be kept naïve
with respect to the purpose of the experiment. Demand concerns are relevant to any experimental
research, but future work needs to be done to explore if these concerns are especially serious
with respect to the MTurk respondent pool and how they are affected by recruitment and consent
text.
Practical Advice: Maximizing Recruitment, Cost Estimates, and Using MTurk to Conduct Panel Surveys
The preceding section considers the strengths and weaknesses of using MTurk to recruit
survey experiment subjects. Here we provide advice about how to maximize returns from this
apparatus, focusing on two areas of particular interest to researchers: (1) Maximizing recruitment
rates for a given task and the associated tradeoffs associated with different pay rates for
respondents, and (2) using MTurk to conduct panel surveys.
Compensation and Recruitment
MTurk workers can choose from among many possible jobs, and so descriptions of tasks
as “easy,” “fun,” or otherwise enjoyable and inviting may be likely to increase the rate at which
tasks are undertaken. MTurk workers are also being paid, and so promises of prompt payment
(including “auto-approving” non-rejected work) are also believed to increase the attractiveness
of a job. We know of no research that systematically examines differences in samples produced
when using different task descriptions.
Pay relative to length of task is also an important issue for researchers interested in using
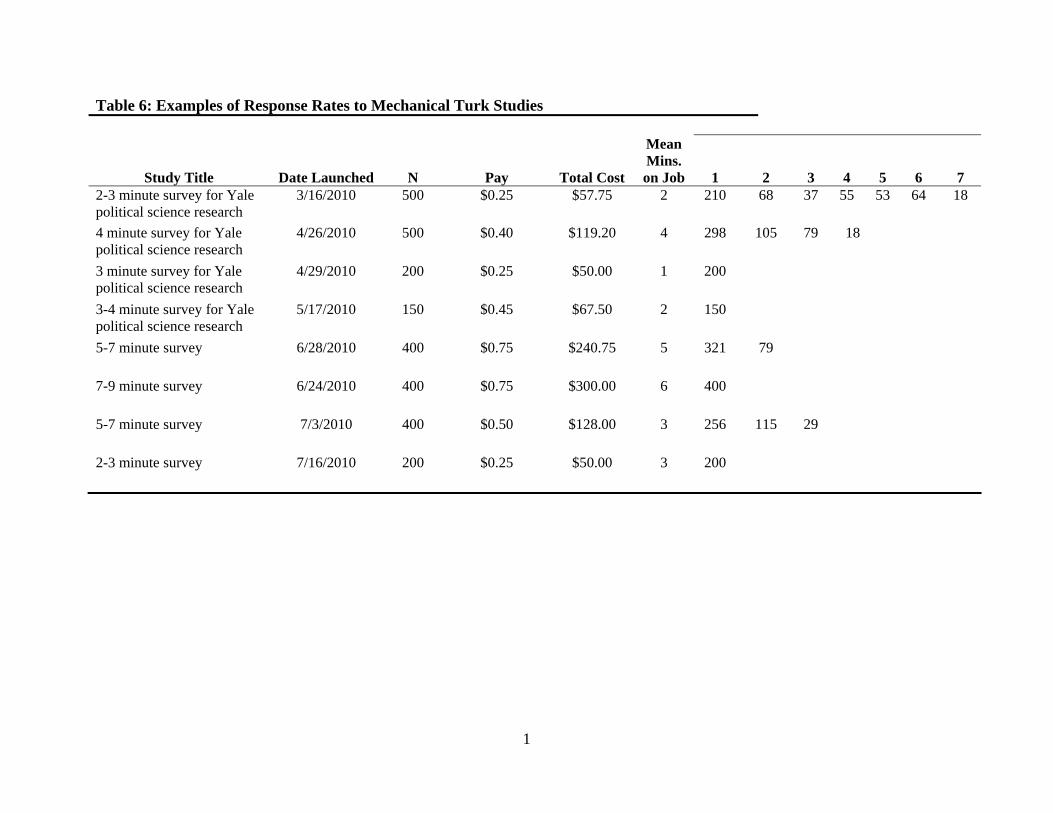
MTurk. We have tried a variety of pay rates and display examples in Table 6. Although more
15
research is needed, we offer a few tentative conclusions. Not surprisingly, paying more per task
appears to substantially speed the rate of data collection. For example, when we paid $.75 for a
5-9 minute survey, 400 respondents took the survey within 24 hours. By contrast, when we paid
only $.25 for a shorter survey (2-3 minutes), 500 respondents took the survey over seven days
(see Table 6). We have also noticed a great deal of day-to-day variation in response rates, which
may be due to variability in the attractiveness of alternative tasks.14 Pay and the quality of
responses is another important issue. Consistent with our experience, Mason and Watts (2009)
find that quality of work on MTurk is not affected by price, but that output declines when wages
are lowered.15
Relative to other experimental pools, MTurk is cheap. Even the higher pay rates we have
used on MTurk (effective hourly rates of $6.00) still are associated with a per-respondent cost of
$.50 for a 5 minute survey or $.10 per survey minute. By contrast, typical undergraduate (not
students in class) cost about $5-10 per subject and temporary agency subjects cost between $15
and $20 per subject. Private survey firms we have worked with charge at least $10 per subject for
a 5 minute survey. MTurk is, in short, extremely inexpensive relative to nearly every alternative
other than uncompensated students.
MTurk as a Tool for Panel Research
Another promise of MTurk is as an inexpensive tool for conducting panel studies. Panels
studies offer several potential advantages. For example, recent research in political science on
the rate at which treatment effects decay (Chong and Druckman 2008; Gerber, Gimpel, Green,
Shaw 2007) has led to concerns that survey experiments may overstate the effects of
14 The website mturk-tracker.com tracks daily data on MTurk. The average daily awards available to workers in 2009 and early 2010 is about $2,500, but the maximum was almost $360,000. 15 Mason and Watts assessed the quality of work in two tasks: sorting images by a timestamp in the images and solving word puzzles.
16
manipulations relative to what one would observe over longer periods of time. For this reason,
scholars are interested in mechanisms for exposing respondents to experimental manipulations
and then measuring treatment effects over the long term. Panels also allow researchers to
conduct pre-treatment surveys and then administer a treatment distant from that initial
measurement (allowing time to serve as substitute for a distracter task). Another potential use of
panel study is to screen a large population, and then to select from that initial pool of respondents
a subset who better match desired sample characteristics.
The MTurk interface provides a mechanism for performing these sorts of panel studies.
To conduct a panel survey, the researcher first fields a task as described above. Next, the
researcher posts a new task on the MTurk workspace. We recommend that this task be clearly
labeled as open only to prior research participants. Finally, the researcher notifies those workers
she wishes to perform the new task of its availability. We have written and tested a customizable
PERL script (URL) that does just this (see Appendix 2). In particular, after it is edited to work
with the researcher’s MTurk account and to describe the new task, it interacts with the
Amazon.com Application Program Interface (API) to send messages through the MTurk
interface to each invited worker. As with any other task, workers can be directed to an external
website and asked to submit a code to receive payment.
Our initial experiences with using MTurk to perform panel studies are positive. In one
study, respondents were offered 25 cents for a 3 minute follow-up survey conducted eight days
after a first-wave survey. Two reminders were sent. Within five days, 68 percent of the original
respondents took the follow up. In a second study, respondents were offered 50 cents for a three
minute follow-up survey conducted one to three months after a first-wave interview. Within
eight days, almost 60 percent of the original respondents took the follow up. Consistent with our
17
findings, Buhrmester, Kwang, and Gosling (In press) report a two-wave panel study, conducted
three weeks apart, also achieving a 60 percent response rate. They paid respondents 50 cents for
the first wave and 50 cents for the second. Analysis of our two studies suggests that the
demographic profile does not change significantly in the follow up survey. Based on these
results, we see no obstacle to oversampling demographic or other groups in follow-up surveys,
which could allow researchers to study specific groups or improve the representativeness of
samples.
Conclusion
This paper describes the potential advantages and limitations of using Amazon.com’s
Mechanical Turk platform as a subject recruitment device for experimental research. We
demonstrate that relative to other convenience samples often used in experimental research in
political science, MTurk subjects are generally more representative of the general population and
substantially less expensive to recruit. While they are less representative of the population that
higher cost internet panels or randomly sampled face-to-face surveys, they appear to respond to
canonical experimental stimuli in a manner consistent with prior research. MTurk subjects are
apparently also not an excessively sampled pool, and repeat responding appears to be a minor
concern. Put simply, despite possible self-selection concerns, the Mechanical Turk subject pool
is no worse than convenience samples used by other researchers in political science.
In addition to these benchmarking exercises, we also describe our experiences with
maximizing subject recruitment, provide cost estimates, and describe a shared tool we have
developed for conducting panel surveys using MTurk. Overall, we believe that these results
should provide researchers with a clearer understandings of the potential advantages of the
MTurk tool for conducting experiments as well as areas where caution may be in order.
18
Cites
Buhrmester, Michael D., Tracy Kwang, and Samuel D. Gosling. In press. Amazon's Mechanical
Turk: A New Source of Inexpensive, yet High-Quality, Data? Perspectives on
Psychological Science.
Chen, D. and J. Horton. 2010. “The Wages of Pay Cuts: Evidence from a Field Experiment,”
Harvard University Mimeo.
Chandler, D. and A. Kapelner. 2010. “Breaking Monotony with Meaning: Motivation in
Crowdsourcing Markets,” University of Chicago mimeo.
Chong, Dennis, and James N. Druckman. 2008. "Dynamic Public Opinion: Framing Effects over
Time."
Druckman, James N. and Cindy D, Kam. 2010. “Students as Experimental Participants: A
Defense of the ‘Narrow Data Base,’” in James N. Druckman, Donald P. Green, James H.
Kuklinski, and Arthur Lupia, eds., Handbook of Experimental Political Science.
Gerber, Alan, James G. Gimpel, Donald P. Green, and Daron R. Shaw. 2007. "The Influence of
Television and Radio Advertising on Candidate Evaluations: Results from a Large Scale
Randomized Experiment."
Green, Donald P. and Holger L. Kern. 2010. “Detecting Heterogeneous Treatment Effects in
Large-Scale Experiments Using Bayesian Additive Regression Trees.”
Gosling, S. D., S. Vazire, S. Srivastava, and O. P. John. 2004. "Should We Trust Web-Based
Studies." American Psychologist 59(2): 93-104.
Horton, John J., Rand, David G. and Zeckhauser, Richard J. 2010. “The Online Laboratory:
Conducting Experiments in a Real Labor Market.” Available at SSRN:
http://ssrn.com/abstract=1591202
19
Horton, J. 2010. “The Condition of the Turking class: Are Online Employers Fair and Honest?”
Arxivpreprint arXiv:1001.1172.
Horton, J., “Online Labor Markets,” Working paper, Harvard University, 2010.
Horton, J. and L. Chilton, “The Labor Economics of Paid Crowdsourcing,” Proceedings of the
11th ACM Conference on Electronic Commerce (forthcoming), 2010.
Kam, Cindy D., Jennifer R. Wilking, and Elizabeth J. Zechmeister. 2007. "Beyond the “Narrow
Data Base”: Another Convenience Sample for Experimental Research." Political
Behavior 29(4): 415-40.
Mason, W. and D. J. Watts. 2009. “Financial Incentives and the Performance of Crowds,” in
“Proceedings of the ACM SIGKDD Workshop on Human Computation.” 77–85.
Orne, M. T. 1962. "On the Social Psychology of the Psychological Experiment: With Particular
Reference to Demand Characteristics and Their Implications." American Psychologist
17(11): 776-83.
Rasinski, Kenneth A. 1989. “The Effect of Question Wording on Public Support for
Government Spending.” Public Opinion Quarterly. 53: 388-394.
Ross, Joel, Irani, Lily, Silberman, M. Six, Zaldivar, Andrew, and Tomlinson, Bill. 2010. "Who
are the Crowdworkers? Shifting Demographics in Amazon Mechanical Turk". In: CHI
EA 2010,, 2863-2872.
Sears, David. O. 1986. “College Students in the Laboratory: Influences of a Narrow Data Base
on Social Psychology’s View of Human Nature.” Journal of Personality and Social
Psychology, 51, 515-530.
20
Sheng, V.S., F. Provost, and P.G. Ipeirotis. 2008. “Get another label? Improving Data Quality
and Data Mining using Multiple, Noisy Labelers,” in “Proceeding of the 14th ACM
SIGKDD international conference on Knowledge discovery and data mining,” 614–622.
Snow, R.; O'Connor, B.; Jurafsky, D. & Ng, A. Y. 2008. “Cheap and fast---but is it good?:
Evaluating non-expert annotations for natural language tasks.” In 'EMNLP '08:
Proceedings of the Conference on Empirical Methods in Natural Language Processing,
Association for Computational Linguistics, Morristown, NJ, USA, 254-63.
Sorokin, A. and D. Forsyth. 2008. “Utility Data Annotation with Amazon Mechanical Turk,”
University of Illinois at Urbana-Champaign, Mimeo. 51, 61820.
Tversky, Amos, and Daniel Kahneman. 1981. "The Framing of Decisions and the Psychology of
Choice." Science 211(4481): 453-58.
21
Table 1: Benchmarking MTurk against Convenience Samples
Convenience Samples Face-To-Face
Samples Adult samples (Berinsky and Kinder 2006) CPS
ANES ‘08
Demographics MTurk
Student sample
(Kam et al 2007) Exp. 1 Exp. 2
Female 60.1% 56.7% 66.0% 57.1% 51.7% 54.0% (2.1) (1.3) (0.2) (1.3)Age (mean years) 32.3 20.3 42.5 45.3 46.0 46.6 (0.5) (8.2) (0.1) (0.5)Education (mean years) 14.9 -- 15.1 14.9 13.2 13.5 (0.1) -- (0.0) (0.1)White 83.5 42.5 81.4 72.4 81.2 79.1 (1.6) -- (0.1) (0.9)Black 4.4 12.9 22.7 11.8 12.0
(0.9) (0.1) (0.6)Party Identification
Democrat 41.9 46.1 46.5 34.2 (0.8) (1.2)Independent 23.1 20.6 17.6 28.7 (0.6) (1.2)Republican 24.9 16.3 25.8 25.9 (0.7) (1.2)None/other 10.2 17.0 10.1 11.3
(0.5) (0.8)Note: Percentages except for age and education with standard errors in parentheses. CPS and ANES ’08 are weighted.
22
Table 2: Benchmarking MTurk on Demographics Internet Sample Face-To-Face Samples MTurk ANESPS CPS ANES ‘08 Female 60.1% 57.6% 51.7% 54.0% (2.1) (0.9) (0.2) (1.3) Age (mean years) 32.3 -- 46.0 46.6 (0.5) -- (0.1) (0.5) Education (mean years) 14.9 14.5 13.2 13.5 (0.1) (0.1) (0.0) (0.1) Race
White 83.5 84.3 81.2 79.1 (1.6) (0.7) (0.1) (0.9) Black 4.4 9.0 11.8 12.0 (0.9) (0.5) (0.1) (0.6) Hispanic 6.7 5.5 13.7 9.1 (1.1) (0.4) (0.1) (0.5)
Marital Status Married 39.0 63.6 55.7 50.1 (2.1) (0.9) (0.2) (1.3) Divorced 7.1 13.6 10.2 12.9 (1.1) (0.7) (0.1) (0.8) Separated 2.5 1.5 2.1 2.9 (0.7) (0.2) (0.1) (0.4) Never married 50.6 15.9 25.7 24.7 (2.1) (0.7) (0.2) (1.1) Widowed 0.7 5.4 6.3 7.8 (0.4) (0.4) (0.1) (0.6)
Housing Status Rent 52.7 14.3 32.4 (2.3) (0.7) (1.2) Own home 47.3 80.8 66.1
(2.3) (0.8) (1.2) Religion
None 41.8 13.3 20.1 (2.1) (1.0) (1.1) Protestant 20.7 36.4 30.6 (1.7) (1.4) (1.2) Catholic 16.5 24.2 19.1 (1.6) (1.3) (1.0) Jewish 4.4 3.8 1.3 (0.9) (0.6) (0.3) Other 16.5 22.3 28.9 (1.6) (1.2) (1.1)
Note: Percentages except for age and education with standard errors in parentheses. CPS and ANES ‘08 are weighted. ANESP redacts age.
23
Table 3: Benchmarking MTurk on Voter Turnout, Party, and Ideology Internet
SampleFace-To-Face Samples
MTurk ANESPS CPS ANES ‘08 Registration and Turnout
Registered 78.7% 92.0% 82.7% 77.7%
(1.7) (0.6) (0.2) (1.4)
Vote Turnout 88.6 89.5 74.5 77.6
(1.5) (0.6) (0.2) (1.1)
Party Identification
Strong Democrat 17.8 20.4 20.3 (1.7) (1.0) (1.0) Weak Democrat 26.8 14.9 16.4 (2.0) (0.9) (1.0) Lean Democrat 7.7 10.7 16.1 (1.2) (0.8) (1.0) Independent 12.4 12.1 8.5 (1.5) (0.8) (0.8) Lean Republican 17.0 9.2 10.9 (1.7) (0.7) (0.9) Weak Republican 9.1 15.5 13.7 (1.3) (0.9) (1.0) Strong Republican 9.3 17.2 14.1
(1.3) (0.9) (1.0) Ideology
Very liberal 26.2 7.2 3.7 (1.9) (0.6) (0.6) Somewhat liberal 21.7 14.8 13.0. (1.8) (0.9) (1.0) Slightly liberal 5.1 11.2 11.8 (0.9) (0.8) (1.0) Moderate 17.5 22.0 29.1 (1.6) (1.0) (1.4) Slightly conservative 7.9 8.7 16.0 (1.1) (0.7) (1.1) Somewhat conservative 6.7 23.9 22.4 (1.1) (1.1) (1.3) Very conservative 15.0 12.3 4.1
(1.5) (0.8) (0.6) Note: Percentages with standard errors in parentheses. CPS and ANES ‘08 are weighted.
24
Table 4: Benchmarking MTurk on Policy
Internet Sample
Face-To-Face
Samples MTurk ANESPS ANES ‘08Favor prescription drug benefit for seniors 63.5% 74.8% 80.1% (2.0) (1.1) (1.5)Favor universal healthcare 47.8 41.7 51.0 (2.1) (1.2) (1.9)Favor citizenship process for illegals 38.4 42.7 49.1 (2.1) (1.2) (1.9)Favor a constitutional amendment banning gay marriage 15.5 30.7 (1.5) (1.2) Favor raising taxes on people making more than $200,000 61.4 55.4 (2.1) (1.2) Favor raising tax on people making less than $200,000 6.1 7.1 (0.6) (0.6) Note: Percentages with standard errors in parentheses. ANES ‘08 is weighted.
25
Table 5: Benchmarking MTurk on Political Interest and Political Knowledge
Internet Sample
Face-To-Face
Samples MTurk ANESPS ANES ‘08Political interest
Interest: Extremely 19.7% 11.8% 8.3% (1.7) (0.6) (1.0)Interest: Very 34.1 31.6 23.5 (2.0) (0.9) (1.6)Interest: Moderately 32.5 35.9 41.4 (2.0) (0.9) (1.9) Interest: Slightly 10.6 15.0 19.5 (1.3) (0.7) (1.5)Interest: Not at all 3.1 5.7 7.2
(0.7) (0.4) (0.9)Political knowledge
Presidential succession after Vice President 70.0 65.2 (1.3) (2.0) House vote percentage needed to override a veto 81.3 73.6 (1.7) (1.3) Number of terms to which an individual can be elected president
96.2 92.8
(0.8) (0.7) Length of a U.S. Senate term 45.0 37.5 (2.1) (1.3) Number of Senators per State 85.4 73.2 (1.5) (1.2) Length of a U.S. House term 50.1 38.9
(2.1) (1.3) Average 71.3 63.5 Note: Percentages with standard errors in parentheses. ANES ’08 is weighted.
1
Table 6: Examples of Response Rates to Mechanical Turk Studies
Study Title Date Launched N Pay Total Cost
Mean Mins. on Job 1 2 3 4 5 6
7 2-3 minute survey for Yale political science research
3/16/2010 500 $0.25 $57.75 2 210 68 37 55 53 64 18
4 minute survey for Yale political science research
4/26/2010 500 $0.40 $119.20 4 298 105 79 18
3 minute survey for Yale political science research
4/29/2010 200 $0.25 $50.00 1 200
3-4 minute survey for Yale political science research
5/17/2010 150 $0.45 $67.50 2 150
5-7 minute survey 6/28/2010 400 $0.75 $240.75 5 321 79
7-9 minute survey 6/24/2010 400 $0.75 $300.00 6 400
5-7 minute survey 7/3/2010 400 $0.50 $128.00 3 256 115 29
2-3 minute survey 7/16/2010 200 $0.25 $50.00 3 200