Embed Size (px)
Citation preview
Construction and Building Materials 26 (2012) 638–654
Contents lists available at ScienceDirect
Construction and Building Materials
journal homepage: www.elsevier .com/locate /conbui ldmat
Mechanical properties of foamed concrete exposed to high temperatures
Md Azree Othuman Mydin a,⇑, Y.C. Wang b
a School of Housing, Building and Planning, Universiti Sains Malaysia, 11800 Penang, Malaysiab School of Mechanical, Aerospace and Civil Engineering, University of Manchester, Manchester M60 1QD, UK
a r t i c l e i n f o
Article history:Received 12 November 2010Received in revised form 5 June 2011Accepted 18 June 2011Available online 23 July 2011
Keywords:Foamed concreteMechanical propertiesHigh temperaturesElevated temperaturesConcrete modelStrength prediction modelStress–strainConcrete in fire
0950-0618/$ - see front matter � 2011 Elsevier Ltd. Adoi:10.1016/j.conbuildmat.2011.06.067
⇑ Corresponding author. Tel.: +60 4 6532813.E-mail address: [email protected] (M.A.O. M
a b s t r a c t
This paper reports the results of an experimental and analytical study to investigate the mechanical prop-erties of unstressed foamed concrete exposed to high temperatures. Two densities of foamed concrete,650 and 1000 kg/m3, were made and tested with additional tests being performed on densities of 800,1200 and 1400 kg/m3 for additional data. The experimental results consistently demonstrated that theloss in stiffness for foamed concrete at elevated temperatures occurs predominantly after about 90 �C,regardless of density as water expands and evaporates from the porous body. From a comparison ofthe experimental results of this research with a number of predictive models for normal strength con-crete, this research has found that the mechanical properties of foamed concrete can be predicted usingthe mechanical property models for normal weight concrete given that the mechanical properties offoamed concrete come from Portland Cement CEM1.
� 2011 Elsevier Ltd. All rights reserved.
1. Introduction
Foam concrete is a lightweight material consisting of Portlandcement paste or cement filler matrix (mortar) with a uniformly dis-tributed pore structure produced by mechanically introducing airin the form of small bubbles having a total volume of at least20%. Foamed concrete can be designed to have any density in therange of 400–1600 kg/m3. It has a number of attractive character-istics such as good thermal and acoustic insulation, self-flowingand easy to produce. Although foamed concrete has low mechani-cal properties compared to normal strength concrete, it may beused as partition or load bearing wall in low-rise residential con-struction. Before it can be considered for use as a load bearingmaterial in the building industry, it is necessary to acquire reliableinformation on mechanical properties of foamed concrete at ambi-ent and elevated temperatures for quantification of its fire resis-tance performance.
Foamed concrete may be considered a three phase materialwith cement paste, aggregate (fine sand) and air voids. Conse-quently, the degradation mechanisms of foamed concrete aremainly caused by deprivation of the cement paste. When exposedto high temperatures, the chemical composition and physicalstructure of foamed concrete change significantly due to changesin the cement paste.
ll rights reserved.
ydin).
The degradation mechanisms of foamed concrete upon expo-sure to elevated temperatures include chemical degradation andmechanical deterioration where each mechanism is dominantwithin a specific temperature range. Chemical degradation occurswhen the chemically bound water is released from the cementpaste. The dehydration process in the cement paste becomes sig-nificant at temperatures above about 110 �C [1] and diminishesthe calcium silicate hydrate (CSH) links which provide the primaryload-bearing formation in the hydrated cement. Furthermore, dueto low permeability of the cement paste, internal water pressure isbuilt up during dehydration of the hydrated CSH, which increasesinternal stresses and induce microcracks in the material fromabout 300 �C, resulting in decreased strength and stiffness offoamed concrete [2,3]. At higher temperatures around 530 �C, cal-cium hydroxide (Ca(OH)2) dissociates, resulting in the shrinkage offoamed concrete. If the hot foamed concrete is exposed to water, asin fire fighting, CaO in foamed concrete turns into Ca(OH)2 to causecracking and destruction of foamed concrete. However, it is stillextremely difficult to accurately predict these mechanisms andexperimental investigation remains essential.
Thus, the main objective of this work is to provide experimentaldata on the mechanical properties of foamed concrete at elevatedtemperatures. Therefore only a constant cement–sand ratio of2:1 and water–cement ratio of 0.5 will be used for all batches offoamed concrete samples made for this research. Tests were car-ried out at temperatures at about 20 (ambient temperature), 100,200, 300, 400, 500, and 600 �C for ease of observation of the testresults. Extensive compressive and bending strength tests were
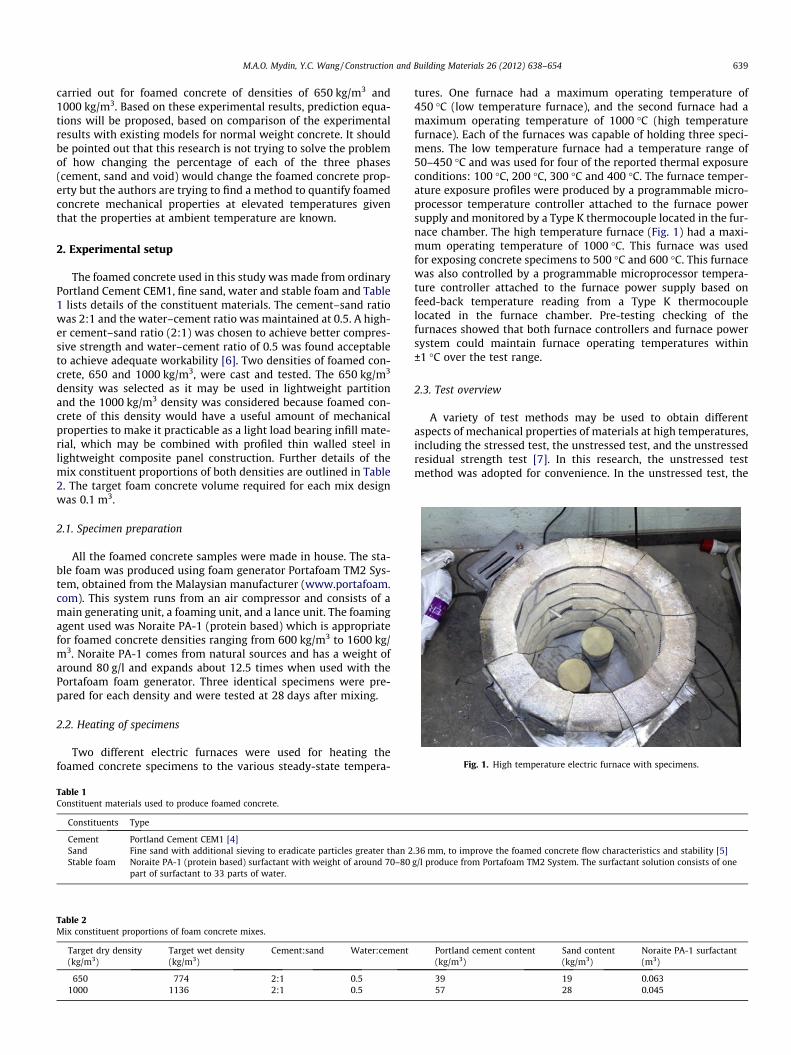
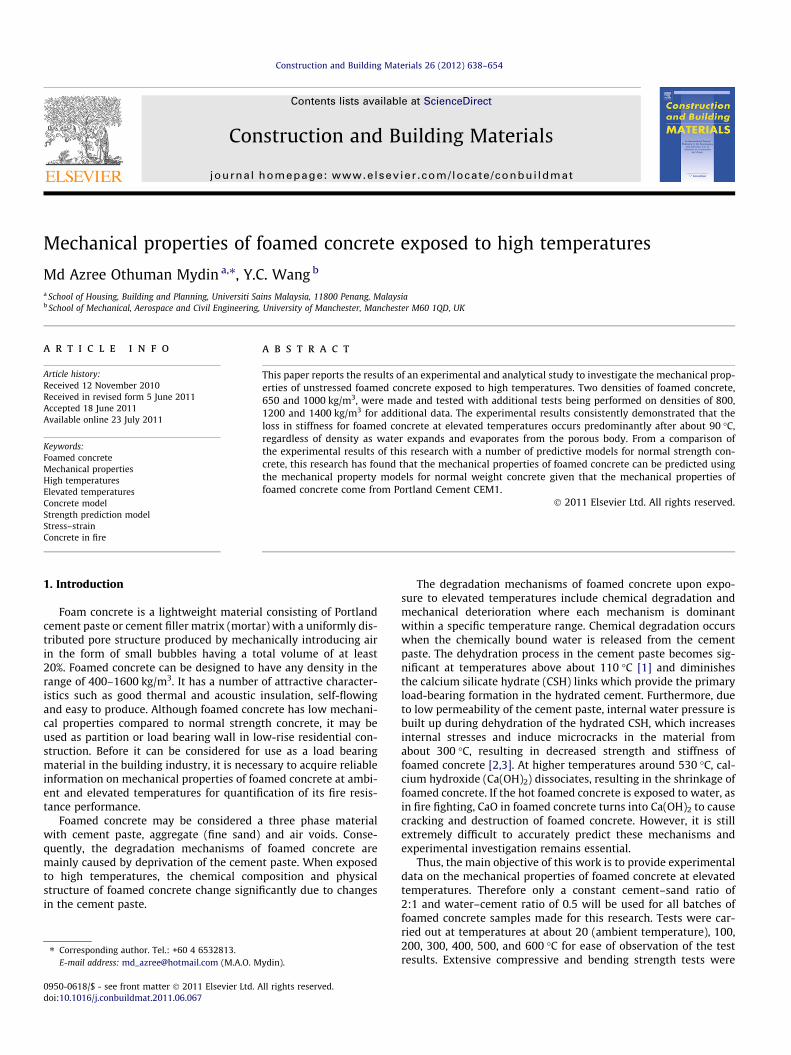
Fig. 1. High temperature electric furnace with specimens.
M.A.O. Mydin, Y.C. Wang / Construction and Building Materials 26 (2012) 638–654 639
carried out for foamed concrete of densities of 650 kg/m3 and1000 kg/m3. Based on these experimental results, prediction equa-tions will be proposed, based on comparison of the experimentalresults with existing models for normal weight concrete. It shouldbe pointed out that this research is not trying to solve the problemof how changing the percentage of each of the three phases(cement, sand and void) would change the foamed concrete prop-erty but the authors are trying to find a method to quantify foamedconcrete mechanical properties at elevated temperatures giventhat the properties at ambient temperature are known.
2. Experimental setup
The foamed concrete used in this study was made from ordinaryPortland Cement CEM1, fine sand, water and stable foam and Table1 lists details of the constituent materials. The cement–sand ratiowas 2:1 and the water–cement ratio was maintained at 0.5. A high-er cement–sand ratio (2:1) was chosen to achieve better compres-sive strength and water–cement ratio of 0.5 was found acceptableto achieve adequate workability [6]. Two densities of foamed con-crete, 650 and 1000 kg/m3, were cast and tested. The 650 kg/m3
density was selected as it may be used in lightweight partitionand the 1000 kg/m3 density was considered because foamed con-crete of this density would have a useful amount of mechanicalproperties to make it practicable as a light load bearing infill mate-rial, which may be combined with profiled thin walled steel inlightweight composite panel construction. Further details of themix constituent proportions of both densities are outlined in Table2. The target foam concrete volume required for each mix designwas 0.1 m3.
2.1. Specimen preparation
All the foamed concrete samples were made in house. The sta-ble foam was produced using foam generator Portafoam TM2 Sys-tem, obtained from the Malaysian manufacturer (www.portafoam.com). This system runs from an air compressor and consists of amain generating unit, a foaming unit, and a lance unit. The foamingagent used was Noraite PA-1 (protein based) which is appropriatefor foamed concrete densities ranging from 600 kg/m3 to 1600 kg/m3. Noraite PA-1 comes from natural sources and has a weight ofaround 80 g/l and expands about 12.5 times when used with thePortafoam foam generator. Three identical specimens were pre-pared for each density and were tested at 28 days after mixing.
2.2. Heating of specimens
Two different electric furnaces were used for heating thefoamed concrete specimens to the various steady-state tempera-
Table 1Constituent materials used to produce foamed concrete.
Constituents Type
Cement Portland Cement CEM1 [4]Sand Fine sand with additional sieving to eradicate particles greater than 2Stable foam Noraite PA-1 (protein based) surfactant with weight of around 70–80
part of surfactant to 33 parts of water.
Table 2Mix constituent proportions of foam concrete mixes.
Target dry density(kg/m3)
Target wet density(kg/m3)
Cement:sand Water:cement
650 774 2:1 0.51000 1136 2:1 0.5
tures. One furnace had a maximum operating temperature of450 �C (low temperature furnace), and the second furnace had amaximum operating temperature of 1000 �C (high temperaturefurnace). Each of the furnaces was capable of holding three speci-mens. The low temperature furnace had a temperature range of50–450 �C and was used for four of the reported thermal exposureconditions: 100 �C, 200 �C, 300 �C and 400 �C. The furnace temper-ature exposure profiles were produced by a programmable micro-processor temperature controller attached to the furnace powersupply and monitored by a Type K thermocouple located in the fur-nace chamber. The high temperature furnace (Fig. 1) had a maxi-mum operating temperature of 1000 �C. This furnace was usedfor exposing concrete specimens to 500 �C and 600 �C. This furnacewas also controlled by a programmable microprocessor tempera-ture controller attached to the furnace power supply based onfeed-back temperature reading from a Type K thermocouplelocated in the furnace chamber. Pre-testing checking of thefurnaces showed that both furnace controllers and furnace powersystem could maintain furnace operating temperatures within±1 �C over the test range.
2.3. Test overview
A variety of test methods may be used to obtain differentaspects of mechanical properties of materials at high temperatures,including the stressed test, the unstressed test, and the unstressedresidual strength test [7]. In this research, the unstressed testmethod was adopted for convenience. In the unstressed test, the
.36 mm, to improve the foamed concrete flow characteristics and stability [5]g/l produce from Portafoam TM2 System. The surfactant solution consists of one
Portland cement content(kg/m3)
Sand content(kg/m3)
Noraite PA-1 surfactant(m3)
39 19 0.06357 28 0.045
197
198
199
200
201
202
203
0 10 20 30 40 50 60 70 80Time (second)
Tem
pera
ture
(°C
)
Specimen 1
Specimen 2
Specimen 3
Fig. 3. Temperature change during test of specimens of 1000 kg/m3 density attarget temperature of 200 �C.
640 M.A.O. Mydin, Y.C. Wang / Construction and Building Materials 26 (2012) 638–654
sample was heated, without preload, at a steady rate to the prede-termined temperature. While maintaining the target temperature,load was applied at a prescribed rate until sample failure. Becausethe temperature is unchanged, the test is also referred to as steadystate test, as opposed to transient test in which the specimen tem-perature changes with time.
2.4. Compression test setup
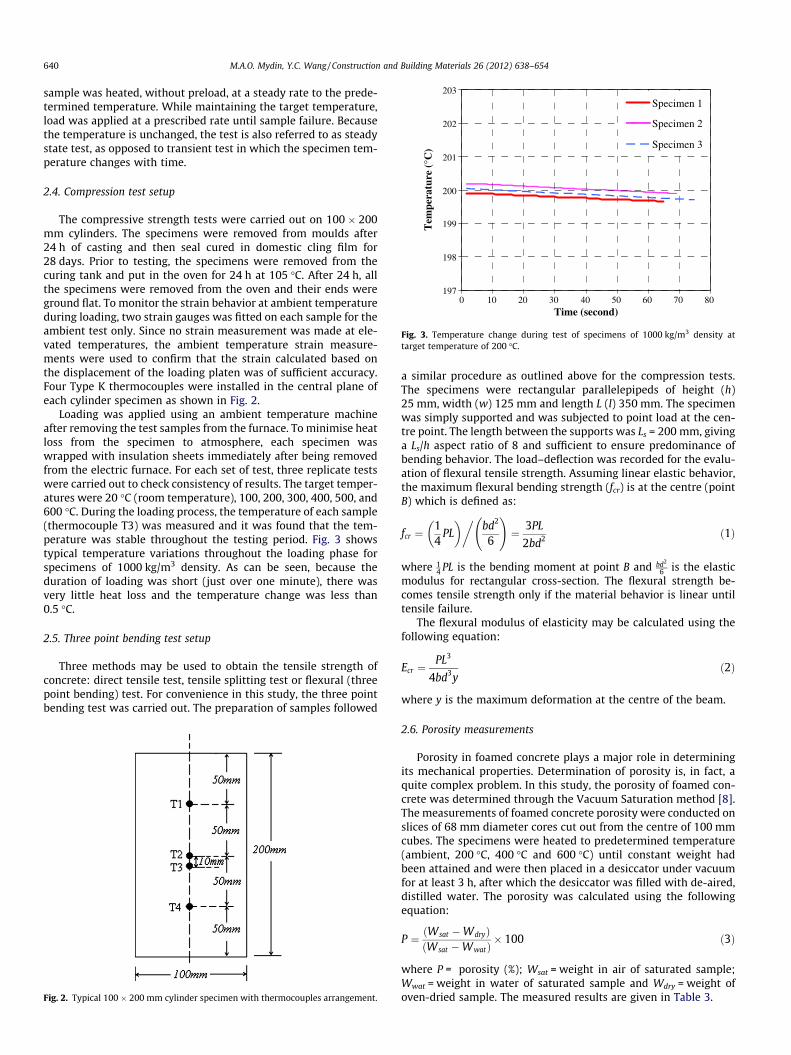
The compressive strength tests were carried out on 100 � 200mm cylinders. The specimens were removed from moulds after24 h of casting and then seal cured in domestic cling film for28 days. Prior to testing, the specimens were removed from thecuring tank and put in the oven for 24 h at 105 �C. After 24 h, allthe specimens were removed from the oven and their ends wereground flat. To monitor the strain behavior at ambient temperatureduring loading, two strain gauges was fitted on each sample for theambient test only. Since no strain measurement was made at ele-vated temperatures, the ambient temperature strain measure-ments were used to confirm that the strain calculated based onthe displacement of the loading platen was of sufficient accuracy.Four Type K thermocouples were installed in the central plane ofeach cylinder specimen as shown in Fig. 2.
Loading was applied using an ambient temperature machineafter removing the test samples from the furnace. To minimise heatloss from the specimen to atmosphere, each specimen waswrapped with insulation sheets immediately after being removedfrom the electric furnace. For each set of test, three replicate testswere carried out to check consistency of results. The target temper-atures were 20 �C (room temperature), 100, 200, 300, 400, 500, and600 �C. During the loading process, the temperature of each sample(thermocouple T3) was measured and it was found that the tem-perature was stable throughout the testing period. Fig. 3 showstypical temperature variations throughout the loading phase forspecimens of 1000 kg/m3 density. As can be seen, because theduration of loading was short (just over one minute), there wasvery little heat loss and the temperature change was less than0.5 �C.
2.5. Three point bending test setup
Three methods may be used to obtain the tensile strength ofconcrete: direct tensile test, tensile splitting test or flexural (threepoint bending) test. For convenience in this study, the three pointbending test was carried out. The preparation of samples followed
Fig. 2. Typical 100 � 200 mm cylinder specimen with thermocouples arrangement.
a similar procedure as outlined above for the compression tests.The specimens were rectangular parallelepipeds of height (h)25 mm, width (w) 125 mm and length L (l) 350 mm. The specimenwas simply supported and was subjected to point load at the cen-tre point. The length between the supports was Ls = 200 mm, givinga Ls/h aspect ratio of 8 and sufficient to ensure predominance ofbending behavior. The load–deflection was recorded for the evalu-ation of flexural tensile strength. Assuming linear elastic behavior,the maximum flexural bending strength (fcr) is at the centre (pointB) which is defined as:
fcr ¼14
PL� ��
bd2
6
!¼ 3PL
2bd2 ð1Þ
where 14 PL is the bending moment at point B and bd2
6 is the elasticmodulus for rectangular cross-section. The flexural strength be-comes tensile strength only if the material behavior is linear untiltensile failure.
The flexural modulus of elasticity may be calculated using thefollowing equation:
Ecr ¼PL3
4bd3yð2Þ
where y is the maximum deformation at the centre of the beam.
2.6. Porosity measurements
Porosity in foamed concrete plays a major role in determiningits mechanical properties. Determination of porosity is, in fact, aquite complex problem. In this study, the porosity of foamed con-crete was determined through the Vacuum Saturation method [8].The measurements of foamed concrete porosity were conducted onslices of 68 mm diameter cores cut out from the centre of 100 mmcubes. The specimens were heated to predetermined temperature(ambient, 200 �C, 400 �C and 600 �C) until constant weight hadbeen attained and were then placed in a desiccator under vacuumfor at least 3 h, after which the desiccator was filled with de-aired,distilled water. The porosity was calculated using the followingequation:
P ¼ ðWsat �WdryÞðWsat �WwatÞ
� 100 ð3Þ
where P = porosity (%); Wsat = weight in air of saturated sample;Wwat = weight in water of saturated sample and Wdry = weight ofoven-dried sample. The measured results are given in Table 3.
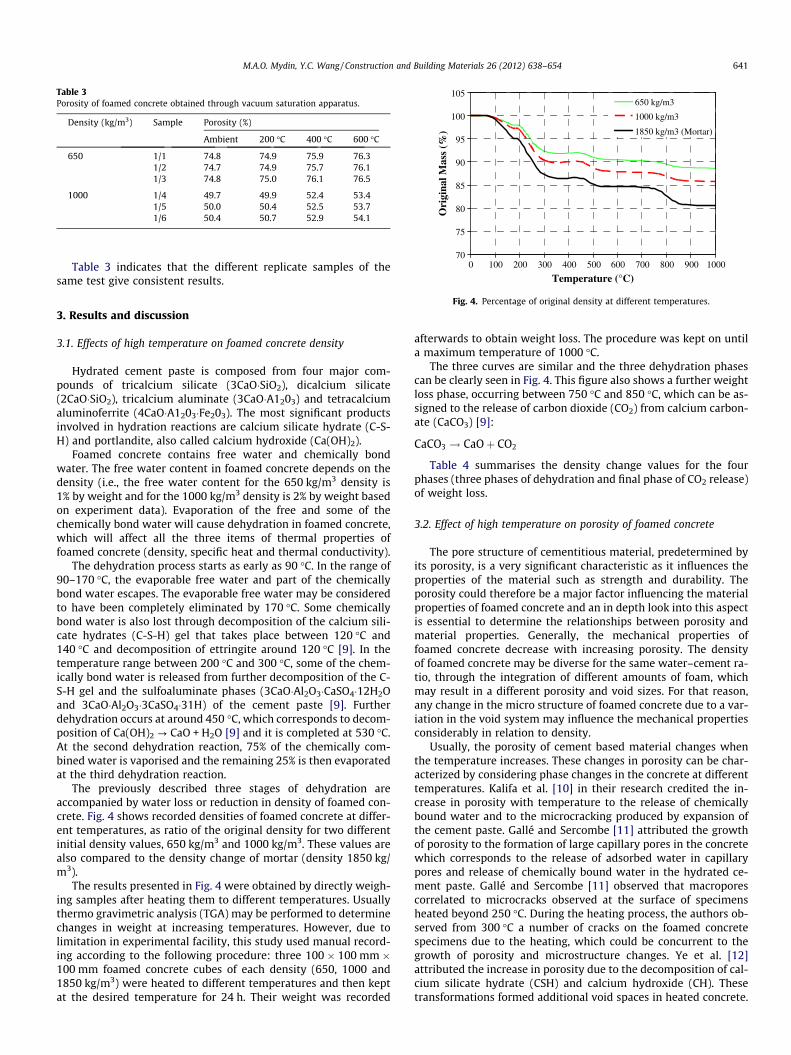
Table 3Porosity of foamed concrete obtained through vacuum saturation apparatus.
Density (kg/m3) Sample Porosity (%)
Ambient 200 �C 400 �C 600 �C
650 1/1 74.8 74.9 75.9 76.31/2 74.7 74.9 75.7 76.11/3 74.8 75.0 76.1 76.5
1000 1/4 49.7 49.9 52.4 53.41/5 50.0 50.4 52.5 53.71/6 50.4 50.7 52.9 54.1
70
75
80
85
90
95
100
105
0 100 200 300 400 500 600 700 800 900 1000
Temperature (°C)
Ori
gina
l Mas
s (%
)
650 kg/m3
1000 kg/m3
1850 kg/m3 (Mortar)
M.A.O. Mydin, Y.C. Wang / Construction and Building Materials 26 (2012) 638–654 641
Table 3 indicates that the different replicate samples of thesame test give consistent results.
Fig. 4. Percentage of original density at different temperatures.
3. Results and discussion
3.1. Effects of high temperature on foamed concrete density
Hydrated cement paste is composed from four major com-pounds of tricalcium silicate (3CaO�SiO2), dicalcium silicate(2CaO�SiO2), tricalcium aluminate (3CaO�A1203) and tetracalciumaluminoferrite (4CaO�A1203�Fe203). The most significant productsinvolved in hydration reactions are calcium silicate hydrate (C-S-H) and portlandite, also called calcium hydroxide (Ca(OH)2).
Foamed concrete contains free water and chemically bondwater. The free water content in foamed concrete depends on thedensity (i.e., the free water content for the 650 kg/m3 density is1% by weight and for the 1000 kg/m3 density is 2% by weight basedon experiment data). Evaporation of the free and some of thechemically bond water will cause dehydration in foamed concrete,which will affect all the three items of thermal properties offoamed concrete (density, specific heat and thermal conductivity).
The dehydration process starts as early as 90 �C. In the range of90–170 �C, the evaporable free water and part of the chemicallybond water escapes. The evaporable free water may be consideredto have been completely eliminated by 170 �C. Some chemicallybond water is also lost through decomposition of the calcium sili-cate hydrates (C-S-H) gel that takes place between 120 �C and140 �C and decomposition of ettringite around 120 �C [9]. In thetemperature range between 200 �C and 300 �C, some of the chem-ically bond water is released from further decomposition of the C-S-H gel and the sulfoaluminate phases (3CaO�Al2O3�CaSO4�12H2Oand 3CaO�Al2O3�3CaSO4�31H) of the cement paste [9]. Furtherdehydration occurs at around 450 �C, which corresponds to decom-position of Ca(OH)2 ? CaO + H2O [9] and it is completed at 530 �C.At the second dehydration reaction, 75% of the chemically com-bined water is vaporised and the remaining 25% is then evaporatedat the third dehydration reaction.
The previously described three stages of dehydration areaccompanied by water loss or reduction in density of foamed con-crete. Fig. 4 shows recorded densities of foamed concrete at differ-ent temperatures, as ratio of the original density for two differentinitial density values, 650 kg/m3 and 1000 kg/m3. These values arealso compared to the density change of mortar (density 1850 kg/m3).
The results presented in Fig. 4 were obtained by directly weigh-ing samples after heating them to different temperatures. Usuallythermo gravimetric analysis (TGA) may be performed to determinechanges in weight at increasing temperatures. However, due tolimitation in experimental facility, this study used manual record-ing according to the following procedure: three 100 � 100 mm �100 mm foamed concrete cubes of each density (650, 1000 and1850 kg/m3) were heated to different temperatures and then keptat the desired temperature for 24 h. Their weight was recorded
afterwards to obtain weight loss. The procedure was kept on untila maximum temperature of 1000 �C.
The three curves are similar and the three dehydration phasescan be clearly seen in Fig. 4. This figure also shows a further weightloss phase, occurring between 750 �C and 850 �C, which can be as-signed to the release of carbon dioxide (CO2) from calcium carbon-ate (CaCO3) [9]:
CaCO3 ! CaOþ CO2
Table 4 summarises the density change values for the fourphases (three phases of dehydration and final phase of CO2 release)of weight loss.
3.2. Effect of high temperature on porosity of foamed concrete
The pore structure of cementitious material, predetermined byits porosity, is a very significant characteristic as it influences theproperties of the material such as strength and durability. Theporosity could therefore be a major factor influencing the materialproperties of foamed concrete and an in depth look into this aspectis essential to determine the relationships between porosity andmaterial properties. Generally, the mechanical properties offoamed concrete decrease with increasing porosity. The densityof foamed concrete may be diverse for the same water–cement ra-tio, through the integration of different amounts of foam, whichmay result in a different porosity and void sizes. For that reason,any change in the micro structure of foamed concrete due to a var-iation in the void system may influence the mechanical propertiesconsiderably in relation to density.
Usually, the porosity of cement based material changes whenthe temperature increases. These changes in porosity can be char-acterized by considering phase changes in the concrete at differenttemperatures. Kalifa et al. [10] in their research credited the in-crease in porosity with temperature to the release of chemicallybound water and to the microcracking produced by expansion ofthe cement paste. Gallé and Sercombe [11] attributed the growthof porosity to the formation of large capillary pores in the concretewhich corresponds to the release of adsorbed water in capillarypores and release of chemically bound water in the hydrated ce-ment paste. Gallé and Sercombe [11] observed that macroporescorrelated to microcracks observed at the surface of specimensheated beyond 250 �C. During the heating process, the authors ob-served from 300 �C a number of cracks on the foamed concretespecimens due to the heating, which could be concurrent to thegrowth of porosity and microstructure changes. Ye et al. [12]attributed the increase in porosity due to the decomposition of cal-cium silicate hydrate (CSH) and calcium hydroxide (CH). Thesetransformations formed additional void spaces in heated concrete.
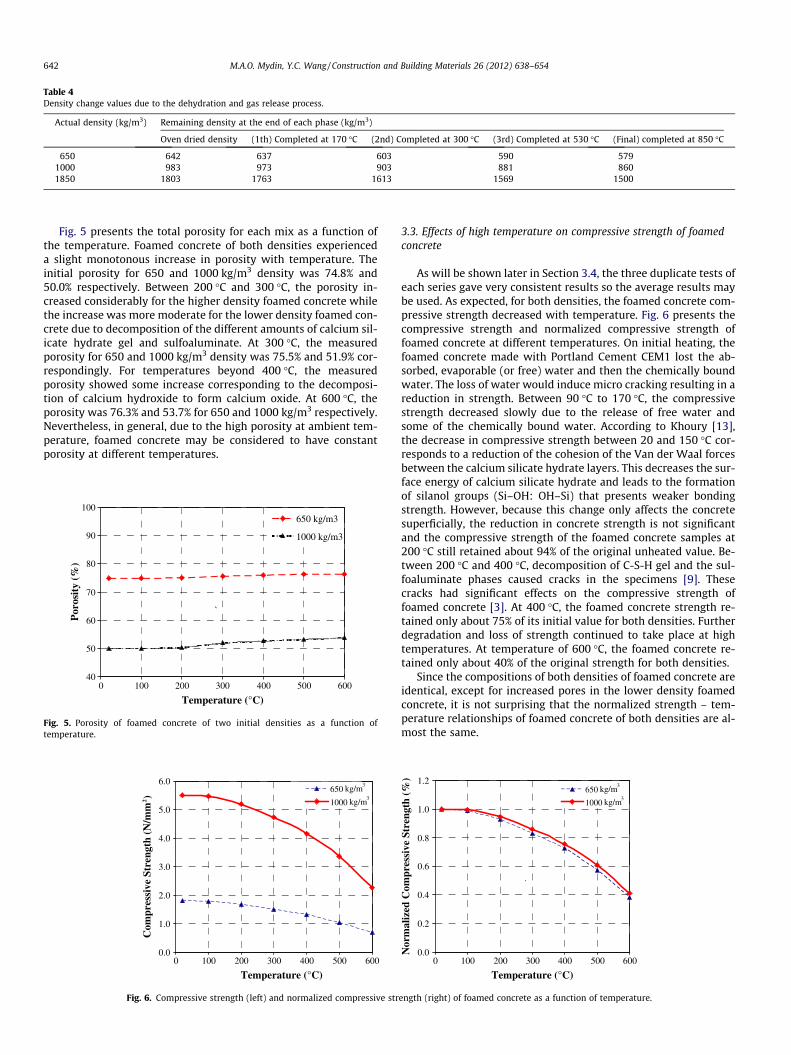
Table 4Density change values due to the dehydration and gas release process.
Actual density (kg/m3) Remaining density at the end of each phase (kg/m3)
Oven dried density (1th) Completed at 170 �C (2nd) Completed at 300 �C (3rd) Completed at 530 �C (Final) completed at 850 �C
650 642 637 603 590 5791000 983 973 903 881 8601850 1803 1763 1613 1569 1500
642 M.A.O. Mydin, Y.C. Wang / Construction and Building Materials 26 (2012) 638–654
Fig. 5 presents the total porosity for each mix as a function ofthe temperature. Foamed concrete of both densities experienceda slight monotonous increase in porosity with temperature. Theinitial porosity for 650 and 1000 kg/m3 density was 74.8% and50.0% respectively. Between 200 �C and 300 �C, the porosity in-creased considerably for the higher density foamed concrete whilethe increase was more moderate for the lower density foamed con-crete due to decomposition of the different amounts of calcium sil-icate hydrate gel and sulfoaluminate. At 300 �C, the measuredporosity for 650 and 1000 kg/m3 density was 75.5% and 51.9% cor-respondingly. For temperatures beyond 400 �C, the measuredporosity showed some increase corresponding to the decomposi-tion of calcium hydroxide to form calcium oxide. At 600 �C, theporosity was 76.3% and 53.7% for 650 and 1000 kg/m3 respectively.Nevertheless, in general, due to the high porosity at ambient tem-perature, foamed concrete may be considered to have constantporosity at different temperatures.
40
50
60
70
80
90
100
0 100 200 300 400 500 600
Temperature (°C)
Por
osit
y (%
)
650 kg/m3
1000 kg/m3
`
Fig. 5. Porosity of foamed concrete of two initial densities as a function oftemperature.
0.0
1.0
2.0
3.0
4.0
5.0
6.0
0 100 200 300 400 500 600
Temperature (°C)
Com
pres
sive
Str
engt
h (N
/mm
2)
650
1000
kg/m3
kg/m3
Fig. 6. Compressive strength (left) and normalized compressive str
3.3. Effects of high temperature on compressive strength of foamedconcrete
As will be shown later in Section 3.4, the three duplicate tests ofeach series gave very consistent results so the average results maybe used. As expected, for both densities, the foamed concrete com-pressive strength decreased with temperature. Fig. 6 presents thecompressive strength and normalized compressive strength offoamed concrete at different temperatures. On initial heating, thefoamed concrete made with Portland Cement CEM1 lost the ab-sorbed, evaporable (or free) water and then the chemically boundwater. The loss of water would induce micro cracking resulting in areduction in strength. Between 90 �C to 170 �C, the compressivestrength decreased slowly due to the release of free water andsome of the chemically bound water. According to Khoury [13],the decrease in compressive strength between 20 and 150 �C cor-responds to a reduction of the cohesion of the Van der Waal forcesbetween the calcium silicate hydrate layers. This decreases the sur-face energy of calcium silicate hydrate and leads to the formationof silanol groups (Si–OH: OH–Si) that presents weaker bondingstrength. However, because this change only affects the concretesuperficially, the reduction in concrete strength is not significantand the compressive strength of the foamed concrete samples at200 �C still retained about 94% of the original unheated value. Be-tween 200 �C and 400 �C, decomposition of C-S-H gel and the sul-foaluminate phases caused cracks in the specimens [9]. Thesecracks had significant effects on the compressive strength offoamed concrete [3]. At 400 �C, the foamed concrete strength re-tained only about 75% of its initial value for both densities. Furtherdegradation and loss of strength continued to take place at hightemperatures. At temperature of 600 �C, the foamed concrete re-tained only about 40% of the original strength for both densities.
Since the compositions of both densities of foamed concrete areidentical, except for increased pores in the lower density foamedconcrete, it is not surprising that the normalized strength – tem-perature relationships of foamed concrete of both densities are al-most the same.
0.0
0.2
0.4
0.6
0.8
1.0
1.2
0 100 200 300 400 500 600
Temperature (°C)
Nor
mal
ized
Com
pres
sive
Str
engt
h (%
)
650
1000
`
kg/m3
kg/m3
ength (right) of foamed concrete as a function of temperature.
M.A.O. Mydin, Y.C. Wang / Construction and Building Materials 26 (2012) 638–654 643
3.4. Effects of high temperature on compressive stress–strainrelationship of foamed concrete
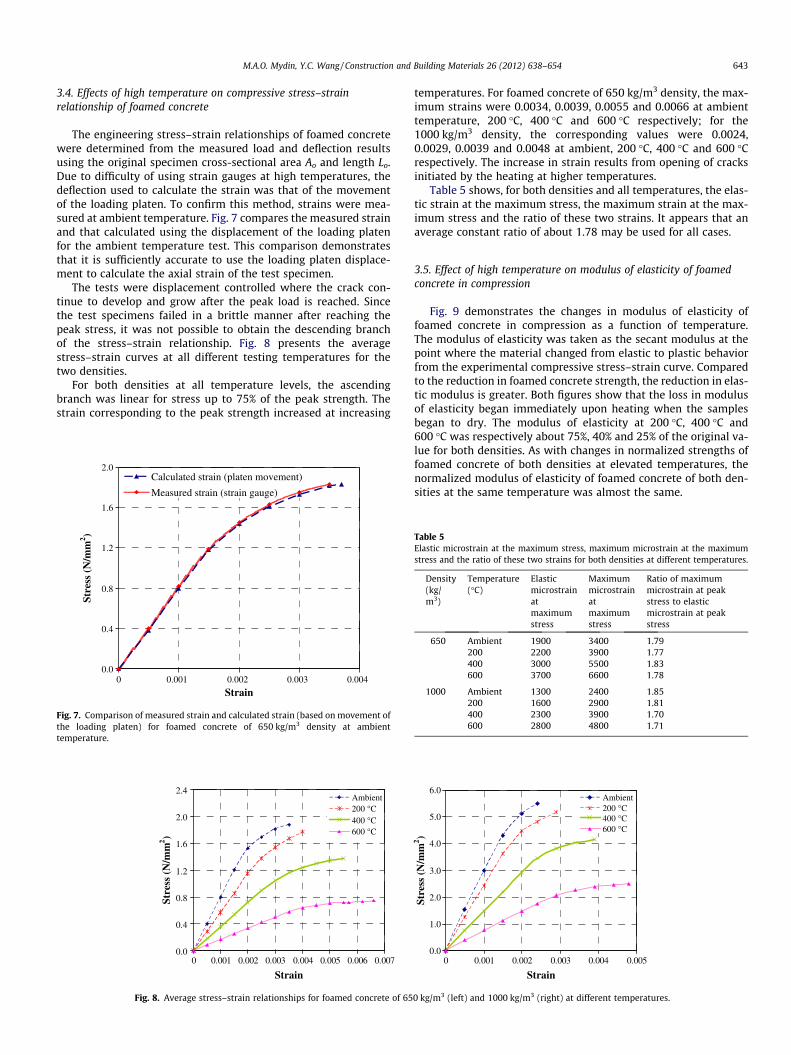
The engineering stress–strain relationships of foamed concretewere determined from the measured load and deflection resultsusing the original specimen cross-sectional area Ao and length Lo.Due to difficulty of using strain gauges at high temperatures, thedeflection used to calculate the strain was that of the movementof the loading platen. To confirm this method, strains were mea-sured at ambient temperature. Fig. 7 compares the measured strainand that calculated using the displacement of the loading platenfor the ambient temperature test. This comparison demonstratesthat it is sufficiently accurate to use the loading platen displace-ment to calculate the axial strain of the test specimen.
The tests were displacement controlled where the crack con-tinue to develop and grow after the peak load is reached. Sincethe test specimens failed in a brittle manner after reaching thepeak stress, it was not possible to obtain the descending branchof the stress–strain relationship. Fig. 8 presents the averagestress–strain curves at all different testing temperatures for thetwo densities.
For both densities at all temperature levels, the ascendingbranch was linear for stress up to 75% of the peak strength. Thestrain corresponding to the peak strength increased at increasing
0.0
0.4
0.8
1.2
1.6
2.0
2.4
0 0.001 0.002 0.003 0.004 0.005 0.006 0.007
Strain
Stre
ss (
N/m
m2 )
Ambient200 °C400 °C600 °C
Fig. 8. Average stress–strain relationships for foamed concrete of 65
0.0
0.4
0.8
1.2
1.6
2.0
0 0.001 0.002 0.003 0.004
Strain
Stre
ss (
N/m
m2 )
Calculated strain (platen movement)
Measured strain (strain gauge)
Fig. 7. Comparison of measured strain and calculated strain (based on movement ofthe loading platen) for foamed concrete of 650 kg/m3 density at ambienttemperature.
temperatures. For foamed concrete of 650 kg/m3 density, the max-imum strains were 0.0034, 0.0039, 0.0055 and 0.0066 at ambienttemperature, 200 �C, 400 �C and 600 �C respectively; for the1000 kg/m3 density, the corresponding values were 0.0024,0.0029, 0.0039 and 0.0048 at ambient, 200 �C, 400 �C and 600 �Crespectively. The increase in strain results from opening of cracksinitiated by the heating at higher temperatures.
Table 5 shows, for both densities and all temperatures, the elas-tic strain at the maximum stress, the maximum strain at the max-imum stress and the ratio of these two strains. It appears that anaverage constant ratio of about 1.78 may be used for all cases.
3.5. Effect of high temperature on modulus of elasticity of foamedconcrete in compression
Fig. 9 demonstrates the changes in modulus of elasticity offoamed concrete in compression as a function of temperature.The modulus of elasticity was taken as the secant modulus at thepoint where the material changed from elastic to plastic behaviorfrom the experimental compressive stress–strain curve. Comparedto the reduction in foamed concrete strength, the reduction in elas-tic modulus is greater. Both figures show that the loss in modulusof elasticity began immediately upon heating when the samplesbegan to dry. The modulus of elasticity at 200 �C, 400 �C and600 �C was respectively about 75%, 40% and 25% of the original va-lue for both densities. As with changes in normalized strengths offoamed concrete of both densities at elevated temperatures, thenormalized modulus of elasticity of foamed concrete of both den-sities at the same temperature was almost the same.
0.0
1.0
2.0
3.0
4.0
5.0
6.0
0 0.001 0.002 0.003 0.004 0.005
Strain
Stre
ss (
N/m
m2 )
Ambient200 °C400 °C600 °C
0 kg/m3 (left) and 1000 kg/m3 (right) at different temperatures.
Table 5Elastic microstrain at the maximum stress, maximum microstrain at the maximumstress and the ratio of these two strains for both densities at different temperatures.
Density(kg/m3)
Temperature(�C)
Elasticmicrostrainatmaximumstress
Maximummicrostrainatmaximumstress
Ratio of maximummicrostrain at peakstress to elasticmicrostrain at peakstress
650 Ambient 1900 3400 1.79200 2200 3900 1.77400 3000 5500 1.83600 3700 6600 1.78
1000 Ambient 1300 2400 1.85200 1600 2900 1.81400 2300 3900 1.70600 2800 4800 1.71
0.0
0.5
1.0
1.5
2.0
2.5
3.0
3.5
0 100 200 300 400 500 600
Temperature (°C)
Com
pres
sive
Mod
ulus
(kN
/mm
2 )
`
650 kg/m3
1000 kg/m3
0.0
0.2
0.4
0.6
0.8
1.0
1.2
0 100 200 300 400 500 600
Temperature (°C)
Nor
mal
ized
Com
pres
sive
Mod
ulus
(%
)
650 kg/m3
1000 kg/m3
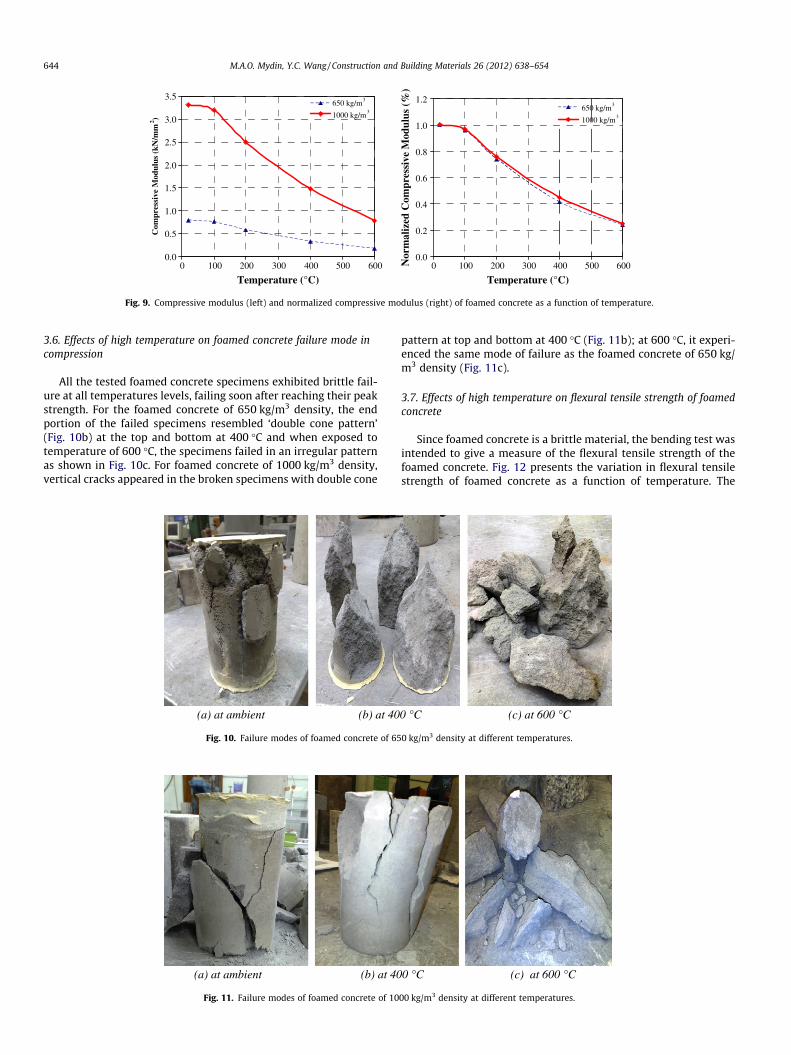
Fig. 9. Compressive modulus (left) and normalized compressive modulus (right) of foamed concrete as a function of temperature.
644 M.A.O. Mydin, Y.C. Wang / Construction and Building Materials 26 (2012) 638–654
3.6. Effects of high temperature on foamed concrete failure mode incompression
All the tested foamed concrete specimens exhibited brittle fail-ure at all temperatures levels, failing soon after reaching their peakstrength. For the foamed concrete of 650 kg/m3 density, the endportion of the failed specimens resembled ‘double cone pattern’(Fig. 10b) at the top and bottom at 400 �C and when exposed totemperature of 600 �C, the specimens failed in an irregular patternas shown in Fig. 10c. For foamed concrete of 1000 kg/m3 density,vertical cracks appeared in the broken specimens with double cone
(a) at ambient (b) at 40
Fig. 10. Failure modes of foamed concrete of 65
(a) at ambient (b) at 40
Fig. 11. Failure modes of foamed concrete of 10
pattern at top and bottom at 400 �C (Fig. 11b); at 600 �C, it experi-enced the same mode of failure as the foamed concrete of 650 kg/m3 density (Fig. 11c).
3.7. Effects of high temperature on flexural tensile strength of foamedconcrete
Since foamed concrete is a brittle material, the bending test wasintended to give a measure of the flexural tensile strength of thefoamed concrete. Fig. 12 presents the variation in flexural tensilestrength of foamed concrete as a function of temperature. The
0 °C (c) at 600 °C
0 kg/m3 density at different temperatures.
0 °C (c) at 600 °C
00 kg/m3 density at different temperatures.
0.0
0.2
0.4
0.6
0.8
1.0
0 100 200 300 400 500 600
Temperature (°C) Temperature (°C)
Fle
xura
l Ten
sile
Str
engt
h (N
/mm
2 )
650 kg/m3
1000 kg/m3
0.0
0.2
0.4
0.6
0.8
1.0
1.2
0 100 200 300 400 500 600
Nor
mal
ized
Fle
xura
l Str
engt
h (%
)
650 kg/m3
1000 kg/m3
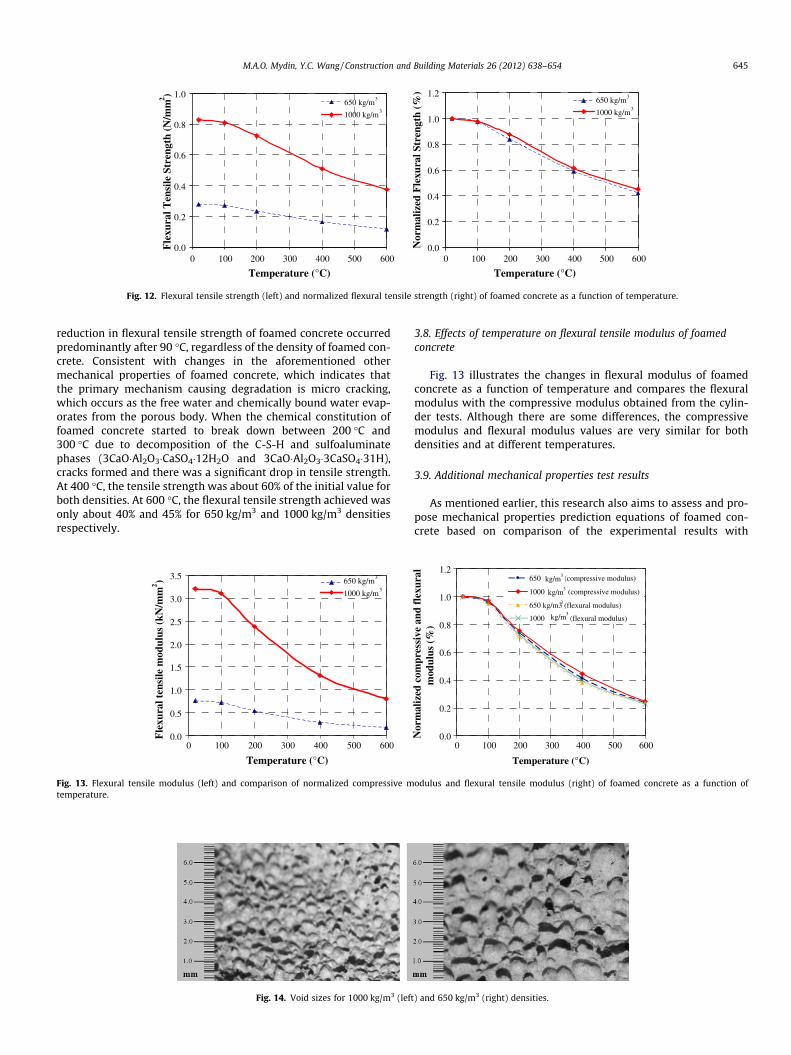
Fig. 12. Flexural tensile strength (left) and normalized flexural tensile strength (right) of foamed concrete as a function of temperature.
M.A.O. Mydin, Y.C. Wang / Construction and Building Materials 26 (2012) 638–654 645
reduction in flexural tensile strength of foamed concrete occurredpredominantly after 90 �C, regardless of the density of foamed con-crete. Consistent with changes in the aforementioned othermechanical properties of foamed concrete, which indicates thatthe primary mechanism causing degradation is micro cracking,which occurs as the free water and chemically bound water evap-orates from the porous body. When the chemical constitution offoamed concrete started to break down between 200 �C and300 �C due to decomposition of the C-S-H and sulfoaluminatephases (3CaO�Al2O3�CaSO4�12H2O and 3CaO�Al2O3�3CaSO4�31H),cracks formed and there was a significant drop in tensile strength.At 400 �C, the tensile strength was about 60% of the initial value forboth densities. At 600 �C, the flexural tensile strength achieved wasonly about 40% and 45% for 650 kg/m3 and 1000 kg/m3 densitiesrespectively.
0.0
0.5
1.0
1.5
2.0
2.5
3.0
3.5
Temperature (°C)
Fle
xura
l ten
sile
mod
ulus
(kN
/mm
2 )
`
650 kg/m3
1000 kg/m3
0 100 200 300 400 500 600
Fig. 13. Flexural tensile modulus (left) and comparison of normalized compressive mtemperature.
Fig. 14. Void sizes for 1000 kg/m3 (left
3.8. Effects of temperature on flexural tensile modulus of foamedconcrete
Fig. 13 illustrates the changes in flexural modulus of foamedconcrete as a function of temperature and compares the flexuralmodulus with the compressive modulus obtained from the cylin-der tests. Although there are some differences, the compressivemodulus and flexural modulus values are very similar for bothdensities and at different temperatures.
3.9. Additional mechanical properties test results
As mentioned earlier, this research also aims to assess and pro-pose mechanical properties prediction equations of foamed con-crete based on comparison of the experimental results with
0.0
0.2
0.4
0.6
0.8
1.0
1.2
0 100 200 300 400 500 600
Temperature (°C)
Nor
mal
ized
com
pres
sive
and
fle
xura
l
m
odul
us (
%)
650 kg/m3 (compressive modulus)
1000 kg/m3 (compressive modulus)
650 kg/m3 (flexural modulus)
1000 kg/m3 (flexural modulus)
kg/m3
kg/m3
3
kg/m3
odulus and flexural tensile modulus (right) of foamed concrete as a function of
) and 650 kg/m3 (right) densities.
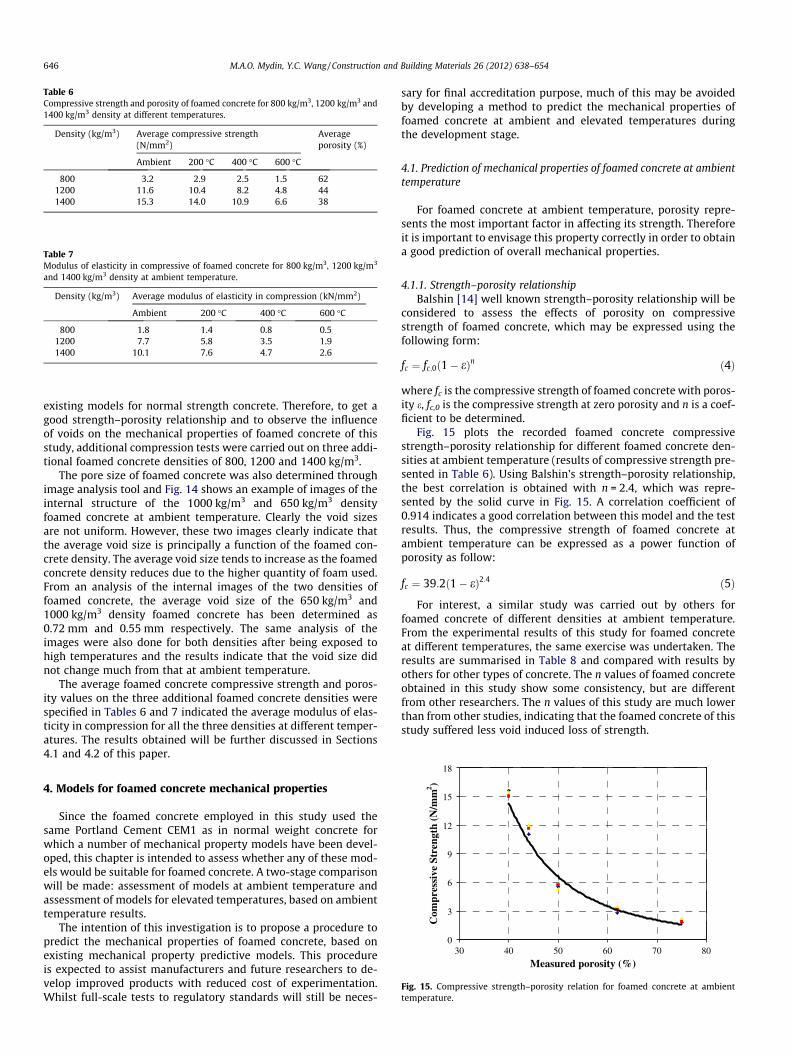
Table 6Compressive strength and porosity of foamed concrete for 800 kg/m3, 1200 kg/m3 and1400 kg/m3 density at different temperatures.
Density (kg/m3) Average compressive strength(N/mm2)
Averageporosity (%)
Ambient 200 �C 400 �C 600 �C
800 3.2 2.9 2.5 1.5 621200 11.6 10.4 8.2 4.8 441400 15.3 14.0 10.9 6.6 38
Table 7Modulus of elasticity in compressive of foamed concrete for 800 kg/m3, 1200 kg/m3
and 1400 kg/m3 density at ambient temperature.
Density (kg/m3) Average modulus of elasticity in compression (kN/mm2)
Ambient 200 �C 400 �C 600 �C
800 1.8 1.4 0.8 0.51200 7.7 5.8 3.5 1.91400 10.1 7.6 4.7 2.6
646 M.A.O. Mydin, Y.C. Wang / Construction and Building Materials 26 (2012) 638–654
existing models for normal strength concrete. Therefore, to get agood strength–porosity relationship and to observe the influenceof voids on the mechanical properties of foamed concrete of thisstudy, additional compression tests were carried out on three addi-tional foamed concrete densities of 800, 1200 and 1400 kg/m3.
The pore size of foamed concrete was also determined throughimage analysis tool and Fig. 14 shows an example of images of theinternal structure of the 1000 kg/m3 and 650 kg/m3 densityfoamed concrete at ambient temperature. Clearly the void sizesare not uniform. However, these two images clearly indicate thatthe average void size is principally a function of the foamed con-crete density. The average void size tends to increase as the foamedconcrete density reduces due to the higher quantity of foam used.From an analysis of the internal images of the two densities offoamed concrete, the average void size of the 650 kg/m3 and1000 kg/m3 density foamed concrete has been determined as0.72 mm and 0.55 mm respectively. The same analysis of theimages were also done for both densities after being exposed tohigh temperatures and the results indicate that the void size didnot change much from that at ambient temperature.
The average foamed concrete compressive strength and poros-ity values on the three additional foamed concrete densities werespecified in Tables 6 and 7 indicated the average modulus of elas-ticity in compression for all the three densities at different temper-atures. The results obtained will be further discussed in Sections4.1 and 4.2 of this paper.
0
3
6
9
12
15
18
30 40 50 60 70 80
Measured porosity (%)
Com
pres
sive
Str
engt
h (N
/mm
2 )
Fig. 15. Compressive strength–porosity relation for foamed concrete at ambienttemperature.
4. Models for foamed concrete mechanical properties
Since the foamed concrete employed in this study used thesame Portland Cement CEM1 as in normal weight concrete forwhich a number of mechanical property models have been devel-oped, this chapter is intended to assess whether any of these mod-els would be suitable for foamed concrete. A two-stage comparisonwill be made: assessment of models at ambient temperature andassessment of models for elevated temperatures, based on ambienttemperature results.
The intention of this investigation is to propose a procedure topredict the mechanical properties of foamed concrete, based onexisting mechanical property predictive models. This procedureis expected to assist manufacturers and future researchers to de-velop improved products with reduced cost of experimentation.Whilst full-scale tests to regulatory standards will still be neces-
sary for final accreditation purpose, much of this may be avoidedby developing a method to predict the mechanical properties offoamed concrete at ambient and elevated temperatures duringthe development stage.
4.1. Prediction of mechanical properties of foamed concrete at ambienttemperature
For foamed concrete at ambient temperature, porosity repre-sents the most important factor in affecting its strength. Thereforeit is important to envisage this property correctly in order to obtaina good prediction of overall mechanical properties.
4.1.1. Strength–porosity relationshipBalshin [14] well known strength–porosity relationship will be
considered to assess the effects of porosity on compressivestrength of foamed concrete, which may be expressed using thefollowing form:
fc ¼ fc;0ð1� eÞn ð4Þ
where fc is the compressive strength of foamed concrete with poros-ity e, fc,0 is the compressive strength at zero porosity and n is a coef-ficient to be determined.
Fig. 15 plots the recorded foamed concrete compressivestrength–porosity relationship for different foamed concrete den-sities at ambient temperature (results of compressive strength pre-sented in Table 6). Using Balshin’s strength–porosity relationship,the best correlation is obtained with n = 2.4, which was repre-sented by the solid curve in Fig. 15. A correlation coefficient of0.914 indicates a good correlation between this model and the testresults. Thus, the compressive strength of foamed concrete atambient temperature can be expressed as a power function ofporosity as follow:
fc ¼ 39:2ð1� eÞ2:4 ð5Þ
For interest, a similar study was carried out by others forfoamed concrete of different densities at ambient temperature.From the experimental results of this study for foamed concreteat different temperatures, the same exercise was undertaken. Theresults are summarised in Table 8 and compared with results byothers for other types of concrete. The n values of foamed concreteobtained in this study show some consistency, but are differentfrom other researchers. The n values of this study are much lowerthan from other studies, indicating that the foamed concrete of thisstudy suffered less void induced loss of strength.
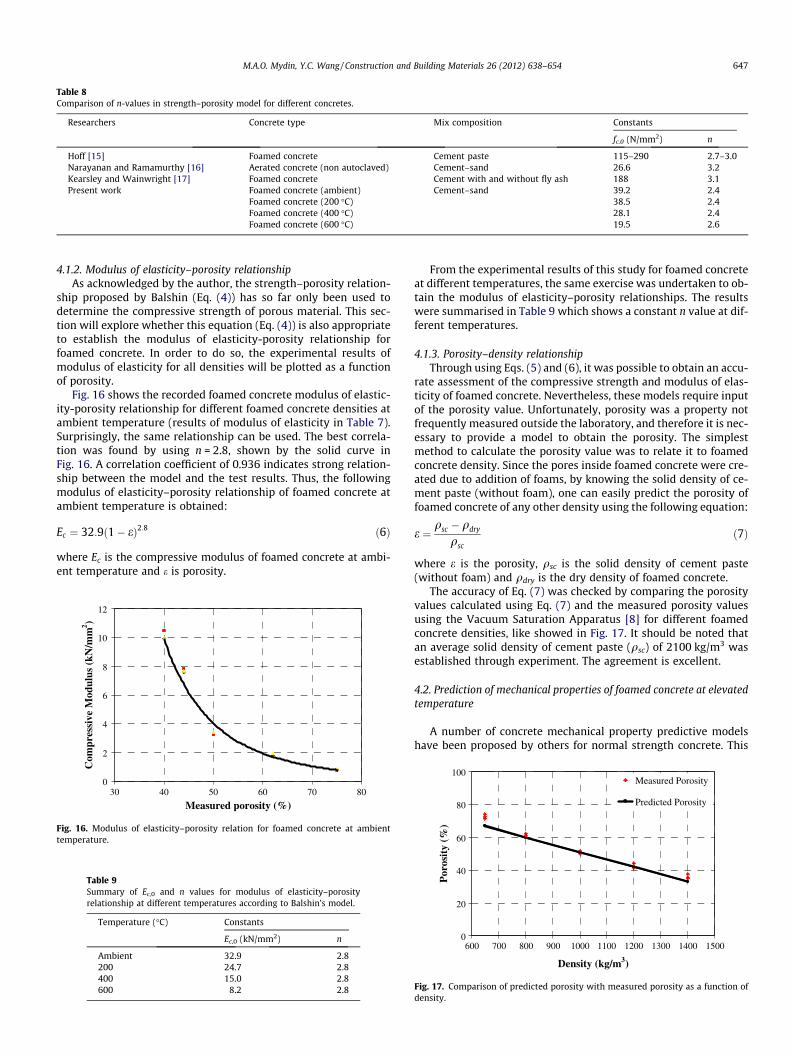
Table 8Comparison of n-values in strength–porosity model for different concretes.
Researchers Concrete type Mix composition Constants
fc.0 (N/mm2) n
Hoff [15] Foamed concrete Cement paste 115–290 2.7–3.0Narayanan and Ramamurthy [16] Aerated concrete (non autoclaved) Cement–sand 26.6 3.2Kearsley and Wainwright [17] Foamed concrete Cement with and without fly ash 188 3.1Present work Foamed concrete (ambient) Cement–sand 39.2 2.4
Foamed concrete (200 �C) 38.5 2.4Foamed concrete (400 �C) 28.1 2.4Foamed concrete (600 �C) 19.5 2.6
M.A.O. Mydin, Y.C. Wang / Construction and Building Materials 26 (2012) 638–654 647
4.1.2. Modulus of elasticity–porosity relationshipAs acknowledged by the author, the strength–porosity relation-
ship proposed by Balshin (Eq. (4)) has so far only been used todetermine the compressive strength of porous material. This sec-tion will explore whether this equation (Eq. (4)) is also appropriateto establish the modulus of elasticity-porosity relationship forfoamed concrete. In order to do so, the experimental results ofmodulus of elasticity for all densities will be plotted as a functionof porosity.
Fig. 16 shows the recorded foamed concrete modulus of elastic-ity-porosity relationship for different foamed concrete densities atambient temperature (results of modulus of elasticity in Table 7).Surprisingly, the same relationship can be used. The best correla-tion was found by using n = 2.8, shown by the solid curve inFig. 16. A correlation coefficient of 0.936 indicates strong relation-ship between the model and the test results. Thus, the followingmodulus of elasticity–porosity relationship of foamed concrete atambient temperature is obtained:
Ec ¼ 32:9ð1� eÞ2:8 ð6Þ
where Ec is the compressive modulus of foamed concrete at ambi-ent temperature and e is porosity.
0
2
4
6
8
10
12
30 40 50 60 70 80
Measured porosity (%)
Com
pres
sive
Mod
ulus
(kN
/mm
2 )
Fig. 16. Modulus of elasticity–porosity relation for foamed concrete at ambienttemperature.
Table 9Summary of Ec,0 and n values for modulus of elasticity–porosityrelationship at different temperatures according to Balshin’s model.
Temperature (�C) Constants
Ec,0 (kN/mm2) n
Ambient 32.9 2.8200 24.7 2.8400 15.0 2.8600 8.2 2.8
From the experimental results of this study for foamed concreteat different temperatures, the same exercise was undertaken to ob-tain the modulus of elasticity–porosity relationships. The resultswere summarised in Table 9 which shows a constant n value at dif-ferent temperatures.
4.1.3. Porosity–density relationshipThrough using Eqs. (5) and (6), it was possible to obtain an accu-
rate assessment of the compressive strength and modulus of elas-ticity of foamed concrete. Nevertheless, these models require inputof the porosity value. Unfortunately, porosity was a property notfrequently measured outside the laboratory, and therefore it is nec-essary to provide a model to obtain the porosity. The simplestmethod to calculate the porosity value was to relate it to foamedconcrete density. Since the pores inside foamed concrete were cre-ated due to addition of foams, by knowing the solid density of ce-ment paste (without foam), one can easily predict the porosity offoamed concrete of any other density using the following equation:
e ¼qsc � qdry
qscð7Þ
where e is the porosity, qsc is the solid density of cement paste(without foam) and qdry is the dry density of foamed concrete.
The accuracy of Eq. (7) was checked by comparing the porosityvalues calculated using Eq. (7) and the measured porosity valuesusing the Vacuum Saturation Apparatus [8] for different foamedconcrete densities, like showed in Fig. 17. It should be noted thatan average solid density of cement paste (qsc) of 2100 kg/m3 wasestablished through experiment. The agreement is excellent.
4.2. Prediction of mechanical properties of foamed concrete at elevatedtemperature
A number of concrete mechanical property predictive modelshave been proposed by others for normal strength concrete. This
0
20
40
60
80
100
600 700 800 900 1000 1100 1200 1300 1400 1500
Density (kg/m3)
Por
osit
y (%
)
Measured Porosity
Predicted Porosity
Fig. 17. Comparison of predicted porosity with measured porosity as a function ofdensity.
648 M.A.O. Mydin, Y.C. Wang / Construction and Building Materials 26 (2012) 638–654
section was intended to assess the applicability of these models tofoamed concrete. In particular, since the Eurocode 2 [18] modelsare well established, there were the principal models to be consid-ered for adoption unless they gave grossly inaccurate results.
4.2.1. Compressive strength models for concrete at elevatedtemperatures
Several models have been proposed to estimate concrete com-pressive strength at high temperatures.
Li and Purkiss [19] presented a review of the available modelsfor the mechanical behavior of concrete at elevated temperaturesand provided comparisons between the existing models. Li andPurkiss [19] suggested the following model to predict the compres-sive strength of concrete at elevated temperatures:
fcT ¼ fc
� 0:00165 � T100
� �3
� 0:03 � T100
� �2
þ 0:025 � T100
� �þ1:002
" #
ð8Þ
where fcT is the concrete compressive strength at elevated temper-ature, fc is the concrete compressive strength at ambient tempera-ture and T is temperature in �C.
The Eurocode 2 [18] model is given below:
FcT ¼ fc T 6 100 �C ð9aÞ
FcT ¼ fc � ð1:067� 0:00067 � TÞ 100 �C 6 T 6 400 �C ð9bÞ
FcT ¼ fc � ð1:44� 0:0016 � TÞ T P 400 �C ð9cÞ
Hertz [2] in his study on concrete strength for fire safety designhad derived an idealised data for the compressive strength of anumber of concretes which included test series from more than400 test comprising approximately 3000 specimens. The data cov-ered a range of concretes with aggregates such as siliceous materi-als, limestone, granite, sea gravel, pumice, and expanded clay. Hethen proposed a model for compressive strength of concrete at ele-vated temperatures that allowed for different types of aggregate tobe differentiated as follows:
fcT ¼ fc �1
1þ TT1þ T
T2
� �2þ T
T8
� �8þ T
T64
� �64
264
375 ð10Þ
Assuming foamed concrete as a type of lightweight aggregateconcrete for application of Hertz’s model, then T1 = 100,000,T2 = 1100, T8 = 800 and T64 = 940.
All the above-mentioned predictive models have been assessedand compared with the experimental results for all densities (650,
0.0
0.2
0.4
0.6
0.8
1.0
1.2
0 100 200 300 400 500 600
Temperature (°C)
Nor
mal
ized
com
pres
sive
str
engt
h
Eurocode 2
Li and Purkiss
Hertz
Average test results
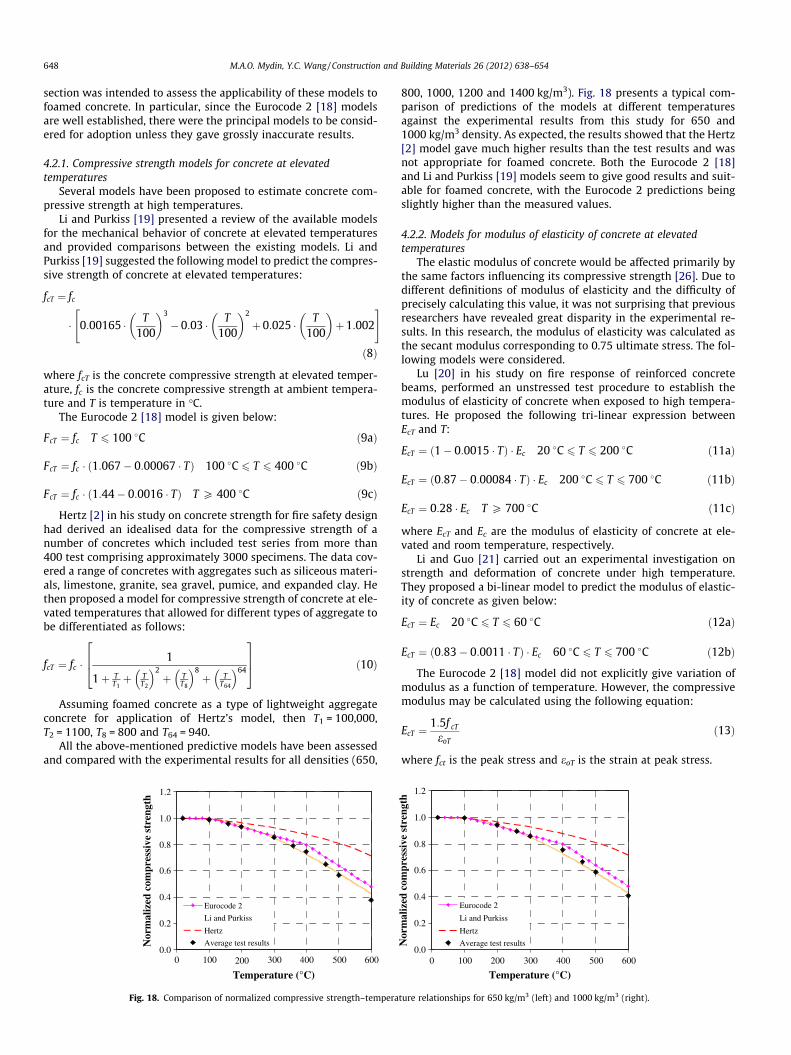
Fig. 18. Comparison of normalized compressive strength–tempera
800, 1000, 1200 and 1400 kg/m3). Fig. 18 presents a typical com-parison of predictions of the models at different temperaturesagainst the experimental results from this study for 650 and1000 kg/m3 density. As expected, the results showed that the Hertz[2] model gave much higher results than the test results and wasnot appropriate for foamed concrete. Both the Eurocode 2 [18]and Li and Purkiss [19] models seem to give good results and suit-able for foamed concrete, with the Eurocode 2 predictions beingslightly higher than the measured values.
4.2.2. Models for modulus of elasticity of concrete at elevatedtemperatures
The elastic modulus of concrete would be affected primarily bythe same factors influencing its compressive strength [26]. Due todifferent definitions of modulus of elasticity and the difficulty ofprecisely calculating this value, it was not surprising that previousresearchers have revealed great disparity in the experimental re-sults. In this research, the modulus of elasticity was calculated asthe secant modulus corresponding to 0.75 ultimate stress. The fol-lowing models were considered.
Lu [20] in his study on fire response of reinforced concretebeams, performed an unstressed test procedure to establish themodulus of elasticity of concrete when exposed to high tempera-tures. He proposed the following tri-linear expression betweenEcT and T:
EcT ¼ ð1� 0:0015 � TÞ � Ec 20 �C 6 T 6 200 �C ð11aÞ
EcT ¼ ð0:87� 0:00084 � TÞ � Ec 200 �C 6 T 6 700 �C ð11bÞ
EcT ¼ 0:28 � Ec T P 700 �C ð11cÞ
where EcT and Ec are the modulus of elasticity of concrete at ele-vated and room temperature, respectively.
Li and Guo [21] carried out an experimental investigation onstrength and deformation of concrete under high temperature.They proposed a bi-linear model to predict the modulus of elastic-ity of concrete as given below:
EcT ¼ Ec 20 �C 6 T 6 60 �C ð12aÞ
EcT ¼ ð0:83� 0:0011 � TÞ � Ec 60 �C 6 T 6 700 �C ð12bÞ
The Eurocode 2 [18] model did not explicitly give variation ofmodulus as a function of temperature. However, the compressivemodulus may be calculated using the following equation:
EcT ¼1:5f cT
eoTð13Þ
where fct is the peak stress and eoT is the strain at peak stress.
0.0
0.2
0.4
0.6
0.8
1.0
1.2
0 100 200 300 400 500 600
Temperature (°C)
Nor
mal
ized
com
pres
sive
str
engt
h
Eurocode 2
Li and Purkiss
Hertz
Average test results
ture relationships for 650 kg/m3 (left) and 1000 kg/m3 (right).
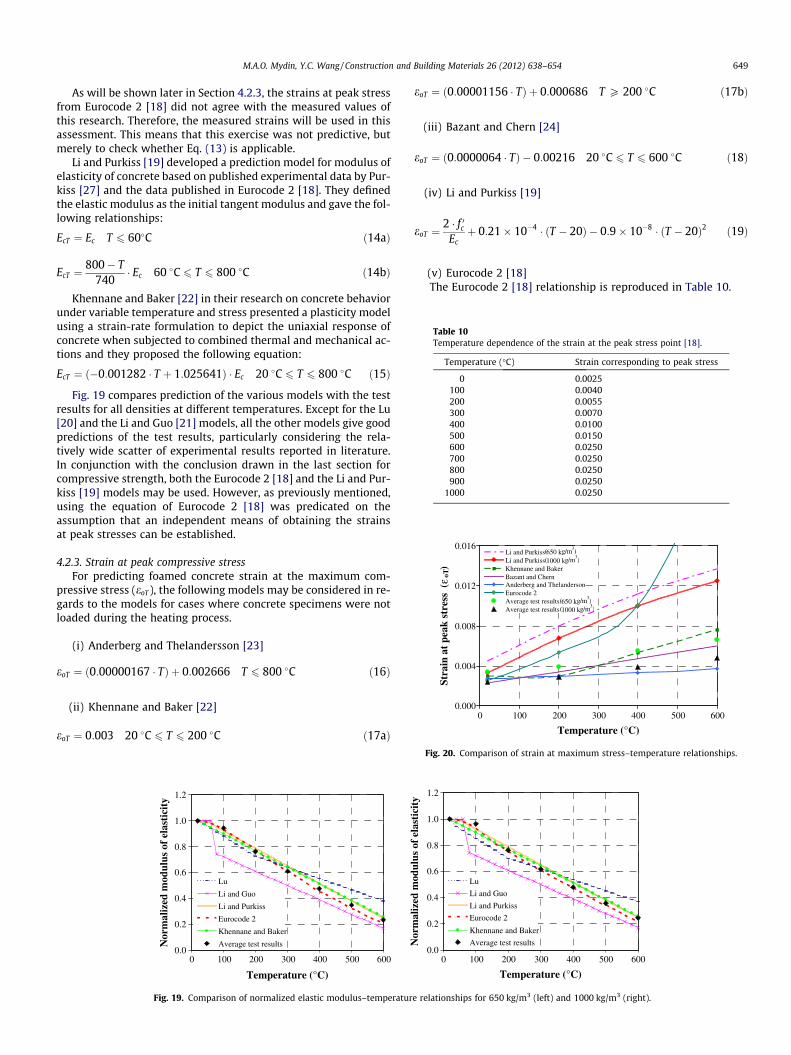
Table 10Temperature dependence of the strain at the peak stress point [18].
Temperature (�C) Strain corresponding to peak stress
0 0.0025100 0.0040200 0.0055300 0.0070400 0.0100500 0.0150600 0.0250700 0.0250800 0.0250900 0.0250
1000 0.0250
0.000
0.004
0.008
0.012
0.016
0 100 200 300 400 500 600
Temperature (°C)
Stra
in a
t pe
ak s
tres
s (
ε oT)
Li and Purkiss Li and PurkissKhennane and BakerBazant and ChernAnderberg and ThelandersonEurocode 2Average test results Average test results
(650 kg/m3)
(1000 kg/m3)
(1000 kg/m3)
(650 kg/m3)
M.A.O. Mydin, Y.C. Wang / Construction and Building Materials 26 (2012) 638–654 649
As will be shown later in Section 4.2.3, the strains at peak stressfrom Eurocode 2 [18] did not agree with the measured values ofthis research. Therefore, the measured strains will be used in thisassessment. This means that this exercise was not predictive, butmerely to check whether Eq. (13) is applicable.
Li and Purkiss [19] developed a prediction model for modulus ofelasticity of concrete based on published experimental data by Pur-kiss [27] and the data published in Eurocode 2 [18]. They definedthe elastic modulus as the initial tangent modulus and gave the fol-lowing relationships:
EcT ¼ Ec T 6 60�C ð14aÞ
EcT ¼800� T
740� Ec 60 �C 6 T 6 800 �C ð14bÞ
Khennane and Baker [22] in their research on concrete behaviorunder variable temperature and stress presented a plasticity modelusing a strain-rate formulation to depict the uniaxial response ofconcrete when subjected to combined thermal and mechanical ac-tions and they proposed the following equation:
EcT ¼ ð�0:001282 � T þ 1:025641Þ � Ec 20 �C 6 T 6 800 �C ð15Þ
Fig. 19 compares prediction of the various models with the testresults for all densities at different temperatures. Except for the Lu[20] and the Li and Guo [21] models, all the other models give goodpredictions of the test results, particularly considering the rela-tively wide scatter of experimental results reported in literature.In conjunction with the conclusion drawn in the last section forcompressive strength, both the Eurocode 2 [18] and the Li and Pur-kiss [19] models may be used. However, as previously mentioned,using the equation of Eurocode 2 [18] was predicated on theassumption that an independent means of obtaining the strainsat peak stresses can be established.
4.2.3. Strain at peak compressive stressFor predicting foamed concrete strain at the maximum com-
pressive stress (eoT ), the following models may be considered in re-gards to the models for cases where concrete specimens were notloaded during the heating process.
(i) Anderberg and Thelandersson [23]
eoT ¼ ð0:00000167 � TÞ þ 0:002666 T 6 800 �C ð16Þ
(ii) Khennane and Baker [22]
eoT ¼ 0:003 20 �C 6 T 6 200 �C ð17aÞ
0.0
0.2
0.4
0.6
0.8
1.0
1.2
0 100 200 300 400 500 600
Temperature (°C)
Nor
mal
ized
mod
ulus
of
elas
tici
ty
Lu
Li and Guo
Li and Purkiss
Eurocode 2
Khennane and Baker
Average test results
Fig. 19. Comparison of normalized elastic modulus–temperatur
eoT ¼ ð0:00001156 � TÞ þ 0:000686 T P 200 �C ð17bÞ
(iii) Bazant and Chern [24]
eoT ¼ ð0:0000064 � TÞ � 0:00216 20 �C 6 T 6 600 �C ð18Þ
(iv) Li and Purkiss [19]
eoT ¼2 � f 0c
Ecþ 0:21� 10�4 � ðT � 20Þ � 0:9� 10�8 � ðT � 20Þ2 ð19Þ
(v) Eurocode 2 [18]The Eurocode 2 [18] relationship is reproduced in Table 10.
0.0
0.2
0.4
0.6
0.8
1.0
1.2
0 100 200 300 400 500 600
Temperature (°C)
Nor
mal
ized
mod
ulus
of
elas
tici
ty
Lu
Li and Guo
Li and Purkiss
Eurocode 2
Khennane and Baker
Average test results
e relationships for 650 kg/m3 (left) and 1000 kg/m3 (right).
Fig. 20. Comparison of strain at maximum stress–temperature relationships.
650 M.A.O. Mydin, Y.C. Wang / Construction and Building Materials 26 (2012) 638–654
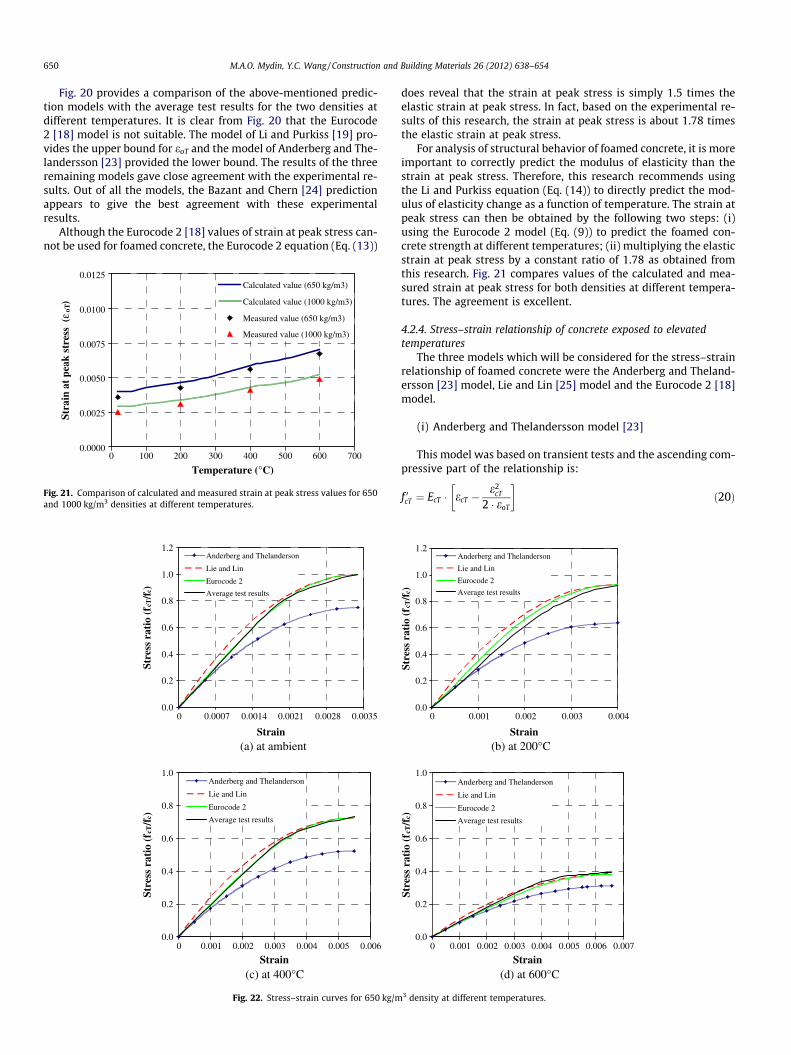
Fig. 20 provides a comparison of the above-mentioned predic-tion models with the average test results for the two densities atdifferent temperatures. It is clear from Fig. 20 that the Eurocode2 [18] model is not suitable. The model of Li and Purkiss [19] pro-vides the upper bound for eoT and the model of Anderberg and The-landersson [23] provided the lower bound. The results of the threeremaining models gave close agreement with the experimental re-sults. Out of all the models, the Bazant and Chern [24] predictionappears to give the best agreement with these experimentalresults.
Although the Eurocode 2 [18] values of strain at peak stress can-not be used for foamed concrete, the Eurocode 2 equation (Eq. (13))
0.0000
0.0025
0.0050
0.0075
0.0100
0.0125
0 100 200 300 400 500 600 700
Temperature (°C)
Stra
in a
t pe
ak s
tres
s (
ε oT)
Calculated value (650 kg/m3)
Calculated value (1000 kg/m3)
Measured value (650 kg/m3)
Measured value (1000 kg/m3)
`
Fig. 21. Comparison of calculated and measured strain at peak stress values for 650and 1000 kg/m3 densities at different temperatures.
0.0
0.2
0.4
0.6
0.8
1.0
1.2
0 0.0007 0.0014 0.0021 0.0028 0.0035
Strain
Stre
ss r
atio
(f c
T/f
c)
Anderberg and Thelanderson
Lie and Lin
Eurocode 2
Average test results
(a) at ambient
0.0
0.2
0.4
0.6
0.8
1.0
0 0.001 0.002 0.003 0.004 0.005 0.006
Strain
Stre
ss r
atio
(f c
T/f
c)
Anderberg and Thelanderson
Lie and Lin
Eurocode 2
Average test results
(c) at 400°C
Fig. 22. Stress–strain curves for 650 kg/m
does reveal that the strain at peak stress is simply 1.5 times theelastic strain at peak stress. In fact, based on the experimental re-sults of this research, the strain at peak stress is about 1.78 timesthe elastic strain at peak stress.
For analysis of structural behavior of foamed concrete, it is moreimportant to correctly predict the modulus of elasticity than thestrain at peak stress. Therefore, this research recommends usingthe Li and Purkiss equation (Eq. (14)) to directly predict the mod-ulus of elasticity change as a function of temperature. The strain atpeak stress can then be obtained by the following two steps: (i)using the Eurocode 2 model (Eq. (9)) to predict the foamed con-crete strength at different temperatures; (ii) multiplying the elasticstrain at peak stress by a constant ratio of 1.78 as obtained fromthis research. Fig. 21 compares values of the calculated and mea-sured strain at peak stress for both densities at different tempera-tures. The agreement is excellent.
4.2.4. Stress–strain relationship of concrete exposed to elevatedtemperatures
The three models which will be considered for the stress–strainrelationship of foamed concrete were the Anderberg and Theland-ersson [23] model, Lie and Lin [25] model and the Eurocode 2 [18]model.
(i) Anderberg and Thelandersson model [23]
This model was based on transient tests and the ascending com-pressive part of the relationship is:
f 0cT ¼ EcT � ecT �e2
cT
2 � eoT
� �ð20Þ
0.0
0.2
0.4
0.6
0.8
1.0
1.2
0 0.001 0.002 0.003 0.004
Strain
Stre
ss r
atio
(f c
T/f
c)
Anderberg and Thelanderson
Lie and Lin
Eurocode 2
Average test results
(b) at 200°C
0.0
0.2
0.4
0.6
0.8
1.0
0 0.001 0.002 0.003 0.004 0.005 0.006 0.007
Strain
Stre
ss r
atio
(f c
T/f
c)
Anderberg and Thelanderson
Lie and Lin
Eurocode 2
Average test results
(d) at 600°C
3 density at different temperatures.
M.A.O. Mydin, Y.C. Wang / Construction and Building Materials 26 (2012) 638–654 651
where EcT is the modulus of elasticity of concrete at elevatedtemperature.
(ii) Lie and Lin model [25]This model includes an ascending and a descending branch.
However, since only the ascending branch of foamed concretestress–strain relationship could be obtained, only the ascendingbranch equation will be given, which was as follows.
f 0cT ¼ fcT � 1� eoT � ecT
eoT
� �2" #
ecT 6 eoT ð21Þ
0.0
0.2
0.4
0.6
0.8
1.0
1.2
0 0.0005 0.001 0.0015 0.002 0.0025
Strain
Stre
ss r
atio
(f c
T/f
c)
Anderberg and Thelanderson
Lie and Lin
Eurocode 2
Average test results
(a) at ambient
0.0
0.2
0.4
0.6
0.8
1.0
0 0.001 0.002 0.003 0.004
Strain
Stre
ss r
atio
(f c
T/f
c)
Anderberg and Thelanderson
Lie and Lin
Eurocode 2
Average test results
(c) at 400°C
Fig. 23. Stress–strain curves for 1000 kg/m
0.0
0.2
0.4
0.6
0.8
1.0
1.2
0 100 200 300 400 500 600
Temperature (°C)
Nor
mal
ized
fle
xura
l ten
sile
str
engt
h
Anderberg and Thelanderson
Li and Gao
Terro
Eurocode 2
Average test results
Fig. 24. Comparison of flexural tensile strength–temperature
where f 0cT is the concrete compressive stress at elevated tempera-ture, fcT is the concrete compressive strength at elevated tempera-ture, ecT is the concrete strain at elevated temperature and eoT isthe strain at the maximum concrete stress.
(iii) Eurocode 2 model [18]The Eurocode 2 equation is:
f 0cT ¼3ecT fcT
eoT 2þ ecTeoT
� �3� � ð22Þ
0.0
0.2
0.4
0.6
0.8
1.0
1.2
0 0.0005 0.001 0.0015 0.002 0.0025 0.003
Strain
Stre
ss r
atio
(f c
T/f
c)
Anderberg and Thelanderson
Lie and Lin
Eurocode 2
Average test results
0.0
0.2
0.4
0.6
0.8
1.0
0 0.001 0.002 0.003 0.004 0.005
Strain
Stre
ss r
atio
(f c
T/f
c)
Anderberg and Thelanderson
Lie and Lin
Eurocode 2
Average test results
(d) at 600°C
(d) at 200°C
3 density at different temperatures.
0.0
0.2
0.4
0.6
0.8
1.0
1.2
0 100 200 300 400 500 600
Temperature (°C)
Nor
mal
ized
fle
xura
l ten
sile
str
engt
h
Anderberg and Thelanderson
Li and Gao
Terro Eurocode 2
Average test results
relationships for 650 kg/m3 (left) and 1000 kg/m3 (right).
652 M.A.O. Mydin, Y.C. Wang / Construction and Building Materials 26 (2012) 638–654
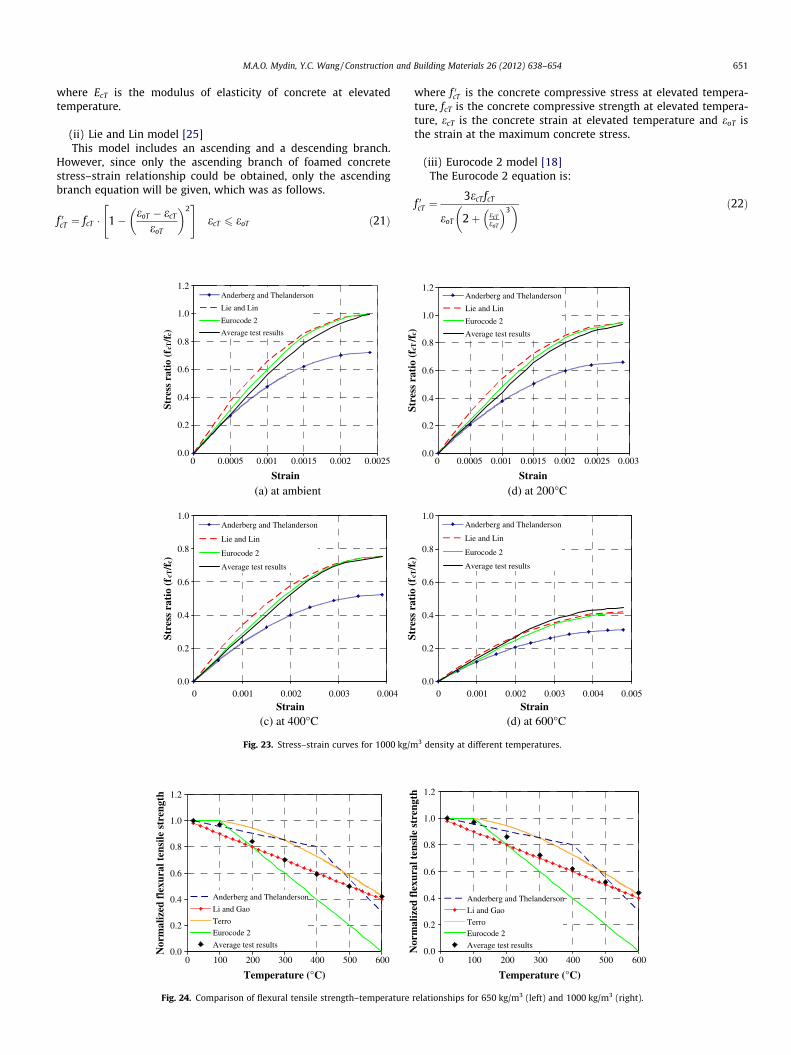
All three models require input of the foamed concrete peakstress (fcT) and strain at peak stress (ecT). For this exercise, the mea-sured values were used so that this comparison does suffer fromany inaccuracy in prediction of these input values.
Figs. 22a–d and 23a–d compare predictions of the differentmodels with the average test results for the two densities at differ-ent temperatures (ambient, 200 �C, 400 �C and 600 �C). Except forthe Anderberg and Thelandersson [23] model, Lie and Lin [25]and Eurocode 2 [18] model were almost identical and in goodagreement with the experimental results for all densities at differ-ent temperatures. Since the Eurocode 2 [18] model is well estab-lished and accepted for use in fire engineering design of concretestructures, the author suggests adopting the Eurocode 2 [18]model.
0.0
0.5
1.0
1.5
2.0
2.5
3.0
3.5
0 0.001 0.002 0.003 0.004 0.005 0.006 0.007
Strain
Stre
ss (
N/m
m2 )
Proposed procedure (predicted parameters)
Proposed procedure (measured parameters)
Average test results
400°C
200°CAmbient
600°C
(a) 650 kg/m3
0.0
2.0
4.0
6.0
8.0
10.0
0 0.001 0.002 0.003 0.004 0.005 0.006
Strain
Stre
ss (
N/m
m2 )
Proposed procedure (predicted parameters)
Proposed procedure (measured parameters)
Average test results
400°C
200°CAmbien
600°C
(c) 1000 kg/m3
0.0
6.0
12.0
18.0
24.0
0 0.001 0.002
Stra
Stre
ss (
N/m
m2 )
Proposed procedu
Proposed procedu
Average test results
Ambient
(e) 140
Fig. 25. Comparison between the predicted stress–strain relationships using the
4.2.5. Flexural tensile strength of concrete exposed to elevatedtemperatures
There was very limited research related to tensile strength ofconcrete at elevated temperatures. Nevertheless, a few researcherssuch as Anderberg and Thelandersson [23], Li and Guo [21] andTerro [28] have proposed prediction equations.
The Anderberg and Thelandersson [23] model was:
fcrT ¼ fcr � ð�0:000526 � T þ 1:01052Þ 20 �C 6 T 6 400 �C ð23aÞ
fcrT ¼ fcr � ð�0:0025 � T þ 1:8Þ 400 �C 6 T 6 600 �C ð23bÞ
fcrT ¼ fcr � ð�0:0005 � T þ 0:6Þ 600 �C 6 T 6 1000 �C ð23cÞ
0.0
1.0
2.0
3.0
4.0
5.0
6.0
0 0.001 0.002 0.003 0.004 0.005 0.006
Strain
Stre
ss (
N/m
m2 )
Proposed procedure (predicted parameters)
Proposed procedure (measured parameters)
Average test results
400°C
200°CAmbient
600°C
(b) 800 kg/m3
0.0
4.0
8.0
12.0
16.0
0 0.001 0.002 0.003 0.004 0.005
Strain
Stre
ss (
N/m
m2 )
Proposed procedure (predicted parameters)
Proposed procedure (measured parameters)
Average test results
400°C
200°CAmbient
600°C
`
(d) 1200 kg/m3
0.003 0.004 0.005
in
re (predicted parameters)
re (measured parameters)
400°C
200°C
600°C
0 kg/m3
proposed procedure and the average experimental results for both densities.
M.A.O. Mydin, Y.C. Wang / Construction and Building Materials 26 (2012) 638–654 653
where fcrT and fcr are the tensile strength of concrete at elevatedtemperature and ambient temperature respectively and T is tem-perature in �C.
Li and Guo [21] suggested the following equation based on theexperimental results for tensile strength of concrete under hightemperatures:
fcrT ¼ fcr � ð1� 0:001 � TÞ 20 �C 6 T 6 1000 �C ð24Þ
Terro [28] performed a numerical modeling of the behavior ofconcrete structures under fire condition and make recommenda-tion as follows:
fcrT ¼ fcr �fcT
fcð25Þ
where fcT is the concrete compressive strength at elevated temper-ature, fc is the concrete compressive strength at ambienttemperature.
Eurocode 2 [18] gives:
fcrT ¼ fcr 20 �C 6 T 6 100 �C ð26aÞ
fcrT ¼ fcr � ð�0:002 � T þ 1:2Þ 100 �C 6 T 6 600 �C ð26bÞ
Fig. 24 compares the prediction of the aforementioned modelsfor foamed concrete density of 650 kg/m3 and 1000 kg/m3 at differ-ent temperatures against the experimental results from this study.It is clear that the model of Anderberg and Thelandersson [23] andTerro [28] provide the upper bound for fctT, while the model of Liand Gao [21] provides the lower bound for both densities. TheEurocode 2 [18] model did not seem to fit well with the experi-mental results. Overall, the model proposed by Li and Gao [21]seemed to provide the best agreement with the experimentalresults.
4.2.6. Summary of combined predictive modelsThe mechanical properties of foamed concrete that influence
the stress–strain relationship were the foamed concrete strength,initial modulus of elasticity and strain at maximum stress. Theyexperience significant changes at elevated temperatures. Thefoamed concrete strength and initial modulus of elasticity de-crease, while the absolute value of the strain at peak stressincreases.
After a comprehensive assessment of all existing mechanicalproperty predictive models, the following procedure may be usedto predict the mechanical properties of foamed concrete at hightemperatures:
1. Obtaining dry density (qdry) of foamed concrete.2. Obtaining the solid density of cement paste (without foam) and
then calculate the porosity (e) of foamed concrete using Eq. (7).3. Calculating the ambient temperature compressive strength (fc)
and modulus of elasticity (Ec) of foamed concrete using Eqs.(5) and (6) respectively. Values of 39.2 N/mm2 and n = 2.4 forthe compressive strength and 32.9 N/mm2 and n = 2.8 for thecompressive modulus of elasticity should be used.
4. Eurocode 2 model (Eq. (9)) to calculate foamed concrete com-pressive strength (fcT) at high temperatures was used.
5. Calculating foamed concrete modulus of elasticity (EcT) at hightemperatures using the Li and Purkiss model (Eq. (14)).
6. Multiplying the elastic strain at peak stress by 1.78 to give thestrain at peak stress.
7. Using the Eurocode 2 equation (Eq. (22)) to calculate and plotthe stress–strain relationship of foamed concrete.
8. Calculating the tensile strength of foamed concrete using theequation (Eq. (24)) of Li and Guo [21].
4.3. Proposed procedure using combined predictive models
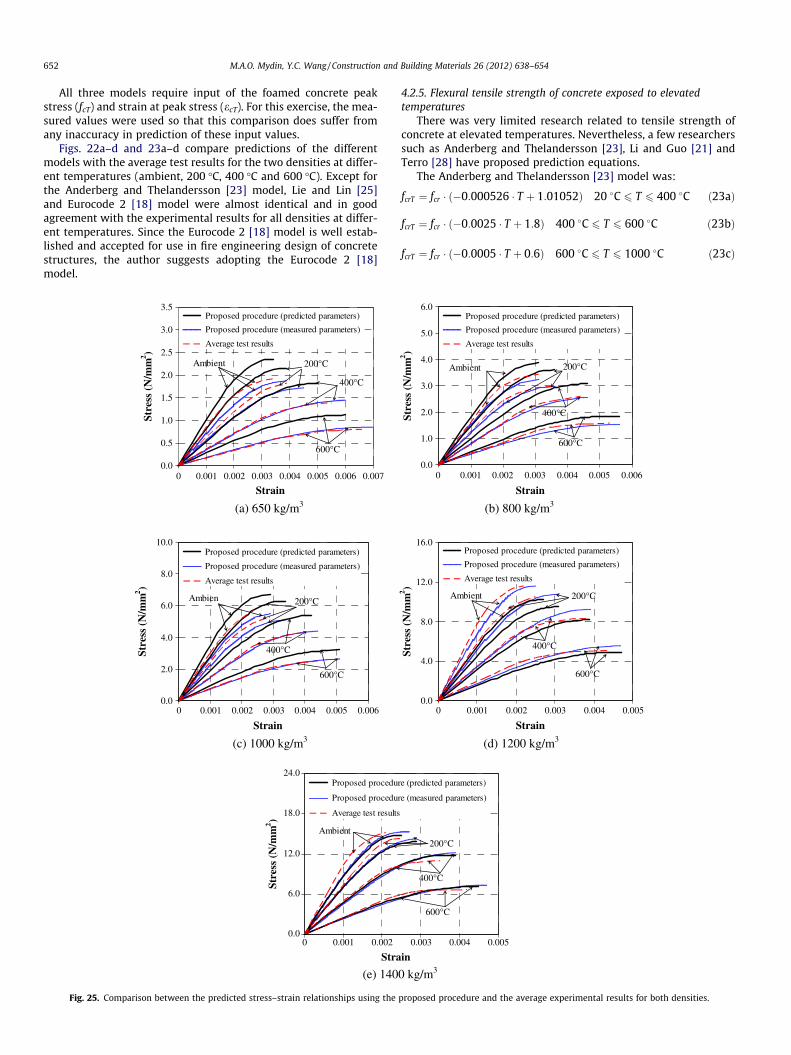
The procedure presented in Section 4.2.6 has been implementedfor all the tests carried out in this study. This section presents de-tailed comparison between the predicted stress–strain relation-ships using the above procedure and the experimental results.Fig. 25a–e showed the comparison between the predicted stress–strain relationships using the proposed procedure and the averageexperimental results of different densities (650, 800, 1000, 1200and 1400 kg/m3) at different temperatures. Shown in these figureswere also predicted stress–strain relationships if the measuredambient temperature strength and modulus of elasticity valueswere used instead of using the proposed strength–porosity (Eq.(5)) and modulus of elasticity–porosity (Eq. (6)) relationships.Overall the agreement was good, demonstrating the feasibility ofusing the proposed procedure to predict the mechanical propertiesof foamed concrete of different densities at different temperaturesby only knowing one single value of dry density (qdry) of foamedconcrete. However, there was some inaccuracy in the stress–strainrelationships using the proposed procedure which was primarily aresult of some inaccuracy in the proposed strength–porosity andmodulus of elasticity–porosity relationships at ambient tempera-ture. These figures showed that if the measured strength and mod-ulus of elasticity were used, the predicted stress–strainrelationships were in very close agreement with the test results.Therefore, it was recommended that ambient temperaturemechanical tests should still be carried out to obtain the strengthand modulus of elasticity values, rather than relying on thestrength–porosity and modulus of elasticity–porosity models. Theother high temperature mechanical property models (compressivestrength ratio–temperature relationship, modulus of elasticity ra-tio–temperature relationship, strain at peak stress and stress–strain relationship) gave very accurate results.
5. Conclusions
This paper has presented the results of a comprehensive studyto quantify the mechanical properties of foamed concrete at ele-vated temperatures. Compressive cylinder tests and three pointbending tests were carried out for a range of foamed concrete den-sities at different temperatures to 600 �C. The mechanical proper-ties included compressive cylinder strength, compressivemodulus of elasticity, compressive stress–strain relationship,strain at the maximum compressive stress, porosity, flexural bend-ing strength and modulus of elasticity. The experimental resultswere then compared with predictive models based on normalstrength concrete. From the experimental and comparative results,the following conclusions may be drawn:
1. The experimental results consistently demonstrated that theloss in stiffness for cement based material like foamed concreteat elevated temperatures occurs predominantly after about90 �C, regardless of density. This indicates that the primarymechanism causing stiffness degradation is microcracking,which occurs as water expands and evaporates from the porousbody.
2. Reducing the density of foamed concrete reduces its strengthand stiffness. However, for foamed concrete of different densi-ties, the normalized strength and stiffness (ratio of elevatedtemperature value to ambient temperature value) – tempera-ture relationships are very similar.
3. The porosity of foamed concrete is principally a function of den-sity and changes little at different temperatures. Thus, thechange in mechanical property of foamed concrete at high tem-
654 M.A.O. Mydin, Y.C. Wang / Construction and Building Materials 26 (2012) 638–654
peratures comes principally from changed chemical compo-nents of foamed concrete.
4. Given that the mechanical properties of foamed concrete comefrom Portland Cement CEM1, it has been confirmed that thereduction in mechanical properties of foamed concrete can bepredicted using the mechanical property models for normalstrength concrete. The Balshin equation (Eq. (4)) may be usedto calculate both the ambient temperature compressivestrength and compressive modulus of elasticity, as a functionof porosity of foamed concrete. Nevertheless, for improvedaccuracy, ambient temperature mechanical property tests arestill recommended.
5. For compressive strength at elevated temperatures, the wellaccepted Eurocode 2 [18] model is applicable and Li and Purkiss[19] model may be used to predict the compressive modulus ofelasticity at elevated temperatures. For foamed concrete, thetotal strain at peak stress is approximately 1.78 times the elas-tic strain at peak stress. The Eurocode 2 [18] equation may beused to obtain the compressive stress–strain relationship offoamed concrete.
6. The model of Li and Gao [21] gave good prediction of the flex-ural tensile strength of foamed concrete at elevatedtemperatures.
Acknowledgements
The first author gratefully acknowledges financial support forthis research provided by Universiti Sains Malaysia under USMIncentive Grant (Ref. No. 2011/0348).
References
[1] Khoury GA, Majorana CE, Pesavento F, Schrefler BA. Modelling of heatedconcrete. Mag Concr Res 2002;54:77–101.
[2] Hertz KD. Concrete strength for fire safety design. Mag Concr Res2005;57:445–53.
[3] Ai H, Young JF, Scherer GW. Thermal expansion kinetics: method to measurepermeability of cementitious materials: II. Application to hardened cementpastes. J Am Ceram Soc 2001;84:385–91.
[4] BS EN 197-1. Cement: composition, specifications and conformity criteria forlow heat common cements. London: British Standards Institution; 2000.
[5] BS EN 12620. Aggregates for concrete. London: British Standards Institution;2002.
[6] Md Azree OM. Effect of using additives to the compressive strength oflightweight foamed concrete. Master dissertation, School of Housing, Buildingand Planning, University of Science Malaysia, Penang; 2004.
[7] Phan LT, Carino NJ. Code provisions for high strength concrete strengthtemperature relationship at elevated temperatures. J Mater Struct2003;36:91–8.
[8] Cabrera JG, Lynsdale CJ. A new gas permeameter for measuring thepermeability of mortar and concrete. Mag Concr Res 1988;40:177–82.
[9] Taylor HFW. Cement chemistry. London: Academic Press; 1992.[10] Kalifa P, Tsimbrovska M. Comportement des BHP à hautes températures – Etat
de la question et résultats expérimentaux. Cahier du CSTB, n�3078; 1998.[11] Gallé C, Sercombe J. Permeability and pore structure evolution of silico-
calcareous and hematite high-strength concretes submitted to hightemperatures. J Mater Struct 2001;34:619–28.
[12] Ye G, Liu X, De Schutter G, Taerwe L, Vandevelde P. Phase distribution andmicrostructural changes of SCC at elevated temperatures. J Cem Concr Res2007;37:978–87.
[13] Khoury GA. Compressive strength of concrete at high temperatures: areassessment. Mag Concr Res 1992;44:291–309.
[14] Balshin MY. Dependence of mechanical properties of metal powders onporosity and limiting properties of metal–ceramic materials. Dokl Akad NaukUzSSR 1949;67:831–4.
[15] Hoff GC. Porosity–strength considerations for cellular concrete. J Cem ConcrRes 1972;2:91–100.
[16] Narayanan N, Ramamurthy K. Prediction relations based on gel-poreparameters for the compressive strength of aerated concrete. Concr Sci Eng2000;1:206–12.
[17] Kearsley EP, Wainwright PJ. The effect of porosity on the strength of foamedconcrete. J Cem Concr Res 2002;32:233–9.
[18] CEN 1992-1-2. Eurocode 2. Design of concrete structures. Part 1.2: generalrules – structural fire design. European Committee for StandardisationDocument: Brussels; 2004.
[19] Li L, Purkiss JA. Stress–strain constitutive equations of concrete material atelevated temperatures. J Fire Saf 2005;40:669–86.
[20] Lu ZhD. A research on fire response of reinforced concrete beams. PhD thesis,Tongji University; 1989.
[21] Li W, Guo ZhH. Experimental investigation on strength and deformation ofconcrete under high temperature. Chin J Build Struct 1993;14:8–16.
[22] Khennane A, Baker G. Uniaxial model for concrete under variable temperatureand stress. J Eng Mech, ASCE 1993;119:1507–25.
[23] Anderberg Y, Thelandersson S. Stress and deformation characteristics ofconcrete at high temperatures: experimental investigation and materialbehavior model. Bulletin 54. Lund, Sweden: Lund Institute of Technology;1976.
[24] Bazant P, Chern JC. Stress-induced thermal and shrinkage strains in concrete. JEng Mech, ASCE 1987;113:1493–511.
[25] Lie TT, Lin TD. Fire performance of reinforced concrete columns. In: ASTM STP882, fire safety: science and engineering; 1985, p. 176–205.
[26] Malhotra HL. Design of fire-resisting structures. London: Surrey UniversityPress; 1982.
[27] Purkiss JA. Fire safety engineering – design of structures. Oxford: ButterworthHeinemann; 1996.
[28] Terro MJ. Numerical modeling of the behavior of concrete structures in fire. JAm Concr Inst Struct 1998;95:183–93.