Embed Size (px)
Citation preview
Jonathan A. SalemGlenn Research Center, Cleveland, Ohio
Nathan A. SmithMillennium Engineering and Integration Company, Arlington, Virginia
Akif ErsahinMAE Aerospace, Woodbridge, Connecticut
Mechanical Properties of a High Lead GlassUsed in the Mars Organic Molecule Analyzer
NASA/TM—2015-218847
August 2015
https://ntrs.nasa.gov/search.jsp?R=20150017735 2018-07-30T03:05:51+00:00Z
NASA STI Program . . . in Profi le
Since its founding, NASA has been dedicated to the advancement of aeronautics and space science. The NASA Scientifi c and Technical Information (STI) Program plays a key part in helping NASA maintain this important role.
The NASA STI Program operates under the auspices of the Agency Chief Information Offi cer. It collects, organizes, provides for archiving, and disseminates NASA’s STI. The NASA STI Program provides access to the NASA Technical Report Server—Registered (NTRS Reg) and NASA Technical Report Server—Public (NTRS) thus providing one of the largest collections of aeronautical and space science STI in the world. Results are published in both non-NASA channels and by NASA in the NASA STI Report Series, which includes the following report types: • TECHNICAL PUBLICATION. Reports of
completed research or a major signifi cant phase of research that present the results of NASA programs and include extensive data or theoretical analysis. Includes compilations of signifi cant scientifi c and technical data and information deemed to be of continuing reference value. NASA counter-part of peer-reviewed formal professional papers, but has less stringent limitations on manuscript length and extent of graphic presentations.
• TECHNICAL MEMORANDUM. Scientifi c
and technical fi ndings that are preliminary or of specialized interest, e.g., “quick-release” reports, working papers, and bibliographies that contain minimal annotation. Does not contain extensive analysis.
• CONTRACTOR REPORT. Scientifi c and technical fi ndings by NASA-sponsored contractors and grantees.
• CONFERENCE PUBLICATION. Collected papers from scientifi c and technical conferences, symposia, seminars, or other meetings sponsored or co-sponsored by NASA.
• SPECIAL PUBLICATION. Scientifi c, technical, or historical information from NASA programs, projects, and missions, often concerned with subjects having substantial public interest.
• TECHNICAL TRANSLATION. English-language translations of foreign scientifi c and technical material pertinent to NASA’s mission.
For more information about the NASA STI program, see the following:
• Access the NASA STI program home page at http://www.sti.nasa.gov
• E-mail your question to [email protected] • Fax your question to the NASA STI
Information Desk at 757-864-6500
• Telephone the NASA STI Information Desk at 757-864-9658 • Write to:
NASA STI Program Mail Stop 148 NASA Langley Research Center Hampton, VA 23681-2199
Jonathan A. SalemGlenn Research Center, Cleveland, Ohio
Nathan A. SmithMillennium Engineering and Integration Company, Arlington, Virginia
Akif ErsahinMAE Aerospace, Woodbridge, Connecticut
Mechanical Properties of a High Lead GlassUsed in the Mars Organic Molecule Analyzer
NASA/TM—2015-218847
August 2015
National Aeronautics andSpace Administration
Glenn Research CenterCleveland, Ohio 44135
Acknowledgments
Thanks to Chris Burke for machining test fi xtures and to George Quinn for useful discussions.
Available from
Level of Review: This material has been technically reviewed by technical management.
NASA STI ProgramMail Stop 148NASA Langley Research CenterHampton, VA 23681-2199
National Technical Information Service5285 Port Royal RoadSpringfi eld, VA 22161
703-605-6000
This report is available in electronic form at http://www.sti.nasa.gov/ and http://ntrs.nasa.gov/
NASA/TM—2015-218847 1
Mechanical Properties of a High Lead Glass Used in the Mars Organic Molecule Analyzer
Jonathan A. Salem
National Aeronautics and Space Administration Glenn Research Center Cleveland, Ohio 44135
Nathan A. Smith
Millennium Engineering and Integration Company Arlington, Virginia 22202
Akif Ersahin
MAE Aerospace Woodbridge, Connecticut 06525
Abstract
The elastic constants, strength, fracture toughness, slow crack growth parameters, and mirror constant of a high lead glass supplied as tubes and funnels were measured using ASTM International (formerly ASTM, American Society for Testing and Materials) methods and modifications thereof. The material exhibits lower Young’s modulus and slow crack growth exponent as compared to soda-lime silica glass. Highly modified glasses exhibit lower fracture toughness and slow crack growth exponent than high purity glasses such as fused silica.
Introduction
The Exobiology on Mars program is a series of European Space Agency missions to understand if life ever existed on Mars. NASA is contributing scientific, engineering, and technical expertise to international efforts to explore the Red Planet. NASA’s participation in the 2018 Exobiology on Mars Rover mission includes providing critical elements to the premier chemical analysis instrument on the rover, the Mars Organic Molecule Analyzer (MOMA). Some of the MOMA components are very brittle and require reliability analysis. This report provides results of mechanical testing and fractography of a high lead glass used in the MOMA system.
Test Materials
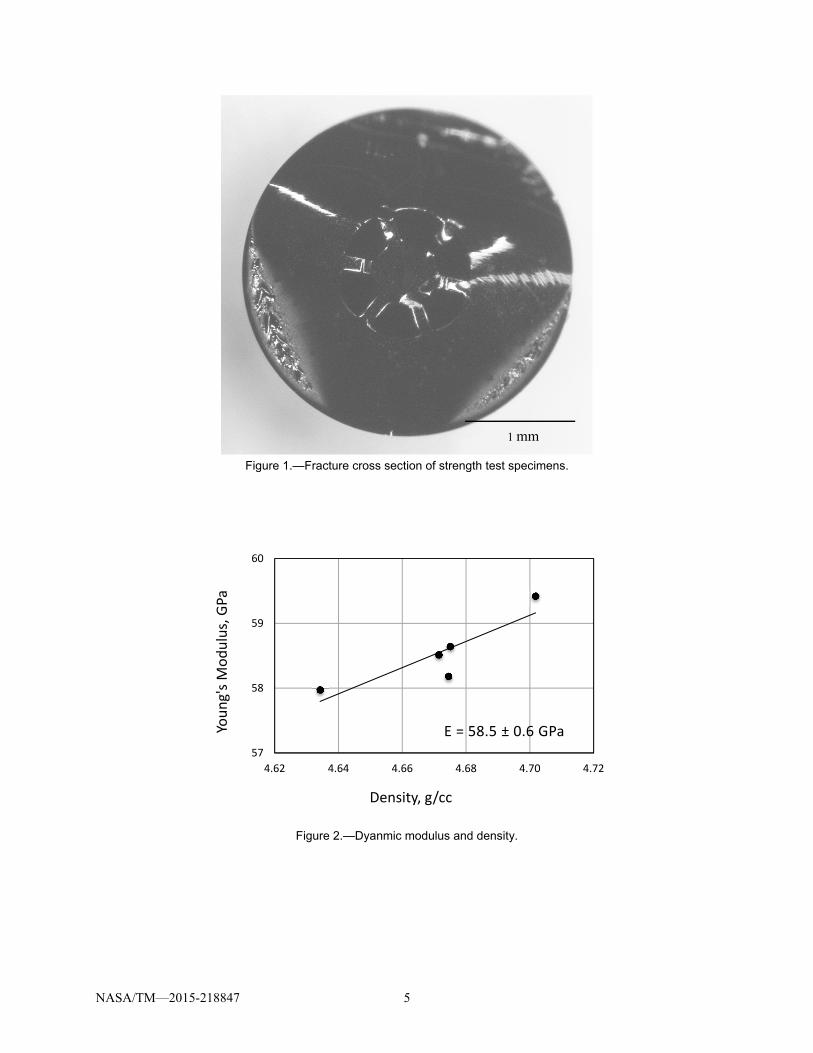
The test material was readily available as system subcomponents in the geometry of tubes and funnels with a curved spout. The cross section of the tubes, shown in Figure 1, consisted of six trapezoidal cavities arranged to form a central hexagon. Various regions of the tubes and funnel were either abraded, unabraded or metallized, thereby creating multiple surface finishes and flaw populations. Elastic modulus and strength tests were perform with the tubes, whereas slow crack growth and inert strength tests were performed with the funnels. With the exception of the test geometries, the tests nominally conformed to ASTM International standards C1289, C1368, and C1421.
NASA/TM—2015-218847 2
Mechanical Properties
Elastic Modulus
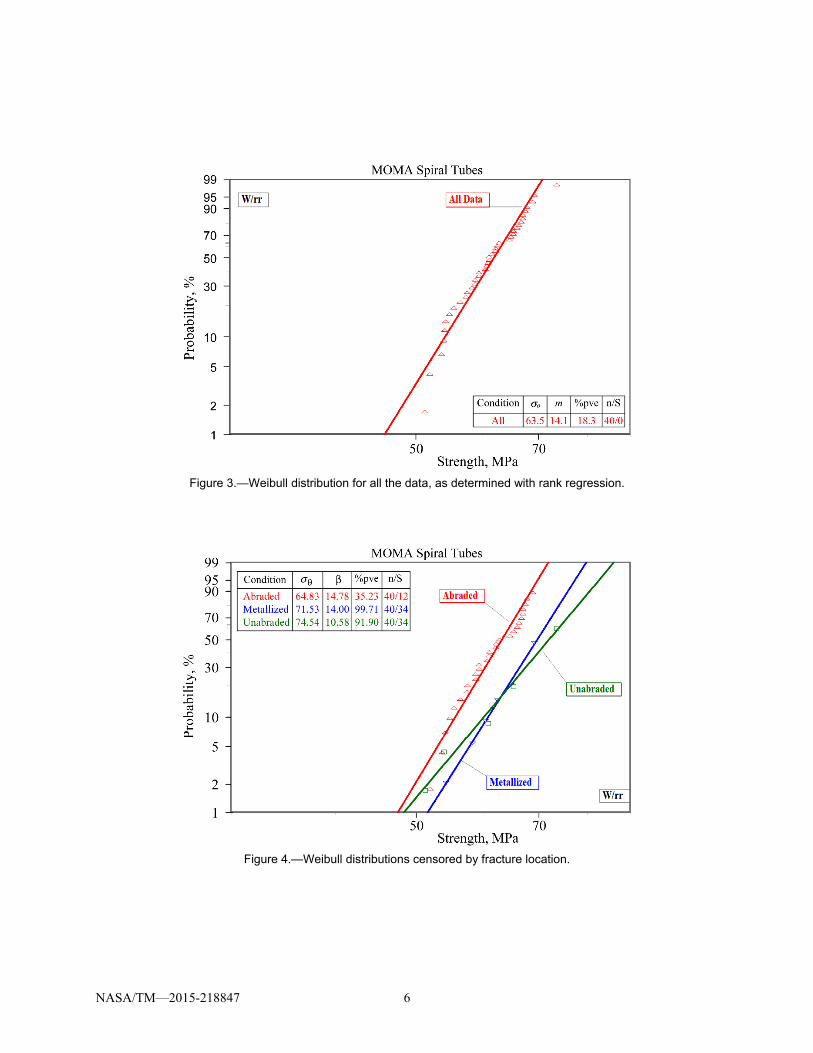
The elastic modulus was measured using impulse excitation in accordance with ASTM International C1259 with the exception of the previously described cross section. In order to account for the influence of cross section, the differences in inertia and density as determined via finite element analysis (FEA) were used in the calculations. The measured Young’s modulus is E = 58.50.6 GPa, which is much lower than that of soda-lime silicate, but comparable to that of other high lead glasses (Refs. 1 and 2). Figure 2 shows the results as a function of bulk density. Because of the different sections of the specimens, it is likely that the apparent variation in bulk density is a result of geometric effects rather than real material density variation.
Fracture Strength
The fracture strength, Sf, was measured in four-point bending with 10 and 20 mm spans. The strength was calculated from
I
Mc = S f (1)
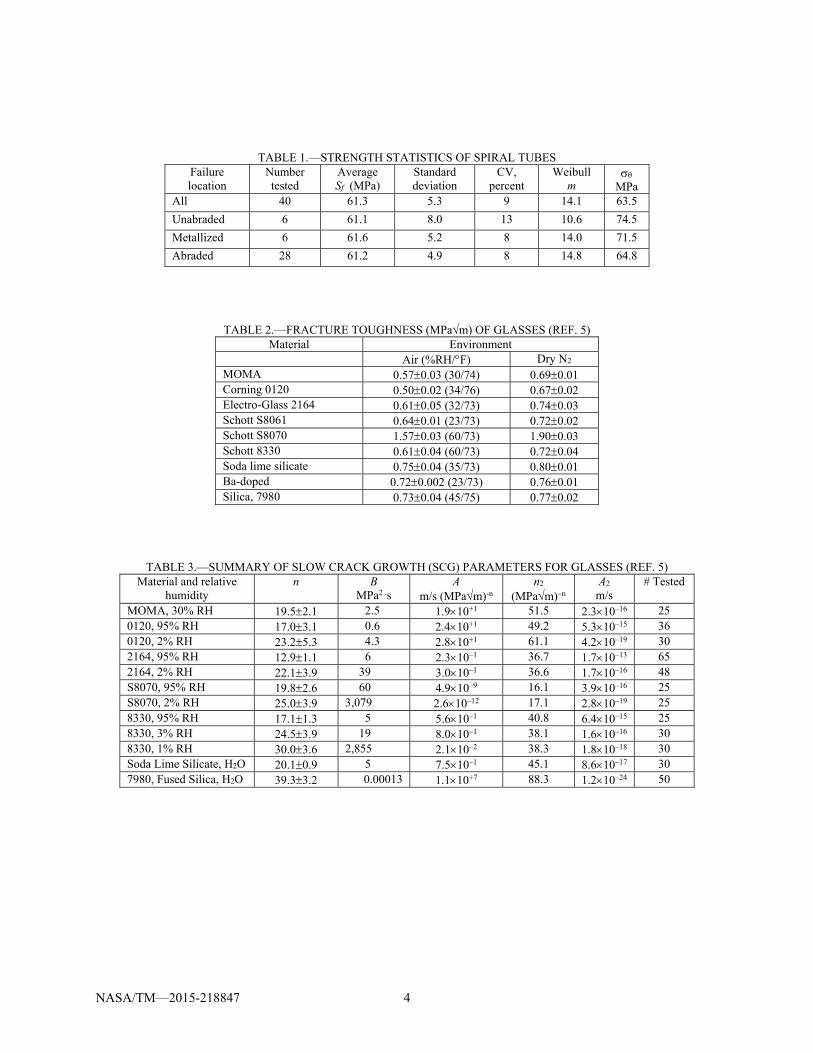
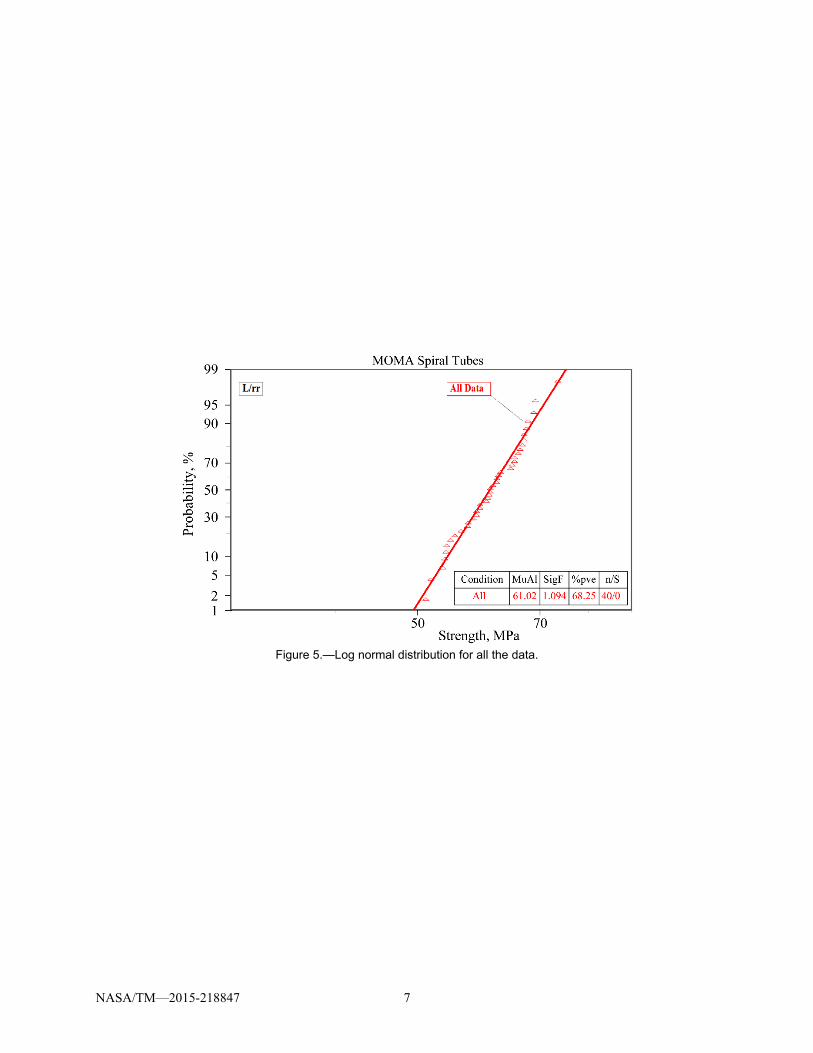
where M is the applied moment, c is the distance to the surface from the neutral axis, and I is the moment of inertia of the cross section as estimated with FEA. The resultant Weibull parameters are summarized in Table 1 and plots are show in Figures 3 and 4 for all of the data and the data censored into groups by fracture location: in the abraded region, the metallized region, or the unabraded region. Failure typically occurred in the abraded region and the Weibull statistics are similar for all fracture locations. Although the Weibull distribution provides an adequate fit, the log normal distribution provides a better fit, Figure 5.
Fracture Mirror Constants
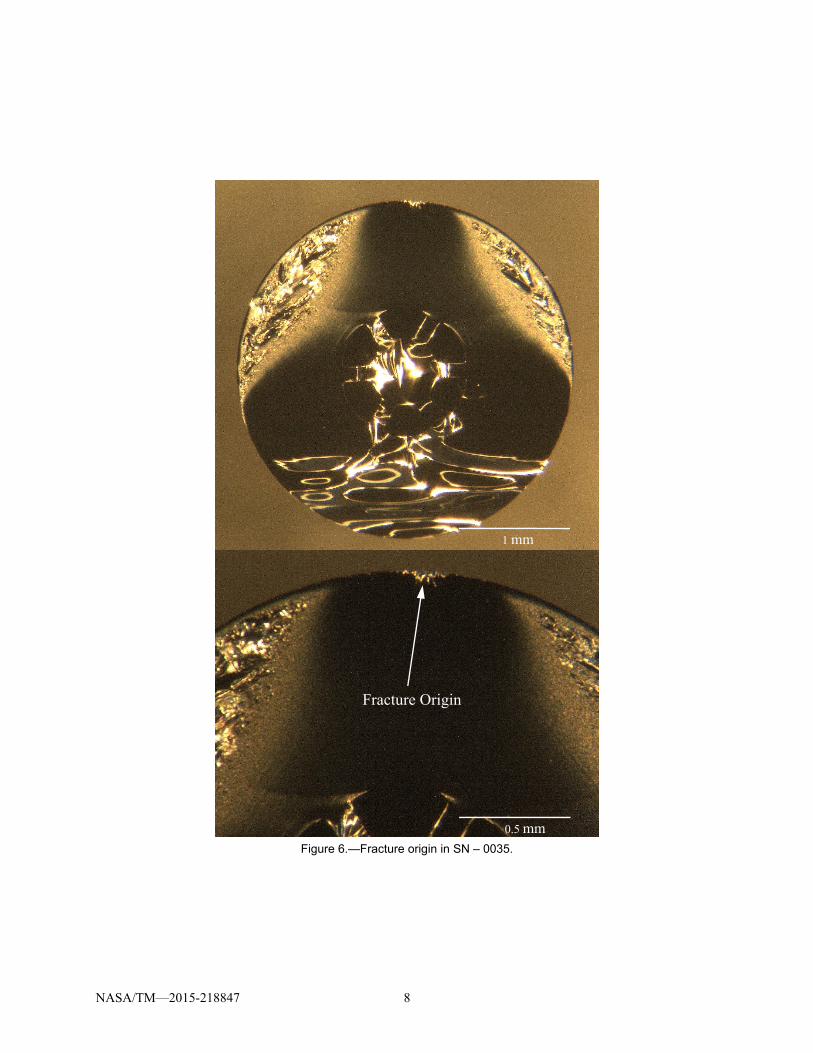
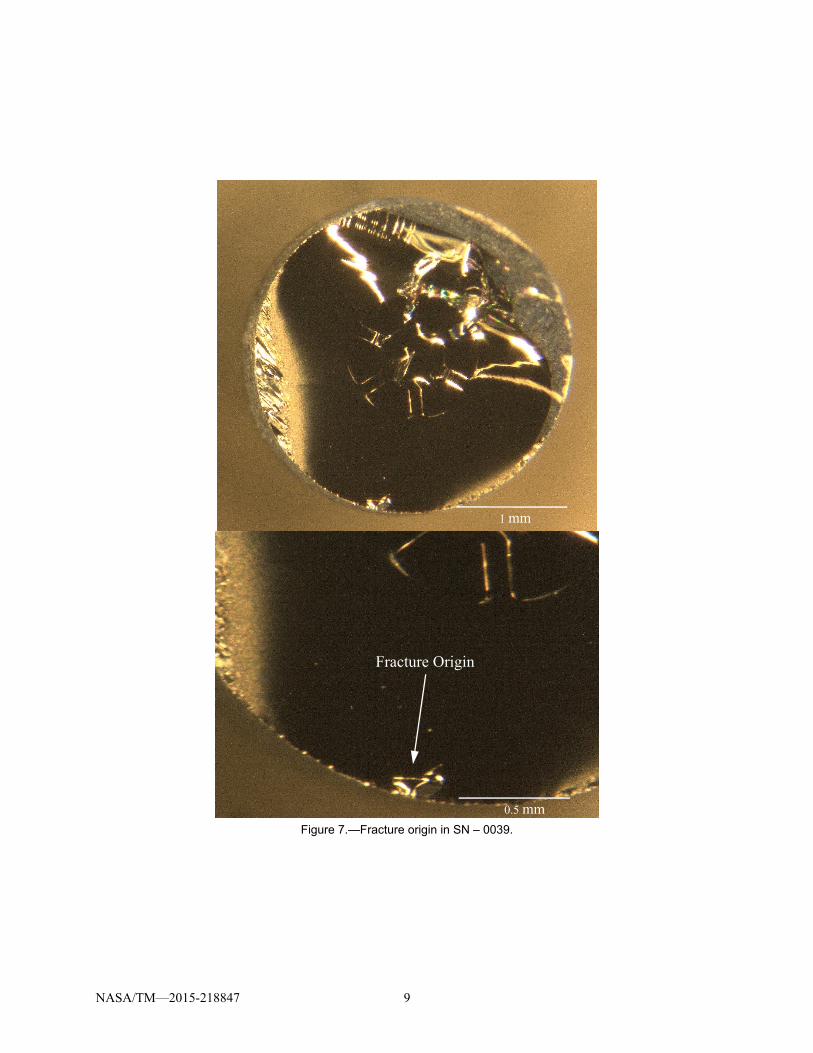
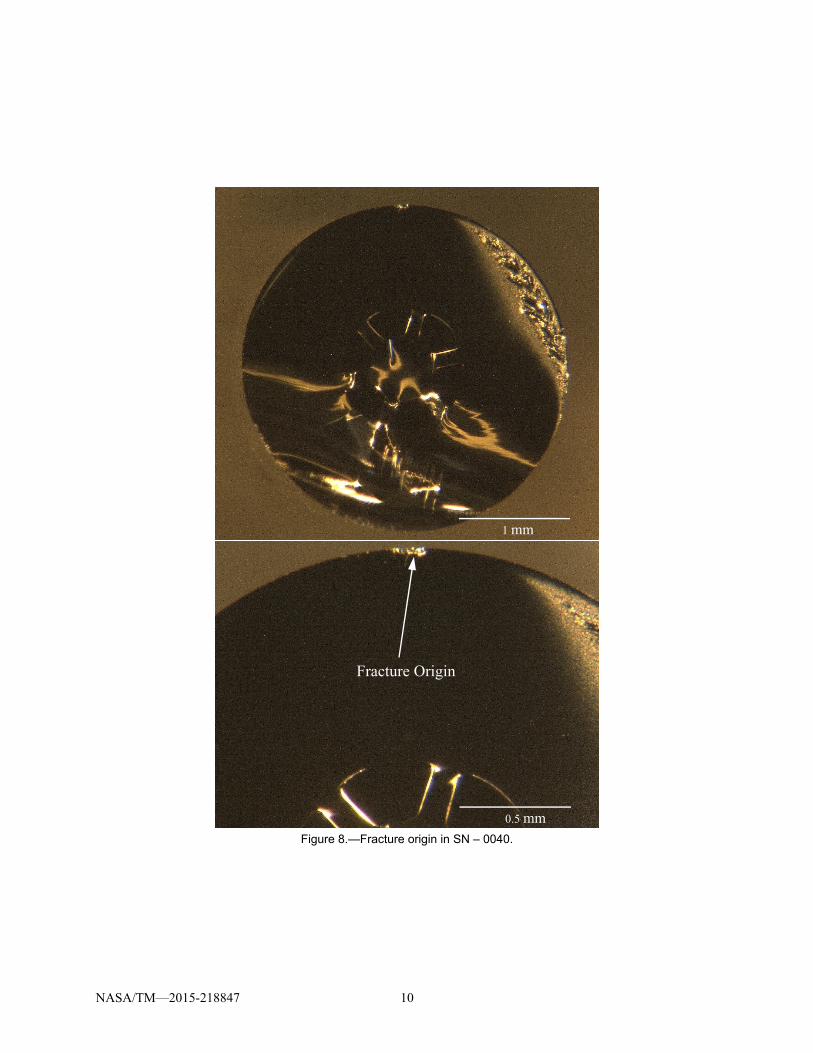
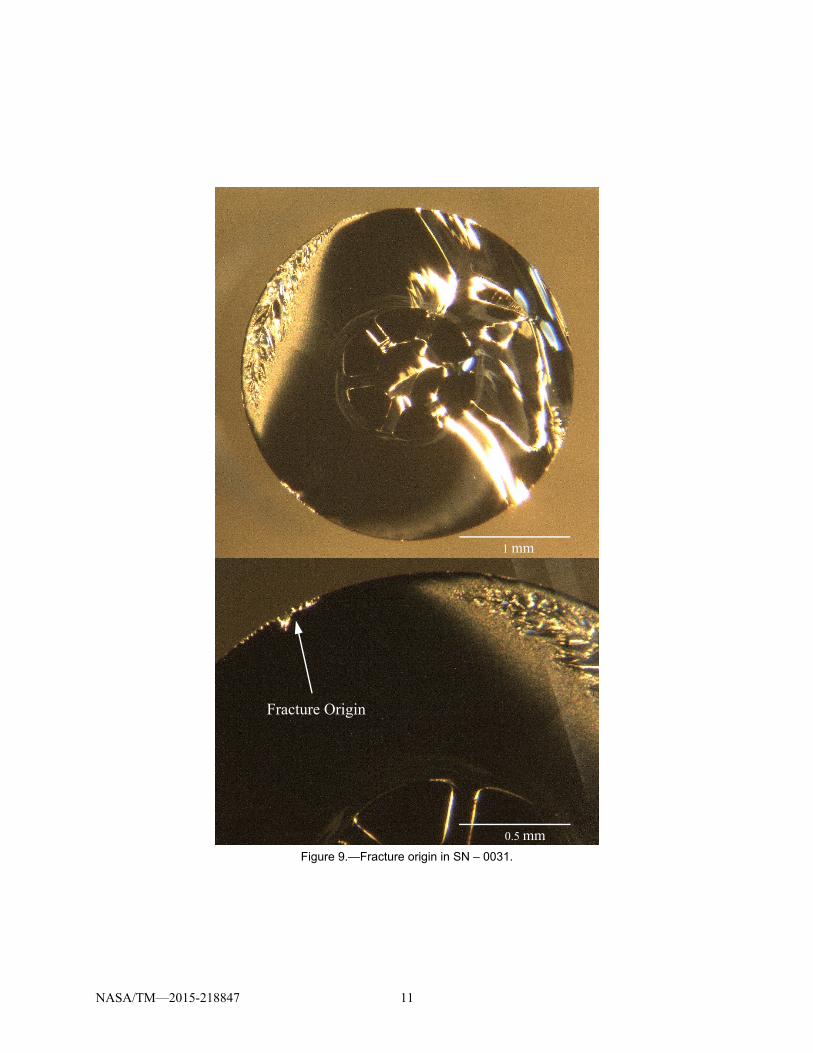
The fracture mirror radii associated with the mist and hackle regions were measured on thirty of the strength specimens. Figures 6 to 9 show example fracture surfaces, which were frequently asymmetric. Fracture was the result of surface damage, shown in Figure 10, in the form of scratches, checks, and gouges. Because the strengths were narrowly distributed, the mirror constants were estimated point wise from, rather than by curve fitting of, the function
i
if
r
A = S (2)
where Ai is the particular boundary constant and ri is the corresponding boundary radius. The resultant mirror-mist and mist-hackle constants were AM = 1.40.1 and AH = 1.60.1 MPam.
Fracture Toughness
Fracture toughness was estimated from the size of the failure origins on fracture strength specimens exhibiting relatively symmetric mirror patterns along with the Newman-Raju equations (Ref. 3). Use of a stress intensity factor coefficient solution of a cracked rod (Ref. 4) gave similar results. The measured value of KI = 0.570.03 MPam is similar to that of the other highly alloyed glasses (Ref. 5) shown in Table 2 (0.50 to 0.75 MPam in air).
NASA/TM—2015-218847 3
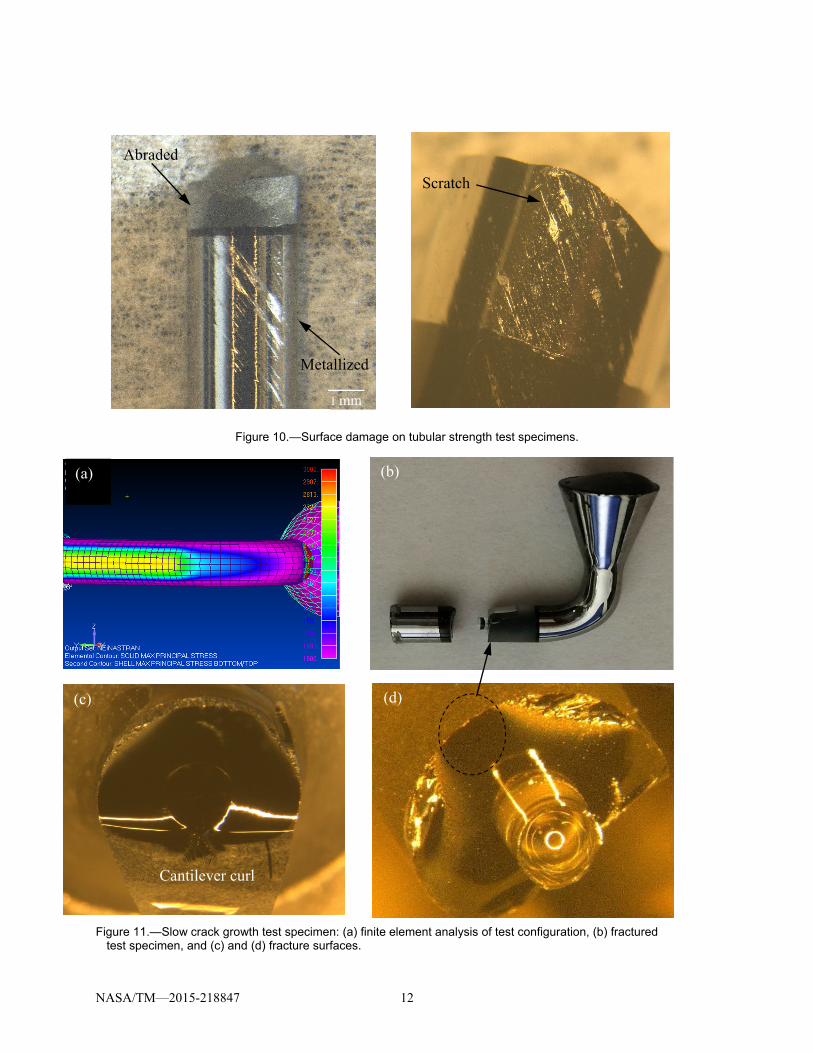
Slow Crack Growth
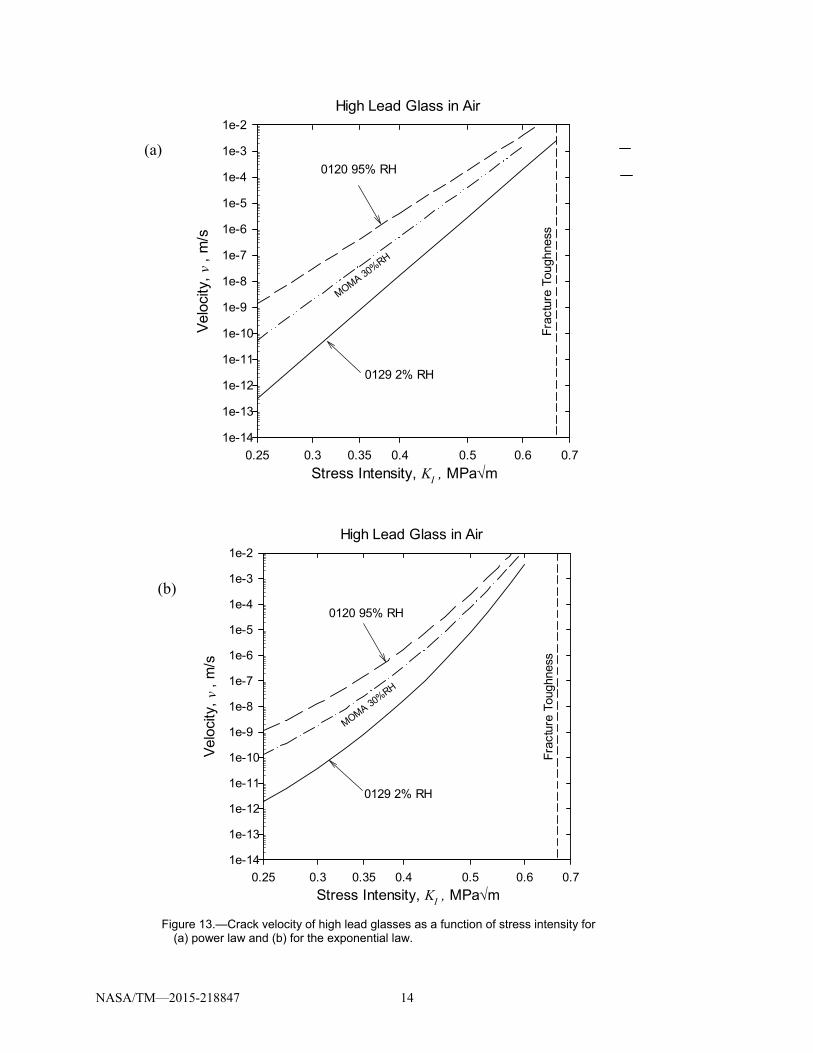
Slow crack growth properties were measured by method ASTM International C1368 with the exception of the specimen used: instead of standard beams or disks, funnels were tested by applying a bending moment via loading at the edge of the funnel mouth, thereby allowing the inherent crack growth mechanisms to be exhibited. Failure typically occurred in the abraded region of the funnel stem, as shown in Figure 11. The symmetry and cantilever curl exhibited on the fracture surface imply that simple bending was achieved in the tests, Figure 11(c). The resultant fracture strength is shown in Figure 12 and the crack velocity curves are shown in Figure 13 for the power and exponential functions, given respectively as
]K
K[AKA = dt
da = v n
IC
InI
11 *11 (3)
and
Ic
II K
KnA KnA
dt
da = v *
2222 expexp (4)
where v, a, and t are crack velocity, crack size, and time, respectively. Constants A and n are the material/environment dependent SCG parameters, and KI and KIC are, respectively, the Mode I stress intensity factor and the critical stress intensity factor or fracture toughness. The parameters are summarized in Table 3. The MOMA glass exhibits similar cracks growth parameters as Corning 0120, another high lead glass.
All of the funnel test specimens used to estimate SCG parameters failed in the abraded region of the constant moment section. However, it is noteworthy that during testing in air, several specimens failed at low stress due to large, spurious flaws located in the metallized section of the spout. When testing in dry nitrogen, the problem was exacerbated and failure frequently occurred in the metallized region. The spurious flaws can only be eliminated via inspection or proof testing.
Summary
The strength, fracture toughness, slow crack growth parameters and Young’s modulus of a high lead glass were measured. The high lead glass exhibits lower fracture toughness and is more susceptible to slow crack growth than soda-lime silicate. In general, glasses modified with oxides such as PbO and BaO exhibit lower fracture toughness and are more susceptible to stress corrosion than high purity glasses such as fused silica (n = 40) (Ref. 5).
References
1. S.W. Freiman, T.L. Baker, and J.B. Wachtman, Jr. “A Computerized Fracture Mechanics Database for Oxide Glasses,” NBS Technical Note 1212 (National Bureau of Standards, 1985).
2. M. Khanisanij and H. Abdul Aziz Sidek, “Elastic Behavior of Borate Glasses Containing Lead and Bismuth Oxides,” Advances in Materials Science and Engineering Volume 2014, Article ID 452830.
3. J.C. Newman and I.S. Raju, “An Empirical Stress Intensity Factor Equation for the Surface Crack,” Engineering Fracture Mechanics 15 [1-2] 1981, pp. 185-192.
4. Y. Murakami and H. Tsuru, “Stress-Intensity Factor Equations for a Semi-Elliptical Surface Crack in a Shaft under Bending,” Stress Intensity Factors Handbook, Soc. Mater. Sci., Japan, (1986).
5. J. Salem and R. Tandon, “Test Method Variability in Slow Crack Growth Properties of Sealing Glasses,” International Journal of Fatigue, 32, 557-564 (March 2010).
NASA/TM—2015-218847 4
TABLE 1.—STRENGTH STATISTICS OF SPIRAL TUBES Failure location
Number tested
Average Sf (MPa)
Standard deviation
CV, percent
Weibull m
MPa
All 40 61.3 5.3 9 14.1 63.5
Unabraded 6 61.1 8.0 13 10.6 74.5
Metallized 6 61.6 5.2 8 14.0 71.5
Abraded 28 61.2 4.9 8 14.8 64.8
TABLE 2.—FRACTURE TOUGHNESS (MPam) OF GLASSES (REF. 5) Material Environment
Air (%RH/F) Dry N2
MOMA 0.570.03 (30/74) 0.690.01 Corning 0120 0.500.02 (34/76) 0.670.02 Electro-Glass 2164 0.610.05 (32/73) 0.740.03 Schott S8061 0.640.01 (23/73) 0.720.02 Schott S8070 1.570.03 (60/73) 1.900.03 Schott 8330 0.610.04 (60/73) 0.720.04 Soda lime silicate 0.750.04 (35/73) 0.800.01 Ba-doped 0.720.002 (23/73) 0.760.01 Silica, 7980 0.730.04 (45/75) 0.770.02
TABLE 3.—SUMMARY OF SLOW CRACK GROWTH (SCG) PARAMETERS FOR GLASSES (REF. 5) Material and relative
humidity n B
MPa2 .s
Am/s (MPam)-n
n2
(MPam)–n
A2
m/s
# Tested
MOMA, 30% RH 19.52.1 2.5 1.910+1 51.5 2.310–16 25 0120, 95% RH 17.03.1 0.6 2.410+1 49.2 5.310–15 36 0120, 2% RH 23.25.3 4.3 2.810+1 61.1 4.210–19 30 2164, 95% RH 12.91.1 6 2.310–1 36.7 1.710–13 65 2164, 2% RH 22.13.9 39 3.010–1 36.6 1.710–16 48 S8070, 95% RH 19.82.6 60 4.910–9 16.1 3.910–16 25 S8070, 2% RH 25.03.9 3,079 2.610–12 17.1 2.810–19 25 8330, 95% RH 17.11.3 5 5.610–1 40.8 6.410–15 25 8330, 3% RH 24.53.9 19 8.010–1 38.1 1.610–16 30 8330, 1% RH 30.03.6 2,855 2.110–2 38.3 1.810–18 30 Soda Lime Silicate, H2O 20.10.9 5 7.510–1 45.1 8.610–17 30 7980, Fused Silica, H2O 39.33.2 0.00013 1.110+7 88.3 1.210–24 50
NASA/TM—2015-218847 5
Figure 1.—Fracture cross section of strength test specimens.
Figure 2.—Dyanmic modulus and density.
57
58
59
60
4.62 4.64 4.66 4.68 4.70 4.72
Young's Modulus, GPa
Density, g/cc
E = 58.5 ± 0.6 GPa
1 mm
NASA/TM—2015-218847 6
Figure 3.—Weibull distribution for all the data, as determined with rank regression.
Figure 4.—Weibull distributions censored by fracture location.
NASA/TM—2015-218847 7
Figure 5.—Log normal distribution for all the data.
NASA/TM—2015-218847 8
Figure 6.—Fracture origin in SN – 0035.
Fracture Origin
1 mm
0.5 mm
NASA/TM—2015-218847 9
Figure 7.—Fracture origin in SN – 0039.
Fracture Origin
1 mm
0.5 mm
NASA/TM—2015-218847 10
Figure 8.—Fracture origin in SN – 0040.
Fracture Origin
1 mm
0.5 mm
NASA/TM—2015-218847 11
Figure 9.—Fracture origin in SN – 0031.
Fracture Origin
1 mm
0.5 mm
NASA/TM—2015-218847 12
Figure 10.—Surface damage on tubular strength test specimens.
Figure 11.—Slow crack growth test specimen: (a) finite element analysis of test configuration, (b) fractured test specimen, and (c) and (d) fracture surfaces.
Cantilever curl
(a) (b)
(c) (d)
Abraded
Metallized
Scratch
1 mm

NASA/TM—2015-218847 13
Figure 12.—Fracture strength as function of stress rate. Insets
show typical fracture mirrors.
NASA/TM—2015-218847 14
High Lead Glass in Air
Stress Intensity, KI , MPam0.25 0.3 0.4 0.5 0.6 0.70.35
Vel
ocity
, v
, m
/s
1e-14
1e-13
1e-12
1e-11
1e-10
1e-9
1e-8
1e-7
1e-6
1e-5
1e-4
1e-3
1e-2
Fra
ctur
e To
ughn
ess
0120 95% RH
0129 2% RH
MOMA 30%RH
High Lead Glass in Air
Stress Intensity, KI , MPam0.25 0.3 0.4 0.5 0.6 0.70.35
Vel
ocity
, v
, m
/s
1e-14
1e-13
1e-12
1e-11
1e-10
1e-9
1e-8
1e-7
1e-6
1e-5
1e-4
1e-3
1e-2F
ract
ure
Toug
hnes
s
0120 95% RH
0129 2% RH
MOMA 30%RH
Figure 13.—Crack velocity of high lead glasses as a function of stress intensity for
(a) power law and (b) for the exponential law.
(b)
(a)