Embed Size (px)
Citation preview
materials
Article
Mechanical Properties and Microstructure of TIG and ATIGWelded 316L Austenitic Stainless Steel with Multi-ComponentsFlux Optimization Using Mixing Design Method and ParticleSwarm Optimization (PSO)
Abdeljlil Chihaoui Hedhibi 1,2 , Kamel Touileb 2, Rachid Djoudjou 2,*, Abousoufiane Ouis 2, Hussein Alrobei 2
and Mohamed M. Z. Ahmed 2,3,*
�����������������
Citation: Hedhibi, A.C.; Touileb, K.;
Djoudjou, R.; Ouis, A.; Alrobei, H.;
Ahmed, M.M.Z. Mechanical
Properties and Microstructure of TIG
and ATIG Welded 316L Austenitic
Stainless Steel with Multi-
Components Flux Optimization
Using Mixing Design Method and
Particle Swarm Optimization (PSO).
Materials 2021, 14, 7139. https://
doi.org/10.3390/ma14237139
Academic Editors: Lihong Su and
Andrea Di Schino
Received: 25 October 2021
Accepted: 22 November 2021
Published: 24 November 2021
Publisher’s Note: MDPI stays neutral
with regard to jurisdictional claims in
published maps and institutional affil-
iations.
Copyright: © 2021 by the authors.
Licensee MDPI, Basel, Switzerland.
This article is an open access article
distributed under the terms and
conditions of the Creative Commons
Attribution (CC BY) license (https://
creativecommons.org/licenses/by/
4.0/).
1 Department of Mechanical Engineering, National Engineering School of Tunis (ENIT), El-Manar University,P.O. Box 37, Belvedere Tunis, Tunis 1002, Tunisia; [email protected]
2 Department of Mechanical Engineering, College of Engineering in Al-Kharj, Prince Sattam bin AbdulazizUniversity, P.O. Box 655, Al-Kharj 16273, Saudi Arabia; [email protected] (K.T.);[email protected] (A.O.); [email protected] (H.A.)
3 Department of Metallurgical and Materials Engineering, Faculty of Petroleum and Mining Engineering,Suez University, Suez 43512, Egypt
* Correspondence: [email protected] (R.D.); [email protected] (M.M.Z.A.)
Abstract: In this study, the effects of pseudo-ternary oxides on mechanical properties and microstruc-ture of 316L stainless steel tungsten inert gas (TIG) and activating tungsten inert gas (ATIG) weldedjoints were investigated. The novelty in this work is introducing a metaheuristic technique calledthe particle swarm optimization (PSO) method to develop a mathematical model of the ultimatetensile strength (UTS) in terms of proportions of oxides flux. A constrained optimization algorithmavailable in Matlab 2020 optimization toolbox is used to find the optimal percentages of the selectedpowders that provide the maximum UTS. The study indicates that the optimal composition of fluxwas: 32% Cr2O3, 43% ZrO2, 8% Si2O, and 17% CaF2. The UTS was 571 MPa for conventional TIGweld and rose to 600 MPa for the optimal ATIG flux. The obtained result of hardness for the optimalATIG was 176 HV against 175 HV for conventional TIG weld. The energy absorbed in the weld zoneduring the impact test was 267 J/cm2 for the optimal ATIG weld and slightly higher than that ofconventional TIG weld 256 J/cm2. Fracture surface examined by scanning electron microscope (SEM)shows ductile fracture for ATIG weld with small and multiple dimples in comparison for TIG weld.Moreover, the depth of optimized flux is greater than that of TIG weld by two times. The ratio D/Wwas improved by 3.13 times. Energy dispersive spectroscopy (EDS) analysis shows traces of thesulfur element in the TIG weld zone.
Keywords: ATIG welding; mixing design method; particle swarm optimization (PSO); pseudo-ternary flux; 316L SS; mathematical modeling; mechanical properties; microstructure
1. Introduction
Austenitic stainless steels are the most common stainless steel. They are used in manyfields as oil, shipbuilding, machinery, and marine applications. They are characterized bygood strength, high toughness, and excellent corrosion resistance. Fusion welding is themost popular method to join workpieces in many industrial applications.
Tungsten Inert Gas (TIG) welding is a widespread process in industries, but a limitedthickness can be joined in a single pass with this process. TIG welding is also very sensitiveto the chemical composition of the base metal. Moreover, materials thickness greater than3 mm requires multiple passes to achieve full penetration weld; therefore, the productivityof the process is reduced. The activated tungsten inert gas (ATIG) technic is a variant of
Materials 2021, 14, 7139. https://doi.org/10.3390/ma14237139 https://www.mdpi.com/journal/materials

Materials 2021, 14, 7139 2 of 17
conventional TIG welding. In ATIG welding, a thin layer of flux is deposited on the work-piece before the welding operation. ATIG offers the possibility of increasing the penetrationdepth using the same equipment and parameters as conventional TIG. Comparatively toTIG, ATIG has many advantages. It eliminates the need for edge preparation, increases thepenetration depth, and reduces the number of weld pass [1,2]. Three mechanisms havebeen proposed; the increase in ATIG weld penetration can be attributed to the reversal ofMarangoni convection [3,4]. The second mechanism is the arc constriction proposed by D.S. Howse et al. [5,6]. The third mechanism, proposed by Sire, consists of a constriction ofarc by using a flux characterized by high melting point and high electrical resistivity [7,8].In recent years, considerable works were carried out using Taguchi method design tooptimize TIG welding process parameters to improve both depth and weld aspects [9,10].Some studies were oriented to study the influence of welding parameters on enhancingmechanical properties [11,12]. Other works were dedicated to optimizing the compositionof paste to improve the depth and weld aspects [13,14] using the mixing method. Recently,other methods like genetic algorithms, simulated annealing, particle swarm optimiza-tion [15], etc., have been used to optimize solution in many industries [16,17]. In thiswork, the tensile strength of weld joints is optimized as an output parameter by varyingthe input parameters that are the combinations of oxides powder without varying thewelding parameters.
The objective of this work is to elaborate an appropriate composition of flux to improvemechanical properties of the full penetrated 316L stainless steel ATIG weld. Mixing methodsimplex design degree four was combined with particle swarm optimization (PSO) methodto optimize combination powders. The developed mathematical model and optimizationmethodology can help researchers and engineers working in developing fluxes for weldimprovements. This study is a contribution to expanding research dedicated to ATIGwelding of 316L.
2. Materials and Methods2.1. Material
The material used in this study is the austenitic stainless steel grade 316L. The chemicalcomposition is shown in Table 1. Rectangular pieces of 6 mm thickness were cut from thereceived plate to perform welding of 20 cm line.
Table 1. Chemical composition of 316L stainless steel.
Elements C Mn Si P S Cr Ni Mo N Cu Fe
Weight % 0.026 1.47 0.42 0.034 0.0016 16.60 10.08 2.14 0.044 0.50 Balance
2.2. TIG-ATIG Welding Platform
First of all, the plates were cleaned with acetone. The oxide powders were dried in thefurnace for 1 h at 180 ◦C to eliminate the humidity. Then, a thin layer of a mixed powderwith methanol was applied using a brush to the surface subject to the welding as shown inFigure 1a. The mean coating density of flux was about 4–5 mg/cm2.
The tungsten inert gas welding machine was used. The electrode used has a diameterof 3.2 mm and the torch was mounted on a motorized carriage as shown in Figure 1b. Theexperimental parameters selected for welding are presented in Table 2.

Materials 2021, 14, 7139 3 of 17Materials 2021, 14, x FOR PEER REVIEW 3 of 18
(a) (b)
Figure 1. The deposition of flux on the workpiece (a), motorized carriage (b).
Table 2. Welding parameters.
Parameters Range Welding speed 150 mm/min
Welding current 180 A Arc length 2 mm
Electrode tip angle 45° Shielding gas on the workpiece Argon with flow rate 10 L/min Shielding gas on the backside Argon with flow rate 5 L/min
Polarity DCEN
Figure 2a shows a good external aspect for TIG weld line, also surface ATIG weld line in Figure 2b is free of slugs, which indicates that the optimal flux is well consumed with small traces of residue.
(a) (b)
Figure 2. The external weld line appearance for TIG (a) and ATIG (b) weld lines.
Pieces were cut from the welded plates for mechanical testing, weld morphology, and microstructure study according to the schematic drawing shown in Figure 3. The cut-ting machine used is Hydro-Jet Eco 0515 SL-Micro waterjet Cutting (KNUTH Germany).
Figure 1. The deposition of flux on the workpiece (a), motorized carriage (b).
Table 2. Welding parameters.
Parameters Range
Welding speed 150 mm/minWelding current 180 A
Arc length 2 mmElectrode tip angle 45◦
Shielding gas on the workpiece Argon with flow rate 10 L/minShielding gas on the backside Argon with flow rate 5 L/min
Polarity DCEN
Figure 2a shows a good external aspect for TIG weld line, also surface ATIG weld linein Figure 2b is free of slugs, which indicates that the optimal flux is well consumed withsmall traces of residue.
Materials 2021, 14, x FOR PEER REVIEW 3 of 18
(a) (b)
Figure 1. The deposition of flux on the workpiece (a), motorized carriage (b).
Table 2. Welding parameters.
Parameters Range Welding speed 150 mm/min
Welding current 180 A Arc length 2 mm
Electrode tip angle 45° Shielding gas on the workpiece Argon with flow rate 10 L/min Shielding gas on the backside Argon with flow rate 5 L/min
Polarity DCEN
Figure 2a shows a good external aspect for TIG weld line, also surface ATIG weld line in Figure 2b is free of slugs, which indicates that the optimal flux is well consumed with small traces of residue.
(a) (b)
Figure 2. The external weld line appearance for TIG (a) and ATIG (b) weld lines.
Pieces were cut from the welded plates for mechanical testing, weld morphology, and microstructure study according to the schematic drawing shown in Figure 3. The cut-ting machine used is Hydro-Jet Eco 0515 SL-Micro waterjet Cutting (KNUTH Germany).
Figure 2. The external weld line appearance for TIG (a) and ATIG (b) weld lines.
Pieces were cut from the welded plates for mechanical testing, weld morphology, andmicrostructure study according to the schematic drawing shown in Figure 3. The cuttingmachine used is Hydro-Jet Eco 0515 SL-Micro waterjet Cutting (KNUTH Germany).

Materials 2021, 14, 7139 4 of 17Materials 2021, 14, x FOR PEER REVIEW 4 of 18
Figure 3. Schematic drawing showing test specimens.
2.3. Tensile Test Design of experiment and mathematical modelling will be applied to the tensile
strength property. Optimal flux, which will give the maximum UTS resulting from the tensile test, is used for the rest of the study.
The tensile tests were performed with a computer control electrohydraulic servo uni-versal testing machine model WAW-300E (Jinan testing equipment IE, Jinan, China), at a test rate of 0.5 mm/min, at 0.5 kN/s load rate, and at low strain rate of 1.6 × 10⁻⁴ s−1.
2.4. Weld Bead Aspect The cross-sections of the weld beads for ATIG with optimal flux and conventional
TIG were photographed using an optical microscope CAROLINA (CAROLINA, Burling-ton, NJ, USA). The morphology of the welds were checked using Motic Images plus ver-sion 2.0 software integrated with an optical microscope.
2.5. Microstructure Assessment The microstructural characterization of the fusion zone of both TIG and ATIG weld-
ing has been analyzed. Micrographs were taken on JEOL JSM-7600F scanning electronic microscope, (SEM). The areas image processing software from Microvision Instruments (Microvision Instruments, Imager M2.m, Paris, France) was used to measure the ferrite volume proportions.
2.6. Hardness Test Vickers hardness tests were performed by a digital hardness tester model HVS-50
(SCTMC, Shanghai, China) with a standard load of 98 N. Eight indentations in the weld bead on fusion zone (FZ) and at the heat-affected zone (HAZ) were performed on each sample, with about 0.5 mm between two indentations, as shown in Figure 4.
(a) (b)
Figure 4. Hardness test locations in the FZ and the HAZ of TIG (a) and ATIG (b) [13].
Figure 3. Schematic drawing showing test specimens.
2.3. Tensile Test
Design of experiment and mathematical modelling will be applied to the tensilestrength property. Optimal flux, which will give the maximum UTS resulting from thetensile test, is used for the rest of the study.
The tensile tests were performed with a computer control electrohydraulic servouniversal testing machine model WAW-300E (Jinan testing equipment IE, Jinan, China), ata test rate of 0.5 mm/min, at 0.5 kN/s load rate, and at low strain rate of 1.6 × 10⁻⁴ s−1.
2.4. Weld Bead Aspect
The cross-sections of the weld beads for ATIG with optimal flux and conventional TIGwere photographed using an optical microscope CAROLINA (CAROLINA, Burlington, NJ,USA). The morphology of the welds were checked using Motic Images plus version 2.0software integrated with an optical microscope.
2.5. Microstructure Assessment
The microstructural characterization of the fusion zone of both TIG and ATIG weldinghas been analyzed. Micrographs were taken on JEOL JSM-7600F scanning electronicmicroscope, (SEM). The areas image processing software from Microvision Instruments(Microvision Instruments, Imager M2.m, Paris, France) was used to measure the ferritevolume proportions.
2.6. Hardness Test
Vickers hardness tests were performed by a digital hardness tester model HVS-50(SCTMC, Shanghai, China) with a standard load of 98 N. Eight indentations in the weldbead on fusion zone (FZ) and at the heat-affected zone (HAZ) were performed on eachsample, with about 0.5 mm between two indentations, as shown in Figure 4.
Materials 2021, 14, x FOR PEER REVIEW 4 of 18
Figure 3. Schematic drawing showing test specimens.
2.3. Tensile Test Design of experiment and mathematical modelling will be applied to the tensile
strength property. Optimal flux, which will give the maximum UTS resulting from the tensile test, is used for the rest of the study.
The tensile tests were performed with a computer control electrohydraulic servo uni-versal testing machine model WAW-300E (Jinan testing equipment IE, Jinan, China), at a test rate of 0.5 mm/min, at 0.5 kN/s load rate, and at low strain rate of 1.6 × 10⁻⁴ s−1.
2.4. Weld Bead Aspect The cross-sections of the weld beads for ATIG with optimal flux and conventional
TIG were photographed using an optical microscope CAROLINA (CAROLINA, Burling-ton, NJ, USA). The morphology of the welds were checked using Motic Images plus ver-sion 2.0 software integrated with an optical microscope.
2.5. Microstructure Assessment The microstructural characterization of the fusion zone of both TIG and ATIG weld-
ing has been analyzed. Micrographs were taken on JEOL JSM-7600F scanning electronic microscope, (SEM). The areas image processing software from Microvision Instruments (Microvision Instruments, Imager M2.m, Paris, France) was used to measure the ferrite volume proportions.
2.6. Hardness Test Vickers hardness tests were performed by a digital hardness tester model HVS-50
(SCTMC, Shanghai, China) with a standard load of 98 N. Eight indentations in the weld bead on fusion zone (FZ) and at the heat-affected zone (HAZ) were performed on each sample, with about 0.5 mm between two indentations, as shown in Figure 4.
(a) (b)
Figure 4. Hardness test locations in the FZ and the HAZ of TIG (a) and ATIG (b) [13]. Figure 4. Hardness test locations in the FZ and the HAZ of TIG (a) and ATIG (b) [13].

Materials 2021, 14, 7139 5 of 17
2.7. Impact Test
Impact testing was performed on three samples for TIG and three samples for ATIGweld only in the fusion zone (FZ) with the Charpy “V” notch impact testing machine modelJBS-500 (Jinan testing equipment IE, Jinan, China), specimens are shown in Figure 5.
Materials 2021, 14, x FOR PEER REVIEW 5 of 18
2.7. Impact Test Impact testing was performed on three samples for TIG and three samples for ATIG
weld only in the fusion zone (FZ) with the Charpy “V” notch impact testing machine model JBS-500 (Jinan testing equipment IE, Jinan, China), specimens are shown in Figure 5.
Figure 5. Sample for impact test “V” notch in the fusion zone (FZ) of TIG and ATIG Welded.
2.8. Design of Experiment Methodology To get the maximum amount of useful information with the least amount of experi-
mentation, the design of experiments (DOE) has been used; mixing method in Minitab 17 software was applied. First, to compare the effect of the mono-flux oxides on UTS of welds, thirteen oxides (SiO2, TiO2, Fe2O3, MnO2, Cr2O3, ZrO2, CaO, Mn2O3, V2O5, MoO3, SrO, Co2O3, and MgO) were tested. Among these thirteen oxides, three oxides Cr2O3, TiO2, and ZrO2 that gave the best UTS were selected to be used in the mixing design method. Based on the simplex lattice degree four designs, nineteen combinations from the selected oxides have been prepared. For each combination, the three selected oxides Cr2O3, TiO2, and ZrO2 vary and 25% of (8% SiO2 + 17% CaF2) was added and kept fixed to get a pseudo ternary combination. Particle swarm optimization (PSO) method is used to establish an equation relating UTS to the proportions of the selected oxides. Finally, Matlab R2020 is carried out to obtain the optimal combination of oxides, hence, to maximize the UTS of weld through a constrained optimization algorithm.
Silica (SiO2) has been added because it increases the current carrying capacity. Con-sequently, silicate (SiO2) increases arc voltage and depth penetration of the weld bead [18]. On the other hand, the addition of calcium fluoride (CaF2) had several advantages in that it reduces the dissolved silicon content of weld metal, prevents the deleterious effect of silicon on hot cracking, and lowers the melting range of the flux. Moreover, fluorine gases escaped from the weld pool interact with outer arc electrons leading to constrict arc [19]. The presence of fluorine in arc welding reduces the anode spot and tends to increase the energy density of the heat source and electromagnetic force in the weld pool. As a result, relatively narrow and deep weld morphology is formed [20,21]. Nineteen weld lines were executed and three samples were cut for the tensile test from each of the nineteen combi-nations.
2.9. Mathematical Modelling For the first step of work, we developed a mathematical model where the UTS is
written in terms of these selected oxides’ percentages. The technic used to get a mathe-matical model will be presented later in this paper. In the second step, the optimal combi-nation that maximizes UTS is determined.
Figure 5. Sample for impact test “V” notch in the fusion zone (FZ) of TIG and ATIG Welded.
2.8. Design of Experiment Methodology
To get the maximum amount of useful information with the least amount of exper-imentation, the design of experiments (DOE) has been used; mixing method in Minitab17 software was applied. First, to compare the effect of the mono-flux oxides on UTS ofwelds, thirteen oxides (SiO2, TiO2, Fe2O3, MnO2, Cr2O3, ZrO2, CaO, Mn2O3, V2O5, MoO3,SrO, Co2O3, and MgO) were tested. Among these thirteen oxides, three oxides Cr2O3, TiO2,and ZrO2 that gave the best UTS were selected to be used in the mixing design method.Based on the simplex lattice degree four designs, nineteen combinations from the selectedoxides have been prepared. For each combination, the three selected oxides Cr2O3, TiO2,and ZrO2 vary and 25% of (8% SiO2 + 17% CaF2) was added and kept fixed to get a pseudoternary combination. Particle swarm optimization (PSO) method is used to establish anequation relating UTS to the proportions of the selected oxides. Finally, Matlab R2020 iscarried out to obtain the optimal combination of oxides, hence, to maximize the UTS ofweld through a constrained optimization algorithm.
Silica (SiO2) has been added because it increases the current carrying capacity. Conse-quently, silicate (SiO2) increases arc voltage and depth penetration of the weld bead [18].On the other hand, the addition of calcium fluoride (CaF2) had several advantages in thatit reduces the dissolved silicon content of weld metal, prevents the deleterious effect ofsilicon on hot cracking, and lowers the melting range of the flux. Moreover, fluorine gasesescaped from the weld pool interact with outer arc electrons leading to constrict arc [19].The presence of fluorine in arc welding reduces the anode spot and tends to increasethe energy density of the heat source and electromagnetic force in the weld pool. As aresult, relatively narrow and deep weld morphology is formed [20,21]. Nineteen weld lineswere executed and three samples were cut for the tensile test from each of the nineteencombinations.
2.9. Mathematical Modelling
For the first step of work, we developed a mathematical model where the UTS is writ-ten in terms of these selected oxides’ percentages. The technic used to get a mathematicalmodel will be presented later in this paper. In the second step, the optimal combinationthat maximizes UTS is determined.
Finally, based on the optimal formulation, ATIG and TIG weld lines have been carriedout on a single plate.

Materials 2021, 14, 7139 6 of 17
3. Results and Discussion3.1. Tensile Test3.1.1. Selection of Candidate Oxides
Thirteen oxides were tested. The weld line was executed on the plain plate usingwelding parameters cited in Table 2. It can be seen in Table 3 that the highest value of UTSis 565 MPa, which was obtained for the sample welded with ZrO2 flux, followed by thesample welded with Cr2O3 flux with 559 MPa and, then by the sample welded with TiO2flux with 542 MPa. Therefore, the selected oxides were Cr2O3, TiO2, and ZrO2.
Table 3. UTS (MPa) for different ATIG mono-oxide welds.
Oxide SiO2 TiO2 Fe2O3 MnO2 Cr2O3 ZrO2 CaO Mn2O3 V2O5 MoO3 SrO Co2O3 MgO
UTS 529 542 538 539 559 565 536 534 481 491 338 506 523
3.1.2. Mixture Design Combinations and UTS Response Values
Based on the simplex lattice degree four design, nineteen combinations have beenprepared. As shown in Table 4, for each combination, the three selected oxides Cr2O3, TiO2,and ZrO2 vary and 25% of (8% SiO2 + 17% CaF2) is kept fixed.
Table 4. Different pseudo-ternary combinations with the three selected oxides.
Exp. No. Cr2O3[Weight %]
TiO2[Weight %]
ZrO2[Weight %]
SiO2 + CaF2[Weight %]
1 56.25 18.75 0.00 252 56.25 0.00 18.75 253 37.50 18.75 18.75 254 37.50 0.00 37.50 255 37.50 37.50 0.00 256 18.75 56.25 0.00 257 18.75 37.50 18.75 258 18.75 18.75 37.50 259 0.00 56.25 18.75 2510 0.00 37.50 37.50 2511 0.00 18.75 56.25 2512 25.00 25.00 25.00 2513 50.00 12.50 12.50 2514 12.50 50.00 12.50 2515 12.50 12.50 50.00 2516 75.00 0.00 0.00 2517 0.00 75.00 0.00 2518 0.00 0.00 75.00 2519 18.75 0.00 56.25 25
Table 5 shows the Tensile test (UTS) results as well as the standards deviation (σ).The value of σ is less than 21 MPa for UTS results, which indicates that the disparities areacceptable.
Materials 2021, 14, 7139 7 of 17
Table 5. UTS of a set of experiments with the different combinations and the related standarddeviation σ.
Exp. No.Number
ofTests
Max.UTS
[MPa]
Min.UTS
[MPa]
AverageUTS
[MPa]
σ
StandardDeviation
1 3 577 552 564 12.582 3 592 587 590 2.513 3 595 575 578 16.164 3 590 557 579 19.055 3 570 538 551 16.826 3 577 541 558 18.147 3 594 560 582 19.348 3 590 556 579 19.629 3 585 557 575 15.88
10 3 600 563 587 20.5511 3 594 561 581 17.7812 3 594 558 582 20.7813 3 592 558 579 18.3514 3 596 560 582 19.5015 3 593 562 582 17.6116 3 570 558 563 6.0217 3 555 542 550 6.8018 3 585 565 580 11.5419 3 593 591 592 1.15
3.1.3. Mathematical Model
In this study, the three selected oxides (Cr2O3, TiO2, ZrO2) percentages vary for thecombined oxide with a fixed 25% of (SiO2+ CaF2) oxide to form the pseudo-ternary ATIGare used. The UTS is then expressed as a function of the percentages of the three oxidesas follows:
UTS = f (X1, X2, X3, X4). X1, X2, X3 denote, respectively, the proportions (in terms ofpercentages) of the three oxides, whereas the proportion of the fourth oxide is set to beX4 = 25%.
The chosen mathematical model that describes the effect of these percentages on theUTS is the coupling of second-order model as proposed in [22] with conventional linearregression as in [23]. This model includes three components: (i) the linear effect of theproportions, (ii) their quadratic effects, and (iii) the interactions between those proportions.The general form of the mathematical model is given below in expression 1:
UTS (predicted) = (α1)*X(1) + (α2)*X(2) + (α3)*X(3) + (α4)*X(1)*X(1) + (α5)*X(2)*X(2) + (α6)*X(3)*X(3) +
(α7)*X(1)*X(2) + (α8)*X(1)*X(3) + (α9)*X(2)*X(3) + (α10)*X(4)(1)
With a fixed X(4) = 25%.
3.1.4. Optimization Process Details
The first step objective was to find the optimal parameters that minimize the quadraticerror between the measured UTS and the UTS provided by the model. Thus, the mod-eling problem is converted into an optimization problem having the model coefficientsas decision variables and the quadratic error as the objective function to be minimized.Since this problem may present many irregularities such as non-convexity of the criterionand many feasibility constraints, we used a metaheuristic technique called particle swarmoptimization (PSO) to solve this problem. In PSO, a set of candidate solutions (coefficientsof the model) are initialized randomly within the search-space limits and then “flown”progressively toward a sub-optimal solution while combining three components: (i) followtheir current velocities, (ii) go back to their best positions visited so far, and (iii) go to the

Materials 2021, 14, 7139 8 of 17
position of the best neighbor. Each particle in the group (called swarm) is assigned fourvectors: the position including the model parameters, a velocity, the best personal position,and the global best position. The move equations of each particle at the kth iteration of theoptimization process are provided below [24,25]:
Vik+1 = wkVi
k + c1r1
(Pi − αi
)+ c2r2
(Gi − αi
)(2)
αik+1 = αi
k + Vik+1 (3)
wk = wmax −wmax − wmin
kmax× k (4)
As provided in many papers such as [24,25], the inertia weight decreases linearly from0.9 to 0.4. c1 = c2 = 0.75 are the cognitive and social factors. r1 and r2 are two randomnumbers generated randomly between 0 and 1. The model parameters’ search limits areset, respectively, to −1 and +1 for the overall model stability [25]. The optimization processis stopped after a certain number of iterations (kmax = 5000). After this global search step, alocal search is conducted to find better solutions around the global sub-optimal solutionyielded by the PSO algorithm. After running the optimization process many times, theselected UTS model as expressed by X1, X2, and X3 is given below:
UTS (predicted)= −0.7940(%Cr2O3) + 0.1706(%TiO2) + 0.3442(%ZrO2)+0.1094(%Cr2O3)
2 + 0.0944(%TiO2)2 + 0.0959(%ZrO2)
2
+0.2032(%Cr2O3)(%TiO2) + 0.2173(%Cr2O3)(%ZrO2)+0.2047(%TiO2)(%ZrO2) + 0.4231
(5)
Three performance metrics are used to evaluate the effectiveness of the developedmodels as follows [25]:
Mean Absolute Percentage Error (MAPE (%)):
MAPE =100N2
N2
∑t=1
|UTS(t)−UTSpredicted(t)|UTS mean
(6)
• Coefficient of determination (R2 (%))
R2 = 100×(
1−1
N2∑N2
t=1(UTS(t)−UTSpredicted(t))2
1N2
∑N2t=1(UTS(t)−UTS mean)2
)(7)
• Root Mean Square Error (RMSE (MPa))
RMSE =
√√√√ 1N2
N2
∑t=1
(UTS(t)−UTSpredicted(t))2 (8)
With N2 = 19 (number of measurements)
The accuracy of this model as measured by the above cited measurement indicatorsare found to be as follows: MAPE = 0.7952%, R2 = 72.04%, and RMSE = 5.5955 MPa.
The second step of the optimization process consists of finding the optimal percent-ages of the three oxides that provide the maximum UTS. To achieve this goal, a constrainedoptimization algorithm is used. This algorithm has provided the following optimal combi-nation shown in Table 6. The predicted value is UTS = 588 MPa as shown in Table 7.
Materials 2021, 14, 7139 9 of 17
Table 6. The optimal composition of flux.
Variables Cr2O3 TiO2 ZrO2 SiO2 CaF2
Single Percentages 32% 0% 43% 8% 17%Combined Percentages 75% (Cr2O3 + ZrO2) 25% (SiO2 + CaF2)
Table 7. Predicted responses UTS of weld executed with optimal flux.
Response Predicted Response (MPa)
UTS 588.27
3.1.5. Experimental Validation
The validation test was the last step in the experimental process. A confirmationtest was performed according to the optimum flux composition. Table 8 shows that UTSfor ATIG weld reached 600 MPa, which is higher than that of conventional TIG welding(571 MPa). Moreover, the UTS of ATIG weld is greater than the expected value calculatedby the mathematical model (588 MPa). The UTS of the optimal flux (ATIG) weld (600 MPa)is close to that of base metal (624 MPa) shown in Table 9. The ATIG welding can reduce theheat input per unit length in welds and the residual stress of the weld can be reduced [26,27].On the other hand, the increase of UTS about 29 MPA in favor of ATIG comparativelyto conventional TIG weld can be attributed to the increase of the retained ferrite volumeproportions ATIG weld. Moreover, high heat input in TIG weld exhibits a coarse ferritedistribution and lower strength than the lower heat input in ATIG weld, which has arelatively fine ferrite distribution [27]. The value of standard deviation (σ) is less than5 MPa.
Table 8. Results of UTS (MPa) and standard deviation of TIG and ATIG.
Sample Number ofTests
UTSMax.
UTSMin.
UTSMean
StandardsDeviation (σ)
TIG 4 578 568 571 4.57ATIG 4 602 596 600 2.1
Table 9. UTS comparison between mathematical model, ATIG, TIG, and base metal.
Sample UTS (MPa)
Expected value by mathematical model 588Optimal combination (ATIG) 600
TIG 571Base metal (SS316L) 624
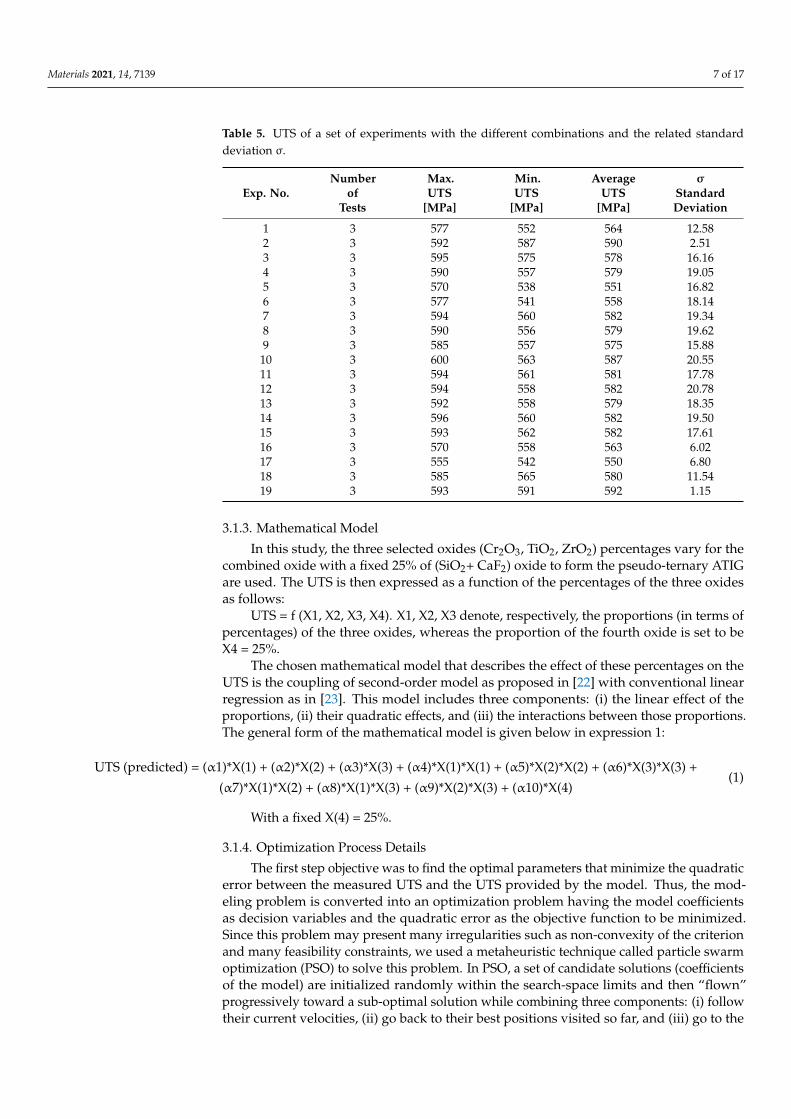
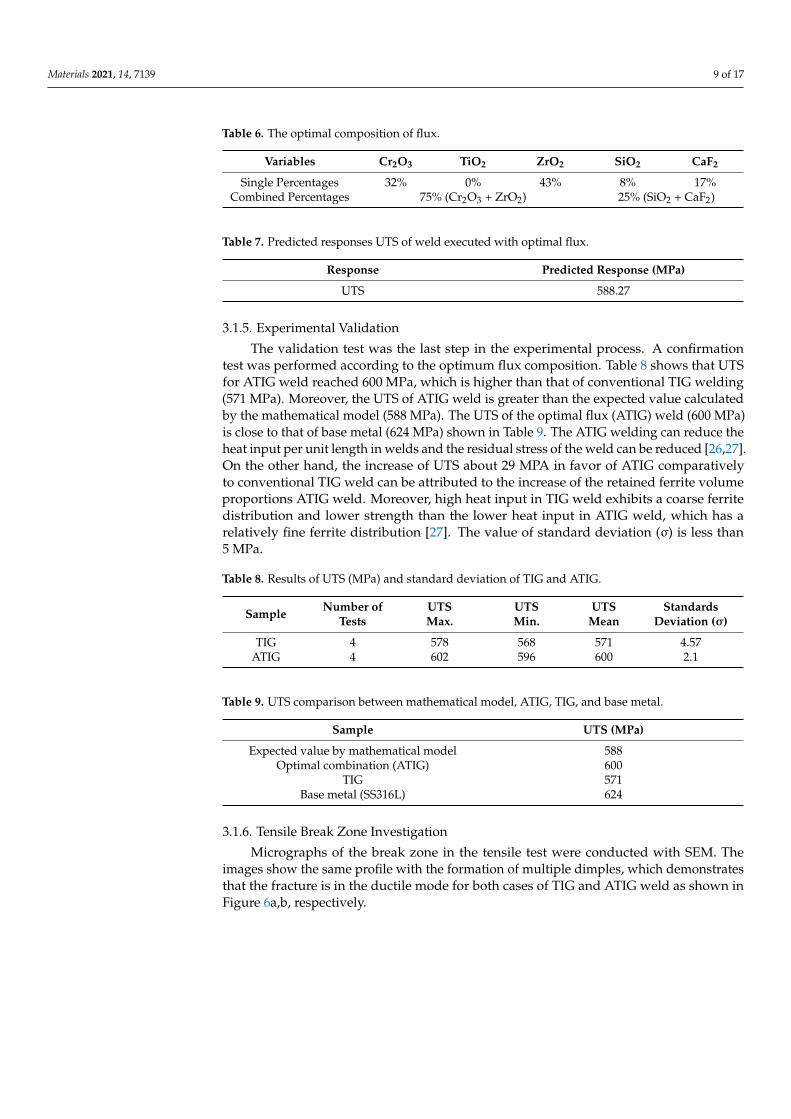
3.1.6. Tensile Break Zone Investigation
Micrographs of the break zone in the tensile test were conducted with SEM. Theimages show the same profile with the formation of multiple dimples, which demonstratesthat the fracture is in the ductile mode for both cases of TIG and ATIG weld as shown inFigure 6a,b, respectively.
Materials 2021, 14, 7139 10 of 17Materials 2021, 14, x FOR PEER REVIEW 10 of 18
(a)
(b)
Figure 6. Fractograph of austenitic stainless steel 316L tensile test for TIG (a) and ATIG (b) welds (500×).
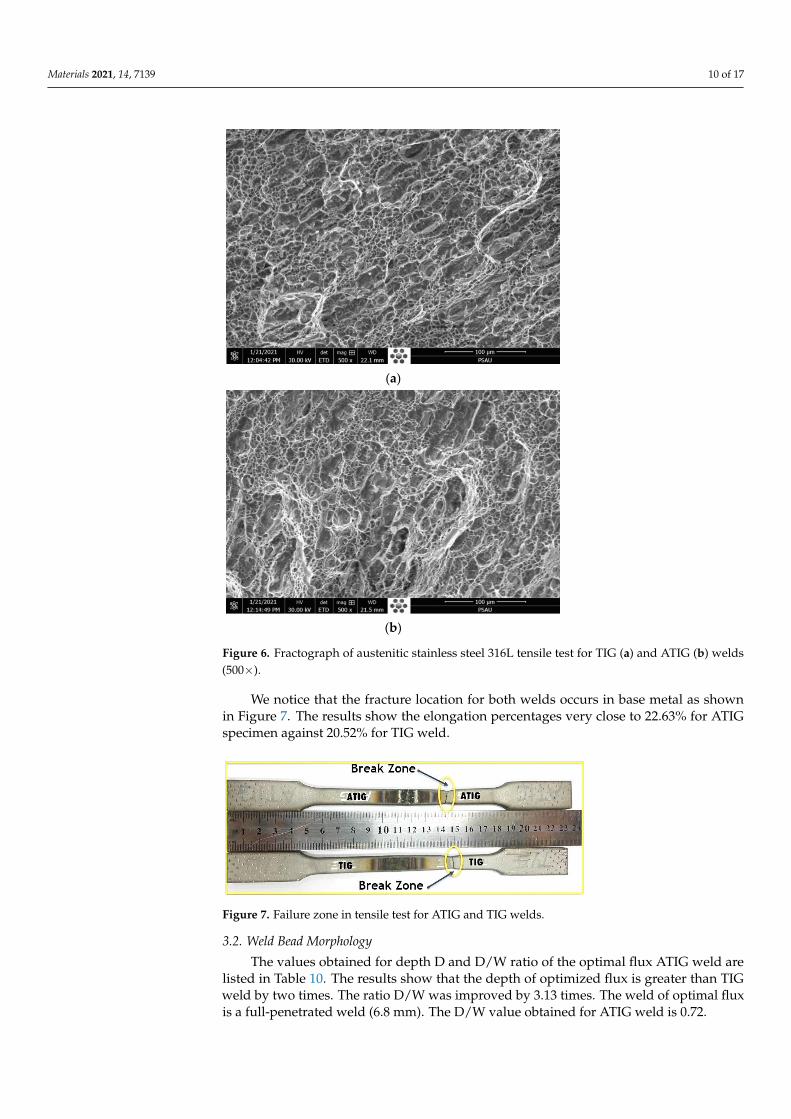
We notice that the fracture location for both welds occurs in base metal as shown in Figure 7. The results show the elongation percentages very close to 22.63% for ATIG spec-imen against 20.52% for TIG weld.
Figure 7. Failure zone in tensile test for ATIG and TIG welds.
3.2. Weld Bead Morphology The values obtained for depth D and D/W ratio of the optimal flux ATIG weld are
listed in Table 10. The results show that the depth of optimized flux is greater than TIG weld by two times. The ratio D/W was improved by 3.13 times. The weld of optimal flux is a full-penetrated weld (6.8 mm). The D/W value obtained for ATIG weld is 0.72.
Figure 6. Fractograph of austenitic stainless steel 316L tensile test for TIG (a) and ATIG (b) welds(500×).
We notice that the fracture location for both welds occurs in base metal as shownin Figure 7. The results show the elongation percentages very close to 22.63% for ATIGspecimen against 20.52% for TIG weld.
Materials 2021, 14, x FOR PEER REVIEW 10 of 18
(a)
(b)
Figure 6. Fractograph of austenitic stainless steel 316L tensile test for TIG (a) and ATIG (b) welds (500×).
We notice that the fracture location for both welds occurs in base metal as shown in Figure 7. The results show the elongation percentages very close to 22.63% for ATIG spec-imen against 20.52% for TIG weld.
Figure 7. Failure zone in tensile test for ATIG and TIG welds.
3.2. Weld Bead Morphology The values obtained for depth D and D/W ratio of the optimal flux ATIG weld are
listed in Table 10. The results show that the depth of optimized flux is greater than TIG weld by two times. The ratio D/W was improved by 3.13 times. The weld of optimal flux is a full-penetrated weld (6.8 mm). The D/W value obtained for ATIG weld is 0.72.
Figure 7. Failure zone in tensile test for ATIG and TIG welds.
3.2. Weld Bead Morphology
The values obtained for depth D and D/W ratio of the optimal flux ATIG weld arelisted in Table 10. The results show that the depth of optimized flux is greater than TIGweld by two times. The ratio D/W was improved by 3.13 times. The weld of optimal fluxis a full-penetrated weld (6.8 mm). The D/W value obtained for ATIG weld is 0.72.

Materials 2021, 14, 7139 11 of 17
This can be explained by the fact that Arc weld constriction and reversed Marangoniconvection in ATIG occur when:
- Fluorine from flux migrates to the arc weld and contributes to enhancing the energydensity according to the constriction arc mechanism explained before, as mentionedin several works [19,28].
- Oxygen liberated from oxides as surfactant element affects the surface tension of themolten metal resulting in a centripetal movement, the metal moves from the edges tothe center as cited in related works [29,30]. A full penetration weld is performed in asingle pass without edge preparation or the use of filler metal, which meets the needsof industries as shown in Figure 8b.
However, in TIG, Marangoni convection occurs. A molten metal moves from thecenter of the weld pool to the edges as pure metal leading to a wide and shallow weld beadas shown in Figure 8a.
Materials 2021, 14, x FOR PEER REVIEW 11 of 18
This can be explained by the fact that Arc weld constriction and reversed Marangoni convection in ATIG occur when: - Fluorine from flux migrates to the arc weld and contributes to enhancing the energy
density according to the constriction arc mechanism explained before, as mentioned in several works [19,28].
- Oxygen liberated from oxides as surfactant element affects the surface tension of the molten metal resulting in a centripetal movement, the metal moves from the edges to the center as cited in related works [29,30]. A full penetration weld is per-formed in a single pass without edge preparation or the use of filler metal, which meets the needs of industries as shown in Figure 8b. However, in TIG, Marangoni convection occurs. A molten metal moves from the cen-
ter of the weld pool to the edges as pure metal leading to a wide and shallow weld bead as shown in Figure 8a.
(a) (b)
Figure 8. Morphology of TIG (a) and ATIG (b) welds.
Table 10. Weldment bead profiles data of TIG and ATIG.
TIG ATIG D (mm) W (mm) D/W D (mm) W (mm) D/W
3.26 14.44 0.23 6.80 9.5 0.72
3.3. Microstructural Assessment The differences in microstructure between TIG weld bead and ATIG weld are shown
in Figures 9a,b and 10a,b respectively. In both cases, the ferrite morphology has a discon-tinuous skeletal network of delta ferrite (δ) structures in a predominant austenite matrix. Alloy 316L with Creq/Nieq that is 1.67 solidifies in ferritic austenitic mode [31]. The delta ferrite is located mainly at the dendrite axes. The residual primary ferrite results from incomplete δ → γ transformation during solidification.
Figure 8. Morphology of TIG (a) and ATIG (b) welds.
Table 10. Weldment bead profiles data of TIG and ATIG.
TIG ATIG
D (mm) W (mm) D/W D (mm) W (mm) D/W
3.26 14.44 0.23 6.80 9.5 0.72
3.3. Microstructural Assessment
The differences in microstructure between TIG weld bead and ATIG weld are shownin Figure 9a,b and Figure 10a,b respectively. In both cases, the ferrite morphology has adiscontinuous skeletal network of delta ferrite (δ) structures in a predominant austenitematrix. Alloy 316L with Creq/Nieq that is 1.67 solidifies in ferritic austenitic mode [31].The delta ferrite is located mainly at the dendrite axes. The residual primary ferrite resultsfrom incomplete δ→ γ transformation during solidification.
Materials 2021, 14, x FOR PEER REVIEW 12 of 18
(a) (b)
Figure 9. SEM micrograph in TIG fusion zone of 316L (a) (250×), (b) (500×).
The delta ferrite (δ) in the TIG weld zone is coarser than that of the ATIG weld as shown in Figures 9b and 10b, respectively. This difference in delta ferrite (δ) size is related to the heat provided by the weld bead, which is lesser in the case of ATIG weld.
(a) (b)
Figure 10. SEM Micrograph in ATIG fusion zone of 316L (a) (250×), (b) (500×).
In ATIG and TIG weld zone, the ferrite is the result of the incomplete primary delta ferrite- austenite transformation. The proportions of delta ferrite diminish from weld zone to base metal is as shown in Figure 11a,b.
In the ATIG heat-affected zone, austenitic grains crossed by parallel elongated in-clined stringers of delta ferrite as shown in Figure 11a. In TIG heat-affected zone, the glob-ular delta ferrite is randomly distributed and in the form of small slats of reduced size in the same rolling direction in a matrix of austenite as shown in Figure 11b.
Figure 9. SEM micrograph in TIG fusion zone of 316L (a) (250×), (b) (500×).

Materials 2021, 14, 7139 12 of 17
Materials 2021, 14, x FOR PEER REVIEW 12 of 18
(a) (b)
Figure 9. SEM micrograph in TIG fusion zone of 316L (a) (250×), (b) (500×).
The delta ferrite (δ) in the TIG weld zone is coarser than that of the ATIG weld as shown in Figures 9b and 10b, respectively. This difference in delta ferrite (δ) size is related to the heat provided by the weld bead, which is lesser in the case of ATIG weld.
(a) (b)
Figure 10. SEM Micrograph in ATIG fusion zone of 316L (a) (250×), (b) (500×).
In ATIG and TIG weld zone, the ferrite is the result of the incomplete primary delta ferrite- austenite transformation. The proportions of delta ferrite diminish from weld zone to base metal is as shown in Figure 11a,b.
In the ATIG heat-affected zone, austenitic grains crossed by parallel elongated in-clined stringers of delta ferrite as shown in Figure 11a. In TIG heat-affected zone, the glob-ular delta ferrite is randomly distributed and in the form of small slats of reduced size in the same rolling direction in a matrix of austenite as shown in Figure 11b.
Figure 10. SEM Micrograph in ATIG fusion zone of 316L (a) (250×), (b) (500×).
The delta ferrite (δ) in the TIG weld zone is coarser than that of the ATIG weld asshown in Figure 9b and Figure 10b, respectively. This difference in delta ferrite (δ) size isrelated to the heat provided by the weld bead, which is lesser in the case of ATIG weld.
In ATIG and TIG weld zone, the ferrite is the result of the incomplete primary deltaferrite- austenite transformation. The proportions of delta ferrite diminish from weld zoneto base metal is as shown in Figure 11a,b.
Materials 2021, 14, x FOR PEER REVIEW 13 of 18
(a)
(b)
Figure 11. SEM Micrograph in transition zone (WZ/HAZ) in ATIG weld (a) and TIG weld (b) (100×).
Figure 12a,b represent the measurements of ferrite volume proportions in the aus-tenite matrix. The advisable proper amount of δ-ferrite in austenitic stainless steel welds is less than 10% volume to ensure a better ductility, toughness, and corrosion resistance, and no less than 5% to avoid solidification cracking [32].
The results reported in Table 11 show the measurements taken in seven different lo-cations in the weld zone and the mean value of ferrite volume. The proportions are up to 5.56% in the conventional TIG process and 8.63% for ATIG weld.
Table 11. Ferrite volume fraction measurement.
Sample Number of
Measurements Max.
δ-Ferrite % Min.
δ-Ferrite % Mean
δ-Ferrite % Standards Deviation
σ TIG 7 6.2 4.8 5.56 0.35
ATIG 7 9 8.1 8.63 0.31
The higher retained ferrite may be attributed to the rate of cooling of the welds. Ele-ments from optimal flux can constrict arc weld. The constriction of the arc will increase the temperature at the anode due to the increase in current density and arc voltage as reported in many studies [33,34].
The ATIG welding with optimal flux increased the energy density of the heat source that leads to low heat input. However, the arc heat of TIG welding without flux has a lower energy density; therefore, high heat input is provided to the workpiece. High heat
Figure 11. SEM Micrograph in transition zone (WZ/HAZ) in ATIG weld (a) and TIG weld (b) (100×).

Materials 2021, 14, 7139 13 of 17
In the ATIG heat-affected zone, austenitic grains crossed by parallel elongated inclinedstringers of delta ferrite as shown in Figure 11a. In TIG heat-affected zone, the globulardelta ferrite is randomly distributed and in the form of small slats of reduced size in thesame rolling direction in a matrix of austenite as shown in Figure 11b.
Figure 12a,b represent the measurements of ferrite volume proportions in the austenitematrix. The advisable proper amount of δ-ferrite in austenitic stainless steel welds is lessthan 10% volume to ensure a better ductility, toughness, and corrosion resistance, and noless than 5% to avoid solidification cracking [32].
Materials 2021, 14, x FOR PEER REVIEW 14 of 18
input resulted in a slow cooling rate and a further transformation from ferrite phase to the austenite phase. Consequently, a ferrite volume proportion is reduced (5.56%). The ATIG welding was associated with a low heat input resulting in higher ferrite content (8.63%), which is in good agreement with several works [35,36]. On the other hand, the high heat input leads to coarse substructure during solidification in the case of TIG weld as shown in Figure 9a,b, which results in a more widely spaced ferrite network. But in the case of ATIG weld, heat provided is low; a fast cooling rate occurs and consequently a finer skel-etal ferrite is formed as shown in Figure 10a,b [37].
(a) (b)
Figure 12. Ferrite proportions measurements of 316L, (a) TIG Weld Zone and (b) ATIG Weld Zone (SEM. magnification 500×).
3.4. Hardness Test The hardness values are shown in Table 12. It is visible that the hardness of ATIG
weld and TIG weld in both FZ and HAZ are very close. The delta-ferrite volume propor-tions in the weld metals are in both TIG and ATIG welds increased, and have a beneficial effect in increasing the hardness of as received 316L stainless steel welds (160 HV).
In ATIG weld, the property of hardness is not affected by the optimal flux used. On the other hand, the standard deviation is less than 9 HV, which attests to the small dispar-ities in the obtained hardness values of the maximum and minimum. This result indicates good hardness homogeneities in the joints.
Table 12. Hardness values and standards deviation of TIG and ATIG.
Sample Number of Tests
HV Max.
HV Min.
HV Mean
Standards Deviation σ
ATIG FZ 8 188 176 183 4.93 TIG FZ 8 199 175 185 8.98
ATIG HAZ 8 177 167 171 3.41 TIG HAZ 8 180 164 172 5.03
3.5. Impact Test The impact tests were carried out on the fusion zone in ATIG and TIG welds. The
experimental values obtained for the impact tests are shown in Table 13. The energy ab-sorbed in the fusion zone in the case of ATIG weld (267 J/cm2) is slightly higher than that of TIG weld (256 J/cm2) by 11 J/cm2. The standard deviation is less than 15 J/cm2.
Figure 12. Ferrite proportions measurements of 316L, (a) TIG Weld Zone and (b) ATIG Weld Zone(SEM. magnification 500×).
The results reported in Table 11 show the measurements taken in seven differentlocations in the weld zone and the mean value of ferrite volume. The proportions are up to5.56% in the conventional TIG process and 8.63% for ATIG weld.
Table 11. Ferrite volume fraction measurement.
Sample Number ofMeasurements
Max.δ-Ferrite %
Min.δ-Ferrite %
Meanδ-Ferrite %
StandardsDeviation σ
TIG 7 6.2 4.8 5.56 0.35ATIG 7 9 8.1 8.63 0.31
The higher retained ferrite may be attributed to the rate of cooling of the welds.Elements from optimal flux can constrict arc weld. The constriction of the arc will increasethe temperature at the anode due to the increase in current density and arc voltage asreported in many studies [33,34].
The ATIG welding with optimal flux increased the energy density of the heat sourcethat leads to low heat input. However, the arc heat of TIG welding without flux has alower energy density; therefore, high heat input is provided to the workpiece. High heatinput resulted in a slow cooling rate and a further transformation from ferrite phase to theaustenite phase. Consequently, a ferrite volume proportion is reduced (5.56%). The ATIGwelding was associated with a low heat input resulting in higher ferrite content (8.63%),which is in good agreement with several works [35,36]. On the other hand, the high heatinput leads to coarse substructure during solidification in the case of TIG weld as shown inFigure 9a,b, which results in a more widely spaced ferrite network. But in the case of ATIGweld, heat provided is low; a fast cooling rate occurs and consequently a finer skeletalferrite is formed as shown in Figure 10a,b [37].
3.4. Hardness Test
The hardness values are shown in Table 12. It is visible that the hardness of ATIG weldand TIG weld in both FZ and HAZ are very close. The delta-ferrite volume proportions in
Materials 2021, 14, 7139 14 of 17
the weld metals are in both TIG and ATIG welds increased, and have a beneficial effect inincreasing the hardness of as received 316L stainless steel welds (160 HV).
Table 12. Hardness values and standards deviation of TIG and ATIG.
Sample Number ofTests
HVMax.
HVMin.
HVMean
StandardsDeviation σ
ATIG FZ 8 188 176 183 4.93TIG FZ 8 199 175 185 8.98
ATIG HAZ 8 177 167 171 3.41TIG HAZ 8 180 164 172 5.03
In ATIG weld, the property of hardness is not affected by the optimal flux used. On theother hand, the standard deviation is less than 9 HV, which attests to the small disparitiesin the obtained hardness values of the maximum and minimum. This result indicates goodhardness homogeneities in the joints.
3.5. Impact Test
The impact tests were carried out on the fusion zone in ATIG and TIG welds. Theexperimental values obtained for the impact tests are shown in Table 13. The energyabsorbed in the fusion zone in the case of ATIG weld (267 J/cm2) is slightly higher thanthat of TIG weld (256 J/cm2) by 11 J/cm2. The standard deviation is less than 15 J/cm2.
Table 13. Energy absorbed (J/cm2) and standard deviation of TIG and ATIG at fusion zone.
Sample Numberof Tests
AbsorbedEnergy Min.
AbsorbedEnergy Max.
AbsorbedEnergyMean
StandardsDeviation
(σ)
TIG 3 241 269 256 14.05ATIG 3 254 281 267 13.58
Figure 12 represents the fractographs of the impact Charpy “V” notch test. The imagesshow the formation of multiple dimples, which demonstrate that the fracture is a ductilemode in both cases of TIG and ATIG as shown in Figure 13a,b. However, in ATIG weldthe dimples are finer with the presence of voids, which can explain the slightly highvalue of absorbed energy comparatively to TIG weld. The ductile fracture mode leads togood resistance to sudden impact loads. Multiple dimples attest for high impact energywithstand as reported by several authors [38,39].
Materials 2021, 14, x FOR PEER REVIEW 15 of 18
Table 13. Energy absorbed (J/cm2) and standard deviation of TIG and ATIG at fusion zone.
Sample Number of Tests
Absorbed Energy Min.
Absorbed Energy Max.
Absorbed Energy Mean
Standards Deviation (σ)
TIG 3 241 269 256 14.05 ATIG 3 254 281 267 13.58
Figure 12 represents the fractographs of the impact Charpy “V” notch test. The im-ages show the formation of multiple dimples, which demonstrate that the fracture is a ductile mode in both cases of TIG and ATIG as shown in Figure 13a,b. However, in ATIG weld the dimples are finer with the presence of voids, which can explain the slightly high value of absorbed energy comparatively to TIG weld. The ductile fracture mode leads to good resistance to sudden impact loads. Multiple dimples attest for high impact energy withstand as reported by several authors [38,39].
(a) (b)
Figure 13. Fractograph of Austenitic stainless steel 316L impact Charpy “V” notch for (a) TIG Welded Zone (500×) and (b) ATIG Welded Zone (500×)
The results of EDS/SEM analysis in Figure 14a and Table 14 are shown in the case of ATIG weld, with the same level of silicon as in base metal. There are no trace of unwanted elements in the case of ATIG welds. These results can explain the good resistance to im-pact test.
(a) (b)
Figure 14. EDS/SEM spectrum analysis of fracture face of ATIG welded zone (a) and TIG welded zone (b).
Table 14. Elements present in fracture face of ATIG welded zone and TIG welded zone.
Sample C % Si % Cr % Mn % Fe % Ni % Mo % O % S %
ATIG weld Weight % Atomic %
16.26 47.29
0.43 0.54
14.80 9.94
1.75 1.11
58.10 36.34
7.09 4.22
1.57 0.54
TIG weld Weight % Atomic %
17.898 47.49
0.68 0.77
14.86 9.11
1.39 0.81
54.67 31.21
6.73 3.65
3.20 6.38
0.58 0.58
Figure 13. Fractograph of Austenitic stainless steel 316L impact Charpy “V” notch for (a) TIG WeldedZone (500×) and (b) ATIG Welded Zone (500×).
The results of EDS/SEM analysis in Figure 14a and Table 14 are shown in the case ofATIG weld, with the same level of silicon as in base metal. There are no trace of unwanted

Materials 2021, 14, 7139 15 of 17
elements in the case of ATIG welds. These results can explain the good resistance toimpact test.
Materials 2021, 14, x FOR PEER REVIEW 15 of 18
Table 13. Energy absorbed (J/cm2) and standard deviation of TIG and ATIG at fusion zone.
Sample Number of Tests
Absorbed Energy Min.
Absorbed Energy Max.
Absorbed Energy Mean
Standards Deviation (σ)
TIG 3 241 269 256 14.05 ATIG 3 254 281 267 13.58
Figure 12 represents the fractographs of the impact Charpy “V” notch test. The im-ages show the formation of multiple dimples, which demonstrate that the fracture is a ductile mode in both cases of TIG and ATIG as shown in Figure 13a,b. However, in ATIG weld the dimples are finer with the presence of voids, which can explain the slightly high value of absorbed energy comparatively to TIG weld. The ductile fracture mode leads to good resistance to sudden impact loads. Multiple dimples attest for high impact energy withstand as reported by several authors [38,39].
(a) (b)
Figure 13. Fractograph of Austenitic stainless steel 316L impact Charpy “V” notch for (a) TIG Welded Zone (500×) and (b) ATIG Welded Zone (500×)
The results of EDS/SEM analysis in Figure 14a and Table 14 are shown in the case of ATIG weld, with the same level of silicon as in base metal. There are no trace of unwanted elements in the case of ATIG welds. These results can explain the good resistance to im-pact test.
(a) (b)
Figure 14. EDS/SEM spectrum analysis of fracture face of ATIG welded zone (a) and TIG welded zone (b).
Table 14. Elements present in fracture face of ATIG welded zone and TIG welded zone.
Sample C % Si % Cr % Mn % Fe % Ni % Mo % O % S %
ATIG weld Weight % Atomic %
16.26 47.29
0.43 0.54
14.80 9.94
1.75 1.11
58.10 36.34
7.09 4.22
1.57 0.54
TIG weld Weight % Atomic %
17.898 47.49
0.68 0.77
14.86 9.11
1.39 0.81
54.67 31.21
6.73 3.65
3.20 6.38
0.58 0.58
Figure 14. EDS/SEM spectrum analysis of fracture face of ATIG welded zone (a) and TIG weldedzone (b).
Table 14. Elements present in fracture face of ATIG welded zone and TIG welded zone.
Sample C % Si % Cr % Mn % Fe % Ni % Mo % O % S %
ATIGweld
Weight %Atomic %
16.2647.29
0.430.54
14.809.94
1.751.11
58.1036.34
7.094.22
1.570.54
TIGweld
Weight %Atomic %
17.89847.49
0.680.77
14.869.11
1.390.81
54.6731.21
6.733.65
3.206.38
0.580.58
The results of EDS/SEM analysis in Figure 14b and in Table 14 show the presence ofoxygen in TIG weld, which is probably ascribed to insufficient protection of the weld poolthat affects mechanical properties, particularly the toughness. The presence of sulfur leadsto the formation of low-melting eutectics with iron, chromium, and nickel, which can alterthe mechanical properties of TIG weld beads [40]. The obtained results with EDS/SEMrelated to TIG weld may explain the decrease in resistance to impact test comparatively tothe ATIG weld.
4. Conclusions
In the present work, ATIG weld has been investigated and compared to conventionalTIG weld. The starting point of this work is elaborating the optimal flux to maximize theUTS ATIG weld. The mixing design of the experiment combined to the particle swarmoptimization (PSO) method is used to minimize the number of trials, which reduces thecost of materials as well as time. Based on the obtained results in this investigation, thefollowing conclusions can be drawn:
- Mixing design of the experiment combined to the particle swarm optimization (PSO)method is among the novelties of this work. Optimal flux was composed by 32%Cr2O3, 43% ZrO2, 8% SiO2, and 17% CaF2. The optimal flux raised from this methodimproves the mechanical properties in comparison to conventional TIG weld bead.Transversal tensile testing of the produced ATIG weld has a UTS value (600 MPa) closeto parent metal (624 MPa). On the other hand, the UTS of TIG weld fell to 571 MPa.ATIG welding is more resistant than conventional TIG welding to sudden impactloads. The ATIG weld hardness results were close to those of conventional TIG weld.
- The ATIG depth weld bead reached 6.80 mm and the weld aspect ratio increased 3.13.The ATIG depth weld was increased by two times in comparison to the conventionalTIG weld bead. The fully penetrated ATIG weld is ascribed to two mechanisms citedearlier. The reversal Marangoni mechanism owing to oxygen liberated from flux andthe constriction of ATIG arc weld related to the migration of fluorine from the flux tothe arc.

Materials 2021, 14, 7139 16 of 17
- The microstructure of welds in both welds is composed of matrix austenite inter-spersed by skeleton δ-ferrite. The ferrite volume proportions in ATIG weld around8.63% and decreased to 5.56% in conventional TIG welding. The δ-ferrite in TIG weldis coarser comparatively to that of ATIG δ-ferrite.
Author Contributions: Conceptualization, K.T. and A.C.H.; Methodology, K.T. and R.D.; Software,K.T. and A.C.H.; Validation, K.T., R.D., A.O. and A.C.H.; Formal analysis, K.T.; Investigation, K.T.,R.D., A.O. and A.C.H.; Resources, H.A.; Data curation, K.T.; Writing—original draft preparation, K.T.;Writing—review and editing, K.T., R.D., A.O. and M.M.Z.A.; Visualization, K.T.; Supervision, K.T.;All authors have read and agreed to the published version of the manuscript.
Funding: This research received no external funding.
Institutional Review Board Statement: Not applicable.
Informed Consent Statement: Not applicable.
Data Availability Statement: The data used to support the findings of this study are included withinthe article.
Acknowledgments: The authors present their deep thanks and acknowledge the collaboration ofEl-Sayed M. Sherif and Hany S. Abdo from the Center of Excellence for Research in EngineeringMaterials (CEREM), King Saud University, Saudi Arabia, for their help in performing SEM images.The authors also express their sincere thanks to Sahbi Boubaker from the college of computer scienceand engineering, Jeddah University for his help in mathematical modeling.
Conflicts of Interest: The authors declare no conflict of interest.
References1. Tathgir, S.; Bhattacharya, A. Activated-TIG Welding of Different Steels: Influence of Various Flux and Shielding Gas. Mater.
Manuf. Process. 2016, 31, 235–342. [CrossRef]2. Klobcar, D.; Tušek, J.; Bizjak, M.; Simoncic, S.; Lešer, V. Active flux tungsten inert gas welding of austenitic stainless steel AISI 304.
Metalurgija 2016, 55, 617–620.3. Modenesi, P.J.; Neto, C.P.; Apolinario, E.R.; Dias, B.K. Effect of flux density and the presence of additives in ATIG welding of
austenitic stainless steel. Weld. Int. 2015, 29, 425–432. [CrossRef]4. Kumar, R.; Sundara Bharathi, S.R. A Review Study on A-TIG Welding of 316(L) Austenitic Stainless Steel. Int. J. Emerg. Trends Sci.
Technol. (IJETS) 2015, 2, 2066–2072.5. Howse, D.S.; Lucas, W. An investigation in to arc construction by active flux for TIG welding. Sci. Technol. Weld. Join. 2000, 5,
189–193. [CrossRef]6. Kurtulmus, M. Activated flux TIG welding of austenitic stainless steels. Emerg. Mater. Res. 2020, 9, 1041–1055. [CrossRef]7. Sire, S.; Marya, S. On the development of a new flux bounded TIG process (FBTIG) to enhance weld penetrations in aluminium,
5086. Int. J. Form. Process. 2002, 5, 39–51. [CrossRef]8. Jayakrishnan, S.; Chakravarthy, P.; Muhammed Rijas, A. Effect of Flux Gap and Particle Size on the Depth of Penetration in FBTIG
Welding of Aluminium. Trans. Indian Inst. Met. 2017, 70, 1329–1335. [CrossRef]9. Ambekar, S.D.; Wadhokar, S.R. Parametric Optimization of Gas metal arc welding process by using Taguchi method on stainless
steel AISI 410. Int. J. Res. Mod. Eng. Emerg. Technol. 2015, 3, 1–9.10. Srirangan, A.K.; Paulraj, S. Multi-response optimization of process parameters for TIG welding of Incoloy 800HT by Taguchi grey
relational analysis. Eng. Sci. Technol. Int. J. 2016, 19, 811–817. [CrossRef]11. Ramadan, N.; Boghdadi, A. Parametric Optimization of TIG Welding Influence On Tensile Strength of Dissimilar Metals SS-304
And Low Carbon Steel by Using Taguchi Approach. Am. J. Eng. Res. 2020, 9, 7–14.12. Chaudhari, V.; Bodkhe, V.; Deokate, S.; Mali, B.; Mahale, R. Parametric optimization of TIG welding on SS 304 and MS using
Taguchi approach. Int. Res. J. Eng. Technol. 2019, 6, 880–885.13. Albaijan, I.; Hedhibi, A.C.; Touileb, K.; Djoudjou, R.; Ouis, A.; Alrobei, H. Effect of Binary Oxide Flux on Weld Shape, Mechanical
Properties and Corrosion Resistance of 2205 Duplex Stainless Steel Welds. Adv. Mater. Sci. Eng. 2020, 2020, 5842741. [CrossRef]14. Touileb, K.; Ouis, A.; Djoudjou, R.; Hedhibi, A.C.; Alrobei, H.; Albaijan, I.; Alzahrani, B.; Sherif, M.E.; Abdo, H.S. Effects of ATIG
Welding on Weld Shape, Mechanical Properties, and Corrosion Resistance of 430 Ferritic Stainless Steel Alloy. Metals 2020, 10, 404.[CrossRef]
15. Ran, L.; Manshu, D.; Hongming, G. Prediction of Bead Geometry with Changing Welding Speed Using Artificial Neural Network.Materials 2021, 14, 1494.
16. Kshirsagar, R.; Jones, S.; Lawrence, J.; Tabor, J. Prediction of Bead Geometry Using a Two-Stage SVM–ANN Algorithm forAutomated Tungsten Inert Gas (TIG) Welds. J. Manuf. Mater. Process. 2019, 3, 39. [CrossRef]

Materials 2021, 14, 7139 17 of 17
17. Las-Casas, M.S.; De Ávila, T.L.D.; Bracarense, A.Q.; Lima, E.J. Weld parameter prediction using artificial neural network: FN andgeometric parameter prediction of austenitic stainless steel welds. J. Braz. Soc. Mech. Sci. Eng. 2018, 40, 26–35. [CrossRef]
18. Tseng, K.H.; Chen, K.L. Comparisons between TiO2- and SiO2-Flux Assisted TIG Welding Processes. J. Nanosci. Nanotechnol. 2012,12, 6359–6367. [CrossRef]
19. Leconte, S.; Paillard, P.; Chapelle, P.; Henrion, G.; Saindrenan, J. Effects of flux containing fluorides on TIG welding process. Sci.Technol. Weld. Join. 2013, 12, 120–126. [CrossRef]
20. Neethu, N.; Togita, R.G.; Neelima, P.; Chakravarthy, P.; Narayana, M.S.V.S.; Nair, M.T. Effect of Nature of Flux and Flux Gap onthe Depth-to-Width Ratio in Flux-Bounded TIG Welding of AA6061: Experiments and Numerical Simulations. Trans. Indian Inst.Met. 2019, 72, 1585–1588. [CrossRef]
21. Babbar, A.; Kumar, A.; Jain, V.; Gupta, D. Enhancement of Activated Tungsten Inert Gas (A-TIG) Welding Using Multi-componentTiO2-SiO2-Al2O3 Hybrid Flux. Measurement 2019, 148, 106912. [CrossRef]
22. Ahmed, A.N.; Noor, C.W.M.; Allawi, M.F.; El-Shafie, A. RBF-NN-based model for prediction of weld bead geometry in ShieldedMetal Arc Welding (SMAW). Neural Comput. Appl. 2018, 29, 889–899. [CrossRef]
23. Kumar, R.; Saurav, S.K. Modeling of TIG welding process by regression analysis and neural network technique. Int. J. Mech. Eng.Technol. (IJMET) 2015, 6, 10–27.
24. Kshirsagar, R.; Jones, S.; Lawrence, J.; Tabor, J. Optimization of TIG Welding Parameters Using a Hybrid Nelder Mead-Evolutionary Algorithms Method. J. Manuf. Mater. Process. 2020, 4, 10. [CrossRef]
25. Boubaker, S.; Kamel, S.; Kolsi, L.; Kahouli, O. Forecasting of One-Day-Ahead Global Horizontal Irradiation Using Block-OrientedModels Combined with a Swarm Intelligence Approach. Nat. Resour. Res. 2020, 30, 1–26. [CrossRef]
26. Patel, N.P.; Badheka, V.J.; Vora, J.J.; Upadhyay, G.H. Effect of Oxide Fluxes in Activated TIG Welding of Stainless Steel 316LNto Low Activation Ferritic/Martensitic Steel (LAFM) Dissimilar Combination. Trans. Indian Inst. Met. 2019, 72, 2753–2761.[CrossRef]
27. Goodwin, G.M.; Cole, N.C.; Slaughtera, D.G.M. Study of Ferrite Morphology in Austenitic Stainless Steel Weldments. Weld. Res.Suppl. 1972, 12, 425–429.
28. Ming, L.Q.; Hong, W.X.; Da, Z.Z.; Jun, W. Effect of activating flux on arc shape and arc voltage in tungsten inert gas welding.Trans. Nonferrous Met. Soc. China 2007, 17, 486–490.
29. Kulkarni, A.; Dwivedi, D.K.; Vasudevan, M. Study of Mechanism, Microstructure and Mechanical Properties of Activated FluxTIG Welded P91 Steel-P22 Steel Dissimilar Metal Joint. Mater. Sci. Eng. A 2018, 50, 309–323. [CrossRef]
30. Vora, J.J.; Badheka, V.J. Experimental Investigation on Mechanism and Weld Morphology of Activated TIG Welded Bead-on-plateWeldments of Reduced Activation Ferritic/martensitic Steel Using Oxide Fluxes. J. Manuf. Process. 2015, 20, 224–233. [CrossRef]
31. Kujanpaa, V.P.; Suutala, V.P.; Takalo, N.J.; Moisio, T.J.I. Solidification Cracking—Estimation of the Susceptibility of Austenitic andAustenitic-Ferritic Stainless Steel Welds. Met. Constr. 1980, 12, 282–285.
32. Kou, S. Welding Metallurgy, 2nd ed.; John Wiley & Sons: Hoboken, NJ, USA, 2003.33. Dixit, P.; Suketu, J. Techniques to weld similar and dissimilar materials by ATIG welding—An overview. Mater. Manuf. Process.
2021, 36, 1–16.34. Roy, S.; Samaddar, S.; Uddin, M.N.; Hoque, A.; Mishra, S.; Das, S. Effect of Activating Flux on Penetration in ATIG Welding of 316
Stainless Steel. Indian Weld. J. 2017, 50, 72–80. [CrossRef]35. Vasudevan, M. Effect of A-TIG Welding Process on the Weld Attributes of Type 304LN and 316LN Stainless Steels. J. Mater. Eng.
Perform. 2017, 26, 1325–1336. [CrossRef]36. Suman, S.; Santanu, D. Effect of Polarity and Oxide Fluxes on Weld-bead Geometry in Activated Tungsten Inert Gas (A-TIG)
Welding. J. Weld. Join. 2020, 38, 380–388.37. Lippold, J.C.; Savage, W.F. Solidification of Austenitic Stainless Steel Weldments: Part 2-The Effect of Alloy Composition on
Ferrite Morphology. Weld. J. 1980, 59, 48–58.38. Jebaraj, A.V.; Kumar, T.S.; Manikandan, M. Investigation of Structure Property Relationship of the Dissimilar Weld Between
Austenitic Stainless Steel 316L and Duplex Stainless Steel 2205. Trans. Indian Inst. Met. 2018, 71, 2593–2604. [CrossRef]39. Charles, J. Composition and properties of duplex stainless steels. Weld. World 1995, 36, 43–54.40. Harish, K.D.; Somi, R.A. Study of Mechanical Behavior in Austenitic Stainless Steel 316 LN Welded Joints. Int. J. Mech. Eng. Rob.
Res. 2013, 61, 37–56.


![Measurements of Residual Stress and Microstructural ......Mehdi et al. [16] identified and assessed both the microstructure and residual stress of Ti-6Al-4V tungsten inert gas (TIG)](https://img.pdfslide.us/doc/110x75/610099a19ff9342b331a02a4/measurements-of-residual-stress-and-microstructural-mehdi-et-al-16-identified.jpg)