Embed Size (px)
Citation preview
DOI: 10.1126/science.1221071, 724 (2012);336 Science
et al.Floris BosveldPlanar Cell Polarity PathwayMechanical Control of Morphogenesis by Fat/Dachsous/Four-Jointed
This copy is for your personal, non-commercial use only.
clicking here.colleagues, clients, or customers by , you can order high-quality copies for yourIf you wish to distribute this article to others
here.following the guidelines
can be obtained byPermission to republish or repurpose articles or portions of articles
): May 23, 2012 www.sciencemag.org (this information is current as of
The following resources related to this article are available online at
http://www.sciencemag.org/content/336/6082/724.full.htmlversion of this article at:
including high-resolution figures, can be found in the onlineUpdated information and services,
http://www.sciencemag.org/content/suppl/2012/04/11/science.1221071.DC1.html can be found at: Supporting Online Material
http://www.sciencemag.org/content/336/6082/724.full.html#relatedfound at:
can berelated to this article A list of selected additional articles on the Science Web sites
http://www.sciencemag.org/content/336/6082/724.full.html#ref-list-1, 9 of which can be accessed free:cites 23 articlesThis article
http://www.sciencemag.org/content/336/6082/724.full.html#related-urls1 articles hosted by HighWire Press; see:cited by This article has been
http://www.sciencemag.org/cgi/collection/developmentDevelopment
subject collections:This article appears in the following
registered trademark of AAAS. is aScience2012 by the American Association for the Advancement of Science; all rights reserved. The title
CopyrightAmerican Association for the Advancement of Science, 1200 New York Avenue NW, Washington, DC 20005. (print ISSN 0036-8075; online ISSN 1095-9203) is published weekly, except the last week in December, by theScience
on
May
23,
201
2w
ww
.sci
ence
mag
.org
Dow
nloa
ded
from
diffusion coefficients of the fusion proteins byfitting a three-dimensional diffusion model torecovery profiles (text S6 and figs. S19 to S21).We obtained effective diffusion coefficients of0.7 T 0.2 mm2/s for Cyclops-GFP, 3.2 T 0.5 mm2/sfor Squint-GFP, 11.1 T 0.6 mm2/s for Lefty1-GFP,and 18.9 T 3.0 mm2/s for Lefty2-GFP (Fig. 4B,figs. S18 to S23, and text S6). Thus, increased pro-tein diffusivities reflect increased ranges, indicatingthat differential diffusivity is a major contributorto the differences in Nodal and Lefty range.
To test whether the experimentally determinedvalues for diffusivity and clearance accuratelypredict the measured distribution profiles, we nu-merically simulated signal secretion from a local-ized source, diffusion, and clearance (12, 14, 26)in a three-dimensional geometry appropriate forblastula embryos (text S7). Using the measuredvalues for diffusivity and clearance, these simu-lations yielded distribution profiles similar to theexperimentally determined protein distributions(fig. S26) and thus provided independent supportfor the validity of the experimental approaches.
Our results have two major implications.First, differential diffusivity underlies differencesin activator/inhibitor range. The differences inrange (Cyclops < Squint < Lefty1 < Lefty2) arereflected in the differences in effective diffu-sion coefficients (Cyclops < Squint < Lefty1 <Lefty2). There is a similar trend in half-lives,but the differences in diffusivity are much morepronounced than the differences in clearance.During embryogenesis, the sources of Nodaland Lefty overlap, but Nodal signaling is activenear the source and is inhibited by Lefty fartheraway. Our results suggest that the lower mobil-ity of Nodal allows its accumulation close tothe site of secretion, whereas the high mobilityof Lefty leads to rapid long-range dispersal andprevents accumulation near the source. Thus,the differential diffusivity of Nodal and Leftysignals serves as the biophysical basis for thespatially restricted induction of cell fates duringembryogenesis.
Second, the previously described networktopology of the Nodal/Lefty system and thebiophysical properties of Nodals and Leftysmeasured here support the activator/inhibitorreaction-diffusion model of morphogenesis: Aless diffusive activator (Nodal) induces both itsown production and that of a more diffusiveinhibitor (Lefty) (3, 4). The Nodal/Lefty reaction-diffusion system is further constrained by pre-patterns and rapid cell fate specification; thus,the system results in graded pathway activationduring mesendoderm induction and exclusivepathway activation on the left during left-rightspecification (see text S2 for detailed discus-sion). Mathematical models have postulated thatthe inhibitor in reaction-diffusion systems musthave a higher diffusion coefficient than the ac-tivator. Several models suggest that clearance-normalized inhibitor and activator diffusioncoefficients differ by a factor of at least 6, that is,ℜ = (D/k1)inhibitor/(D/k1)activator > 6 (8, 16, 27–29).
The average ratio of the normalized diffusivitiesof Leftys and Nodals measured here is ℜ ≈ 14,providing biophysical support for these modelingstudies (see text S8 for comparison of reaction-diffusion systems). The different diffusivities inthe Nodal/Lefty biological system have counter-parts in chemical reaction-diffusion systems. Forexample, patterns can be generated in a starch-loaded gel by combining an activator (iodide)with an inhibitor (chlorite) in the presence ofmalonic acid (30). In this in vitro system, diffu-sion of the activator is hindered by binding tothe starch matrix and is thought to result in ahigher (factor of ~15) diffusivity of the inhibitor.These models and our measurements raise thepossibility that differential binding interactionsand a ratio of at least a factor of 5 to 15 of inhib-itor and activator diffusivities might be a generalfeature of reaction-diffusion–based patterning.
References and Notes1. A. M. Turing, Philos. Trans. R. Soc. London Ser. B 237,
37 (1952).2. A. Gierer, H. Meinhardt, Kybernetik 12, 30 (1972).3. S. Kondo, T. Miura, Science 329, 1616 (2010).4. H. Meinhardt, Cold Spring Harb. Perspect. Biol. 1,
a001362 (2009).5. H. Shiratori, H. Hamada, Development 133, 2095 (2006).6. Y. Chen, A. F. Schier, Curr. Biol. 12, 2124 (2002).7. D. E. Klein, V. M. Nappi, G. T. Reeves, S. Y. Shvartsman,
M. A. Lemmon, Nature 430, 1040 (2004).8. S. Sick, S. Reinker, J. Timmer, T. Schlake, Science 314,
1447 (2006).9. D. Ben-Zvi, B. Z. Shilo, A. Fainsod, N. Barkai, Nature
453, 1205 (2008).10. A. D. Economou et al., Nat. Genet. 44, 348 (2012).11. P. Müller, A. F. Schier, Dev. Cell 21, 145 (2011).12. A. Kicheva et al., Science 315, 521 (2007).13. O. Wartlick et al., Science 331, 1154 (2011).14. S. R. Yu et al., Nature 461, 533 (2009).
15. J. A. Le Good et al., Curr. Biol. 15, 31 (2005).16. T. Nakamura et al., Dev. Cell 11, 495 (2006).17. S. Zhou et al., Curr. Biol. 10.1016/j.cub.2012.02.065
(2012).18. K. W. Rogers, A. F. Schier, Annu. Rev. Cell Dev. Biol. 27,
377 (2011).19. A. F. Schier, Cold Spring Harb. Perspect. Biol. 1,
a003459 (2009).20. V. Duboc, F. Lapraz, L. Besnardeau, T. Lepage, Dev. Biol.
320, 49 (2008).21. C. Grande, N. H. Patel, Nature 457, 1007 (2009).22. M. M. Shen, Development 134, 1023 (2007).23. Y. Chen, A. F. Schier, Nature 411, 607 (2001).24. L. Marjoram, C. Wright, Development 138, 475 (2011).25. L. Zhang et al., Biotechniques 42, 446, 448, 450
(2007).26. T. Gregor, E. F. Wieschaus, A. P. McGregor, W. Bialek,
D. W. Tank, Cell 130, 141 (2007).27. M. I. Granero, A. Porati, D. Zanacca, J. Math. Biol. 4, 21 (1977).28. S. Kondo, R. Asai, Nature 376, 765 (1995).29. M. Yamaguchi, E. Yoshimoto, S. Kondo, Proc. Natl. Acad.
Sci. U.S.A. 104, 4790 (2007).30. I. Lengyel, I. R. Epstein, Science 251, 650 (1991).
Acknowledgments: We thank X. Zhang for help with thecloning of Cyclops constructs, H. Othmer and A. Lander forhelpful discussions, J. Dubrulle for discussions and primersfor quantitative reverse transcription polymerase chainreaction, and S. Mango for comments on the manuscript.Supported by European Molecular Biology Organization andHuman Frontier Science Program (HFSP) Long-TermFellowships (P.M.), the NSF Graduate Research FellowshipProgram (K.W.R.), NIH grant 5RO1GM56211, and HFSP grantRGP0066/2004-C.
Supplementary Materialswww.sciencemag.org/cgi/content/full/science.1221920/DC1Texts S1 to S8Tables S1 to S8Figs. S1 to S26Movie S1References (31–109)
14 March 2012; accepted 5 April 2012Published online 12 April 2012;10.1126/science.1221920
Mechanical Control of Morphogenesisby Fat/Dachsous/Four-JointedPlanar Cell Polarity PathwayFloris Bosveld,1* Isabelle Bonnet,1* Boris Guirao,1* Sham Tlili,1† Zhimin Wang,1
Ambre Petitalot,1 Raphaël Marchand,1 Pierre-Luc Bardet,1 Philippe Marcq,2
François Graner,1 Yohanns Bellaïche1‡
During animal development, several planar cell polarity (PCP) pathways control tissue shapeby coordinating collective cell behavior. Here, we characterize by means of multiscale imagingepithelium morphogenesis in the Drosophila dorsal thorax and show how the Fat/Dachsous/Four-jointed PCP pathway controls morphogenesis. We found that the proto-cadherin Dachsousis polarized within a domain of its tissue-wide expression gradient. Furthermore, Dachsouspolarizes the myosin Dachs, which in turn promotes anisotropy of junction tension. By combiningphysical modeling with quantitative image analyses, we determined that this tension anisotropydefines the pattern of local tissue contraction that contributes to shaping the epithelium mainlyvia oriented cell rearrangements. Our results establish how tissue planar polarization coordinatesthe local changes of cell mechanical properties to control tissue morphogenesis.
Tissue morphogenesis requires the coordi-nation of cell behaviors during develop-ment. Planar cell polarity (PCP) pathways,
which coordinate the polarization of cells in the
tissue plane, have been shown to play a funda-mental role in morphogenesis of vertebrates andinvertebrates (1). It remains largely unknownhow PCP pathways control local cell mechan-
11 MAY 2012 VOL 336 SCIENCE www.sciencemag.org724
REPORTS
on
May
23,
201
2w
ww
.sci
ence
mag
.org
Dow
nloa
ded
from
ical properties to drive global tissue deforma-tion. The Fat/Dachsous(Ds)/Four-jointed(Fj) PCPpathway plays fundamental roles in the regulationof tissue growth, the orientation of cell polarityacross the tissue, and the regulation of morpho-genesis (1, 2). fat and ds encode proto-cadherins,whereas f j encodes a Golgi kinase modulatingFat/Ds binding (3–8). In many Drosophila tissues,ds and f j are expressed in tissue-wide oppos-ing gradients (4, 5, 9, 10). Fat and Ds are re-ported to be homogeneous at the cell membrane(10, 11). Yet, the heterophilic binding of Fat andDs between adjacent cells is proposed to generate
a tissue-wide polarity (7, 8, 10, 12–15). Througha poorly understood mechanism involving Fatsignaling and the DHHC palmitoyltransferaseApproximated (16), this polarity promotes theasymmetric distribution of the myosin Dachs,which controls division orientation and apicalcell size (12, 16–19). The role of the Fat/Ds/Fjpathway in tissue morphogenesis has been studiedby using indirect measurements such as the shapeof clones and division orientation (19, 20); con-versely, measurements of tissue dynamics haveso far characterized its role in tissue rotation (21).Here, we assessed whether, where, and how theFat/Ds/Fj pathway affects local cell mechanicalproperties to drive tissue deformations.
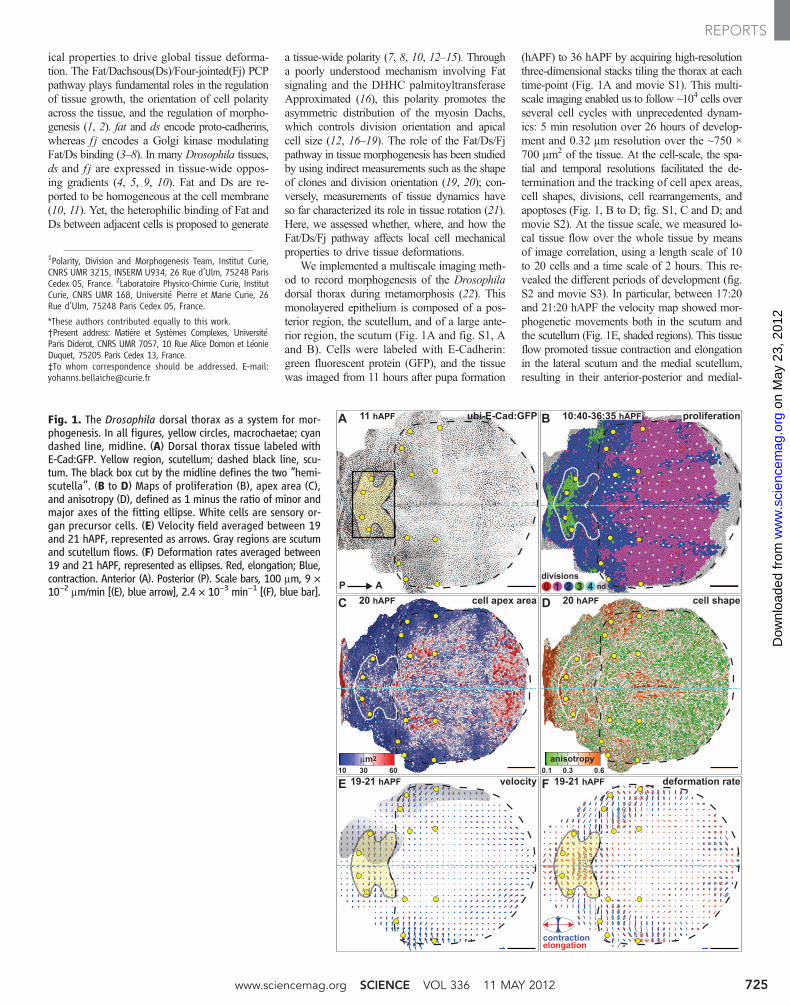
We implemented a multiscale imaging meth-od to record morphogenesis of the Drosophiladorsal thorax during metamorphosis (22). Thismonolayered epithelium is composed of a pos-terior region, the scutellum, and of a large ante-rior region, the scutum (Fig. 1A and fig. S1, Aand B). Cells were labeled with E-Cadherin:green fluorescent protein (GFP), and the tissuewas imaged from 11 hours after pupa formation
(hAPF) to 36 hAPF by acquiring high-resolutionthree-dimensional stacks tiling the thorax at eachtime-point (Fig. 1A and movie S1). This multi-scale imaging enabled us to follow ~104 cells overseveral cell cycles with unprecedented dynam-ics: 5 min resolution over 26 hours of develop-ment and 0.32 mm resolution over the ~750 ×700 mm2 of the tissue. At the cell-scale, the spa-tial and temporal resolutions facilitated the de-termination and the tracking of cell apex areas,cell shapes, divisions, cell rearrangements, andapoptoses (Fig. 1, B to D; fig. S1, C and D; andmovie S2). At the tissue scale, we measured lo-cal tissue flow over the whole tissue by meansof image correlation, using a length scale of 10to 20 cells and a time scale of 2 hours. This re-vealed the different periods of development (fig.S2 and movie S3). In particular, between 17:20and 21:20 hAPF the velocity map showed mor-phogenetic movements both in the scutum andthe scutellum (Fig. 1E, shaded regions). This tissueflow promoted tissue contraction and elongationin the lateral scutum and the medial scutellum,resulting in their anterior-posterior and medial-
1Polarity, Division and Morphogenesis Team, Institut Curie,CNRS UMR 3215, INSERM U934, 26 Rue d’Ulm, 75248 ParisCedex 05, France. 2Laboratoire Physico-Chimie Curie, InstitutCurie, CNRS UMR 168, Université Pierre et Marie Curie, 26Rue d’Ulm, 75248 Paris Cedex 05, France.
*These authors contributed equally to this work.†Present address: Matière et Systèmes Complexes, UniversitéParis Diderot, CNRS UMR 7057, 10 Rue Alice Domon et LéonieDuquet, 75205 Paris Cedex 13, France.‡To whom correspondence should be addressed. E-mail:[email protected]
Fig. 1. The Drosophila dorsal thorax as a system for mor-phogenesis. In all figures, yellow circles, macrochaetae; cyandashed line, midline. (A) Dorsal thorax tissue labeled withE-Cad:GFP. Yellow region, scutellum; dashed black line, scu-tum. The black box cut by the midline defines the two “hemi-scutella”. (B to D) Maps of proliferation (B), apex area (C),and anisotropy (D), defined as 1 minus the ratio of minor andmajor axes of the fitting ellipse. White cells are sensory or-gan precursor cells. (E) Velocity field averaged between 19and 21 hAPF, represented as arrows. Gray regions are scutumand scutellum flows. (F) Deformation rates averaged between19 and 21 hAPF, represented as ellipses. Red, elongation; Blue,contraction. Anterior (A). Posterior (P). Scale bars, 100 mm, 9 ×10⁻² mm/min [(E), blue arrow], 2.4 × 10⁻³ min−1 [(F), blue bar].
www.sciencemag.org SCIENCE VOL 336 11 MAY 2012 725
REPORTS
on
May
23,
201
2w
ww
.sci
ence
mag
.org
Dow
nloa
ded
from
lateral elongations, respectively (Fig. 1F, scutellumin yellow). Collectively, our multiscale imag-ing and measurements provide a resource to in-vestigate how signaling pathways control tissuemorphogenesis.
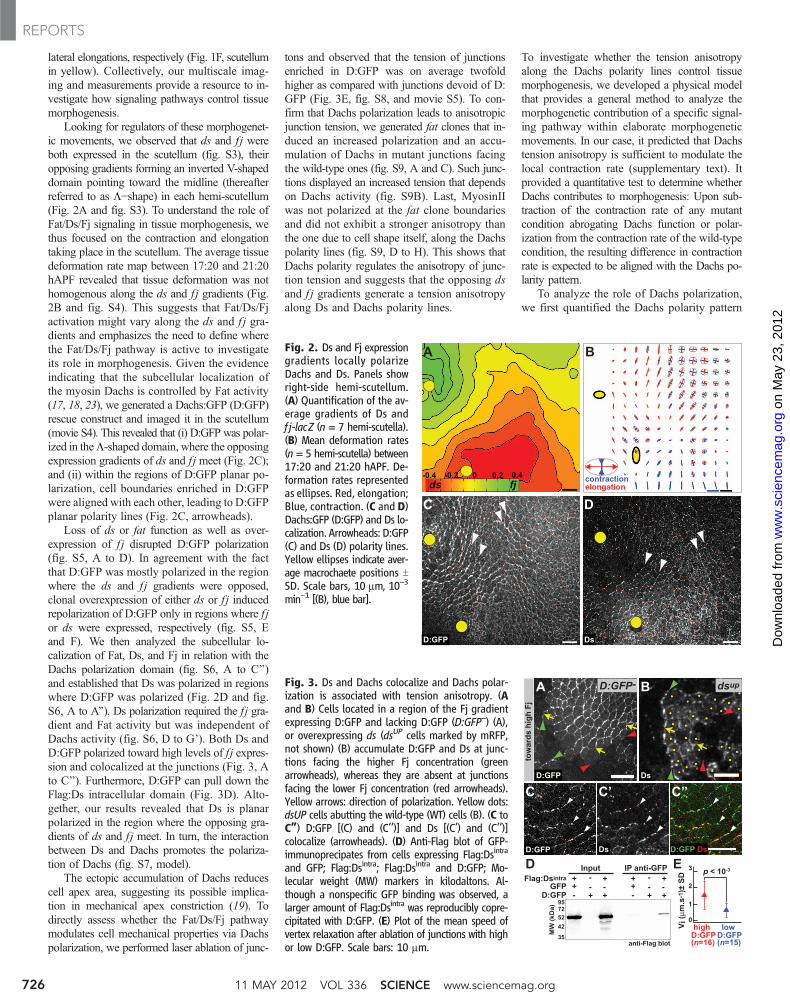
Looking for regulators of these morphogenet-ic movements, we observed that ds and f j wereboth expressed in the scutellum (fig. S3), theiropposing gradients forming an inverted V-shapeddomain pointing toward the midline (thereafterreferred to as L−shape) in each hemi-scutellum(Fig. 2A and fig. S3). To understand the role ofFat/Ds/Fj signaling in tissue morphogenesis, wethus focused on the contraction and elongationtaking place in the scutellum. The average tissuedeformation rate map between 17:20 and 21:20hAPF revealed that tissue deformation was nothomogenous along the ds and f j gradients (Fig.2B and fig. S4). This suggests that Fat/Ds/Fjactivation might vary along the ds and f j gra-dients and emphasizes the need to define wherethe Fat/Ds/Fj pathway is active to investigateits role in morphogenesis. Given the evidenceindicating that the subcellular localization ofthe myosin Dachs is controlled by Fat activity(17, 18, 23), we generated a Dachs:GFP (D:GFP)rescue construct and imaged it in the scutellum(movie S4). This revealed that (i) D:GFP was polar-ized in theL-shaped domain, where the opposingexpression gradients of ds and f j meet (Fig. 2C);and (ii) within the regions of D:GFP planar po-larization, cell boundaries enriched in D:GFPwere aligned with each other, leading to D:GFPplanar polarity lines (Fig. 2C, arrowheads).
Loss of ds or fat function as well as over-expression of f j disrupted D:GFP polarization(fig. S5, A to D). In agreement with the factthat D:GFP was mostly polarized in the regionwhere the ds and f j gradients were opposed,clonal overexpression of either ds or f j inducedrepolarization of D:GFP only in regions where f jor ds were expressed, respectively (fig. S5, Eand F). We then analyzed the subcellular lo-calization of Fat, Ds, and Fj in relation with theDachs polarization domain (fig. S6, A to C’’)and established that Ds was polarized in regionswhere D:GFP was polarized (Fig. 2D and fig.S6, A to A’’). Ds polarization required the fj gra-dient and Fat activity but was independent ofDachs activity (fig. S6, D to G’). Both Ds andD:GFP polarized toward high levels of f j expres-sion and colocalized at the junctions (Fig. 3, Ato C’’). Furthermore, D:GFP can pull down theFlag:Ds intracellular domain (Fig. 3D). Alto-gether, our results revealed that Ds is planarpolarized in the region where the opposing gra-dients of ds and f j meet. In turn, the interactionbetween Ds and Dachs promotes the polariza-tion of Dachs (fig. S7, model).
The ectopic accumulation of Dachs reducescell apex area, suggesting its possible implica-tion in mechanical apex constriction (19). Todirectly assess whether the Fat/Ds/Fj pathwaymodulates cell mechanical properties via Dachspolarization, we performed laser ablation of junc-
tons and observed that the tension of junctionsenriched in D:GFP was on average twofoldhigher as compared with junctions devoid of D:GFP (Fig. 3E, fig. S8, and movie S5). To con-firm that Dachs polarization leads to anisotropicjunction tension, we generated fat clones that in-duced an increased polarization and an accu-mulation of Dachs in mutant junctions facingthe wild-type ones (fig. S9, A and C). Such junc-tions displayed an increased tension that dependson Dachs activity (fig. S9B). Last, MyosinIIwas not polarized at the fat clone boundariesand did not exhibit a stronger anisotropy thanthe one due to cell shape itself, along the Dachspolarity lines (fig. S9, D to H). This shows thatDachs polarity regulates the anisotropy of junc-tion tension and suggests that the opposing dsand f j gradients generate a tension anisotropyalong Ds and Dachs polarity lines.
To investigate whether the tension anisotropyalong the Dachs polarity lines control tissuemorphogenesis, we developed a physical modelthat provides a general method to analyze themorphogenetic contribution of a specific signal-ing pathway within elaborate morphogeneticmovements. In our case, it predicted that Dachstension anisotropy is sufficient to modulate thelocal contraction rate (supplementary text). Itprovided a quantitative test to determine whetherDachs contributes to morphogenesis: Upon sub-traction of the contraction rate of any mutantcondition abrogating Dachs function or polar-ization from the contraction rate of the wild-typecondition, the resulting difference in contractionrate is expected to be aligned with the Dachs po-larity pattern.
To analyze the role of Dachs polarization,we first quantified the Dachs polarity pattern
Fig. 2. Ds and Fj expressiongradients locally polarizeDachs and Ds. Panels showright-side hemi-scutellum.(A) Quantification of the av-erage gradients of Ds andf j-lacZ (n = 7 hemi-scutella).(B) Mean deformation rates(n = 5 hemi-scutella) between17:20 and 21:20 hAPF. De-formation rates representedas ellipses. Red, elongation;Blue, contraction. (C and D)Dachs:GFP (D:GFP) and Ds lo-calization. Arrowheads: D:GFP(C) and Ds (D) polarity lines.Yellow ellipses indicate aver-age macrochaete positions TSD. Scale bars, 10 mm, 10−3
min−1 [(B), blue bar].
Fig. 3. Ds and Dachs colocalize and Dachs polar-ization is associated with tension anisotropy. (Aand B) Cells located in a region of the Fj gradientexpressing D:GFP and lacking D:GFP (D:GFP–) (A),or overexpressing ds (dsUP cells marked by mRFP,not shown) (B) accumulate D:GFP and Ds at junc-tions facing the higher Fj concentration (greenarrowheads), whereas they are absent at junctionsfacing the lower Fj concentration (red arrowheads).Yellow arrows: direction of polarization. Yellow dots:dsUP cells abutting the wild-type (WT) cells (B). (C toC”) D:GFP [(C) and (C’’)] and Ds [(C’) and (C’’)]colocalize (arrowheads). (D) Anti-Flag blot of GFP-immunoprecipates from cells expressing Flag:Dsintra
and GFP; Flag:Dsintra; Flag:Dsintra and D:GFP; Mo-lecular weight (MW) markers in kilodaltons. Al-though a nonspecific GFP binding was observed, alarger amount of Flag:Dsintra was reproducibly copre-cipitated with D:GFP. (E) Plot of the mean speed ofvertex relaxation after ablation of junctions with highor low D:GFP. Scale bars: 10 mm.
11 MAY 2012 VOL 336 SCIENCE www.sciencemag.org726
REPORTS
on
May
23,
201
2w
ww
.sci
ence
mag
.org
Dow
nloa
ded
from
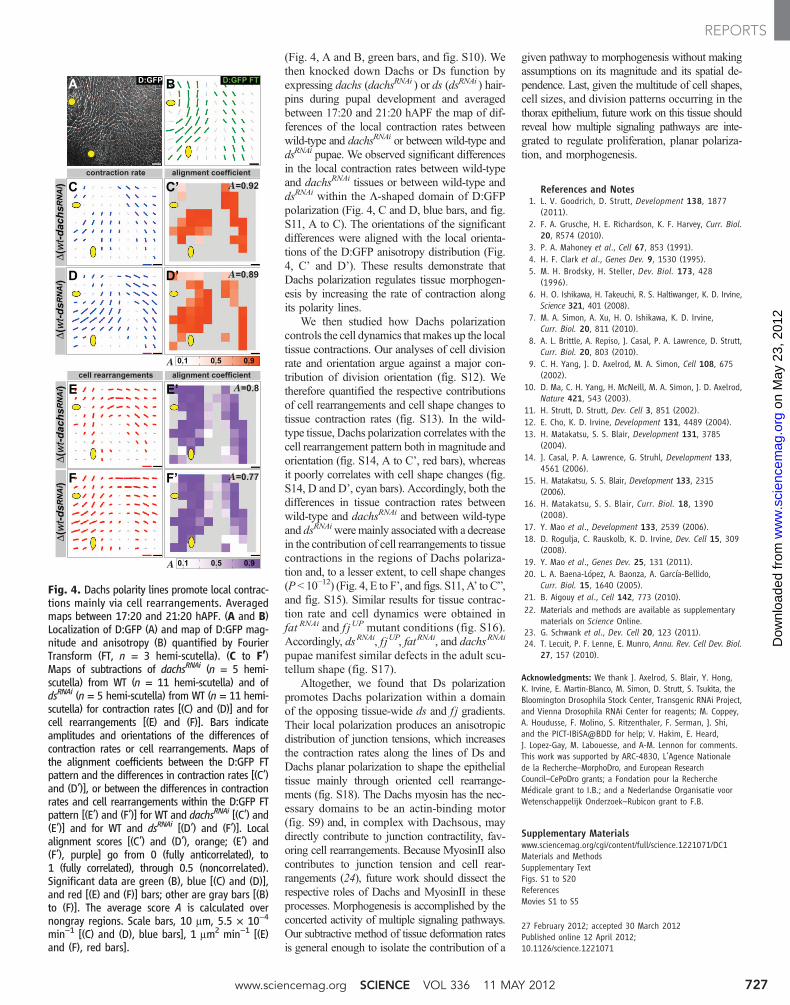
(Fig. 4, A and B, green bars, and fig. S10). Wethen knocked down Dachs or Ds function byexpressing dachs (dachsRNAi ) or ds (dsRNAi ) hair-pins during pupal development and averagedbetween 17:20 and 21:20 hAPF the map of dif-ferences of the local contraction rates betweenwild-type and dachsRNAi or between wild-type anddsRNAi pupae. We observed significant differencesin the local contraction rates between wild-typeand dachsRNAi tissues or between wild-type anddsRNAi within the L-shaped domain of D:GFPpolarization (Fig. 4, C and D, blue bars, and fig.S11, A to C). The orientations of the significantdifferences were aligned with the local orienta-tions of the D:GFP anisotropy distribution (Fig.4, C’ and D’). These results demonstrate thatDachs polarization regulates tissue morphogen-esis by increasing the rate of contraction alongits polarity lines.
We then studied how Dachs polarizationcontrols the cell dynamics that makes up the localtissue contractions. Our analyses of cell divisionrate and orientation argue against a major con-tribution of division orientation (fig. S12). Wetherefore quantified the respective contributionsof cell rearrangements and cell shape changes totissue contraction rates (fig. S13). In the wild-type tissue, Dachs polarization correlates with thecell rearrangement pattern both in magnitude andorientation (fig. S14, A to C’, red bars), whereasit poorly correlates with cell shape changes (fig.S14, D and D’, cyan bars). Accordingly, both thedifferences in tissue contraction rates betweenwild-type and dachsRNAi and between wild-typeand dsRNAiweremainly associatedwith a decreasein the contribution of cell rearrangements to tissuecontractions in the regions of Dachs polariza-tion and, to a lesser extent, to cell shape changes(P < 10−12) (Fig. 4, E to F’, and figs. S11, A’ to C”,and fig. S15). Similar results for tissue contrac-tion rate and cell dynamics were obtained infat RNAi and f j UP mutant conditions (fig. S16).Accordingly, dsRNAi, f jUP, fatRNAi, and dachsRNAi
pupae manifest similar defects in the adult scu-tellum shape (fig. S17).
Altogether, we found that Ds polarizationpromotes Dachs polarization within a domainof the opposing tissue-wide ds and f j gradients.Their local polarization produces an anisotropicdistribution of junction tensions, which increasesthe contraction rates along the lines of Ds andDachs planar polarization to shape the epithelialtissue mainly through oriented cell rearrange-ments (fig. S18). The Dachs myosin has the nec-essary domains to be an actin-binding motor(fig. S9) and, in complex with Dachsous, maydirectly contribute to junction contractility, fav-oring cell rearrangements. Because MyosinII alsocontributes to junction tension and cell rear-rangements (24), future work should dissect therespective roles of Dachs and MyosinII in theseprocesses. Morphogenesis is accomplished by theconcerted activity of multiple signaling pathways.Our subtractive method of tissue deformation ratesis general enough to isolate the contribution of a
given pathway to morphogenesis without makingassumptions on its magnitude and its spatial de-pendence. Last, given the multitude of cell shapes,cell sizes, and division patterns occurring in thethorax epithelium, future work on this tissue shouldreveal how multiple signaling pathways are inte-grated to regulate proliferation, planar polariza-tion, and morphogenesis.
References and Notes1. L. V. Goodrich, D. Strutt, Development 138, 1877
(2011).2. F. A. Grusche, H. E. Richardson, K. F. Harvey, Curr. Biol.
20, R574 (2010).3. P. A. Mahoney et al., Cell 67, 853 (1991).4. H. F. Clark et al., Genes Dev. 9, 1530 (1995).5. M. H. Brodsky, H. Steller, Dev. Biol. 173, 428
(1996).6. H. O. Ishikawa, H. Takeuchi, R. S. Haltiwanger, K. D. Irvine,
Science 321, 401 (2008).7. M. A. Simon, A. Xu, H. O. Ishikawa, K. D. Irvine,
Curr. Biol. 20, 811 (2010).8. A. L. Brittle, A. Repiso, J. Casal, P. A. Lawrence, D. Strutt,
Curr. Biol. 20, 803 (2010).9. C. H. Yang, J. D. Axelrod, M. A. Simon, Cell 108, 675
(2002).10. D. Ma, C. H. Yang, H. McNeill, M. A. Simon, J. D. Axelrod,
Nature 421, 543 (2003).11. H. Strutt, D. Strutt, Dev. Cell 3, 851 (2002).12. E. Cho, K. D. Irvine, Development 131, 4489 (2004).13. H. Matakatsu, S. S. Blair, Development 131, 3785
(2004).14. J. Casal, P. A. Lawrence, G. Struhl, Development 133,
4561 (2006).15. H. Matakatsu, S. S. Blair, Development 133, 2315
(2006).16. H. Matakatsu, S. S. Blair, Curr. Biol. 18, 1390
(2008).17. Y. Mao et al., Development 133, 2539 (2006).18. D. Rogulja, C. Rauskolb, K. D. Irvine, Dev. Cell 15, 309
(2008).19. Y. Mao et al., Genes Dev. 25, 131 (2011).20. L. A. Baena-López, A. Baonza, A. García-Bellido,
Curr. Biol. 15, 1640 (2005).21. B. Aigouy et al., Cell 142, 773 (2010).22. Materials and methods are available as supplementary
materials on Science Online.23. G. Schwank et al., Dev. Cell 20, 123 (2011).24. T. Lecuit, P. F. Lenne, E. Munro, Annu. Rev. Cell Dev. Biol.
27, 157 (2010).
Acknowledgments: We thank J. Axelrod, S. Blair, Y. Hong,K. Irvine, E. Martin-Blanco, M. Simon, D. Strutt, S. Tsukita, theBloomington Drosophila Stock Center, Transgenic RNAi Project,and Vienna Drosophila RNAi Center for reagents; M. Coppey,A. Houdusse, F. Molino, S. Ritzenthaler, F. Serman, J. Shi,and the PICT-IBiSA@BDD for help; V. Hakim, E. Heard,J. Lopez-Gay, M. Labouesse, and A-M. Lennon for comments.This work was supported by ARC-4830, L’Agence Nationalede la Recherche–MorphoDro, and European ResearchCouncil–CePoDro grants; a Fondation pour la RechercheMédicale grant to I.B.; and a Nederlandse Organisatie voorWetenschappelijk Onderzoek–Rubicon grant to F.B.
Supplementary Materialswww.sciencemag.org/cgi/content/full/science.1221071/DC1Materials and MethodsSupplementary TextFigs. S1 to S20ReferencesMovies S1 to S5
27 February 2012; accepted 30 March 2012Published online 12 April 2012;10.1126/science.1221071
Fig. 4. Dachs polarity lines promote local contrac-tions mainly via cell rearrangements. Averagedmaps between 17:20 and 21:20 hAPF. (A and B)Localization of D:GFP (A) and map of D:GFP mag-nitude and anisotropy (B) quantified by FourierTransform (FT, n = 3 hemi-scutella). (C to F’)Maps of subtractions of dachsRNAi (n = 5 hemi-scutella) from WT (n = 11 hemi-scutella) and ofdsRNAi (n = 5 hemi-scutella) from WT (n = 11 hemi-scutella) for contraction rates [(C) and (D)] and forcell rearrangements [(E) and (F)]. Bars indicateamplitudes and orientations of the differences ofcontraction rates or cell rearrangements. Maps ofthe alignment coefficients between the D:GFP FTpattern and the differences in contraction rates [(C’)and (D’)], or between the differences in contractionrates and cell rearrangements within the D:GFP FTpattern [(E’) and (F’)] for WT and dachsRNAi [(C’) and(E’)] and for WT and dsRNAi [(D’) and (F’)]. Localalignment scores [(C’) and (D’), orange; (E’) and(F’), purple] go from 0 (fully anticorrelated), to1 (fully correlated), through 0.5 (noncorrelated).Significant data are green (B), blue [(C) and (D)],and red [(E) and (F)] bars; other are gray bars [(B)to (F)]. The average score A is calculated overnongray regions. Scale bars, 10 mm, 5.5 × 10⁻⁴
min−1 [(C) and (D), blue bars], 1 mm2 min−1 [(E)and (F), red bars].
www.sciencemag.org SCIENCE VOL 336 11 MAY 2012 727
REPORTS
on
May
23,
201
2w
ww
.sci
ence
mag
.org
Dow
nloa
ded
from