Embed Size (px)
Citation preview

MECHANICAL CHARACTERIZATION OF IN- AND OUT-OF -AUTOCLAVE CURED COMPOSITE PANELS FOR LARGE
LAUNCH VEHICLES
Sotiris Kellas
NASA Langley Research Center
Hampton Virginia 23681,
Brad Lerch
NASA Glenn Research Center
Cleveland, Ohio 44135
and
Nathan Wilmoth
Arctic Slope Regional Corporation
Cleveland, Ohio 44135
ABSTRACT
Two manufacturing demonstration panels (1/16th-arc-segments of 10 m diameter cylinder) were fabricated under the composites part of the Lightweight Space Structures and Materials program. Both panels were of sandwich construction with aluminum core and 8-ply quasi-isotropic graphite/epoxy facesheets. One of the panels was constructed with in-autoclave curable unidirectional prepreg (IM7/977-3) and the second with out-of-autoclave unidirectional prepreg (T40-800B/5320-1). Following NDE inspection, each panel was divided into a number of small specimens for material property characterization and a large (0.914 m wide by 1.524 m long) panel for a buckling study. Results from the small specimen tests were used to (a) assess the fabrication quality of each 1/16th arc segment panel and (b) to develop and/or verify basic material property inputs to Finite Element analysis models. The mechanical performance of the two material systems is assessed at the coupon level by comparing average measured properties such as flatwise tension, edgewise compression, and facesheet tension. The buckling response of the 0.914 m wide by 1.524 m long panel provided a comparison between the in- and out-of autoclave systems at a larger scale.
1. INTRODUCTION
Under the Composites for Exploration (CoEx) project NASA intents to develop high payoff dry composite structures and materials technologies to meet future space exploration needs. In particular, CoEx is focused on 10 m diameter composite structures representative of payload fairings for a 100 to 130 metric ton Space Launch System (SLS).
This paper is declared a work of the U.S. Government and is not subject to copyright protection in the United States.
https://ntrs.nasa.gov/search.jsp?R=20120009342 2018-10-11T05:03:13+00:00Z

The goals for the CoEx Project are to demonstrate weight and cost savings for dry composite launch vehicle structures when compared to metallic options. The cost savings goal is addressed through the utilization of automated manufacturing processes, minimal part count, and out-of-autoclave material processes.
Following a structural concept trade study, which is reported by Krivanek and Yount [1], the sandwich construction was selected for manufacturing demonstration. Amongst other metrics that were utilized in the selection process were structural efficiency, manufacturing risk, and manufacturing cost.
Two (1/16th arc-segments of 10 m diameter cylinder) composite manufacturing demonstration panels were produced under the Lightweight Space Structures and Materials (LSSM) program (CoEx’s predecessor) using an automated tape laying technique, Pelham et al [2]. The panels were produced using a 5 m radius concave composite tool. Both panels were of sandwich construction with 49.7 kg/m3, 25.4 mm thick perforated aluminum core and 8-ply quasi-isotropic graphite/epoxy facesheets. The facesheet stacking sequence was (45°/90°/-45°/0°)s. Both panels were constructed from 152.4 mm wide unidirectional prepreg tape. One of the panels was constructed with a conventional autoclave cured material system (IM7/977-3), and the second with an Out-of-Autoclave (OoA) system (T40-800B/5320-1). The film adhesives used between the facesheets and the honeycomb core were FM300M and FM309-1M for the IM7/977-3 and T40-800B/5320-1 material systems, respectively.
After curing both panels contained visible manufacturing imperfections due to the tape placing process, which in some cases resulted in gaps between tapes of up to 1.5 mm wide. These tape gaps were present in all ply orientations. Another visible imperfection was caused by the core splice, which was located in the center (along the 90° orientation) of each panel. For each panel, two honeycomb-core pieces were spliced together using EA 9396.6MD paste adhesive. Following curing the core splice left a visible bulge in the bagged side (concave surface) of each panel. Due to a combination of lower curing pressure and the lack of a caul plate, the bulge was more pronounced in the OoA cured panel. Furthermore, the lack of a caul plate resulted in visible wrinkles on the bagged surface of the OoA cured panel. Additional manufacturing details and differences between the two panels are discussed in Reference [2]. Moreover, the thermo-physical quality of the composite facesheets is discussed in Reference [3]
Following fabrication each panel was inspected and suspected imperfections were marked before the panels were sectioned into a number of specimens to support coupon and element level testing. Inspection of the entire panel was performed by NASA personnel at the fabrication facility using infrared thermography. Secondary inspection techniques such as phased array ultrasonics, shearography, and ultrasonics using the captured water column technique were used when the panels were shipped to NASA. Except for the obvious surface defects, the panels were found to be free of any additional manufacturing and/or shipping related damage. To ensure that any fabrication related variation was accurately captured, coupon samples were removed from several different regions of the panel.
The dimensions of the 1/16th –arc manufacturing demonstration panels after trimming were approximately 1.95 m wide by 1.95 m long. The untrimmed length of each panel included two 0.25 m long reinforced end sections. Each reinforced end section included 16-ply facesheets and heavier density aluminum core (97.7 kg/m3). Flatwise tension tests were conducted from material

removed from the acreage as well as the reinforced ends. All other tests were performed using acreage material only.
Test results are organized in two major sections – coupon and element level tests. The objectives of the coupon testing were: (a) to assess the fabrication quality of the panels by comparing the measured properties to existing properties, (b) to provide relevant inputs for the structural analysis, which was performed for two panel geometries, and (c) to compare the OoA against the more conventional autoclave cured system. In addition to comparing the mechanical performance of the two systems under a relevant loading condition, the effect of manufacturing imperfections on specimen scale was assessed through element testing which included two buckling tests.
2. COUPON TESTS
Coupon tests included Flatwise Tension (FWT) from acreage and high-density core areas, Facesheet Tension (FT), and Edgewise Compression (EWC). Coupon tests were conducted in three conditions – Room Temperature Dry (RTD), Elevated Temperature Dry (ETD), and Elevated Temperature Wet (ETW). The elevated test temperature for all samples was 104 °C. Samples tested dry were dried in a vacuum oven at 71 °C prior to testing. Wet samples were conditioned in a moisturizing chamber at 85 °C and 85 % relative humidity until saturation was reached. Sample-ends were potted and samples were instrumented after conditioning and then returned to their respective storage environment for several days prior to testing.
Except for FWT all other specimens were loaded along the 0° orientation which was parallel to the cylinder axis of symmetry.
2.1 Flatwise Tension
It was anticipated that at least for the RTD test condition, flatwise tension specimens with the 49.7 kg/m3 density core would fail in the relatively weak core rather than producing a desirable disbond between the facesheet and the core. Consequently, some tests were conducted on samples cut out from the reinforced regions of the panels, which contained the 97.7 kg/m3 density core. Tests on the higher density core samples were conducted at the RTD condition.
2.1.1 Experimental Details
Flatwise tension samples containing the heavier density core were of cylindrical cross-sectional area with a diameter of 50.8 mm. The majority of the samples were machined from the acreage (49.7 kg/m3 density core ) and had a square cross-sectional area with a side equal to 50.8 mm. All samples were glued to aluminum blocks using Hysol 9394 adhesive. Samples were tested according to ASTM Standard C297-04 – Standard Test Method for Flatwise Tensile Strength of Sandwich Constructions. The test setup and a typical specimen from the acreage region of the panels are shown Figure 1.
Specimens were loaded at a displacement rate of 0.5 mm/min. until the ultimate load was reached. Strength was calculated by dividing the maximum load by the nominal cross-sectional area of the sample. Test conditions included RTD, ETD and ETW. Elevated temperature tests were conducted at 104 °C using a band heater. Because of honeycomb core failure at the ETD
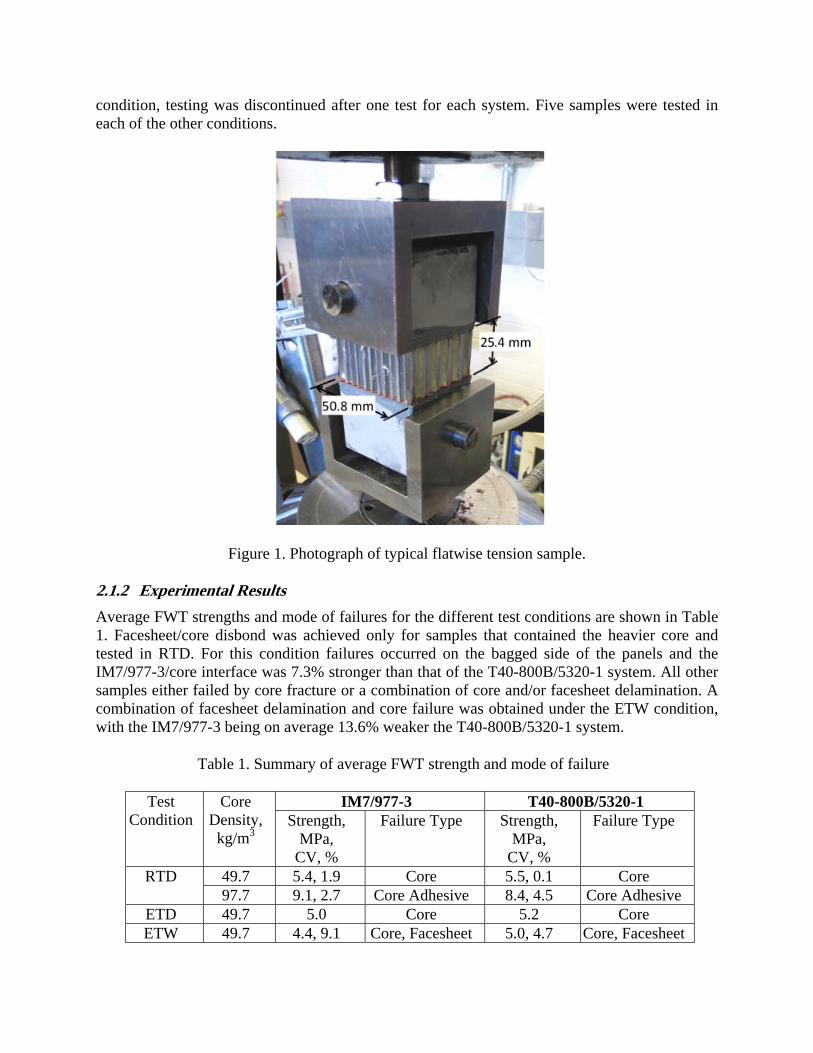
condition, testing was discontinued after one test for each system. Five samples were tested in each of the other conditions.
Figure 1. Photograph of typical flatwise tension sample.
2.1.2 Experimental Results
Average FWT strengths and mode of failures for the different test conditions are shown in Table 1. Facesheet/core disbond was achieved only for samples that contained the heavier core and tested in RTD. For this condition failures occurred on the bagged side of the panels and the IM7/977-3/core interface was 7.3% stronger than that of the T40-800B/5320-1 system. All other samples either failed by core fracture or a combination of core and/or facesheet delamination. A combination of facesheet delamination and core failure was obtained under the ETW condition, with the IM7/977-3 being on average 13.6% weaker the T40-800B/5320-1 system.
Table 1. Summary of average FWT strength and mode of failure
Test Condition
Core Density, kg/m3
IM7/977-3 T40-800B/5320-1 Strength,
MPa, CV, %
Failure Type Strength, MPa,
CV, %
Failure Type
RTD 49.7 5.4, 1.9 Core 5.5, 0.1 Core 97.7 9.1, 2.7 Core Adhesive 8.4, 4.5 Core Adhesive
ETD 49.7 5.0 Core 5.2 Core ETW 49.7 4.4, 9.1 Core, Facesheet 5.0, 4.7 Core, Facesheet

2.2 Facesheet Tension
For this phase of testing, measurement of the facesheet thickness was a critical parameter as it heavily influenced the calculation of strength and stiffness of the facesheets. For the results presented in this paper facesheet thickness was measured in more than 70 locations along polished edges of sandwich samples using a microscope. An average thickness, which included samples from both the tool side and the bag side, was established for each material system. An example of a micrograph used for thickness measurement is shown in Figure 2. Using the technique depicted in Figure 2, the average facesheet thickness of the IM7/977-3 system was found to be 0.991 mm and that of the T40-800B/5320-1 was found to be 5 % higher at 1.041 mm. These values were used for all stress calculations.
Figure 2. Typical micrograph of sandwich edge of IM7/977-3 used to measure the facesheet thickness.
2.2.1 Experimental Details
Sandwich coupons measuring 25.4 mm wide and 254 mm long were sectioned from the panels. Facesheets were sliced from both surfaces of the sandwich coupons and the honeycomb and film adhesive were removed carefully by sanding until the surface of the composite ply was revealed. A close-up view of a typical facesheet test sample is shown in Figure 3.
RTD test samples were instrumented with back-to-back orthogonal strain gages to allow for Poisson’s ratio measurement. The rest of the test samples were instrumented with back-to-back axial gages only. For samples intended for ETW tests, strain gages were applied after conditioning, with the instrumented samples being returned to the conditioning chamber for a minimum of two additional days prior to testing.

Samples were loaded in uniaxial tension at a constant crosshead displacement rate of 0.64 mm/min until failure occurred. Specimens tested at elevated temperature were heated using a cylindrical coil resistance heater. Test procedures were guided by ASTM D3039-08 Standard Test Method for Tensile Properties of Polymer Matrix Composite Materials. This included calculation of the Young’s modulus, using the chord of the stress-strain data between 1,000 and 3,000 .
Figure 3. Photograph of the inside surface of a facesheet tensile sample.
The number of samples tested varied for each test condition. For RTD a total of at least six samples, three from each side of the sandwich panel were tested. For ETD and ETW only four samples were tested in each condition (two from each side of the sandwich panel).
2.2.2 Experimental Results
Average test results, which include values from both the inner and the outer facesheets, are summarized in Table 2. Within the experimental scatter, there was no apparent difference between the inner and outer facesheet response.
The results of Table 2 show comparable performance for the two material systems at RTD conditions. A noticeable difference, however, appears at ETD and ETW where the strength of T40-800B/5320-1 is 9.9 % and 11.3 %, respectively, higher than the tensile strength of IM7/977-3. For all test conditions, the stiffness of T40-800B/5320-1 was consistently lower and the strain to failure was consistently higher than IM7/977-3. The greatest stiffness difference (10.3 %) occurred in the ETD condition in which case the strain to failure of T40-800B/5320-1 was 14.8% higher than that of IM7/977-3. The effect of hot wet environment was most pronounced on the strength of the IM7/977-3 system, which resulted in a strength reduction, from the ETD condition, of 12.9 %.

Table 2. Summary of average Facesheet Tension results
Test Condition
IM7/977-3 T40-800B/5320-1 Strength,
MPa, CV, %
Modulus, GPa ,
CV, %
Ult. Strain, ,
CV, %
Strength, MPa,
CV, %
Modulus, GPa ,
CV, %
Ult. Strain, ,
CV, % RTD 796, 6.3 63.1, 3.1 12,500, 7.8 806, 6.6 59.1, 4.1 13,500, 11.8 ETD 744, 1.7 64.2, 3.3 12,200, 5.0 812, 3.3 57.6, 2.8 14,000, 5.6 ETW 693, 6.3 62.7, 3.6 13,000, 25.0 771, 6.5 56.7, 4.3 13,600, 5.0
2.3 Edgewise Compression
The RTD compressive stiffness of the as fabricated facesheets, used in the buckling analyses of the large panels, was generated from this series of tests. Only RTD and ETD test results are reported.
The effect of the core splice was also investigated in this test configuration. At least two samples per material system were removed from the panels such that the core splice was located approximately in their center. For a given material system, the effect of the core splice was assessed by comparing the strength and stiffness of samples with splice against the average value of samples without core splice.
2.3.1 Experimental Details
EWC coupons were 57.2 mm wide with a total length of 88.9 mm. Following removal of the honeycomb core from the ends, samples were then potted into an aluminum frame using an epoxy-based paste. The ends of the potted samples were machined flat and parallel. A typical T40-800B/5320-1 sample is shown in Figure 4. The unsupported specimen length was 63.5 mm.
Figure 4. Photograph of T40-800B 5320-1 sample tested RTD condition
Two pairs of longitudinal back-to-back strain gages were placed on the center-line and near the sample edges. In addition to calculating the effective facesheet stiffness these gages were used

to verify specimen alignment. Specimens were loaded in compression between two platens one of which could be adjusted to minimize bending. The base platen was adjusted so that the bending strain at maximum load was less than 10 % (typically < 5 %). Specimens were loaded at a constant crosshead displacement of 0.30 mm/minute. Strain measurements were collected during the test from all four gages, as well as from photogrammetry. Loading continued until the sample failed catastrophically. Testing was guided by ASTM Standard C 364 – 07 Standard Test Method for Edgewise Compressive Strength of Sandwich Constructions. With the exception of samples containing a core splice, six samples were tested in each condition
2.3.2 Experimental Results
Averaged EWC test results are summarized in Table 3. Strength was calculated by dividing the maximum load by the total cross-sectional area of the facesheets – the core was neglected. Young’s modulus was determined using the chord of the stress-strain curve between 1000 and 3000 . The average of all four strain-gages was used for the stress-strain response and hence the modulus calculation and ultimate strain.
In general, the EWC results followed the same trend that was observed in the facesheet tension tests where the T40-800B/5320-1 system was stronger and less stiff than the IM7/977-3. Results of Table 3 indicate a strength difference of 20.5 % occurring between the two systems at the RTD condition, and a 7.3 % compliance difference. Consistent with the strength and stiffness trends, the ultimate strain for T40-800B/5320 was higher than that of IM7/977-3. Unlike the tensile case, the edgewise compression strength at ETD was a noticeably lower for both systems when compared to the RTD condition, with reduction of 26 % and 37 % for IM7/977-3 and T40-800B/5320-1 systems, respectively.
Table 3. Summary of average Edgewise Compression results
Test Condition
IM7/977-3 T40-800B/5320-1 Strength,
MPa, CV, %
Modulus, GPa,
CV, %
Ult. Strain, ,
CV, %
Strength, MPa,
CV, %
Modulus, GPa,
CV, %
Ult. Strain, ,
CV, % RTD 551, 14.2 63.1, 1.4 9,200, 15.0 664, 6.0 58.5, 3.6 12,500, 6.0
Splice/RTD 550, 8.6 63.7, 1.4 8,320, 8.3 559, 14.1 60.9, 8.9 10,000, 11.3 ETD 408, 9.4 61.0, 1.6 6,600, 9.6 418, 10.4 56.6, 1.9 7,500, 12.9
The average height of the bulge, caused by the core splice, was approximately ten times greater for the OoA compared to the autoclaved material. The average bulge height for the T40-800B/5320-1 panel was 0.8 mm. An example of typical core splice is depicted in the cross section photographs of Figure 5. It is clear from Figure 5 that the core splice causes a more pronounced bulge in the facesheet of the OoA system T40-800B/5320-1.
The average strength and strain-to-failure values show that the splice had minimal effect on the autoclaved system IM7/977-3. However, for the OoA system the splice resulted in 15.8 % and 20% reduction is strength and strain-to-failure, respectively.

Figure 5. Cross section photographs of the core splice region. A qualitative assessment of facesheet waviness can be made by comparing the deviation from the red line drawn on the
bagged side of each panel. The splice is located in the center of each photo.
3. ELEMENT TESTS
The main objective of the element tests was to provide an assessment on the effect of manufacturing imperfections on the mechanical performance of larger scale samples. Under this series of testing, two specimen sizes were chosen and loaded in edgewise compression at Room Temperature Ambient (RTA) condition. The ends of all specimens were potted in aluminum end plates to provide an essentially clamped end condition. Three specimens per material system measuring 20.3 cm wide by 27 cm long, and one specimen measuring 0.914 m wide by 1.524 m long were tested. The length dimension for both panel sizes refers to the free panel length between the end plates. One of the three 20.3 cm wide by 27 cm long panels for each system contain a core splice.
3.1 Small Panel Edgewise Compression
The dimensions (20.3 cm wide by 27 cm long) of the small panels were chosen such that they were several times greater than the size of the EWC coupons but small enough to allow for testing in widely available test frames (capacity less than 500 kN).
Being large enough to contain manufacturing imperfections such as tape gaps, surface wrinkles, etc, these specimens were part of a damage tolerance study where the interaction of impact damage and manufacturing defects could be assessed. However, in this paper only the baseline test results (panels as fabricated) will be reported and compared to the coupon test results.
3.1.1 Experimental Details
Following potting and machining of the specimen ends, each specimen was instrumented with four pairs of back-to-back strain gages. Each pair was located 38 mm from the end and 38 mm from the edge as indicated in Figure 6. Also evident in Figure 6 are wrinkles and tape gaps on the bagged surface of the T40-800B/5320-1 sample.
In addition to the strain gages, each specimen was speckled to allow for photogrammetric measurements of the full-field displacements and strains.

Specimens were tested in a test frame equipped with an adjustable platen. Before loading to failure each specimen was loaded to approximately 20 % of the expected ultimate load and held while the top loading platen, which was supported by a spherical bearing, was adjusted. The platen orientation was adjusted until the bending strain as indicated by each pair of back-to-back gages was less than 2 %. Following platen leveling verification, specimens were unloaded and then reloaded to failure at a loading rate of approximately 14 kN per minute.
Figure 6. Photograph of (20.3 cm wide by 27 cm long) test sample showing manufacturing imperfections on the bagged surface. Red circles highlight the strain gage positions.
3.1.2 Experimental Results
All tests were conducted at Room Temperature Ambient (RTA) conditions. Except for the OoA sample that failed close to the core splice location, all other samples failed close to the ends due to a high multiaxial state of stress at the corners. Consequently, the ultimate axial strain capacity of the facesheets was never reached. The axial strain attained by the OoA sample that failed at the core splice was 7,500 – 9.6 % lower than the average value of 8,300 .
Averaged values of strength, Young’s modulus, and ultimate strain are summarized in Table 4. Strength was calculated by dividing the maximum load by the total cross-sectional area of the facesheets – the core was neglected. Young’s modulus was calculated using the slope of the line fitted to the portion of the axial stress-strain curve between 1000 and 3000 . Axial strain was measured from photogrammetry by averaging the full-field strain over a 50 mm wide by 75 mm long central area on each surface. The axial strain used for the stress-strain plot (Young’s modulus derivation) represents the average between the two panel surfaces.

Despite the fact that strength and ultimate strain values were lower than those observed in the smaller samples, the results of Table 4 show the same general trend – the OoA system was stronger and more compliant than the in-autoclave system. Moreover, compared to the corresponding coupon tests, (Table 3) the Young’s moduli were very similar (within 2 %).
Table 4. Summary of average Panel Compression results
Test Condition
IM7/977-3 T40-800B/5320-1 Strength,
MPa CV, %
Modulus, GPa
CV, %
Ultimate Strain,
Strength, MPa
CV, %
Modulus, GPa
CV, %
Ultimate Strain,
RTA 356 63.0 5,900 451 59.6 8,300
An image of the full-field axial strain near ultimate load for an OoA sample is shown in Figure 7.
Figure 7. Full-field axial strain on the concave side of a T40-800B/5320-1 sample near the maximum load.
In addition to the strain concentration shown in the top right hand corner of the image, another noteworthy feature in the axial full-field response is the formation of the horizontal high strain bands in the center of the sample. These relatively uniformly spaced bands are due to facesheet waviness, often associated with facesheet wrinkling. The wavy response was observed in both material systems but was more pronounced for the OoA system. For both systems the horizontal high strain bands appeared to initiate at loads much lower than analysis would predict facesheet wrinkling for a perfectly flat facesheet. Therefore, the facesheet waviness shown in Figure 7 is not associated with an elastic foundation (core) instability type wrinkling. Instead it is a result of

some small preexisting imperfection in the surface of the aluminum honeycomb core, which influenced the shape of the co-cured facesheets. While very small, some of the preexisting waviness in the facesheet can be seen in Figure 5, away from the splice.
3.2 Buckling Tests
The first objective of the buckling tests was to assess the mechanical performance of each material system under a loading condition similar to that of the full-scale structure. The second objective was to provide data for Finite Element model verification. While each test was guided by pre-test buckling analyses, the results from these analyses are not presented in this paper.
Measuring 0.914 m wide by 1.524 m long, the buckling test samples were the largest pieces that could be removed from each manufacturing demonstration panel, and still allow enough material for the planned coupon and element tests. Both specimens contained a horizontal core splice, close to the center of each specimen. The presence of the splice provided the opportunity, particularly in the OoA system, to study the effect of the facesheet irregularity (bulging) on the buckling response.
3.2.1 Experimental Details
Both specimens had their ends potted in 25.4 mm thick aluminum end plates as shown in Figure 8. Following potting the ends were machined flat and parallel to within 0.05 mm. Before testing each specimen was scanned using a computerize laser scanner to determine the exact geometry and verify the machining tolerance of the end plates. Results indicated that the panels had a mild longitudinal bow (the center of the panel was closer to the axis of the cylinder) and essentially both panels resembled a saddle shape, instead of being perfectly cylindrical. The maximum deviation from the center straight line was approximately 0.5 mm. It is hypothesized that bowing was caused during the cool-down phase of the curing cycle due to the coefficient of thermal expansion mismatch between the composite facesheets and the aluminum honeycomb.
Geometric measurements also showed that the average (between the two facesheets) arc-length of the specimens was found to be 90.78 cm and 92.0 cm for IM7/977-3 and T40-800B/5320-1, respectively. The inside dimension between the end plates was the same for both samples and equal to 152.4 cm.
Each specimen was instrumented with a total of 28 strain gages. Strain gages were placed in back-to-back pairs and therefore the gage positions shown by the red numbers, in Figure 8, were identical on both specimen surfaces. The corner strain gage positions 1, 2, 8 and 9 were uniaxial strain gages and were used to verify platen leveling. The remaining gage positions consisted of pairs of orthogonal (0°/90°) strain gages.
In addition to strain gages, each surface of the panel was speckled to allow for photogrammetric full-field strain and displacement measurements.
The first panel, IM7/977-3, was tested in a 5.3 MN capacity test frame and platen leveling was achieved by shimming between a rigid tool surface resting on the top specimen-end-plate and the test-frame platen. The second panel (T40-800B/5320-1) was tested in a 2.7 MN capacity test frame equipped with an adjustable platen. Both panels were tested without edge support.

Figure 8. Photograph of the buckling panel showing the potted end and the strain gage positions on the concave surface.
Before loading to maximum load each specimen was loaded to approximately 20 % of expected buckling load and the loading platen, was shimmed or adjusted until the bending strain as indicated by each pair of back-to-back corner strain gages was less than 2 %. Following platen leveling verification, specimens were unloaded and then re-loaded to maximum load at a rate of approximately 25 kN per minute.
3.2.2 Experimental Results
The IM7/977-3 specimen was loaded until failure occurred close to the end plates. Buckling of the panel was verified prior to failure. Post-test NDE showed that damage was confined to the failed ends – no damage around the core splice or other manufacturing irregularities was detected. The T40-800B specimen was loaded until buckling was verified and then unloaded. Subsequent NDE inspection revealed no damage due to loading.
Because the two specimens had slightly different arc-lengths, buckling responses are compared in the form of running load (load over arc-length) against the central axial strains in Figure 9. Outer and Inner panel Diameter strains are denoted OD and ID, respectively.
While the overall buckling responses look very similar with buckling occurring at approximately the same running load of 3.6 kN/cm, one feature that stands out is the deviation of the OD from the ID strain response for a given specimen. In the case of the OoA specimen the strain responses begin to deviate from each other at approximately 2,000 , as opposed to 2,600 for the autoclaved specimen. This difference in strain deviation may be attributed to at least three factors: (a) differences in initial specimen geometry, (b) lower Young’s modulus of the OoA facesheets and (c) the less rigid test frame that was used to test the OoA specimen.
Another, difference between the two specimens is in the average stiffness, with IM7/977-3 being approximately 3.3 % stiffer than the T40-800B/5320-1 specimen. The stiffness difference between the two specimens more than doubles when stress is used instead of running load, and the trend is compatible with coupon stiffness results.

Figure 9. Running load versus axial strain for the two buckling panels.
4. DISCUSSION
Mechanical properties corresponding to the coupon level tests of this study can be found in the technical paper by Sutter et al [4] who reported results on solid laminates for various material systems including IM7/977-3 and T40-800B/5320. Despite the surface imperfections in both manufacturing demonstration panels, the mechanical properties reported in this study, are equivalent or superior to corresponding properties obtained by the previous study [4].
With the exception of the core-splice induced facesheet bulging, other manufacturing imperfections such as the rough surface of the OoA panel (due to the lack of caul plate during curing) had no significant influence on the mechanical response. The facesheet bulging caused by the core splice was more pronounced in the OoA system and, therefore, strength degradation due to the splice was observed for the OoA system only. At the coupon level, EWC samples containing a splice failed at approximately 10,000 as opposed to 7,500 for the larger element panels. This difference maybe attributed to the fact that the larger specimen, as compared to the more stubby (stable) coupon, is susceptible to additional instability modes, which promote a more complex state of stress at the splice. For the buckling tests, the core splice did not have any effect on the buckling load, as the maximum axial strain attained during those tests was less than 3,500
The same strength and stiffness trends for the two material systems were observed in tension and compression. Typically the OoA material was stronger and less stiff than the autoclaved material system. Both the tensile and compressive Young’s moduli were relatively unaffected by the test condition. However, the strength for both systems was greatly affected by elevated temperature. The greatest reductions (up to 37 %) in strength with temperature were observed in edgewise

compression. These large effects of temperature may be the result of several factors including (a) loss of foundation support as the honeycomb core became softer and promoted end failures, and to a lesser degree (b) the lower than expected, [3], measured Tg for both systems.
The relatively weak aluminum core was also shown to be the source of low elevated temperature strengths in the FWT samples, where all samples failed in the core. At ETW all flatwise tension samples failed by a combination of core failure and facesheet delamination. For this condition, the average FWT strength of the OoA material was 13.6 % higher than that of the autoclaved material, suggesting a stronger/tougher matrix for the OoA material. Since the quasi-isotropic lay-up contains only 25 % 0° fibers, it is reasonable to suggest that the OoA material’s superior strength/toughness also contributed to better strength performance in facesheet tension and edgewise compression tests.
For global buckling, which is a stiffness dominated response, the two material systems exhibited a very similar response with the running buckling load being almost identical for the two specimens. Given the fact that the measured facesheet densities were almost identical, [3], from a specific buckling-load point of view, the performance was also very similar.
5. CONCLUSIONS
For all tests and test conditions that involved facesheet strength, the OoA material system, T40-800B/5320-1, was stronger than the autoclaved material, IM7/977-3. However, the autoclaved system was consistently stiffer than the OoA system for all tests and all test conditions.
Due to lower curing pressure and lack of caul plate, manufacturing imperfections were more pronounced on the OoA panel. The only imperfection found to have an effect on coupon strength was associated with the core splice. The effect of the core splice on strength was also found to be dependent on the specimen scale. The core splice did not have any effect on the buckling response, presumably due to the relatively low axial strain attained by the facesheets during those tests.
6. REFERENCES
[1] Krivanek T. M. & Yount B. C., “Composite Payload Fairing Structural Architecture Assessment and Selection,” Proceedings of SAMPE 2012, Baltimore, Maryland, May 21-24, 2012.
[2] Pelham L., Sutter J. K., Cohen L. J., Stavana J., Houseal K., Western M., Harper R., Stuart M., Lort R., Zimmerman T. J., & Kelley D., “Large Scale Composite Manufacturing for Heavy Lift Launch Vehicles,” Proceedings of SAMPE 2012, Baltimore, Maryland, May 21-24, 2012.
[3] Lort R. D., Zimmerman T. J. & Miller S. G., “Facesheet Quality Analysis and Thermo-Physical Property Characterization of OoA and Autoclave Panels,” Proceedings of SAMPE 2012, Baltimore, Maryland, May 21-24, 2012.
[4] Sutter J. K., Kenner W. S., Pelham L., Miller S. G., Polis D. L., Nailadi C., Hou T. H., Guade D. J., Lerch B. D., Lort R. D., Zimmerman T. J., Walker J., Fikes J., and Bowman C., “Comparison of Autoclave and Out-of-Autoclave Composites for Heavy Lift Launch

Vehicles,” Proceedings of SAMPE Fall Technical Conference 2010, Salt Lake City, Utah October 11-14, 2010.