Embed Size (px)
Citation preview
344
Abstract High performance composites are exposed to severe loading and environ-mental conditions. In this work, mechanical properties of Fiberglass Re-inforced Polyester (FRP) manufactured by resin transfer molding were evaluated. The effect of the strain rate on mechanical properties under three quasi-static testing conditions, four fiber contents and several ori-entations was studied using instrumented tensile tests. A model was fit-ted to predict Tensile strength, Young’s modulus and shear modulus and the failed samples were analyzed to understand the failure mechanisms. The results showed that the fitted model is reliable enough to conclude about the effect of the fiber volume fraction and the strain rate on the mechanical properties. Young’s modulus and tensile strength increased when the strain rate is higher. Tensile strength also increased with fiber content (Vf) up to 41%. The predominant failure mechanism is
fiber rupture for the main directions and for the off-axis directions, the failure mechanisms are fiber pullout and delamination. Keywords Failure mechanism, Resin Transfer Molding, Shear modulus, Strain rate, Tensile strength, Young’s modulus.
Mechanical Characterization of Composites Manufactured by RTM Process: Effect of Fiber Content, Strain Rate and Orientation
1 INTRODUCTION
High performance composites (i.e those used in the manufacturing of parts requiring high strength and stiffness) are exposed to severe loading and environmental conditions. In many structural applications, parts made of com-posite materials are exposed to high velocity dynamic loadings causing multi-axial dynamic states of stress (Daniel, Werner, & Fenner, 2009). Polymer Matrix Composites (PMC’s) are a family of high performance composites comprised of: reinforcement (metallic, ceramic or polymeric) and a polymeric matrix. Since the matrix is a polymer, the composite material shows a viscoelastic or viscoplastic behavior, which can be described by the theory of cooperative relaxation (Drozdov, Al-Mulla, & Gupta, 2003; Sollich, 1998), in which the composite can be described as an assembly of Meso-Regions (MR’s) that are linked one another by physical cross-links, entanglements, van der Waals forces between macromolecules and arrangement of fibers. Viscoelasticity behavior is related to rear-rangement events occurring within each MR due to thermal and/or mechanical loads and it does not imply breakage of the MR’s links. On the other hand, viscoplasticity behavior is related to breakage of physical cross-links and sliding between MR’s. Sliding depends on the macroscopic strain rate and it is strongly affected by the fiber volume fraction of the composite, fiber architecture and fiber orientation. Accordingly, elastic properties, strength and failure mechanisms of PMC’s, whose relationship to the mesoscopic sliding of MR’s is given by the
Santa J.F. a,b,* Vanegas-Jaramillo J.D. a Patiño I.D. a
a Grupo de Materiales Avanzados y Energía-MATyER. Instituto Tecnoló-gico Metropolitano, Calle 54ª No 30-01. Medellín, Colombia.
b Grupo de Tribología y Superficies, Uni-versidad Nacional de Colombia Sede Me-dellín, Medellín, Colombia *Author email: [email protected] http://dx.doi.org/10.1590/1679-78252252
Received 01.07.2015 In revised form 03.11.2015 Accepted 08.11.2015 Available online 09.11.2015
J.F. Santa et al. / Mechanical Characterization of Composites Manufactured by RTM Process: Effect of Fiber Content, Strain Rate and Orientation 345
Latin American Journal of Solids and Structures 13 (2016) 344-364
Eyring theory (Shaw & MacKnight, 2005), can be also affected by the strain rate depending on the characteristics of the reinforcement.
Several authors (Daniel, Werner, & Fenner, 2011; Fereshteh-Saniee, Majzoobi, & Bahrami, 2005; G. Melin & E. Asp, 1999; Gilat, Goldberg, & Roberts, 2002; O I Okoli & Smith, 2000; Reis, Chaves, & da Costa Mattos, 2013; Reis, Coelho, Monteiro, & da Costa Mattos, 2012; Shokrieh & Omidi, 2009)have reported that PMC’s show a viscoplastic behavior and some mechanical properties such as tensile strength and Young’s Modulus, and failure mechanisms depend on the strain rate during testing. In the case of unidirectional PMC’s, most of authors agree that the Young’s modulus increases with the strain rate; however the magnitude of such increment depends on the material of the reinforcement, being greater for carbon-epoxy (Gilat et al., 2002)than for E Glass-epoxy composites (Fereshteh-Saniee et al., 2005; Shokrieh & Omidi, 2009). Regarding tensile strength, authors also report an increment of this property as the strain rate increases and the magnitude of that increment is highly influenced by the off-axis angle of the fibers and tends to be more pronounced as the value of the strain rate is larger for unidirectional composites (Gilat et al., 2002; Shokrieh & Omidi, 2009). The strain rate dependency of matrix-dominated properties of unidi-rectional carbon-epoxy composites has also been studied (Daniel et al., 2011), and it has been found that the change of the transverse and in-plane shear modulus , transverse tensile and compressive strength and in-plane shear strength could be considered linear with the logarithmic of the strain rate. The influence the strain rate in the transverse modulus of unidirectional carbon-epoxy composites with high fiber content, 65%, was also investigated by (G. Melin & E. Asp, 1999)and the authors found that the average transverse modulus remains constant with the strain rate and the initial transverse modulus decreases slightly with the increment of the strain rate, contradicting the results obtained by (Daniel et al., 2011), who obtained an important increment with the strain rate of the transverse modulus and the strength of samples manufactured by autoclave process.
The strain rate dependency of mechanical properties for bidirectional composites is still a controversial scien-tific topic. For example, for cross-ply plain E glass-epoxy composites, (Reis et al., 2012) pointed out that the Young’s modulus is almost insensitive to strain rates for a fiber volume content of 47% and engineering strain rates between1,6 10 1,6 10 , conversely to the strength, which is importantly influenced by the strain rate. In contrast, (Boey & Kwon, 2013) reported a relevant increment in the Young’s modulus of the composite with the strain rate for nominal strain rates between 5 10 5 10 , using a bidirec-tional fiberglass E cloth with vinylester resin. The authors also reported an important increment in the strength when the strain rate is higher. For composites E Glass-Polyurethane, a direct proportionality among the strain rate and both elastic modulus and tensile strength has been recently divulged for engineering strain rates among 2,0 10 2,0 10 (Reis et al., 2013). Regarding the Poisson ratio, (O I Okoli & Smith, 2000)found that it is not affected by the strain rate for glass cross-ply plain weave fabric at 47%, for strain rates between
3,0 10 and3s . However, the authors did not analyze whether the Poisson ratio is influenced or not by the strain rate for other values of fiber content. On the other hand, (Naik, Yernamma, Thoram, Gadipatri, & Kavala, 2010)compared the properties of quasi-static and high strain rate regimes for woven-fabric E-glass epoxy compo-sites, obtaining an increase from 63% to 88% in the high strain rate tensile strength with respect to the quasi-static tensile strength. Aditionally, the authors found that as the strain rate was increased, the tensile strength increased up to 16%. Other authors (Shokrieh, Mosalmani, & Omidi, 2014; Shokrieh, Mosalmani, & Shamaei, 2015)tested glass/ epoxy composites under similar strain rates used in this study. In (Shokrieh et al., 2014)the authors found that increasing quasi-static strain rates from 0,001 to 0,1s have no significant effect on Young’s modulus, contrary to the results predicted by the fit model of the present work for glass/polyester. In (Shokrieh et al., 2015)the authors also studied the modulus under the same testing conditions described in (Shokrieh et al., 2014)and they did not found a significant effect on that property, either.
The effect of the strain rate in the failure mode of PMC’s has also been studied. In general, when the composite is loaded in the fiber direction, it is accepted that fiber breakage is presented at low strain rates, while the fiber pull out tends to be the dominant mechanism as the strain rate increases (Daniel et al., 2011; O I Okoli & Smith, 2000; Okenwa I. Okoli & Abdul-Latif, 2002; Shokrieh & Omidi, 2009). One simple explanation of this phenomenon was exposed by (O I Okoli & Smith, 2000): when the strain rate increases, the strength and stiffness of the fibers also increase and the material tends to fail first by fiber pull out because the fiber-matrix interface strength is
346 J.F. Santa et al. / Mechanical Characterization of Composites Manufactured by RTM Process: Effect of Fiber Content, Strain Rate and Orientation
Latin American Journal of Solids and Structures 13 (2016) 344-364
exceeded before the ultimate tensile strength of the fiber is reached. Nevertheless, (Boey & Kwon, 2013)recently investigated the progressive failure of specimens under several strain rates by recording the tests and concluded that the failure started with matrix cracking and interfacial debonding, followed by fiber breakage, independently of the strain rate. On the other hand, the change of the size of the damaged region with the strain rate for unidirectional glass/epoxy composites was analyzed by (Shokrieh & Omidi, 2009) . They concluded that the extension of the damaged region further away from the fracture surface is larger as the strain rate is higher and that the fiber-matrix debonding tends to be more pronounced when the strain rate is higher. The failure of undirectional carbon-epoxy specimens loaded in the transverse direction was studied by (G. Melin & E. Asp, 1999), concluding that the damage is always initiated by small transverse cracks, independently of the strain rate value. Recently, (Woo & Kim, 2014)used the acoustic emission technique (AE) to study the characteristics of the failure progress in Kevlar-Woven composites, obtaining that the increment of the strain rate causes an increament of the peak stress and toughness, whereas the strain at the peak stress decreases. Other authors (Arbaoui, Tarfaoui, & El Malki Alaoui, 2015)have studied dynamic behavior of woven E-glass/vinylester laminate composites under by Split Hopkinson pressure bar tests. The authors found that the failure was dominated by fiber buckling and delamination and, when the strain rate increased from 224s to 882s , Young’s modulus decreased around 22%.
From the point of view of modeling, the classic Eyring’s theory states that the relationship among the elastic modulus, tensile strength and the strain rate is logarithmic and this approach have been used by some authors for unidirectional composites (Daniel et al., 2011). The phenomenological model can be written in a general form as shown in equation (1).
∙ (1)
where represents the property as a function of the strain rate and , are experimental constants. Nevertheless, other mathematical models have also been used for woven composites. For example, (Reis et al.,
2012)used the general expression shown in equation (2) for ultimate tensile strength depending on the strain rate, , and temperature, . On the other hand,(Reis et al., 2013)used equation (3) for the Young’s modulus and equation (4) for the ultimate tensile strength, in the analysis of the tensile behavior of glass fiber reinforced polyurethane at different strain rates. Other models separate the total strain into two components: elastic and plastic strain (Ogihara & Reifsnider, 2002; Thiruppukuzhi & Sun, 2001; Xing & Reifsnider, 2008), where the elastic strain is linear and it is described by the Hooke’s law using the effective Young’s modulus, depending on the off-axis angle between the fibers and the loading axis. On the other hand, the plastic strain component is described by the flow rule, that can be expressed in terms of the effective plastic strains, ̅ ,and of the effective plastic stresses, (Naik et al., 2010).
, (2)
(3)
(4)
The present investigation was performed to study the influence of the fiber content on the strain rate depend-ency of Young’s modulus, tensile strength and failure mechanisms of woven composites, when those materials undergo uniaxial loading for several orientations. An E-glass plain weave fabric was used with unsaturated poly-ester resin to manufacture test coupons with several fiber contents using the Resin Transfer Molding (RTM) process. After manufacturing the tests samples, instrumented tensile tests (strain gauges and extensometer) were performed using three different levels of strain rates, five different orientations, and four fiber contents, with the purpose to determine the effective elastic modulus and tensile strength. A least square fit model was developed to relate the mechanical properties (Young’s modulus or strength) with the orientation, strain rate and fiber content, and this model was then employed to analyze how the fiber content affects the behavior of the property with the strain rate and the orientation. Additionally, the influence of the fiber content and strain rate on the in-plane shear modulus was also studied. Shear modulus was estimated by using the transformation relation for the effective modulus at θ 45°. Finally, a Scanning Electron Microscope (SEM) was used to study the failure mechanisms of failed coupons.
J.F. Santa et al. / Mechanical Characterization of Composites Manufactured by RTM Process: Effect of Fiber Content, Strain Rate and Orientation 347
Latin American Journal of Solids and Structures 13 (2016) 344-364
2 EXPERIMENTAL SETUP
This section describes the materials and processes used to fabricate composite specimens as well as the testing equipment and testing procedures. Resin Transfer Molding (RTM) technique was used for manufacturing the composites coupons by using an injection pressure of 200 kPa. 2.1 Manufacturing of Composite Samples
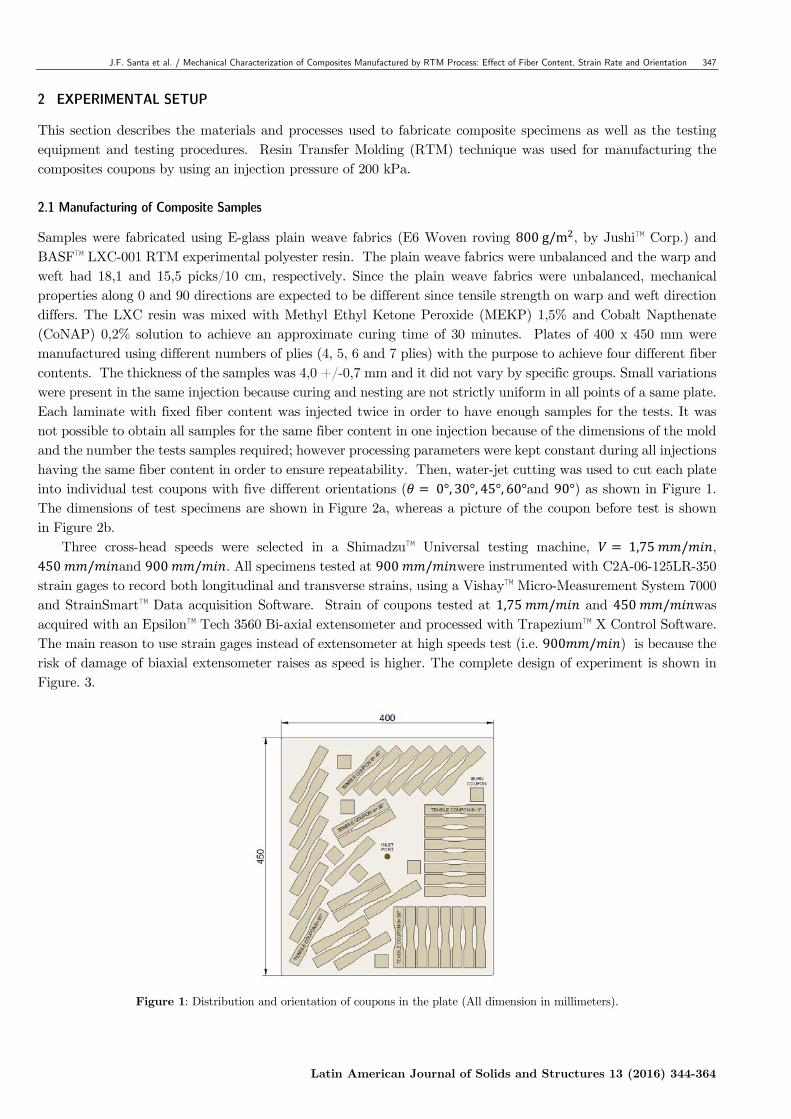
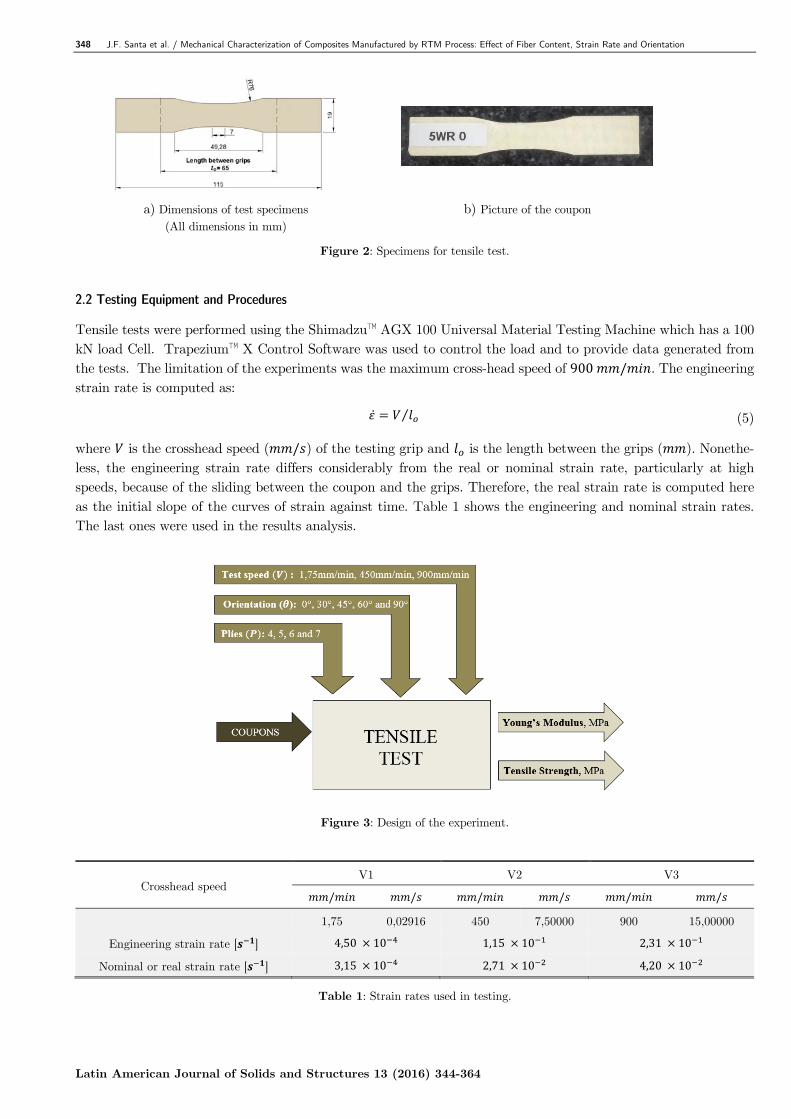
Samples were fabricated using E-glass plain weave fabrics (E6 Woven roving 800g/m , by Jushi™ Corp.) and BASF™ LXC-001 RTM experimental polyester resin. The plain weave fabrics were unbalanced and the warp and weft had 18,1 and 15,5 picks/10 cm, respectively. Since the plain weave fabrics were unbalanced, mechanical properties along 0 and 90 directions are expected to be different since tensile strength on warp and weft direction differs. The LXC resin was mixed with Methyl Ethyl Ketone Peroxide (MEKP) 1,5% and Cobalt Napthenate (CoNAP) 0,2% solution to achieve an approximate curing time of 30 minutes. Plates of 400 x 450 mm were manufactured using different numbers of plies (4, 5, 6 and 7 plies) with the purpose to achieve four different fiber contents. The thickness of the samples was 4,0 +/-0,7 mm and it did not vary by specific groups. Small variations were present in the same injection because curing and nesting are not strictly uniform in all points of a same plate. Each laminate with fixed fiber content was injected twice in order to have enough samples for the tests. It was not possible to obtain all samples for the same fiber content in one injection because of the dimensions of the mold and the number the tests samples required; however processing parameters were kept constant during all injections having the same fiber content in order to ensure repeatability. Then, water-jet cutting was used to cut each plate into individual test coupons with five different orientations ( 0°, 30°, 45°, 60°and 90°) as shown in Figure 1. The dimensions of test specimens are shown in Figure 2a, whereas a picture of the coupon before test is shown in Figure 2b.
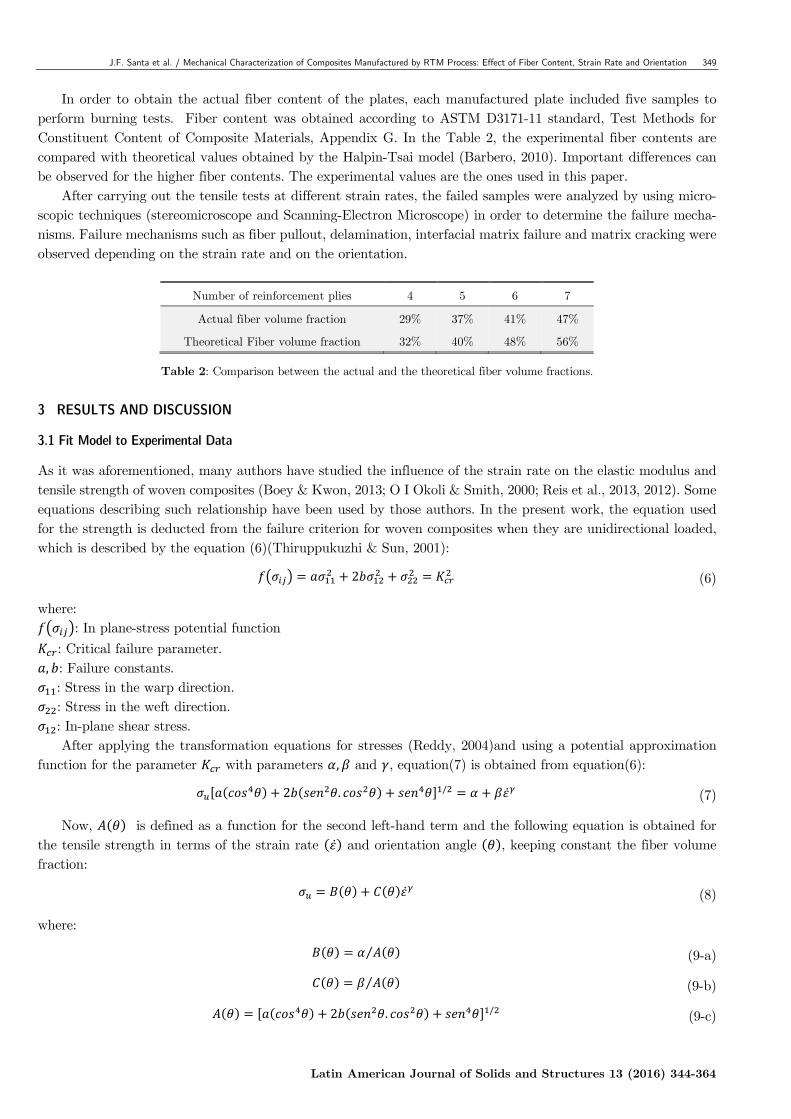
Three cross-head speeds were selected in a Shimadzu™ Universal testing machine, 1,75 / , 450 / and 900 / . All specimens tested at 900 / were instrumented with C2A-06-125LR-350 strain gages to record both longitudinal and transverse strains, using a Vishay™ Micro-Measurement System 7000 and StrainSmart™ Data acquisition Software. Strain of coupons tested at 1,75 / and 450 / was acquired with an Epsilon™ Tech 3560 Bi-axial extensometer and processed with Trapezium™ X Control Software. The main reason to use strain gages instead of extensometer at high speeds test (i.e. 900 / ) is because the risk of damage of biaxial extensometer raises as speed is higher. The complete design of experiment is shown in Figure. 3.
Figure 1: Distribution and orientation of coupons in the plate (All dimension in millimeters).
348 J.F. Santa et al. / Mechanical Characterization of Composites Manufactured by RTM Process: Effect of Fiber Content, Strain Rate and Orientation
Latin American Journal of Solids and Structures 13 (2016) 344-364
a) Dimensions of test specimens (All dimensions in mm)
b) Picture of the coupon
Figure 2: Specimens for tensile test.
2.2 Testing Equipment and Procedures
Tensile tests were performed using the Shimadzu™ AGX 100 Universal Material Testing Machine which has a 100 kN load Cell. Trapezium™ X Control Software was used to control the load and to provide data generated from the tests. The limitation of the experiments was the maximum cross-head speed of 900 / . The engineering strain rate is computed as:
⁄ (5)
where is the crosshead speed ( / ) of the testing grip and is the length between the grips ( ). Nonethe-less, the engineering strain rate differs considerably from the real or nominal strain rate, particularly at high speeds, because of the sliding between the coupon and the grips. Therefore, the real strain rate is computed here as the initial slope of the curves of strain against time. Table 1 shows the engineering and nominal strain rates. The last ones were used in the results analysis.
Figure 3: Design of the experiment.
Crosshead speed V1 V2 V3
/ / / / / /
1,75 0,02916 450 7,50000 900 15,00000
Engineering strain rate [ ] 4,50 10 1,15 10 2,31 10
Nominal or real strain rate [ ] 3,15 10 2,71 10 4,20 10
Table 1: Strain rates used in testing.
J.F. Santa et al. / Mechanical Characterization of Composites Manufactured by RTM Process: Effect of Fiber Content, Strain Rate and Orientation 349
Latin American Journal of Solids and Structures 13 (2016) 344-364
In order to obtain the actual fiber content of the plates, each manufactured plate included five samples to perform burning tests. Fiber content was obtained according to ASTM D3171-11 standard, Test Methods for Constituent Content of Composite Materials, Appendix G. In the Table 2, the experimental fiber contents are compared with theoretical values obtained by the Halpin-Tsai model (Barbero, 2010). Important differences can be observed for the higher fiber contents. The experimental values are the ones used in this paper.
After carrying out the tensile tests at different strain rates, the failed samples were analyzed by using micro-scopic techniques (stereomicroscope and Scanning-Electron Microscope) in order to determine the failure mecha-nisms. Failure mechanisms such as fiber pullout, delamination, interfacial matrix failure and matrix cracking were observed depending on the strain rate and on the orientation.
Number of reinforcement plies 4 5 6 7
Actual fiber volume fraction 29% 37% 41% 47%
Theoretical Fiber volume fraction 32% 40% 48% 56%
Table 2: Comparison between the actual and the theoretical fiber volume fractions. 3 RESULTS AND DISCUSSION
3.1 Fit Model to Experimental Data
As it was aforementioned, many authors have studied the influence of the strain rate on the elastic modulus and tensile strength of woven composites (Boey & Kwon, 2013; O I Okoli & Smith, 2000; Reis et al., 2013, 2012). Some equations describing such relationship have been used by those authors. In the present work, the equation used for the strength is deducted from the failure criterion for woven composites when they are unidirectional loaded, which is described by the equation (6)(Thiruppukuzhi & Sun, 2001):
2 (6)
where: : In plane-stress potential function
: Critical failure parameter. , : Failure constants.
: Stress in the warp direction. : Stress in the weft direction. : In-plane shear stress. After applying the transformation equations for stresses (Reddy, 2004)and using a potential approximation
function for the parameter with parameters , and , equation(7) is obtained from equation(6):
2 . / (7)
Now, is defined as a function for the second left-hand term and the following equation is obtained for the tensile strength in terms of the strain rate and orientation angle , keeping constant the fiber volume fraction:
(8)
where:
⁄ (9-a)
⁄ (9-b)
2 . / (9-c)
350 J.F. Santa et al. / Mechanical Characterization of Composites Manufactured by RTM Process: Effect of Fiber Content, Strain Rate and Orientation
Latin American Journal of Solids and Structures 13 (2016) 344-364
For the elastic modulus, an expression of the same form of (8) is also used. A similar expression was employed by (Reis et al., 2013)for elastic moduli of glass fiber reinforced polyurethane composites. Therefore, equation (8) can be rewritten in a general form as:
(10)
where " " stands for both the effective elastic modulus, , and the ultimate tensile strength, .
In a log-log space, a linear expression (equation (11)) is obtained from equation (10):
(11)
where:
(12-a)
log log (12-b)
(12-c)
The fitting parameters and are found from the experimental data using the least square fit method. Once those parameters are found, and can be also determined using equation (10) and equation (12b). Consequently, solving for in equation (12b) and substituting into equation (10), a quadratic equation is reached for :
. . 10 0 (13)
Accordingly, two possible solutions can be achieved for and . In this work, the solution with the best fit to the experimental data according to the 2 norm relative error is selected.
For the particular case of the strength, once and are found, equations (9a) (9b) and (9c) are used to estimate both the fitting constants for the critical failure parameter , and , and the failure constants, and . In this regard, the general form of the least square estimators for multiple regressions is as follows:
(14)
where:
.
2 . .
1
0
.
2 . .
0
1
.
.
J.F. Santa et al. / Mechanical Characterization of Composites Manufactured by RTM Process: Effect of Fiber Content, Strain Rate and Orientation 351
Latin American Journal of Solids and Structures 13 (2016) 344-364
⟨ , , , ⟩ : Vector of estimators : Number of angles considered in the experiments. In order to quantify the rate of change of the property " " (elastic modulus or tensile strength) with respect
to , the first derivative of equation (10) can be computed as:
(15)
The last procedure is repeated for each fiber volume fraction, , with the purpose to analyze the influence of the on the rate of change of the property with respect to the strain rate ⁄ , on the critical parameters, and , and on the failure constants, and .
3.2. Analysis of Tensile Strength
Most of authors agree that the ultimate tensile strength of woven composites tends to increase as the strain rate is higher, and this tendency is preserved independently of the off-axis angle. According to the results obtained in the present work for the fiber volume fraction 47%, this behavior cannot be validated for all angles. This
inconsistency among the theory and the experimental results can be attributed to the manufacturing process used to elaborate the samples and to the over-compaction phenomenon arising in the reinforcement.
As it was mentioned before, in order to avoid a substantial deformation of the preforms inside the cavity, the maximum allowable injection pressure used during the fabrication of the samples was 200 kPa. However, higher pressures could be required in RTM process when the fiber volume fraction is closed to50% in order to avoid low saturated zones in some parts of the cavity. Since lower pressures were used in this work, the probability to obtain low saturated zones in some samples of 47% could have been relevant.
On the other hand, a high compaction of the plain woven fabric could have caused detrimental effects such as rupture of some monofilaments and formation of localized zones with higher fiber content because of the nesting; in those zones, the impregnation could have been difficult (Barbero, 2010). It is very important to mention that the increment of the ultimate tensile strength with the strain rate for woven composites of similar fiber content to the maximum reached in this work has been reported elsewhere (Reis et al., 2012; Thiruppukuzhi & Sun, 2001). However, there is an important difference between the preforms used in those works and the woven plain-weave fabric used here, which is the degree of crimp. As an example, in the research of (Reis et al., 2012), a cross-ply plain weave having a small areal weight was employed, while in the work of (Thiruppukuzhi & Sun, 2001), a very low-crimped eight-harness satin weave was used. The crimp of warps and wefts of the textile architectures used by others authors was considerably smaller than the crimp of the woven fabric used here, permitting to reduce the possibility to obtain zones with highly localized fiber contents when the preforms are tightly packed. Thus, in consideration of the aforementioned explanations, the results for the strength corresponding to 47% are
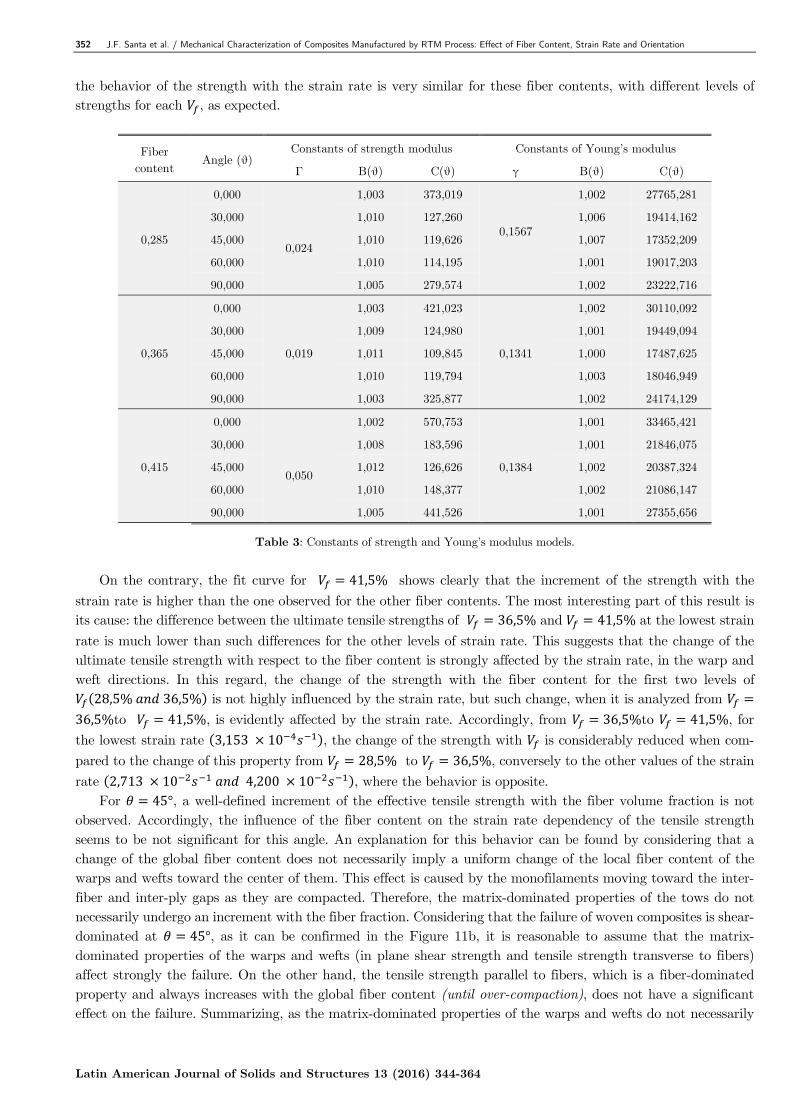
neglected in the present work to study the dependency of that property on the strain rate. Following the mathematical model presented in §3.1, the constants of strength and Young’s modulus models
are shown in the Table 3 according to the general model of equation (10). It is very important to notice that the parameter seems not to be markedly influenced by the angle in both cases, conversely to the parameter .
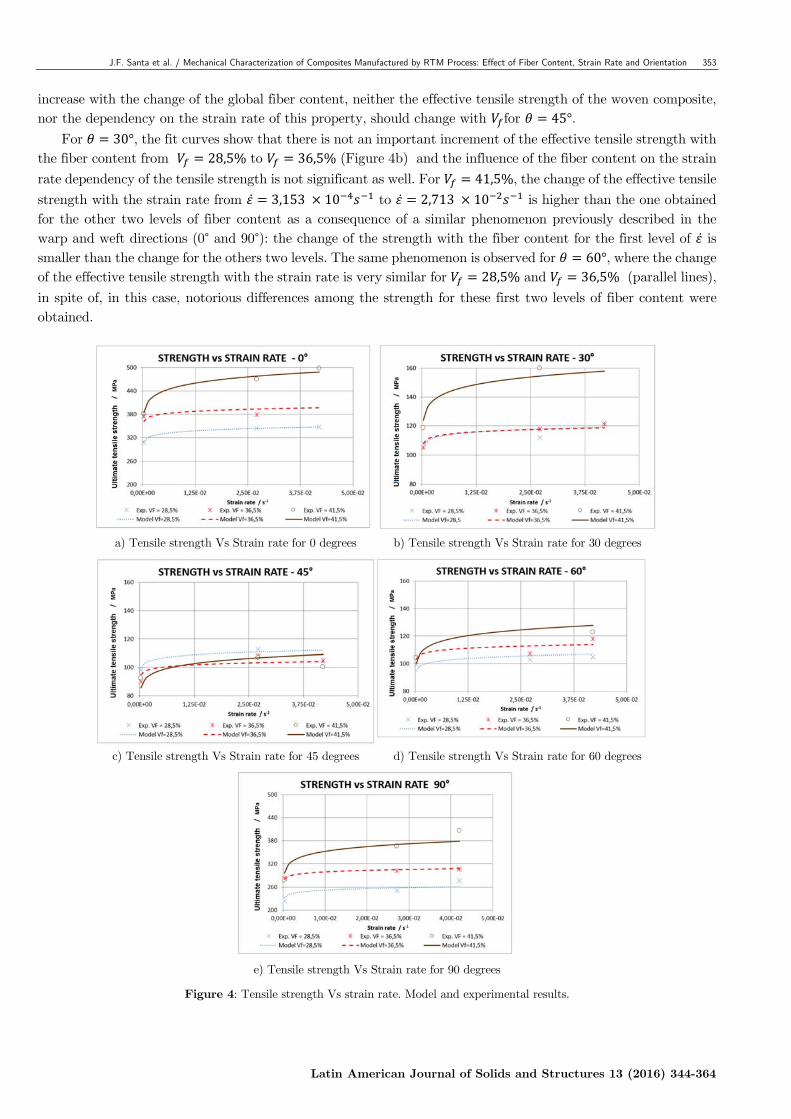
The comparison between the results predicted by the model and the experimental results is shown in Figure 4. The average L2 relative error norm is 2 6,41 10 . From the magnitude of the error it can be concluded that the model is reliable enough to describe the variations of the tensile strength with the strain rate. Based on this asseveration, the influence of the fiber content on the strain rate dependency of the tensile strength can also be interpreted from the plots of the fit model.
From Figure 4, it can be concluded that the maximum tensile strength is obtained for the main directions (0°and 90°, respectively) and the strength increases as the strain rate is higher for all the studied angles. For most of the angles (except for 45°), the strength also increases as the fiber volume fraction is higher. For the main directions of the woven fabric (0°and 90°), the nearly parallel lines for 28,5% and 36,5% indicate that
352 J.F. Santa et al. / Mechanical Characterization of Composites Manufactured by RTM Process: Effect of Fiber Content, Strain Rate and Orientation
Latin American Journal of Solids and Structures 13 (2016) 344-364
the behavior of the strength with the strain rate is very similar for these fiber contents, with different levels of strengths for each , as expected.
Fiber content
Angle (θ) Constants of strength modulus Constants of Young’s modulus
Γ B(θ) C(θ) γ B(θ) C(θ)
0,285
0,000
0,024
1,003 373,019
0,1567
1,002 27765,281
30,000 1,010 127,260 1,006 19414,162
45,000 1,010 119,626 1,007 17352,209
60,000 1,010 114,195 1,001 19017,203
90,000 1,005 279,574 1,002 23222,716
0,365
0,000
0,019
1,003 421,023
0,1341
1,002 30110,092
30,000 1,009 124,980 1,001 19449,094
45,000 1,011 109,845 1,000 17487,625
60,000 1,010 119,794 1,003 18046,949
90,000 1,003 325,877 1,002 24174,129
0,415
0,000
0,050
1,002 570,753
0,1384
1,001 33465,421
30,000 1,008 183,596 1,001 21846,075
45,000 1,012 126,626 1,002 20387,324
60,000 1,010 148,377 1,002 21086,147
90,000 1,005 441,526 1,001 27355,656
Table 3: Constants of strength and Young’s modulus models.
On the contrary, the fit curve for 41,5% shows clearly that the increment of the strength with the
strain rate is higher than the one observed for the other fiber contents. The most interesting part of this result is its cause: the difference between the ultimate tensile strengths of 36,5% and 41,5% at the lowest strain
rate is much lower than such differences for the other levels of strain rate. This suggests that the change of the ultimate tensile strength with respect to the fiber content is strongly affected by the strain rate, in the warp and weft directions. In this regard, the change of the strength with the fiber content for the first two levels of
28,5% 36,5% is not highly influenced by the strain rate, but such change, when it is analyzed from 36,5%to 41,5%, is evidently affected by the strain rate. Accordingly, from 36,5%to 41,5%, for the lowest strain rate 3,153 10 , the change of the strength with is considerably reduced when com-pared to the change of this property from 28,5% to 36,5%, conversely to the other values of the strain rate 2,713 10 4,200 10 , where the behavior is opposite.
For 45°, a well-defined increment of the effective tensile strength with the fiber volume fraction is not observed. Accordingly, the influence of the fiber content on the strain rate dependency of the tensile strength seems to be not significant for this angle. An explanation for this behavior can be found by considering that a change of the global fiber content does not necessarily imply a uniform change of the local fiber content of the warps and wefts toward the center of them. This effect is caused by the monofilaments moving toward the inter-fiber and inter-ply gaps as they are compacted. Therefore, the matrix-dominated properties of the tows do not necessarily undergo an increment with the fiber fraction. Considering that the failure of woven composites is shear-dominated at 45°, as it can be confirmed in the Figure 11b, it is reasonable to assume that the matrix-dominated properties of the warps and wefts (in plane shear strength and tensile strength transverse to fibers) affect strongly the failure. On the other hand, the tensile strength parallel to fibers, which is a fiber-dominated property and always increases with the global fiber content (until over-compaction), does not have a significant effect on the failure. Summarizing, as the matrix-dominated properties of the warps and wefts do not necessarily
J.F. Santa et al. / Mechanical Characterization of Composites Manufactured by RTM Process: Effect of Fiber Content, Strain Rate and Orientation 353
Latin American Journal of Solids and Structures 13 (2016) 344-364
increase with the change of the global fiber content, neither the effective tensile strength of the woven composite, nor the dependency on the strain rate of this property, should change with for 45°.
For 30°, the fit curves show that there is not an important increment of the effective tensile strength with the fiber content from 28,5% to 36,5% (Figure 4b) and the influence of the fiber content on the strain rate dependency of the tensile strength is not significant as well. For 41,5%, the change of the effective tensile strength with the strain rate from 3,153 10 to 2,713 10 is higher than the one obtained for the other two levels of fiber content as a consequence of a similar phenomenon previously described in the warp and weft directions (0° and 90°): the change of the strength with the fiber content for the first level of is smaller than the change for the others two levels. The same phenomenon is observed for 60°, where the change of the effective tensile strength with the strain rate is very similar for 28,5% and 36,5% (parallel lines),
in spite of, in this case, notorious differences among the strength for these first two levels of fiber content were obtained.
a) Tensile strength Vs Strain rate for 0 degrees b) Tensile strength Vs Strain rate for 30 degrees
c) Tensile strength Vs Strain rate for 45 degrees d) Tensile strength Vs Strain rate for 60 degrees
e) Tensile strength Vs Strain rate for 90 degrees
Figure 4: Tensile strength Vs strain rate. Model and experimental results.
354 J.F. Santa et al. / Mechanical Characterization of Composites Manufactured by RTM Process: Effect of Fiber Content, Strain Rate and Orientation
Latin American Journal of Solids and Structures 13 (2016) 344-364
Generally speaking, for 30°and 60°, and between the maximum and minimum level of the fiber content 28,5%and 41,5% , there is an increment of the ultimate effective tensile strength with .
This increment implies that the failure does not exclusively depend on matrix-dominated properties, as in the case of 45° , but it also depends on the tensile strength in the warps and wefts direction, which rises as the global V increases. Some authors have confirmed this conclusion by reporting that the failure modes in woven composites for the analyzed off-axis angles cannot be decoupled as it is usually done in unidirectional composites (Thiruppukuzhi & Sun, 2001).
Since the change of the ultimate tensile effective strength with the fiber content might be taken as an indication of the influence of the tensile strength of the tows (warps and wefts) on the failure of the woven composite, two cases can be considered: 1. the variation of the ultimate effective strength with is not relevant or not well-defined, as in the case of 45°, 2. The variation of the ultimate effective strength with is significant, as for
the other angles. For the former case, the failure of the woven composite can be mainly attributed to the properties of the micro-structure that are less sensitive to the global fiber content (the matrix-dominated properties). For the second case, the tensile strength of the warps and wefts, which is a fiber-dominated property, significantly affects the effective tensile strength of the composite and its influence in the failure of the woven composite will be more significant.
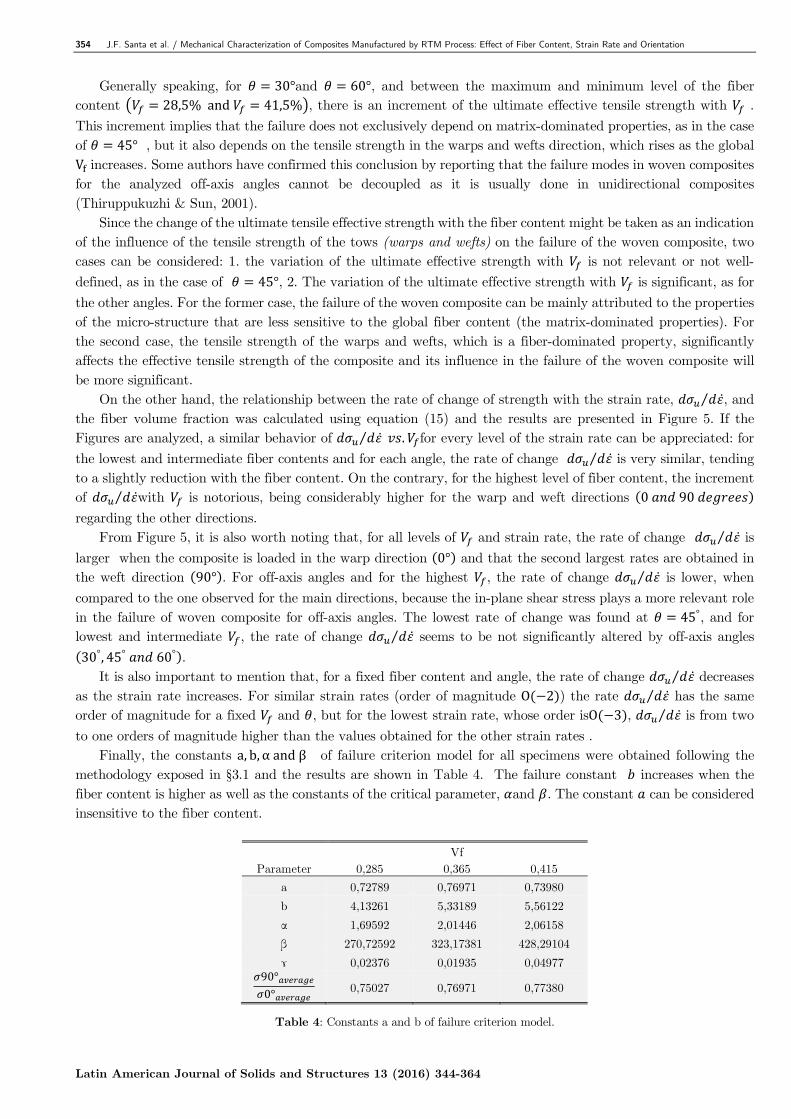
On the other hand, the relationship between the rate of change of strength with the strain rate, ⁄ , and the fiber volume fraction was calculated using equation (15) and the results are presented in Figure 5. If the Figures are analyzed, a similar behavior of ⁄ . for every level of the strain rate can be appreciated: for the lowest and intermediate fiber contents and for each angle, the rate of change ⁄ is very similar, tending to a slightly reduction with the fiber content. On the contrary, for the highest level of fiber content, the increment of ⁄ with is notorious, being considerably higher for the warp and weft directions 0 90
regarding the other directions. From Figure 5, it is also worth noting that, for all levels of and strain rate, the rate of change ⁄ is
larger when the composite is loaded in the warp direction 0° and that the second largest rates are obtained in the weft direction 90° . For off-axis angles and for the highest , the rate of change ⁄ is lower, when
compared to the one observed for the main directions, because the in-plane shear stress plays a more relevant role in the failure of woven composite for off-axis angles. The lowest rate of change was found at 45°, and for lowest and intermediate , the rate of change ⁄ seems to be not significantly altered by off-axis angles
30°, 45° 60° . It is also important to mention that, for a fixed fiber content and angle, the rate of change ⁄ decreases
as the strain rate increases. For similar strain rates (order of magnitude O 2 ) the rate ⁄ has the same order of magnitude for a fixed and , but for the lowest strain rate, whose order isO 3 , ⁄ is from two
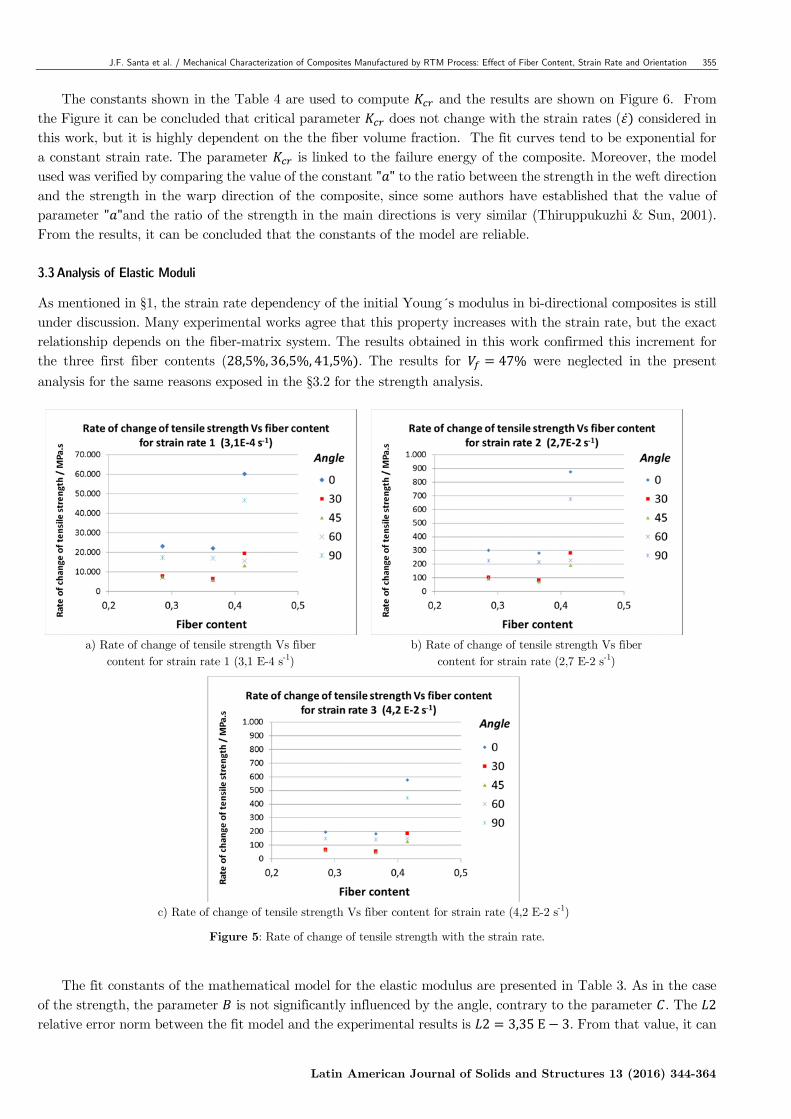
to one orders of magnitude higher than the values obtained for the other strain rates . Finally, the constants a, b, αandβ of failure criterion model for all specimens were obtained following the
methodology exposed in §3.1 and the results are shown in Table 4. The failure constant increases when the fiber content is higher as well as the constants of the critical parameter, and . The constant can be considered insensitive to the fiber content.
Vf Parameter 0,285 0,365 0,415
a 0,72789 0,76971 0,73980
b 4,13261 5,33189 5,56122
α 1,69592 2,01446 2,06158
β 270,72592 323,17381 428,29104
ɤ 0,02376 0,01935 0,04977 90°0°
0,75027 0,76971 0,77380
Table 4: Constants a and b of failure criterion model.
J.F. Santa et al. / Mechanical Characterization of Composites Manufactured by RTM Process: Effect of Fiber Content, Strain Rate and Orientation 355
Latin American Journal of Solids and Structures 13 (2016) 344-364
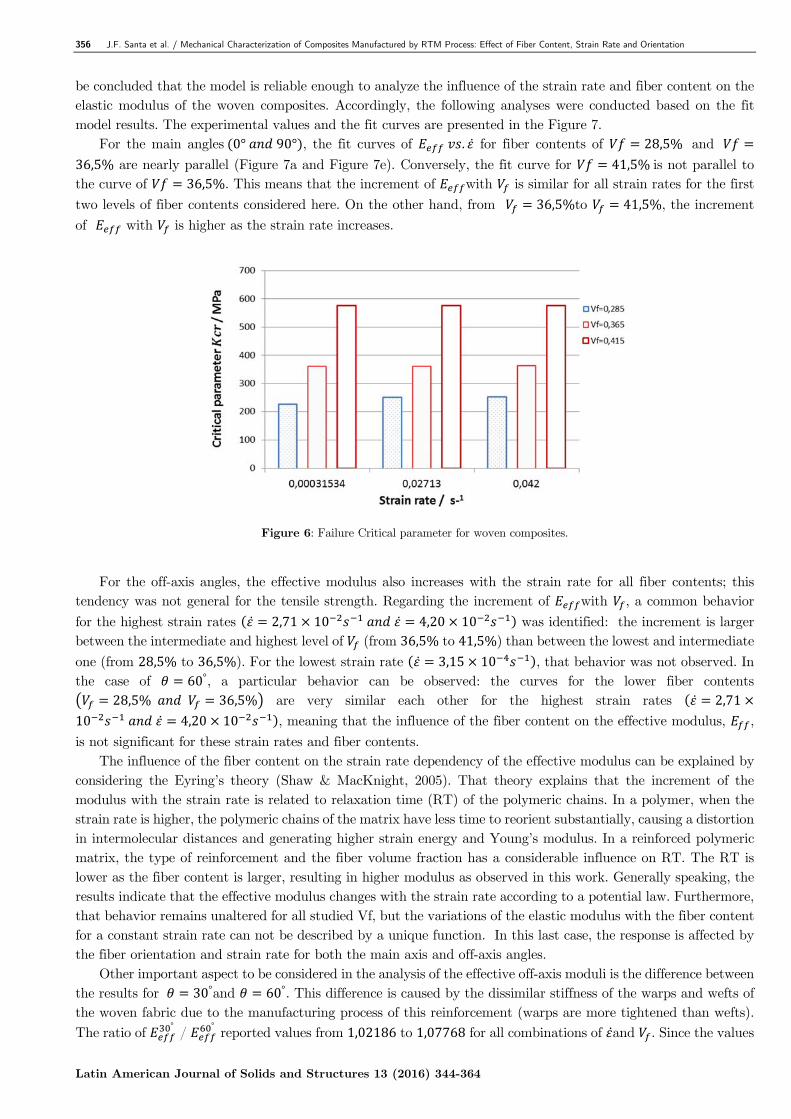
The constants shown in the Table 4 are used to compute and the results are shown on Figure 6. From the Figure it can be concluded that critical parameter does not change with the strain rates ( considered in this work, but it is highly dependent on the the fiber volume fraction. The fit curves tend to be exponential for a constant strain rate. The parameter is linked to the failure energy of the composite. Moreover, the model used was verified by comparing the value of the constant " " to the ratio between the strength in the weft direction and the strength in the warp direction of the composite, since some authors have established that the value of parameter " "and the ratio of the strength in the main directions is very similar (Thiruppukuzhi & Sun, 2001). From the results, it can be concluded that the constants of the model are reliable. 3.3 Analysis of Elastic Moduli
As mentioned in §1, the strain rate dependency of the initial Young´s modulus in bi-directional composites is still under discussion. Many experimental works agree that this property increases with the strain rate, but the exact relationship depends on the fiber-matrix system. The results obtained in this work confirmed this increment for the three first fiber contents (28,5%, 36,5%, 41,5% . The results for 47% were neglected in the present analysis for the same reasons exposed in the §3.2 for the strength analysis.
a) Rate of change of tensile strength Vs fiber content for strain rate 1 (3,1 E-4 s-1)
b) Rate of change of tensile strength Vs fiber content for strain rate (2,7 E-2 s-1)
c) Rate of change of tensile strength Vs fiber content for strain rate (4,2 E-2 s-1)
Figure 5: Rate of change of tensile strength with the strain rate.
The fit constants of the mathematical model for the elastic modulus are presented in Table 3. As in the case
of the strength, the parameter is not significantly influenced by the angle, contrary to the parameter . The 2 relative error norm between the fit model and the experimental results is 2 3,35E 3. From that value, it can
356 J.F. Santa et al. / Mechanical Characterization of Composites Manufactured by RTM Process: Effect of Fiber Content, Strain Rate and Orientation
Latin American Journal of Solids and Structures 13 (2016) 344-364
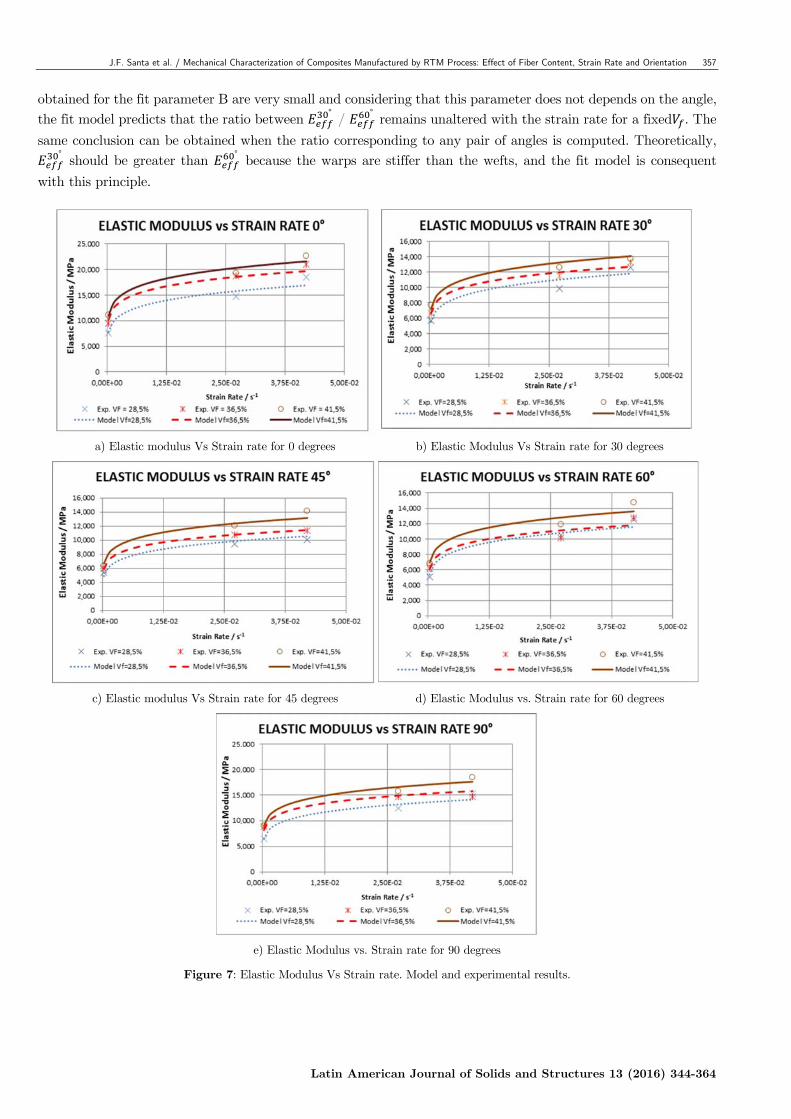
be concluded that the model is reliable enough to analyze the influence of the strain rate and fiber content on the elastic modulus of the woven composites. Accordingly, the following analyses were conducted based on the fit model results. The experimental values and the fit curves are presented in the Figure 7.
For the main angles 0° 90° , the fit curves of . for fiber contents of 28,5% and
36,5% are nearly parallel (Figure 7a and Figure 7e). Conversely, the fit curve for 41,5%is not parallel to the curve of 36,5%. This means that the increment of with is similar for all strain rates for the first two levels of fiber contents considered here. On the other hand, from 36,5%to 41,5%, the increment of with is higher as the strain rate increases.
Figure 6: Failure Critical parameter for woven composites.
For the off-axis angles, the effective modulus also increases with the strain rate for all fiber contents; this
tendency was not general for the tensile strength. Regarding the increment of with , a common behavior
for the highest strain rates 2,71 10 4,20 10 was identified: the increment is larger between the intermediate and highest level of (from 36,5% to 41,5%) than between the lowest and intermediate
one (from 28,5% to 36,5%). For the lowest strain rate 3,15 10 , that behavior was not observed. In the case of 60°, a particular behavior can be observed: the curves for the lower fiber contents
28,5% 36,5% are very similar each other for the highest strain rates 2,71
10 4,20 10 , meaning that the influence of the fiber content on the effective modulus, ,
is not significant for these strain rates and fiber contents. The influence of the fiber content on the strain rate dependency of the effective modulus can be explained by
considering the Eyring’s theory (Shaw & MacKnight, 2005). That theory explains that the increment of the modulus with the strain rate is related to relaxation time (RT) of the polymeric chains. In a polymer, when the strain rate is higher, the polymeric chains of the matrix have less time to reorient substantially, causing a distortion in intermolecular distances and generating higher strain energy and Young’s modulus. In a reinforced polymeric matrix, the type of reinforcement and the fiber volume fraction has a considerable influence on RT. The RT is lower as the fiber content is larger, resulting in higher modulus as observed in this work. Generally speaking, the results indicate that the effective modulus changes with the strain rate according to a potential law. Furthermore, that behavior remains unaltered for all studied Vf, but the variations of the elastic modulus with the fiber content for a constant strain rate can not be described by a unique function. In this last case, the response is affected by the fiber orientation and strain rate for both the main axis and off-axis angles.
Other important aspect to be considered in the analysis of the effective off-axis moduli is the difference between the results for 30°and 60°. This difference is caused by the dissimilar stiffness of the warps and wefts of the woven fabric due to the manufacturing process of this reinforcement (warps are more tightened than wefts). The ratio of
° /
° reported values from 1,02186 to 1,07768 for all combinations of and . Since the values
J.F. Santa et al. / Mechanical Characterization of Composites Manufactured by RTM Process: Effect of Fiber Content, Strain Rate and Orientation 357
Latin American Journal of Solids and Structures 13 (2016) 344-364
obtained for the fit parameter B are very small and considering that this parameter does not depends on the angle, the fit model predicts that the ratio between
° /
° remains unaltered with the strain rate for a fixed . The
same conclusion can be obtained when the ratio corresponding to any pair of angles is computed. Theoretically, ° should be greater than
° because the warps are stiffer than the wefts, and the fit model is consequent
with this principle.
a) Elastic modulus Vs Strain rate for 0 degrees b) Elastic Modulus Vs Strain rate for 30 degrees
c) Elastic modulus Vs Strain rate for 45 degrees d) Elastic Modulus vs. Strain rate for 60 degrees
e) Elastic Modulus vs. Strain rate for 90 degrees
Figure 7: Elastic Modulus Vs Strain rate. Model and experimental results.
358 J.F. Santa et al. / Mechanical Characterization of Composites Manufactured by RTM Process: Effect of Fiber Content, Strain Rate and Orientation
Latin American Journal of Solids and Structures 13 (2016) 344-364
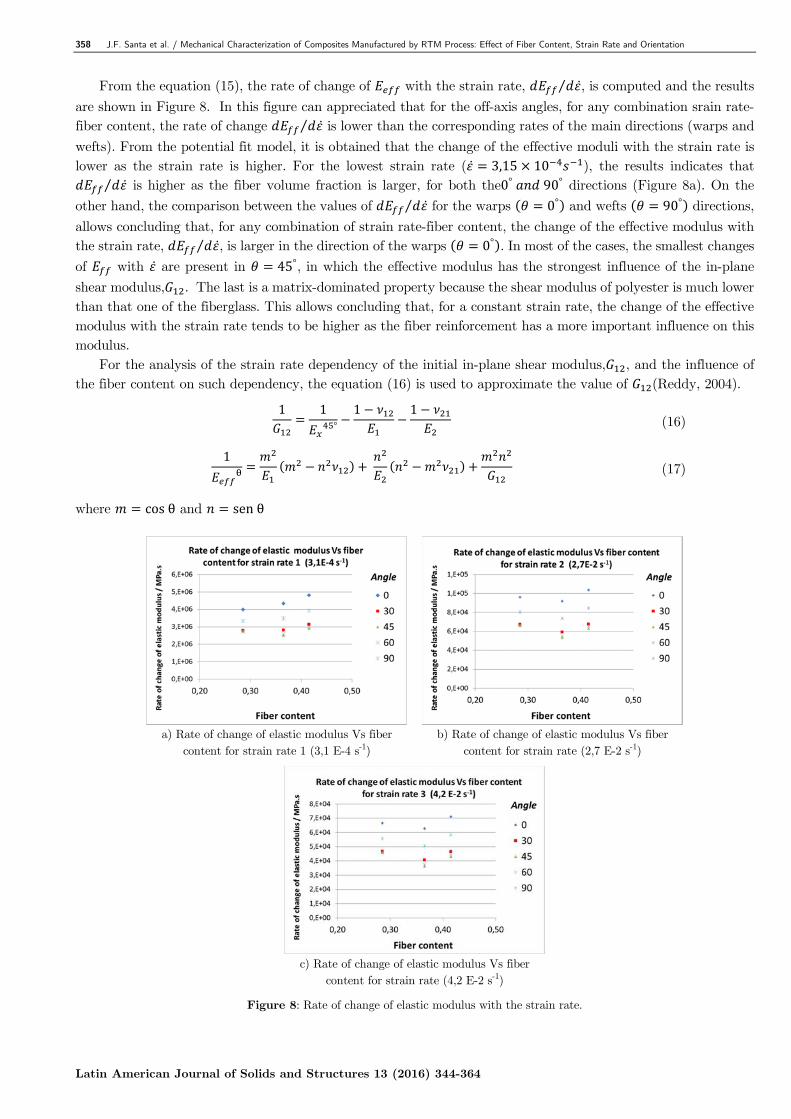
From the equation (15), the rate of change of with the strain rate, ⁄ , is computed and the results
are shown in Figure 8. In this figure can appreciated that for the off-axis angles, for any combination srain rate-fiber content, the rate of change ⁄ is lower than the corresponding rates of the main directions (warps and
wefts). From the potential fit model, it is obtained that the change of the effective moduli with the strain rate is lower as the strain rate is higher. For the lowest strain rate ( 3,15 10 ), the results indicates that
⁄ is higher as the fiber volume fraction is larger, for both the0° 90° directions (Figure 8a). On the other hand, the comparison between the values of ⁄ for the warps 0° and wefts 90° directions,
allows concluding that, for any combination of strain rate-fiber content, the change of the effective modulus with the strain rate, ⁄ , is larger in the direction of the warps 0° . In most of the cases, the smallest changes of with are present in 45°, in which the effective modulus has the strongest influence of the in-plane shear modulus, . The last is a matrix-dominated property because the shear modulus of polyester is much lower than that one of the fiberglass. This allows concluding that, for a constant strain rate, the change of the effective modulus with the strain rate tends to be higher as the fiber reinforcement has a more important influence on this modulus.
For the analysis of the strain rate dependency of the initial in-plane shear modulus, , and the influence of the fiber content on such dependency, the equation (16) is used to approximate the value of (Reddy, 2004).
1 1°
1 1 (16)
1 (17)
where cosθ and senθ
a) Rate of change of elastic modulus Vs fiber content for strain rate 1 (3,1 E-4 s-1)
b) Rate of change of elastic modulus Vs fiber content for strain rate (2,7 E-2 s-1)
c) Rate of change of elastic modulus Vs fiber content for strain rate (4,2 E-2 s-1)
Figure 8: Rate of change of elastic modulus with the strain rate.
J.F. Santa et al. / Mechanical Characterization of Composites Manufactured by RTM Process: Effect of Fiber Content, Strain Rate and Orientation 359
Latin American Journal of Solids and Structures 13 (2016) 344-364
This equation is derived from the transformation of coordinates, stresses and strains for single generally or-thotropic laminate subjected to a plane-stress condition, where the strains can be considered infinitesimal, as in the case of the present work. The equation predicts more accurate results for laminates stacked with unidirectional or low-crimped layers; for plain woven fabrics, as the one used in this work, the accuracy is lower since the interlacing effects are not considered in that equation. Therefore, the results obtained from this approximation can be useful in this case to evaluate tendencies, but do not necessarily represent the exact value of the property
. In order to assess the estimation of , the off-axis effective moduli for 30° and 60°are calculated using the equation (17), which is a generalization of equation (16), and these values are compared with the ones obtained with the fit model and from the experiments.
According to equation (16), Poisson’s ratio in the main directions, and , must be known to obtain . Some authors have shown previously that Poisson’s ratio is slightly affected by the strain rate for cross-ply plain weave fabrics (O I Okoli & Smith, 2000). Therefore, in this work, the average values of and for each
are used for the calculation of and they are shown in Table 5, where they are also compared the experimental and theoretical ratios ν12 / ν21,obtaining satisfactory results.
Vf 1= 28,5 % Vf 2= 31,5 % Vf 3= 41,5%
Poisson ratio / ν12 0,155 0,182 0,178
Poisson ratio / ν21 0,141 0,161 0,153
ν12 / ν21 (Experimental) 1,10 1,13 1,17
ν12 / ν21 (Theoretical) 1,20 1,25 1,22
Relative Error 8,05% 9,18% 4,59%
Table 5: Average values of and .
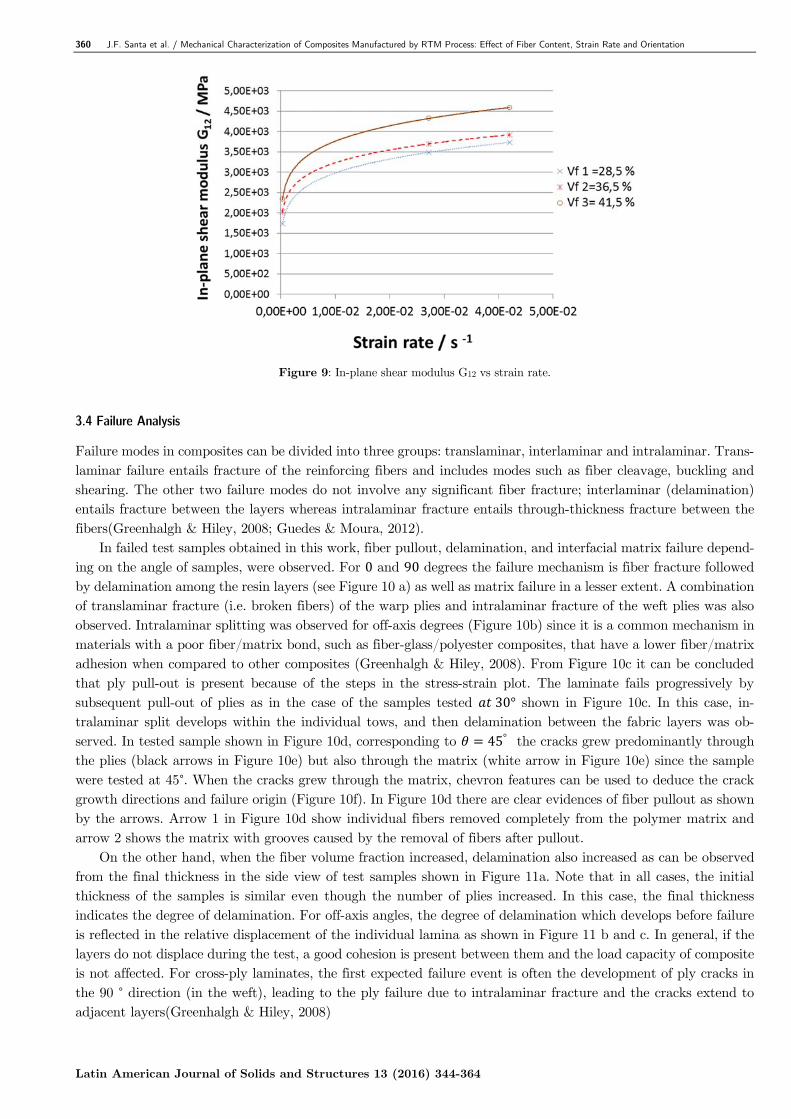
Figure 9 shows calculated in-plane shear modulus for several strain rates and fiber contents. From the fit
model it can be concluded that the increment of with is of potential type for all fiber contents. If the strain rate is kept constant, the value of G increases with the increment of the fiber content. This increment of G with is almost linear for the lowest strain rate, as it is predicted by some theoretical models (Halpin Tsai, inverse rule of mixtures, periodic microstructure, etc) (Barbero, 2010). However, for the other strain rate levels this linear behavior is not observed, and the change of with respect to is more significant as increases.
A possible explanation of this phenomenon at the highest strain rates, 2,71 10 4,2010 , is the non-fulfillment of the main assumption of the theoretical models for the calculation of , namely, the perfect bonding between the fiber and the matrix. This occurs because fiber pull-out is the predominant failure mechanism for 2,71 10 4,20 10 , as it can be obseved in §3.4. This pull-out can be present from the beginning of the tests, contravening this basic assumption. On the other hand, if the rate of change of the in-plane shear modulus with the strain rate, ⁄ , is analyzed from Figure 9 (note that all the plots are almost parallel), it can be concluded that ⁄ does not change significantly with and the highest values of ⁄ are found for the lowest strain rate.
In order to finish the analysis in the present section, equation (16) and the Poisson’s ratios experimentally found were validated. Firstly, Table 5 shows the comparison among the experimental and theoretical ratios ⁄ , where it can be concluded that the relative errors are acceptable for the experimental tests. Secondly, equation (17) was used to compute the values of the effective moduli
°and
°. The comparison between these results
with the ones of the fit model and with the ones experimentally found is an indication of the reliability of the constants , and .The average relative errors for
°, when compared theoretical results with the fit
model ones is 2,63%, whereas the error after comparing the theoretical results with the experimental ones is 5,49%. For
°, the average relative errors are 2,61% and 5,82%, respectively. Accordingly, it can
be inferred that the in-plane shear modulus and Poisson’s ratios obtained are reliable enough to study the influence of the strain rate and fiber content on them.
360 J.F. Santa et al. / Mechanical Characterization of Composites Manufactured by RTM Process: Effect of Fiber Content, Strain Rate and Orientation
Latin American Journal of Solids and Structures 13 (2016) 344-364
Figure 9: In-plane shear modulus G12 vs strain rate.
3.4 Failure Analysis
Failure modes in composites can be divided into three groups: translaminar, interlaminar and intralaminar. Trans-laminar failure entails fracture of the reinforcing fibers and includes modes such as fiber cleavage, buckling and shearing. The other two failure modes do not involve any significant fiber fracture; interlaminar (delamination) entails fracture between the layers whereas intralaminar fracture entails through-thickness fracture between the fibers(Greenhalgh & Hiley, 2008; Guedes & Moura, 2012).
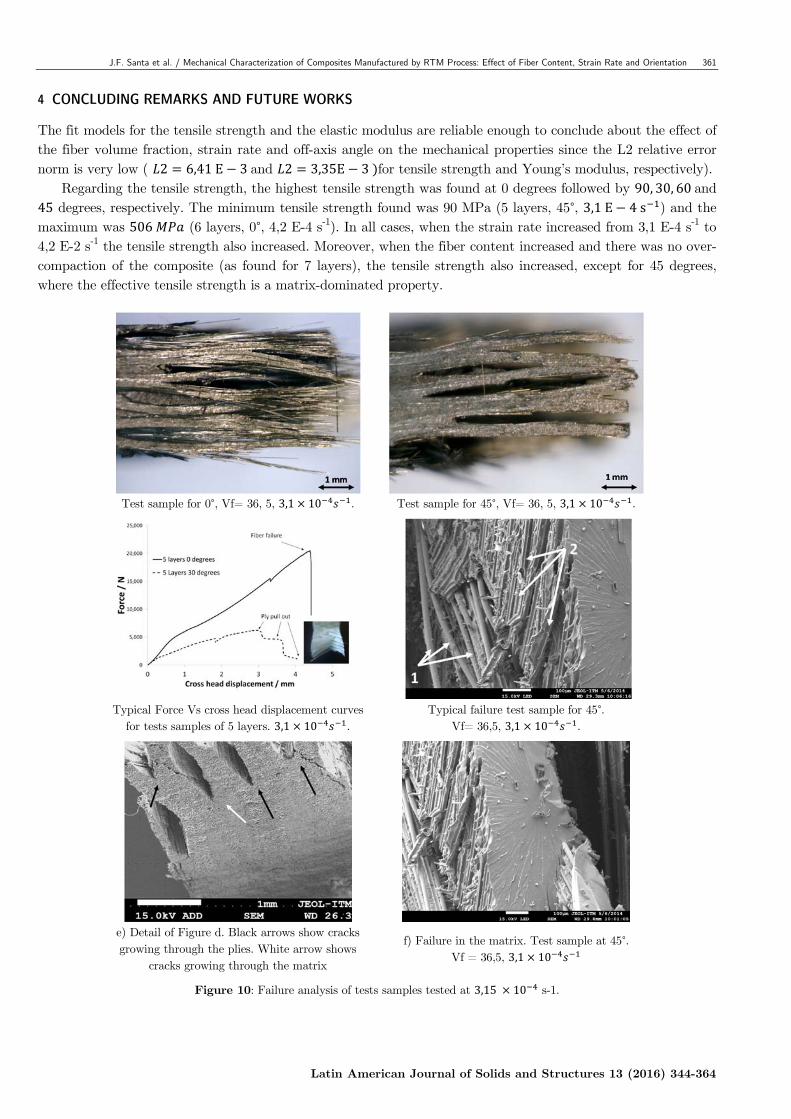
In failed test samples obtained in this work, fiber pullout, delamination, and interfacial matrix failure depend-ing on the angle of samples, were observed. For 0 and 90 degrees the failure mechanism is fiber fracture followed by delamination among the resin layers (see Figure 10 a) as well as matrix failure in a lesser extent. A combination of translaminar fracture (i.e. broken fibers) of the warp plies and intralaminar fracture of the weft plies was also observed. Intralaminar splitting was observed for off-axis degrees (Figure 10b) since it is a common mechanism in materials with a poor fiber/matrix bond, such as fiber-glass/polyester composites, that have a lower fiber/matrix adhesion when compared to other composites (Greenhalgh & Hiley, 2008). From Figure 10c it can be concluded that ply pull-out is present because of the steps in the stress-strain plot. The laminate fails progressively by subsequent pull-out of plies as in the case of the samples tested 30° shown in Figure 10c. In this case, in-tralaminar split develops within the individual tows, and then delamination between the fabric layers was ob-served. In tested sample shown in Figure 10d, corresponding to 45° the cracks grew predominantly through the plies (black arrows in Figure 10e) but also through the matrix (white arrow in Figure 10e) since the sample were tested at 45°. When the cracks grew through the matrix, chevron features can be used to deduce the crack growth directions and failure origin (Figure 10f). In Figure 10d there are clear evidences of fiber pullout as shown by the arrows. Arrow 1 in Figure 10d show individual fibers removed completely from the polymer matrix and arrow 2 shows the matrix with grooves caused by the removal of fibers after pullout.
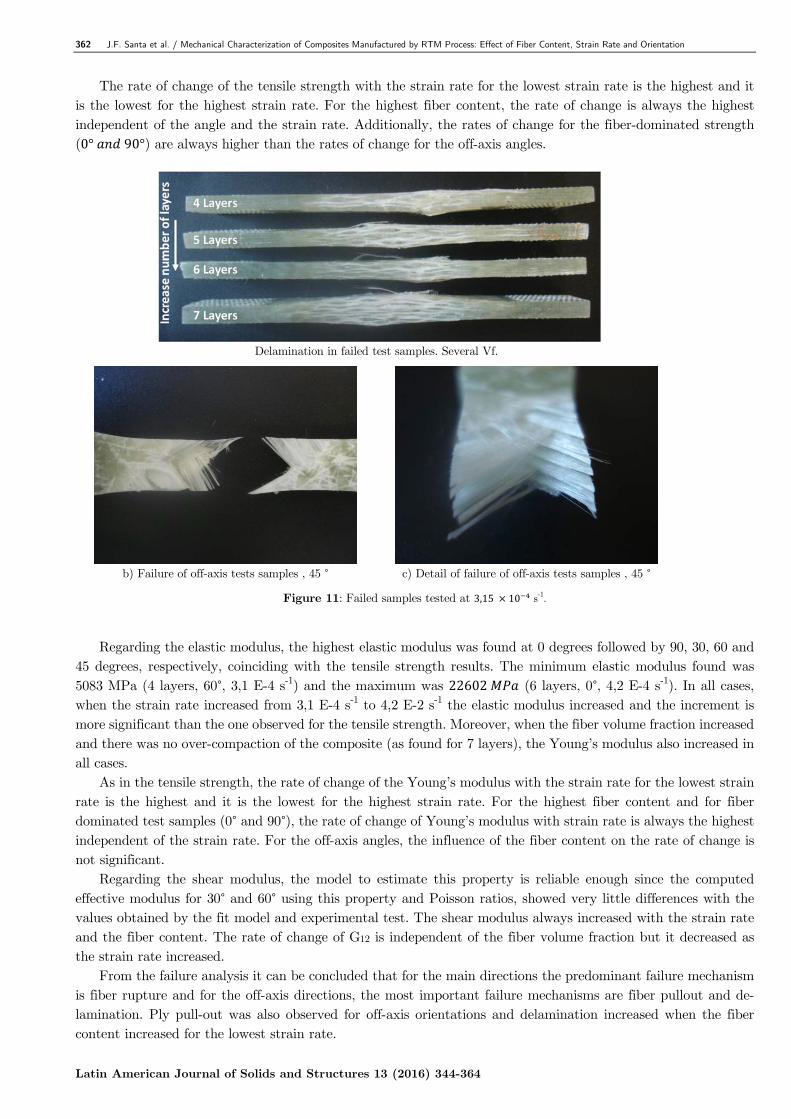
On the other hand, when the fiber volume fraction increased, delamination also increased as can be observed from the final thickness in the side view of test samples shown in Figure 11a. Note that in all cases, the initial thickness of the samples is similar even though the number of plies increased. In this case, the final thickness indicates the degree of delamination. For off-axis angles, the degree of delamination which develops before failure is reflected in the relative displacement of the individual lamina as shown in Figure 11 b and c. In general, if the layers do not displace during the test, a good cohesion is present between them and the load capacity of composite is not affected. For cross-ply laminates, the first expected failure event is often the development of ply cracks in the 90 ° direction (in the weft), leading to the ply failure due to intralaminar fracture and the cracks extend to adjacent layers(Greenhalgh & Hiley, 2008)
J.F. Santa et al. / Mechanical Characterization of Composites Manufactured by RTM Process: Effect of Fiber Content, Strain Rate and Orientation 361
Latin American Journal of Solids and Structures 13 (2016) 344-364
4 CONCLUDING REMARKS AND FUTURE WORKS
The fit models for the tensile strength and the elastic modulus are reliable enough to conclude about the effect of the fiber volume fraction, strain rate and off-axis angle on the mechanical properties since the L2 relative error norm is very low ( 2 6,41E 3and 2 3,35E 3 for tensile strength and Young’s modulus, respectively).
Regarding the tensile strength, the highest tensile strength was found at 0 degrees followed by 90, 30, 60and 45 degrees, respectively. The minimum tensile strength found was 90 MPa (5 layers, 45°, 3,1E 4s ) and the maximum was 506 (6 layers, 0°, 4,2 E-4 s-1). In all cases, when the strain rate increased from 3,1 E-4 s-1 to 4,2 E-2 s-1 the tensile strength also increased. Moreover, when the fiber content increased and there was no over-compaction of the composite (as found for 7 layers), the tensile strength also increased, except for 45 degrees, where the effective tensile strength is a matrix-dominated property.
Test sample for 0°, Vf= 36, 5, 3,1 10 . Test sample for 45°, Vf= 36, 5, 3,1 10 .
Typical Force Vs cross head displacement curves
for tests samples of 5 layers. 3,1 10 . Typical failure test sample for 45°.
Vf= 36,5, 3,1 10 .
e) Detail of Figure d. Black arrows show cracks growing through the plies. White arrow shows
cracks growing through the matrix
f) Failure in the matrix. Test sample at 45°. Vf = 36,5, 3,1 10
Figure 10: Failure analysis of tests samples tested at 3,15 10 s-1.
362 J.F. Santa et al. / Mechanical Characterization of Composites Manufactured by RTM Process: Effect of Fiber Content, Strain Rate and Orientation
Latin American Journal of Solids and Structures 13 (2016) 344-364
The rate of change of the tensile strength with the strain rate for the lowest strain rate is the highest and it is the lowest for the highest strain rate. For the highest fiber content, the rate of change is always the highest independent of the angle and the strain rate. Additionally, the rates of change for the fiber-dominated strength (0° 90°) are always higher than the rates of change for the off-axis angles.
Delamination in failed test samples. Several Vf.
b) Failure of off-axis tests samples , 45 ° c) Detail of failure of off-axis tests samples , 45 °
Figure 11: Failed samples tested at 3,15 10 s-1.
Regarding the elastic modulus, the highest elastic modulus was found at 0 degrees followed by 90, 30, 60 and
45 degrees, respectively, coinciding with the tensile strength results. The minimum elastic modulus found was 5083 MPa (4 layers, 60°, 3,1 E-4 s-1) and the maximum was 22602 (6 layers, 0°, 4,2 E-4 s-1). In all cases, when the strain rate increased from 3,1 E-4 s-1 to 4,2 E-2 s-1 the elastic modulus increased and the increment is more significant than the one observed for the tensile strength. Moreover, when the fiber volume fraction increased and there was no over-compaction of the composite (as found for 7 layers), the Young’s modulus also increased in all cases.
As in the tensile strength, the rate of change of the Young’s modulus with the strain rate for the lowest strain rate is the highest and it is the lowest for the highest strain rate. For the highest fiber content and for fiber dominated test samples (0° and 90°), the rate of change of Young’s modulus with strain rate is always the highest independent of the strain rate. For the off-axis angles, the influence of the fiber content on the rate of change is not significant.
Regarding the shear modulus, the model to estimate this property is reliable enough since the computed effective modulus for 30° and 60° using this property and Poisson ratios, showed very little differences with the values obtained by the fit model and experimental test. The shear modulus always increased with the strain rate and the fiber content. The rate of change of G12 is independent of the fiber volume fraction but it decreased as the strain rate increased.
From the failure analysis it can be concluded that for the main directions the predominant failure mechanism is fiber rupture and for the off-axis directions, the most important failure mechanisms are fiber pullout and de-lamination. Ply pull-out was also observed for off-axis orientations and delamination increased when the fiber content increased for the lowest strain rate.
J.F. Santa et al. / Mechanical Characterization of Composites Manufactured by RTM Process: Effect of Fiber Content, Strain Rate and Orientation 363
Latin American Journal of Solids and Structures 13 (2016) 344-364
Future works will be focused on the development of models for higher strain rates and new tests will be performed to validate the model for carbon composites. Acknowledgment
The authors would like to acknowledge Instituto Tecnológico Metropolitano for technical support. Financial support provided by Research projects P13127 is also acknowledged. Polymers laboratory of Instituto Tecnológico Metropolitano provided the equipment and technical support for this paper.
References
Arbaoui, J., Tarfaoui, M., & El Malki Alaoui, A. (2015). Mechanical behavior and damage kinetics of woven E-glass/vinylester laminate composites under high strain rate dynamic compressive loading: Experimental and numerical investigation. International Journal of Impact Engineering, In press, 1–11. http://doi.org/10.1016/j.ijimpeng.2015.06.026
Barbero, J. E. (2010). Introduction to composites materials. (C. Press, Ed.). Boca Raton: CRC Pess.
Boey, Y. K., & Kwon, Y. W. (2013). Progressive damage and failure strength of notched woven fabric composites under axial loading with varying strain rates. Composite Structures, 96, 824–832. http://doi.org/10.1016/j.compstruct.2012.09.035
Daniel, I. M., Werner, B. T., & Fenner, J. S. (2009). Mechanical Behaviour and Failure Criteria of Composite Materials Under Static and Dynamic Loading. In 50th AIAA/ASME/ASCE/AHS/ASC Structures, Structural dynamic and Material Conference.
Daniel, I. M., Werner, B. T., & Fenner, J. S. (2011). Strain-rate-dependent failure criteria for composites. Composites Science and Technology, 71(3), 357–364. http://doi.org/10.1016/j.compscitech.2010.11.028
Drozdov, a. D., Al-Mulla, a., & Gupta, R. K. (2003). The viscoelastic and viscoplastic behavior of polymer composites: polycarbonate reinforced with short glass fibers. Computational Materials Science, 28(1), 16–30. http://doi.org/10.1016/S0927-0256(03)00058-2
Fereshteh-Saniee, F., Majzoobi, G. H., & Bahrami, M. (2005). An experimental study on the behavior of glass–epoxy composite at low strain rates. Journal of Materials Processing Technology, 162-163, 39–45. http://doi.org/10.1016/j.jmatprotec.2005.02.011
G. Melin, L., & E. Asp, L. (1999). Effects of strain rate on transverse tension properties of a carbon/epoxy composite: studied by moir{é} photography. Composites Part A: Applied Science and Manufacturing, 30(3), 305–316. http://doi.org/10.1016/S1359-835X(98)00123-7
Gilat, A., Goldberg, R. K., & Roberts, G. D. (2002). Experimental study of strain-rate-dependent behavior of carbon / epoxy com-posite, 62, 1469–1476.
Greenhalgh, E. S., & Hiley, M. J. (2008). Fractography of polymer composites: current status and future issues. In 13th European Conference on Composite Materials.
Guedes, R. ., & Moura, M. F. (2012). Matrix Controlled Failure Modes of Polymeric Composites. Wiley Encyclopedia of Composites.
Naik, N. K., Yernamma, P., Thoram, N. M., Gadipatri, R., & Kavala, V. R. (2010). High strain rate tensile behavior of woven fabric E-glass/epoxy composite. Polymer Testing, 29(1), 14–22. http://doi.org/10.1016/j.polymertesting.2009.08.010
Ogihara, S., & Reifsnider, K. L. (2002). Characterization of Nonlinear Behavior in Woven Composite Laminates. Applied Composite Materials, 9, 249–263.
Okoli, O. I., & Abdul-Latif, A. (2002). Failure in composite laminates: overview of an attempt at prediction. Composites Part A, 33(3), 315–321. http://doi.org/10.1016/S1359-835X(01)00127-0
Okoli, O. I., & Smith, G. F. (2000). The effect of strain rate and fibre content on the Poisson’s ratio of glass / epoxy composites. Composite Structures, 48, 157–161.
Reddy, J. N. (2004). Mechanics of Laminated Composite Plates and Shells Theory and Analysis. (Second). New York.: CRC Press.
Reis, J. M. L., Chaves, F. L., & da Costa Mattos, H. S. (2013). Tensile behaviour of glass fibre reinforced polyurethane at different strain rates. Materials & Design, 49, 192–196. http://doi.org/10.1016/j.matdes.2013.01.065
Reis, J. M. L., Coelho, J. L. V., Monteiro, a. H., & da Costa Mattos, H. S. (2012). Tensile behavior of glass/epoxy laminates at varying strain rates and temperatures. Composites Part B: Engineering, 43(4), 2041–2046. http://doi.org/10.1016/j.compo-sitesb.2012.02.005
Shaw, M. ., & MacKnight, W. J. (2005). Introduction to Polymer Viscoelasticity (3rd Editio). Wiley.
Shokrieh, M. M., Mosalmani, R., & Omidi, M. J. (2014). Strain-rate dependent micromechanical method to investigate the strength properties of glass/epoxy composites. Composite Structures, 111(1), 232–239. http://doi.org/10.1016/j.compstruct.2014.01.001
Shokrieh, M. M., Mosalmani, R., & Shamaei, A. R. (2015). A combined micromechanical–numerical model to simulate shear behavior of carbon nanofiber/epoxy nanocomposites. Materials \& Design, 67, 531–537. http://doi.org/10.1016/j.matdes.2014.10.077
364 J.F. Santa et al. / Mechanical Characterization of Composites Manufactured by RTM Process: Effect of Fiber Content, Strain Rate and Orientation
Latin American Journal of Solids and Structures 13 (2016) 344-364
Shokrieh, M. M., & Omidi, M. J. (2009). Tension behavior of unidirectional glass/epoxy composites under different strain rates. Composite Structures, 88(4), 595–601. http://doi.org/10.1016/j.compstruct.2008.06.012
Sollich, P. (1998). Rheological constitutive equation for model of soft glassy materials. Physical Review E, 58(1), 738. http://doi.org/10.1103/PhysRevE.58.738
Thiruppukuzhi, S. V., & Sun, C. T. (2001). Models for the strain-rate-dependent behavior of polymer composites. Composites Science and Technology, 61(1), 1–12. http://doi.org/10.1016/S0266-3538(00)00133-0
Woo, S.-C., & Kim, T.-W. (2014). High-strain-rate impact in Kevlar-woven composites and fracture analysis using acoustic emission. Composites Part B: Engineering, 60, 125–136. http://doi.org/10.1016/j.compositesb.2013.12.054
Xing, L., & Reifsnider, K. L. (2008). Progressive Failure Modeling for Dynamic Loading of Woven Composites. Applied Composite Materials, 15(1), 1–11. http://doi.org/10.1007/s10443-008-9053-7