Embed Size (px)
Citation preview
Construction and Building Materials 52 (2014) 396–403
Contents lists available at ScienceDirect
Construction and Building Materials
journal homepage: www.elsevier .com/locate /conbui ldmat
Mechanical and microstructural dissimilarities in alkali-activationfor six Class F Korean fly ashes
0950-0618/$ - see front matter � 2013 Elsevier Ltd. All rights reserved.http://dx.doi.org/10.1016/j.conbuildmat.2013.11.058
⇑ Corresponding author. Tel.: +82 52 217 2815; fax: +82 52 217 2819.E-mail address: [email protected] (J.E. Oh).
Yubin Jun, Jae Eun Oh ⇑School of Urban and Environmental Engineering, Ulsan National Institute of Science and Technology (UNIST), UNIST-gil 50, Ulju-gun, Ulsan 689-798, Republic of Korea
h i g h l i g h t s
� Six different fly ashes were used to address strength differences after activation.� There was a correlation between the Si/Al ratios of products and the strengths.� The Al-rich chabazite formation is related to the higher strength than zeolite A–Na.
a r t i c l e i n f o
Article history:Received 31 May 2013Received in revised form 28 October 2013Accepted 13 November 2013Available online 8 December 2013
Keywords:Class F fly ashAlkali-activationGeopolymerXRDSEM
a b s t r a c t
This study presents the preliminary investigation for the microstructural characteristics of the alkali-acti-vated fly ashes, synthesized using six different Korean Class F fly ashes, to address the large mechanicalstrength differences between the activated ashes using compressive strength testing, XRF, XRD, and SEM/EDS (YAG BSE, SE and elemental mapping). The results show that although the original fly ashes are notmuch different in XRD and XRF data, the reaction products after activation were dissimilar between theactivated ashes. Particularly, the activated sample containing Al-rich chabazite produced much highercompressive strength than the other samples with zeolite A–Na. The SEM/EDS results exhibit that theactivated fly ashes tended to have the higher compressive strengths as the reaction products possessedthe lower Si/Al ratios down to one.
� 2013 Elsevier Ltd. All rights reserved.
1. Introduction
Coal fly ash is a by-product from burning pulverized coal incoal-fired power plants. Approximately 5.29 million tons of flyash is annually produced and a considerable portion of the ash isstill buried in landfills in South Korea [1]. As environmental prob-lems of fly ash disposal become serious worldwide, the recycling offly ash emerges as a significant environmental and economical is-sue [2] and thus extensive studies are being carried out by manyresearchers.
Geopolymer synthesized using coal fly ash has appeared as anovel engineering binding material [3,4]. It is well known thatgeopolymer has a great potential to be an effective alternativeto ordinary portland cement since it possesses excellent mechan-ical properties, acid resistance, fire resistance and thermal stabil-ity [5,6]. Geopolymer is generally synthesized by mixingaluminosilicate-reactive materials with strong alkaline solutions(e.g., solutions made from sodium hydroxide, potassium
hydroxide, sodium silicate, sodium carbonate or sodium sulfate).Under the strong alkaline environment, Si, Al and others minorelements dissolved from fly ash particles begin to form geopoly-meric gel [7–9].
Although many earlier studies have researched on the synthe-sis of fly ash-based geopolymer, there is still a substantial needfor further investigations, particularly due to the high complexityand heterogeneity of fly ashes. The objective of this investigationis to experimentally examine the characteristics of alkali-acti-vated fly ashes made with six different fly ash sources, as wellas the reaction products determining the mechanical and micro-structural properties by means of compressive strength testing,X-ray diffraction (XRD) and high-resolution field emission scan-ning electron microscopy (FE-SEM) equipped with energy disper-sive spectrometer (EDS) analysis. The fly ashes studied here arethe most widely present ones in South Korea. Activator andexperimental conditions (i.e., activator type, activator concentra-tion and curing temperature history) were chosen to make thisstudy more suitable for economical commercialization of Koranfly ash geopolymer.
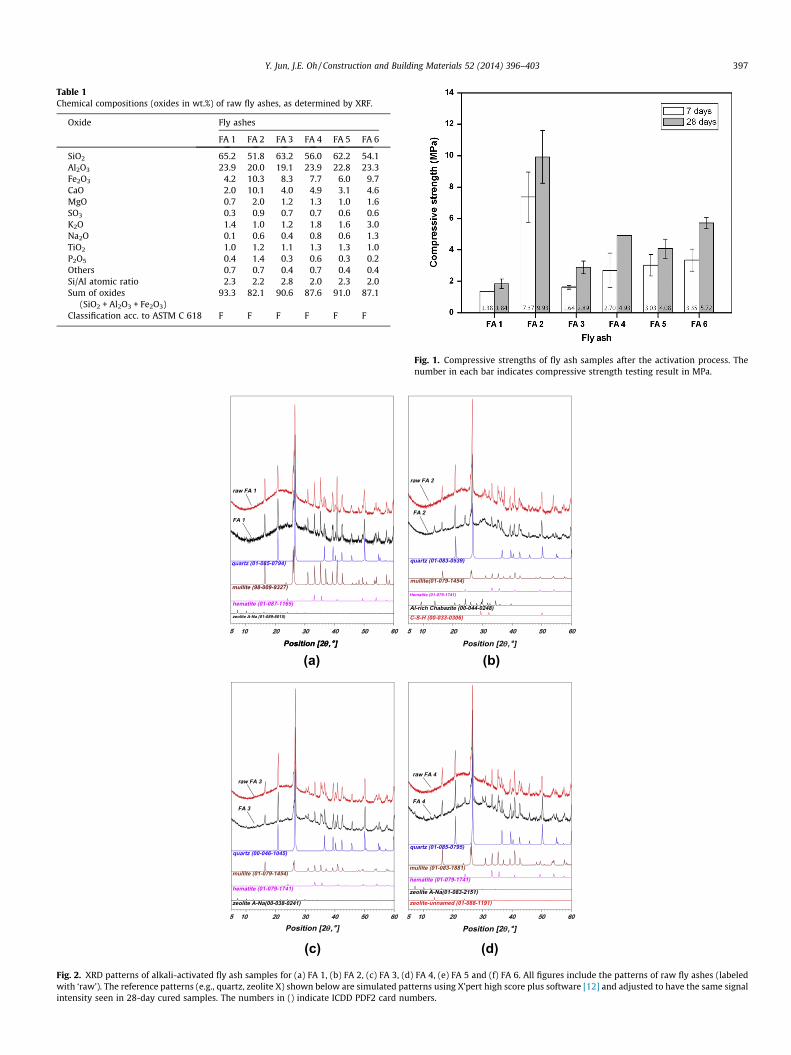
Table 1Chemical compositions (oxides in wt.%) of raw fly ashes, as determined by XRF.
Oxide Fly ashes
FA 1 FA 2 FA 3 FA 4 FA 5 FA 6
SiO2 65.2 51.8 63.2 56.0 62.2 54.1Al2O3 23.9 20.0 19.1 23.9 22.8 23.3Fe2O3 4.2 10.3 8.3 7.7 6.0 9.7CaO 2.0 10.1 4.0 4.9 3.1 4.6MgO 0.7 2.0 1.2 1.3 1.0 1.6SO3 0.3 0.9 0.7 0.7 0.6 0.6K2O 1.4 1.0 1.2 1.8 1.6 3.0Na2O 0.1 0.6 0.4 0.8 0.6 1.3TiO2 1.0 1.2 1.1 1.3 1.3 1.0P2O5 0.4 1.4 0.3 0.6 0.3 0.2Others 0.7 0.7 0.4 0.7 0.4 0.4Si/Al atomic ratio 2.3 2.2 2.8 2.0 2.3 2.0Sum of oxides
(SiO2 + Al2O3 + Fe2O3)93.3 82.1 90.6 87.6 91.0 87.1
Classification acc. to ASTM C 618 F F F F F F
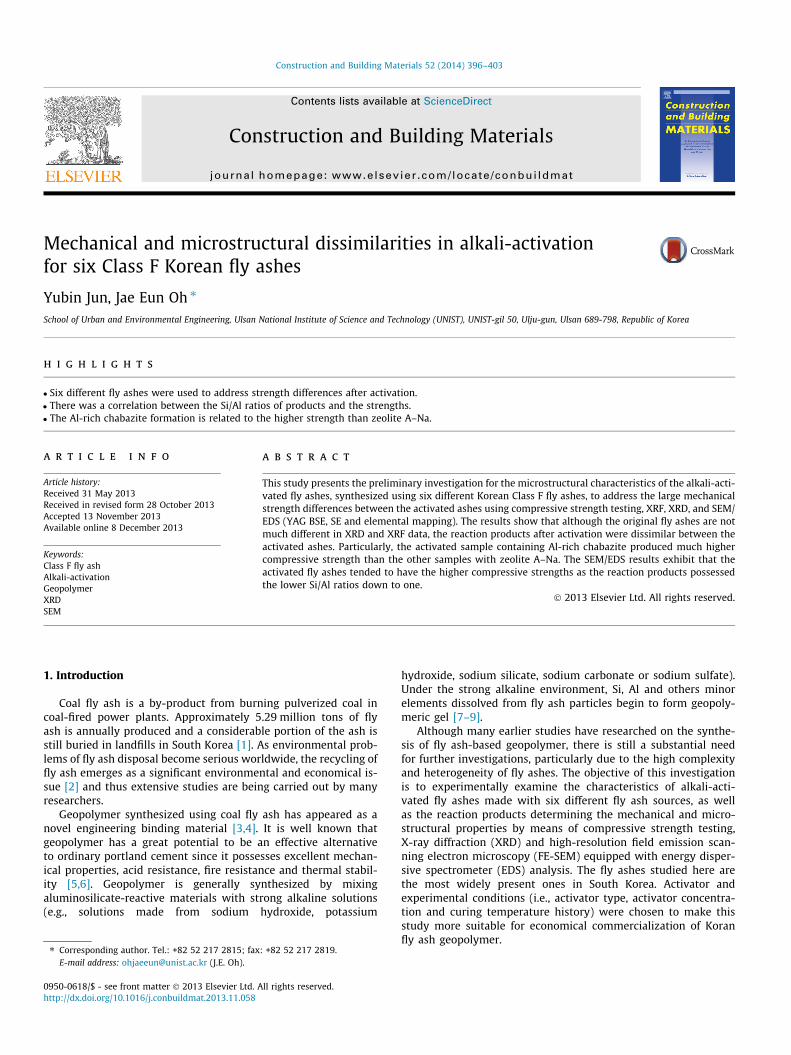
Fig. 1. Compressive strengths of fly ash samples after the activation process. Thenumber in each bar indicates compressive strength testing result in MPa.
zeolite A-Na (01-089-8015)
hematite (01-087-1165)
mullite (98-009-9327)
quartz (01-085-0794)
FA 1
Position [2θθ , ]Position [2θ , ]
raw FA 1
C-S-H (00-033-0306)
Hematite (01-079-1741)
Al-rich Chabazite (00-044-0248)
mullite(01-079-1454)
quartz (01-083-0539)
raw FA 2
FA 2
hematite (01-079-1741)
zeolite A-Na(00-038-0241)
quartz (00-046-1045)
mullite (01-079-1454)
FA 3
raw FA 3
zeolite-unnamed (01-088-1191)
zeolite A-Na(01-083-2151)
hematite (01-079-1741)
quartz (01-085-0795)
mullite (01-083-1881)
FA 4
raw FA 4
Position [2θ , ]
Position [2θ , ] Position [2θ , ]
(a) (b)
(c) (d)
Fig. 2. XRD patterns of alkali-activated fly ash samples for (a) FA 1, (b) FA 2, (c) FA 3, (d) FA 4, (e) FA 5 and (f) FA 6. All figures include the patterns of raw fly ashes (labeledwith ‘raw’). The reference patterns (e.g., quartz, zeolite X) shown below are simulated patterns using X’pert high score plus software [12] and adjusted to have the same signalintensity seen in 28-day cured samples. The numbers in () indicate ICDD PDF2 card numbers.
Y. Jun, J.E. Oh / Construction and Building Materials 52 (2014) 396–403 397
zeoliteA-Na(00-039-0222)
hematite (01-079-1741)
quartz (01-079-1910)
mullite (01-079-1455)
FA 5
rawFA 5
zeolite X (01-088-0190)
zeolite A-Na (00-039-0222)
mullite (01-073-1389)
quartz (01-086-1560)
hematite (01-079-1741)
FA 6
raw FA 6
Position [2θ , ] Position [2θ , ]
(e) (f)
Fig. 2 (continued)
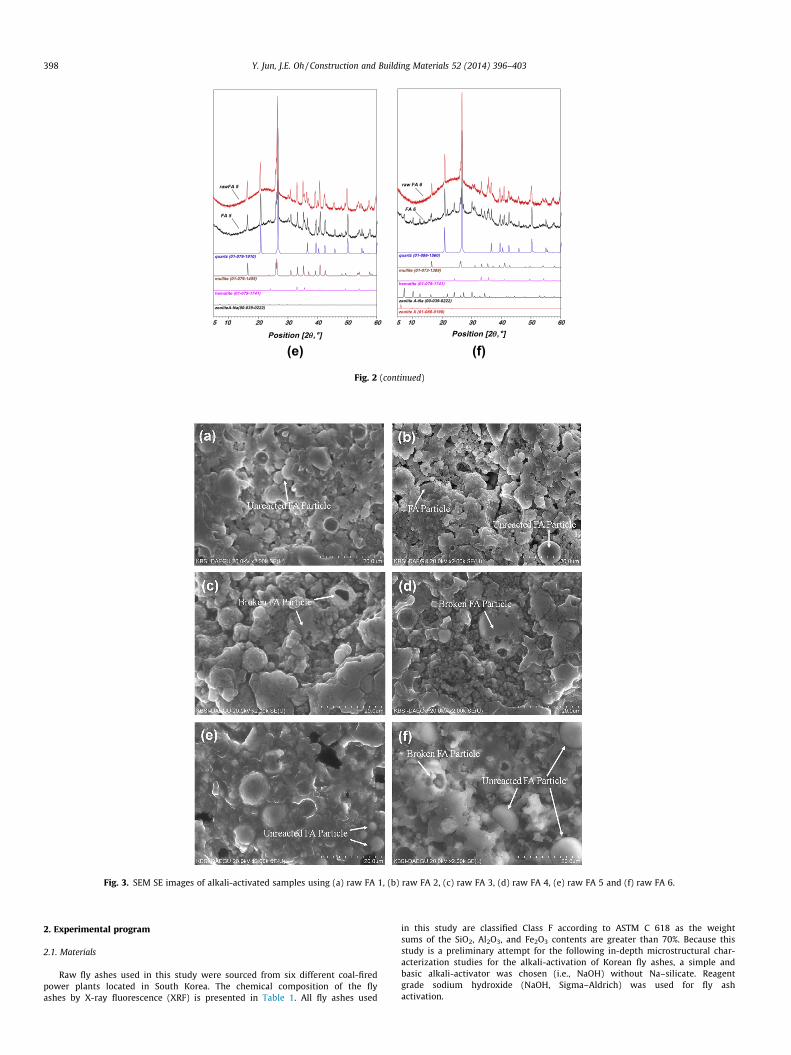
Fig. 3. SEM SE images of alkali-activated samples using (a) raw FA 1, (b) raw FA 2, (c) raw FA 3, (d) raw FA 4, (e) raw FA 5 and (f) raw FA 6.
398 Y. Jun, J.E. Oh / Construction and Building Materials 52 (2014) 396–403
2. Experimental program
2.1. Materials
Raw fly ashes used in this study were sourced from six different coal-firedpower plants located in South Korea. The chemical composition of the flyashes by X-ray fluorescence (XRF) is presented in Table 1. All fly ashes used
in this study are classified Class F according to ASTM C 618 as the weightsums of the SiO2, Al2O3, and Fe2O3 contents are greater than 70%. Because thisstudy is a preliminary attempt for the following in-depth microstructural char-acterization studies for the alkali-activation of Korean fly ashes, a simple andbasic alkali-activator was chosen (i.e., NaOH) without Na–silicate. Reagentgrade sodium hydroxide (NaOH, Sigma–Aldrich) was used for fly ashactivation.
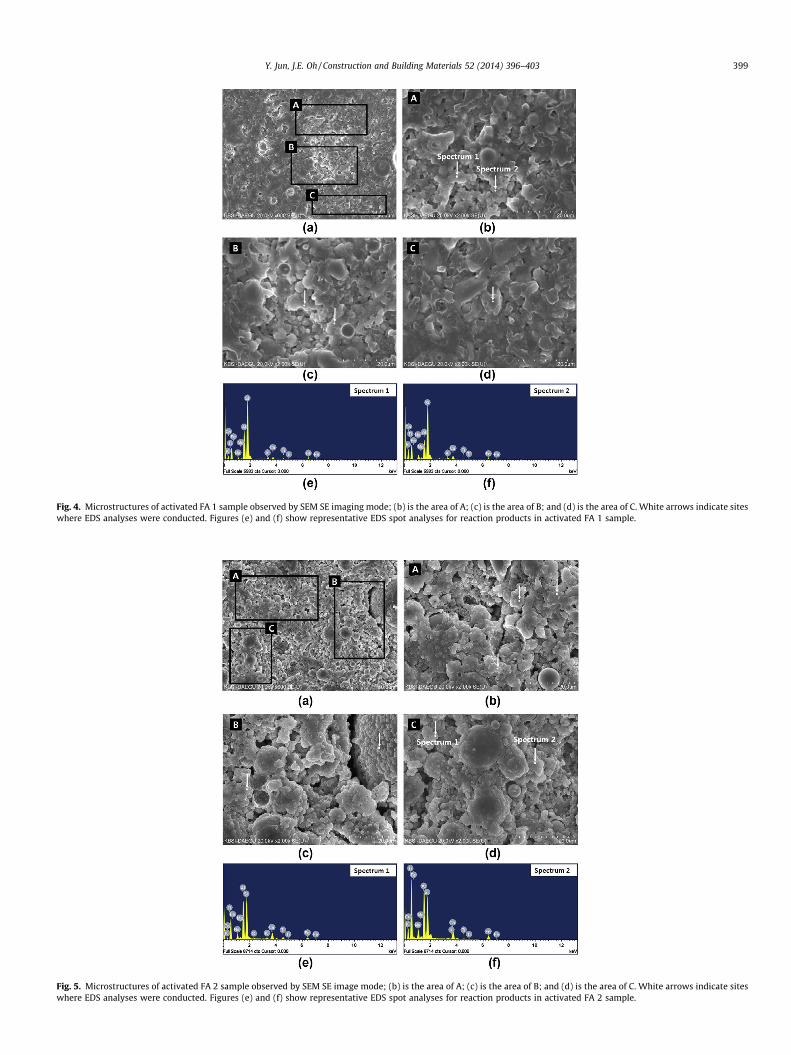
Fig. 4. Microstructures of activated FA 1 sample observed by SEM SE imaging mode; (b) is the area of A; (c) is the area of B; and (d) is the area of C. White arrows indicate siteswhere EDS analyses were conducted. Figures (e) and (f) show representative EDS spot analyses for reaction products in activated FA 1 sample.
Fig. 5. Microstructures of activated FA 2 sample observed by SEM SE image mode; (b) is the area of A; (c) is the area of B; and (d) is the area of C. White arrows indicate siteswhere EDS analyses were conducted. Figures (e) and (f) show representative EDS spot analyses for reaction products in activated FA 2 sample.
Y. Jun, J.E. Oh / Construction and Building Materials 52 (2014) 396–403 399
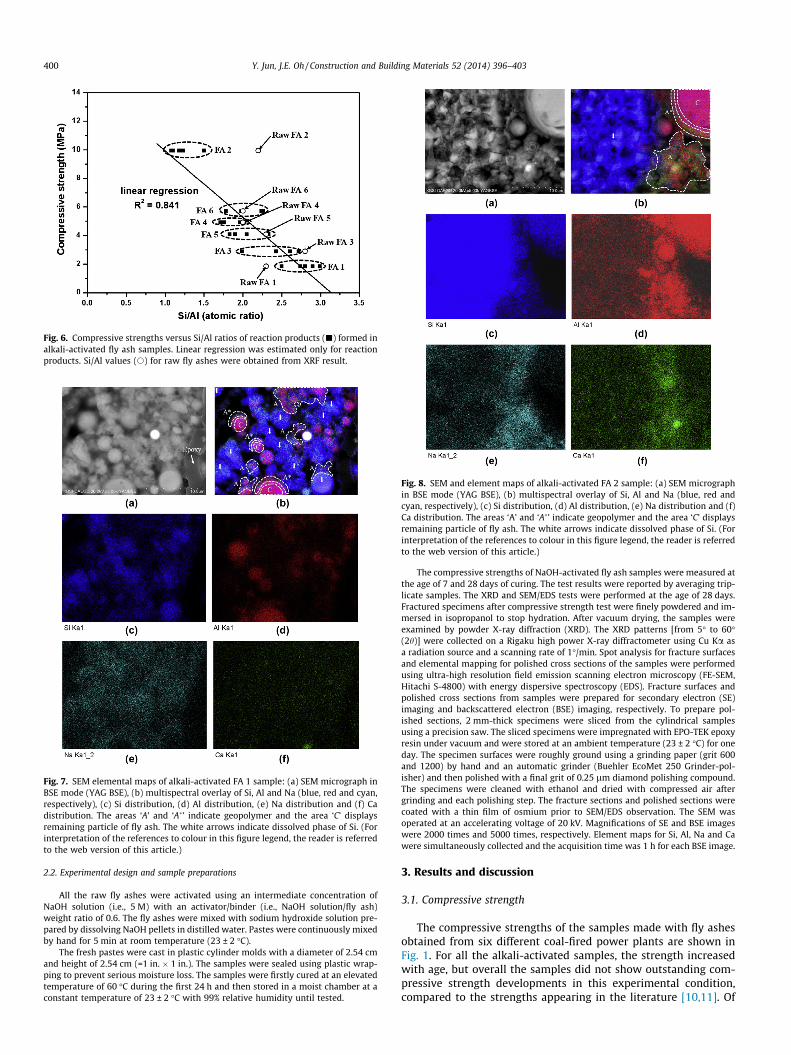
Fig. 6. Compressive strengths versus Si/Al ratios of reaction products (j) formed inalkali-activated fly ash samples. Linear regression was estimated only for reactionproducts. Si/Al values (s) for raw fly ashes were obtained from XRF result.
Fig. 7. SEM elemental maps of alkali-activated FA 1 sample: (a) SEM micrograph inBSE mode (YAG BSE), (b) multispectral overlay of Si, Al and Na (blue, red and cyan,respectively), (c) Si distribution, (d) Al distribution, (e) Na distribution and (f) Cadistribution. The areas ‘A’ and ‘A�’ indicate geopolymer and the area ‘C’ displaysremaining particle of fly ash. The white arrows indicate dissolved phase of Si. (Forinterpretation of the references to colour in this figure legend, the reader is referredto the web version of this article.)
Fig. 8. SEM and element maps of alkali-activated FA 2 sample: (a) SEM micrographin BSE mode (YAG BSE), (b) multispectral overlay of Si, Al and Na (blue, red andcyan, respectively), (c) Si distribution, (d) Al distribution, (e) Na distribution and (f)Ca distribution. The areas ‘A’ and ‘A�’ indicate geopolymer and the area ‘C’ displaysremaining particle of fly ash. The white arrows indicate dissolved phase of Si. (Forinterpretation of the references to colour in this figure legend, the reader is referredto the web version of this article.)
400 Y. Jun, J.E. Oh / Construction and Building Materials 52 (2014) 396–403
2.2. Experimental design and sample preparations
All the raw fly ashes were activated using an intermediate concentration ofNaOH solution (i.e., 5 M) with an activator/binder (i.e., NaOH solution/fly ash)weight ratio of 0.6. The fly ashes were mixed with sodium hydroxide solution pre-pared by dissolving NaOH pellets in distilled water. Pastes were continuously mixedby hand for 5 min at room temperature (23 ± 2 �C).
The fresh pastes were cast in plastic cylinder molds with a diameter of 2.54 cmand height of 2.54 cm (=1 in. � 1 in.). The samples were sealed using plastic wrap-ping to prevent serious moisture loss. The samples were firstly cured at an elevatedtemperature of 60 �C during the first 24 h and then stored in a moist chamber at aconstant temperature of 23 ± 2 �C with 99% relative humidity until tested.
The compressive strengths of NaOH-activated fly ash samples were measured atthe age of 7 and 28 days of curing. The test results were reported by averaging trip-licate samples. The XRD and SEM/EDS tests were performed at the age of 28 days.Fractured specimens after compressive strength test were finely powdered and im-mersed in isopropanol to stop hydration. After vacuum drying, the samples wereexamined by powder X-ray diffraction (XRD). The XRD patterns [from 5� to 60�(2h)] were collected on a Rigaku high power X-ray diffractometer using Cu Ka asa radiation source and a scanning rate of 1�/min. Spot analysis for fracture surfacesand elemental mapping for polished cross sections of the samples were performedusing ultra-high resolution field emission scanning electron microscopy (FE-SEM,Hitachi S-4800) with energy dispersive spectroscopy (EDS). Fracture surfaces andpolished cross sections from samples were prepared for secondary electron (SE)imaging and backscattered electron (BSE) imaging, respectively. To prepare pol-ished sections, 2 mm-thick specimens were sliced from the cylindrical samplesusing a precision saw. The sliced specimens were impregnated with EPO-TEK epoxyresin under vacuum and were stored at an ambient temperature (23 ± 2 �C) for oneday. The specimen surfaces were roughly ground using a grinding paper (grit 600and 1200) by hand and an automatic grinder (Buehler EcoMet 250 Grinder-pol-isher) and then polished with a final grit of 0.25 lm diamond polishing compound.The specimens were cleaned with ethanol and dried with compressed air aftergrinding and each polishing step. The fracture sections and polished sections werecoated with a thin film of osmium prior to SEM/EDS observation. The SEM wasoperated at an accelerating voltage of 20 kV. Magnifications of SE and BSE imageswere 2000 times and 5000 times, respectively. Element maps for Si, Al, Na and Cawere simultaneously collected and the acquisition time was 1 h for each BSE image.
3. Results and discussion
3.1. Compressive strength
The compressive strengths of the samples made with fly ashesobtained from six different coal-fired power plants are shown inFig. 1. For all the alkali-activated samples, the strength increasedwith age, but overall the samples did not show outstanding com-pressive strength developments in this experimental condition,compared to the strengths appearing in the literature [10,11]. Of
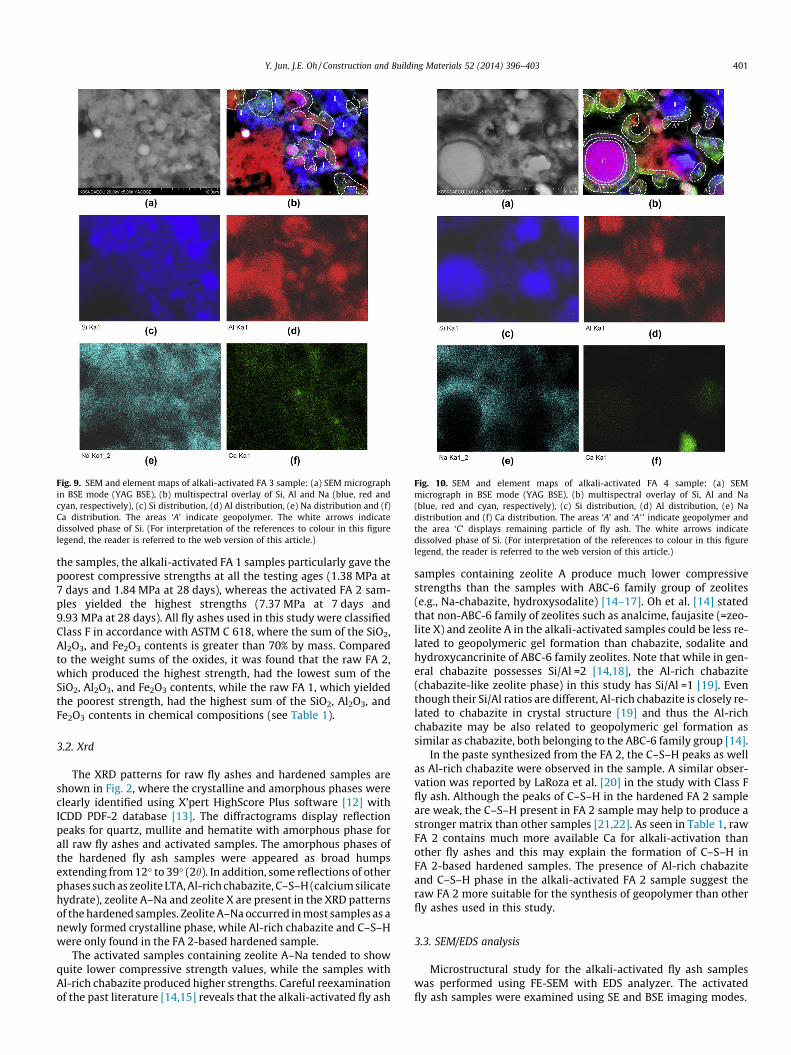
Fig. 9. SEM and element maps of alkali-activated FA 3 sample: (a) SEM micrographin BSE mode (YAG BSE), (b) multispectral overlay of Si, Al and Na (blue, red andcyan, respectively), (c) Si distribution, (d) Al distribution, (e) Na distribution and (f)Ca distribution. The areas ‘A’ indicate geopolymer. The white arrows indicatedissolved phase of Si. (For interpretation of the references to colour in this figurelegend, the reader is referred to the web version of this article.)
Fig. 10. SEM and element maps of alkali-activated FA 4 sample: (a) SEMmicrograph in BSE mode (YAG BSE), (b) multispectral overlay of Si, Al and Na(blue, red and cyan, respectively), (c) Si distribution, (d) Al distribution, (e) Nadistribution and (f) Ca distribution. The areas ‘A’ and ‘A�’ indicate geopolymer andthe area ‘C’ displays remaining particle of fly ash. The white arrows indicatedissolved phase of Si. (For interpretation of the references to colour in this figurelegend, the reader is referred to the web version of this article.)
Y. Jun, J.E. Oh / Construction and Building Materials 52 (2014) 396–403 401
the samples, the alkali-activated FA 1 samples particularly gave thepoorest compressive strengths at all the testing ages (1.38 MPa at7 days and 1.84 MPa at 28 days), whereas the activated FA 2 sam-ples yielded the highest strengths (7.37 MPa at 7 days and9.93 MPa at 28 days). All fly ashes used in this study were classifiedClass F in accordance with ASTM C 618, where the sum of the SiO2,Al2O3, and Fe2O3 contents is greater than 70% by mass. Comparedto the weight sums of the oxides, it was found that the raw FA 2,which produced the highest strength, had the lowest sum of theSiO2, Al2O3, and Fe2O3 contents, while the raw FA 1, which yieldedthe poorest strength, had the highest sum of the SiO2, Al2O3, andFe2O3 contents in chemical compositions (see Table 1).
3.2. Xrd
The XRD patterns for raw fly ashes and hardened samples areshown in Fig. 2, where the crystalline and amorphous phases wereclearly identified using X’pert HighScore Plus software [12] withICDD PDF-2 database [13]. The diffractograms display reflectionpeaks for quartz, mullite and hematite with amorphous phase forall raw fly ashes and activated samples. The amorphous phases ofthe hardened fly ash samples were appeared as broad humpsextending from 12� to 39� (2h). In addition, some reflections of otherphases such as zeolite LTA, Al-rich chabazite, C–S–H (calcium silicatehydrate), zeolite A–Na and zeolite X are present in the XRD patternsof the hardened samples. Zeolite A–Na occurred in most samples as anewly formed crystalline phase, while Al-rich chabazite and C–S–Hwere only found in the FA 2-based hardened sample.
The activated samples containing zeolite A–Na tended to showquite lower compressive strength values, while the samples withAl-rich chabazite produced higher strengths. Careful reexaminationof the past literature [14,15] reveals that the alkali-activated fly ash
samples containing zeolite A produce much lower compressivestrengths than the samples with ABC-6 family group of zeolites(e.g., Na-chabazite, hydroxysodalite) [14–17]. Oh et al. [14] statedthat non-ABC-6 family of zeolites such as analcime, faujasite (=zeo-lite X) and zeolite A in the alkali-activated samples could be less re-lated to geopolymeric gel formation than chabazite, sodalite andhydroxycancrinite of ABC-6 family zeolites. Note that while in gen-eral chabazite possesses Si/Al =2 [14,18], the Al-rich chabazite(chabazite-like zeolite phase) in this study has Si/Al =1 [19]. Eventhough their Si/Al ratios are different, Al-rich chabazite is closely re-lated to chabazite in crystal structure [19] and thus the Al-richchabazite may be also related to geopolymeric gel formation assimilar as chabazite, both belonging to the ABC-6 family group [14].
In the paste synthesized from the FA 2, the C–S–H peaks as wellas Al-rich chabazite were observed in the sample. A similar obser-vation was reported by LaRoza et al. [20] in the study with Class Ffly ash. Although the peaks of C–S–H in the hardened FA 2 sampleare weak, the C–S–H present in FA 2 sample may help to produce astronger matrix than other samples [21,22]. As seen in Table 1, rawFA 2 contains much more available Ca for alkali-activation thanother fly ashes and this may explain the formation of C–S–H inFA 2-based hardened samples. The presence of Al-rich chabaziteand C–S–H phase in the alkali-activated FA 2 sample suggest theraw FA 2 more suitable for the synthesis of geopolymer than otherfly ashes used in this study.
3.3. SEM/EDS analysis
Microstructural study for the alkali-activated fly ash sampleswas performed using FE-SEM with EDS analyzer. The activatedfly ash samples were examined using SE and BSE imaging modes.
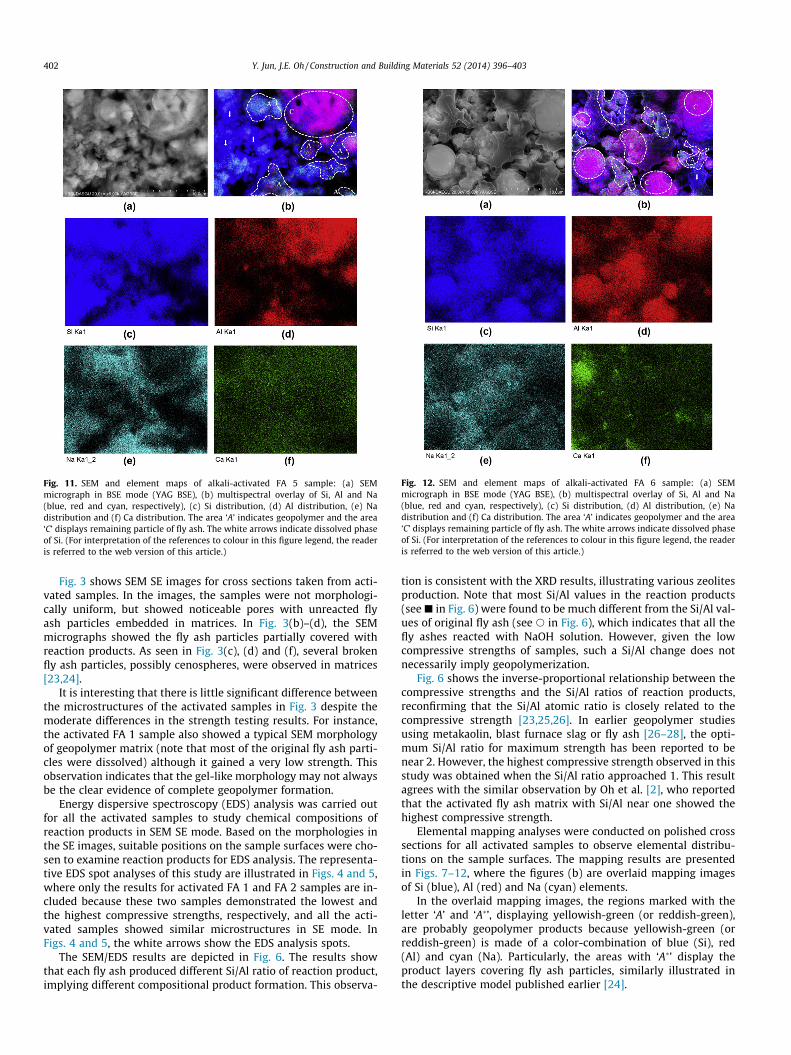
Fig. 11. SEM and element maps of alkali-activated FA 5 sample: (a) SEMmicrograph in BSE mode (YAG BSE), (b) multispectral overlay of Si, Al and Na(blue, red and cyan, respectively), (c) Si distribution, (d) Al distribution, (e) Nadistribution and (f) Ca distribution. The area ‘A’ indicates geopolymer and the area‘C’ displays remaining particle of fly ash. The white arrows indicate dissolved phaseof Si. (For interpretation of the references to colour in this figure legend, the readeris referred to the web version of this article.)
Fig. 12. SEM and element maps of alkali-activated FA 6 sample: (a) SEMmicrograph in BSE mode (YAG BSE), (b) multispectral overlay of Si, Al and Na(blue, red and cyan, respectively), (c) Si distribution, (d) Al distribution, (e) Nadistribution and (f) Ca distribution. The area ‘A’ indicates geopolymer and the area‘C’ displays remaining particle of fly ash. The white arrows indicate dissolved phaseof Si. (For interpretation of the references to colour in this figure legend, the readeris referred to the web version of this article.)
402 Y. Jun, J.E. Oh / Construction and Building Materials 52 (2014) 396–403
Fig. 3 shows SEM SE images for cross sections taken from acti-vated samples. In the images, the samples were not morphologi-cally uniform, but showed noticeable pores with unreacted flyash particles embedded in matrices. In Fig. 3(b)–(d), the SEMmicrographs showed the fly ash particles partially covered withreaction products. As seen in Fig. 3(c), (d) and (f), several brokenfly ash particles, possibly cenospheres, were observed in matrices[23,24].
It is interesting that there is little significant difference betweenthe microstructures of the activated samples in Fig. 3 despite themoderate differences in the strength testing results. For instance,the activated FA 1 sample also showed a typical SEM morphologyof geopolymer matrix (note that most of the original fly ash parti-cles were dissolved) although it gained a very low strength. Thisobservation indicates that the gel-like morphology may not alwaysbe the clear evidence of complete geopolymer formation.
Energy dispersive spectroscopy (EDS) analysis was carried outfor all the activated samples to study chemical compositions ofreaction products in SEM SE mode. Based on the morphologies inthe SE images, suitable positions on the sample surfaces were cho-sen to examine reaction products for EDS analysis. The representa-tive EDS spot analyses of this study are illustrated in Figs. 4 and 5,where only the results for activated FA 1 and FA 2 samples are in-cluded because these two samples demonstrated the lowest andthe highest compressive strengths, respectively, and all the acti-vated samples showed similar microstructures in SE mode. InFigs. 4 and 5, the white arrows show the EDS analysis spots.
The SEM/EDS results are depicted in Fig. 6. The results showthat each fly ash produced different Si/Al ratio of reaction product,implying different compositional product formation. This observa-
tion is consistent with the XRD results, illustrating various zeolitesproduction. Note that most Si/Al values in the reaction products(see j in Fig. 6) were found to be much different from the Si/Al val-ues of original fly ash (see s in Fig. 6), which indicates that all thefly ashes reacted with NaOH solution. However, given the lowcompressive strengths of samples, such a Si/Al change does notnecessarily imply geopolymerization.
Fig. 6 shows the inverse-proportional relationship between thecompressive strengths and the Si/Al ratios of reaction products,reconfirming that the Si/Al atomic ratio is closely related to thecompressive strength [23,25,26]. In earlier geopolymer studiesusing metakaolin, blast furnace slag or fly ash [26–28], the opti-mum Si/Al ratio for maximum strength has been reported to benear 2. However, the highest compressive strength observed in thisstudy was obtained when the Si/Al ratio approached 1. This resultagrees with the similar observation by Oh et al. [2], who reportedthat the activated fly ash matrix with Si/Al near one showed thehighest compressive strength.
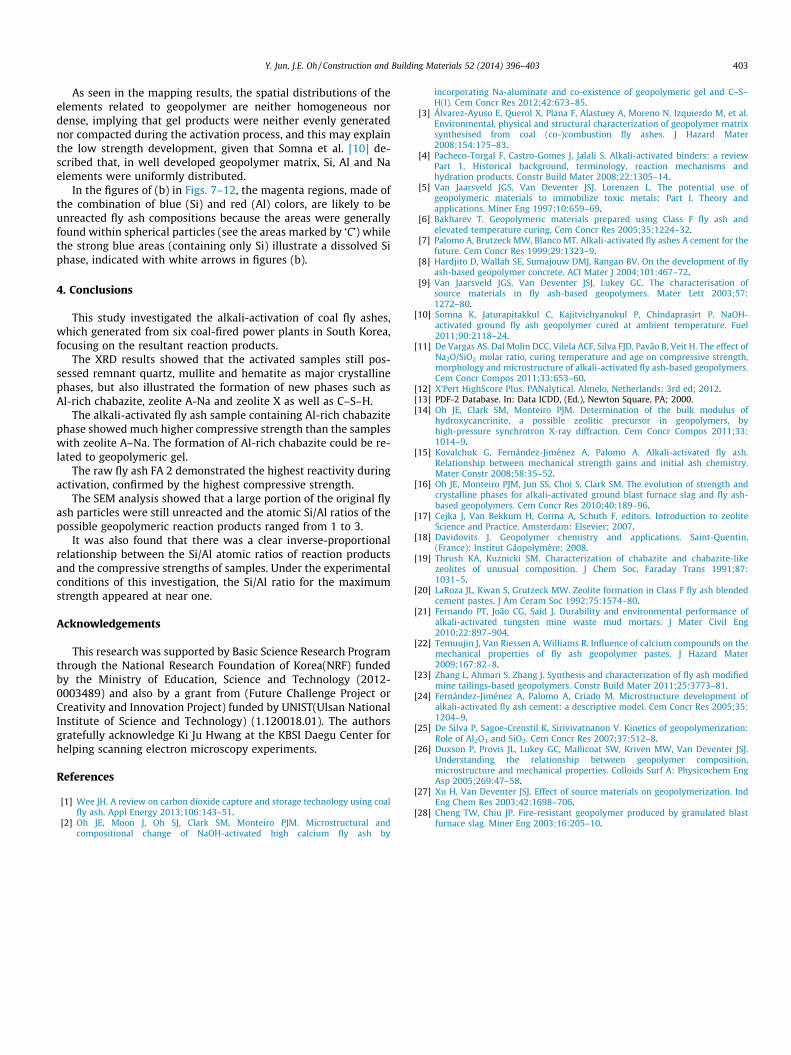
Elemental mapping analyses were conducted on polished crosssections for all activated samples to observe elemental distribu-tions on the sample surfaces. The mapping results are presentedin Figs. 7–12, where the figures (b) are overlaid mapping imagesof Si (blue), Al (red) and Na (cyan) elements.
In the overlaid mapping images, the regions marked with theletter ‘A’ and ‘A�’, displaying yellowish-green (or reddish-green),are probably geopolymer products because yellowish-green (orreddish-green) is made of a color-combination of blue (Si), red(Al) and cyan (Na). Particularly, the areas with ‘A�’ display theproduct layers covering fly ash particles, similarly illustrated inthe descriptive model published earlier [24].
Y. Jun, J.E. Oh / Construction and Building Materials 52 (2014) 396–403 403
As seen in the mapping results, the spatial distributions of theelements related to geopolymer are neither homogeneous nordense, implying that gel products were neither evenly generatednor compacted during the activation process, and this may explainthe low strength development, given that Somna et al. [10] de-scribed that, in well developed geopolymer matrix, Si, Al and Naelements were uniformly distributed.
In the figures of (b) in Figs. 7–12, the magenta regions, made ofthe combination of blue (Si) and red (Al) colors, are likely to beunreacted fly ash compositions because the areas were generallyfound within spherical particles (see the areas marked by ‘C’) whilethe strong blue areas (containing only Si) illustrate a dissolved Siphase, indicated with white arrows in figures (b).
4. Conclusions
This study investigated the alkali-activation of coal fly ashes,which generated from six coal-fired power plants in South Korea,focusing on the resultant reaction products.
The XRD results showed that the activated samples still pos-sessed remnant quartz, mullite and hematite as major crystallinephases, but also illustrated the formation of new phases such asAl-rich chabazite, zeolite A-Na and zeolite X as well as C–S–H.
The alkali-activated fly ash sample containing Al-rich chabazitephase showed much higher compressive strength than the sampleswith zeolite A–Na. The formation of Al-rich chabazite could be re-lated to geopolymeric gel.
The raw fly ash FA 2 demonstrated the highest reactivity duringactivation, confirmed by the highest compressive strength.
The SEM analysis showed that a large portion of the original flyash particles were still unreacted and the atomic Si/Al ratios of thepossible geopolymeric reaction products ranged from 1 to 3.
It was also found that there was a clear inverse-proportionalrelationship between the Si/Al atomic ratios of reaction productsand the compressive strengths of samples. Under the experimentalconditions of this investigation, the Si/Al ratio for the maximumstrength appeared at near one.
Acknowledgements
This research was supported by Basic Science Research Programthrough the National Research Foundation of Korea(NRF) fundedby the Ministry of Education, Science and Technology (2012-0003489) and also by a grant from (Future Challenge Project orCreativity and Innovation Project) funded by UNIST(Ulsan NationalInstitute of Science and Technology) (1.120018.01). The authorsgratefully acknowledge Ki Ju Hwang at the KBSI Daegu Center forhelping scanning electron microscopy experiments.
References
[1] Wee JH. A review on carbon dioxide capture and storage technology using coalfly ash. Appl Energy 2013;106:143–51.
[2] Oh JE, Moon J, Oh SJ, Clark SM, Monteiro PJM. Microstructural andcompositional change of NaOH-activated high calcium fly ash by
incorporating Na-aluminate and co-existence of geopolymeric gel and C–S–H(I). Cem Concr Res 2012;42:673–85.
[3] Álvarez-Ayuso E, Querol X, Plana F, Alastuey A, Moreno N, Izquierdo M, et al.Environmental, physical and structural characterization of geopolymer matrixsynthesised from coal (co-)combustion fly ashes. J Hazard Mater2008;154:175–83.
[4] Pacheco-Torgal F, Castro-Gomes J, Jalali S. Alkali-activated binders: a reviewPart 1, Historical background, terminology, reaction mechanisms andhydration products. Constr Build Mater 2008;22:1305–14.
[5] Van Jaarsveld JGS, Van Deventer JSJ, Lorenzen L. The potential use ofgeopolymeric materials to immobilize toxic metals: Part I. Theory andapplications. Miner Eng 1997;10:659–69.
[6] Bakharev T. Geopolymeric materials prepared using Class F fly ash andelevated temperature curing. Cem Concr Res 2005;35:1224–32.
[7] Palomo A, Brutzeck MW, Blanco MT. Alkali-activated fly ashes A cement for thefuture. Cem Concr Res 1999;29:1323–9.
[8] Hardjito D, Wallah SE, Sumajouw DMJ, Rangan BV. On the development of flyash-based geopolymer concrete. ACI Mater J 2004;101:467–72.
[9] Van Jaarsveld JGS, Van Deventer JSJ, Lukey GC. The characterisation ofsource materials in fly ash-based geopolymers. Mater Lett 2003;57:1272–80.
[10] Somna K, Jaturapitakkul C, Kajitvichyanukul P, Chindaprasirt P. NaOH-activated ground fly ash geopolymer cured at ambient temperature. Fuel2011;90:2118–24.
[11] De Vargas AS. Dal Molin DCC, Vilela ACF, Silva FJD, Pavão B, Veit H. The effect ofNa2O/SiO2 molar ratio, curing temperature and age on compressive strength,morphology and microstructure of alkali-activated fly ash-based geopolymers.Cem Concr Compos 2011;33:653–60.
[12] X’Pert HighScore Plus. PANalytical. Almelo, Netherlands: 3rd ed; 2012.[13] PDF-2 Database. In: Data ICDD, (Ed.), Newton Square, PA; 2000.[14] Oh JE, Clark SM, Monteiro PJM. Determination of the bulk modulus of
hydroxycancrinite, a possible zeolitic precursor in geopolymers, byhigh-pressure synchrotron X-ray diffraction. Cem Concr Compos 2011;33:1014–9.
[15] Kovalchuk G, Fernández-Jiménez A, Palomo A. Alkali-activated fly ash.Relationship between mechanical strength gains and initial ash chemistry.Mater Constr 2008;58:35–52.
[16] Oh JE, Monteiro PJM, Jun SS, Choi S, Clark SM. The evolution of strength andcrystalline phases for alkali-activated ground blast furnace slag and fly ash-based geopolymers. Cem Concr Res 2010;40:189–96.
[17] Cejka J, Van Bekkum H, Corma A, Schuth F, editors. Introduction to zeoliteScience and Practice. Amsterdam: Elsevier; 2007.
[18] Davidovits J. Geopolymer chemistry and applications. Saint-Quentin,(France): Institut Gáopolymère; 2008.
[19] Thrush KA, Kuznicki SM. Characterization of chabazite and chabazite-likezeolites of unusual composition. J Chem Soc, Faraday Trans 1991;87:1031–5.
[20] LaRoza JL, Kwan S, Grutzeck MW. Zeolite formation in Class F fly ash blendedcement pastes. J Am Ceram Soc 1992;75:1574–80.
[21] Fernando PT, João CG, Said J. Durability and environmental performance ofalkali-activated tungsten mine waste mud mortars. J Mater Civil Eng2010;22:897–904.
[22] Temuujin J, Van Riessen A, Williams R. Influence of calcium compounds on themechanical properties of fly ash geopolymer pastes. J Hazard Mater2009;167:82–8.
[23] Zhang L, Ahmari S, Zhang J. Synthesis and characterization of fly ash modifiedmine tailings-based geopolymers. Constr Build Mater 2011;25:3773–81.
[24] Fernández-Jiménez A, Palomo A, Criado M. Microstructure development ofalkali-activated fly ash cement: a descriptive model. Cem Concr Res 2005;35:1204–9.
[25] De Silva P, Sagoe-Crenstil K, Sirivivatnanon V. Kinetics of geopolymerization:Role of Al2O3 and SiO2. Cem Concr Res 2007;37:512–8.
[26] Duxson P, Provis JL, Lukey GC, Mallicoat SW, Kriven MW, Van Deventer JSJ.Understanding the relationship between geopolymer composition,microstructure and mechanical properties. Colloids Surf A: Physicochem EngAsp 2005;269:47–58.
[27] Xu H, Van Deventer JSJ. Effect of source materials on geopolymerization. IndEng Chem Res 2003;42:1698–706.
[28] Cheng TW, Chiu JP. Fire-resistant geopolymer produced by granulated blastfurnace slag. Miner Eng 2003;16:205–10.


![[CHA035Monograph Ashes, to Ashes2] Ashes to Ashes](https://img.pdfslide.us/doc/110x75/577cc75c1a28aba711a0b442/cha035monograph-ashes-to-ashes2-ashes-to-ashes.jpg)