Embed Size (px)
Citation preview
12
ACKNOWLEDGMENT
The authors acknowledge the combined efforts and support of the Cenler for Transportation Research at the University of Texas, Austin, and the Texas State Department of Highways and Public Transportation, in cooperation with the Federal Highway Administration, U.S. Department of Transportation. Special thanks are expressed to the staff of the Center for
TRANSPORTATION RESEARCH RECORD 1099
Transportation Research for assistance in the preparation of the figures for this paper.
The contents of this paper reflect the views of the awhors who are responsible for the facts and the accuracy of the data presented herein. The contents do not necessarily reflect the official views or policies of the Ff/WA. This paper does not constitute a standard, specification, or reg1dation. Malerial brand names thal may appear in the texJ are solely for purposes of illustration or clarity and should not be construed as an endorsement of any kind.
Mechanical and Environmental Stresses in Continuously Reinforced Concrete Pavements S. K. SAXENA AND GEORGE T. DouNrAs
The examination of the combined effects of mechanical and environmental stresses on continuously reinforced concrete (CRC) pavements ls accomplished by superimpo Ing the effects of the one onto those of the other. The mechanical stresses are evaluated by a three-dimensional analysis and thermal stresses by two-dimensional analysis. It has been demonstrated that environmental loads constitute the severest loads the pavement ls subjected to. Also studied ls the comparison of stresses due to one single axle 18-klp load to stresses due to two trucks and a car on a three-lane highway. The ratio of maximum stresses by two loadings may be very useful for a comprelie.n ive understanding of pa.vement performance when it is designed by the equivalent 18-kJp concept.
A major concern in the design of rigid portland cement concrete (PCC) pavements is to control undesirable cracks by using the proper control joints. Despite the efforts to establish the ideal type of joints, most of the undesirable features of natural cracks accompany their use. In response to this problem an effort was made to eliminate the joints and in 1921 the first continuously reinforced concrete (CRC) pavement was constructed by the U.S. Bureau of Public Roads.
On the other hand, to overcome difficulties in maintenance operation, the FHWA proposes the use of zero maintenance pavements which require no maintenance during their first 20
Illinois Institute of Technology, Civil Engineering Department, Chicago, Ill. 60616.
years and only minor repairs during the following 10 years before rehabilitation.
The present study reviews some of the existing methods for pavement stress evaluation and examines a premium pavement using a refinement of a model proposed by Saxena et al. (1).
EXISTING ANALYSIS METHODS
Mechanical Loads
Westergaard (2, 3) expanded Lhe theory of slabs created by Hertz (4) to include the so-called Winkler foundation. In order to solve the basic dillerential equation for medium-thick plates, the deflection at any point on the subgrade surface is assumed directly proportional to the vertical stress applied at that point in Winkler foundations; Lhis proportionality is also assumed constant. Therefore, the foundation is represented by individual springs with stiffness k, which is commonly referred to as modulus of subgrade reaction. The values of this constant are determined from plate loads tests.
Some years later Hogg (5) and Holl (6) solved the same problem with the assumption that the slab is supported by an elastic solid. In their solution, they incorporated the Boussinesq's classic solution for the deflection of an elastic solid resulting from a point load.
Both the aforementioned solutions are available in most of
SAXENA AND DOUNTAS
the texts dealing with pavements. Influence charts similar to those prepared by Newmark, solving Westergaard's and Hogg's equations, were presented by Picket and Ray (7). Those charts have been extensively used in pavement design and are still the only widely available information for wheel-load stresses.
Hudson and Matlock ( 8) proposed a discrete element model that treats the slab as a set of rigid bars connecting elastic hinges, and with torsion springs connecting adjacent parallel bars. The subgrade was again modelled by the coefficient of subgrade reaction, k (modulus of subgrade reaction K = kb, with B as the width of the slab). This model is capable of handling combination loads that include lateral loads in plane forces and applied couples or moments. Also, discontinuities in the slab and the support and variation of slab thickness can be easily considered to evaluate the effect of cracking, loss of support and nonuniformity in the slab.
The characterization of sub grade by a coefficient of subgrade reaction k is by Winkler and is therefore known as Winkler subgrade. A critical review of the Winkler subgrade and elastic-istoropic solid subgrade has been provided by Vesic and Saxena (9). It has been shown that there is no single value of k that can give perfect agreement of all statical influences in a particular case, unless the subgrade thickness is limited to a maximum of 2.5 stiffness radii of the slab. Simple analytical expression for evaluation of k was developed as:
where
E, E8 = modulus of elasticity of slab and subgrade, respectively;
\J, \J8 = Poisson's ratio of slab and subgrade, respectively; and
h = thickness of slab.
Good agreement of bending movements or stresses in the slab only are provided by Equation 1.
To obtain a good agreement of deflections, a 2.4 times lower value of k should be used:
k = 0.42 {[E8(1 - u2)]/[E(l - u~)]}l/3 {Esf[(l - u~)h]} (2)
Saxena (JO, 11) extended this model by introducing the equilibrium of forces including the subgrade support and by treating the subgrade as an isotropic elastic half space. The subgrade is represented by a modulus of elasticity Es and Poisson's ratio \J8 • A model test was performed under control conditions to compare the experimental results with those obtained from an elastic solid model as well as a Winkler model. As shown by the results (11), the values of deflection computed from Westergaard's formula and those using Winkler subgrade are comparable. These values differ from the elastic solid subgrade and the analytical results using elastic solid subgrade are in remarkable agreement with observed deflections.
All theories based on the classical plate theory have one major drawback. They assume the reaction of the supporting media to be vertical. In modern highway construction practice, various subbase types are used; some have relatively high stiffness and in many cases, the slab-subbase interface
13
develops very good friction. This friction has been ignored and, as a result, the contribution of the subbase in the reduction of slab stresses is considered only as a reinforcement of the subgrade ability to carry vertical loads. Stress reduction due to friction has been proven to be significant, especially in the case of stiff subbase. The plate theory works very well in the case of a very weak or nonexisting subbase, because the assumptions made in the plate theory are well approximated. Many experiments have verified stress reduction by friction and have led to the adaptation of plate theory methods for extensive use. Theories based on the elastic subgrade hypothesis are approximating the problem better; however, they still do not have the ability of modeling the variations in the subbase and natural soil.
Environmental Loads
The stresses caused by temperature variations were divided into temperature-drop and warping stresses, and were examined separately.
Temperature-drop stresses result only when there is friction between the slab and the supporting subgrade that resists the slab shrinkage. Because contraction due to temperature drop can be easily evaluated, the principal concern is to model the friction in the interface. Kelley (12) provides a rational friction distribution. Assuming the proposed distribution, evaluation of tensile stresses is relatively easy. Some complications may occur when friction exceeds the shear resistance of the subgrade or when the slab is curled due to temperature differentials (causing discontinuous contact).
In an attempt to deal with the stresses caused by the temperature differential through the slab, Westergaard considered an infinite slab and developed equations representing the curved surface. Based on the stresses found this way, he provided equations for semi-infinite slab and slab with finite width. Furthermore, investigations on Westergaard's equations were conducted by Harr and Leonards (13) to compute the stresses, deflections, and loss of support due to warping effects. Lewis and Harr (14) further elaborated and extended the work on warping stresses.
The described methods of temperature-drop and warping stress evaluation have the following weak points:
1. Not applicable to slab-subbase separation. 2. The assumption of uniform stress distribution in the slab
is not always a good approximation and may result in stress underestimation.
3. Apply only to stresses caused by the slab weight when it resists the curling. Forces transmitted to the subgrade, or friction in the interface between slab and subgrade are not considered.
4. The temperature drop occurs simultaneously with a temperature gradient in the slab which not only causes separation but also some vertical stresses in the interface that change the friction distribution.
Furthermore, the existing methods do not consider the contribution of the subbase-subgrade temperature variations in the general slab performance.
14
Methods Used in Design Manuals
A study of the widely used design manuals indicated that the only stress incorporated in the pavement design is that due lo wheel loads. Environmental loads are considered only indirectly by reducing the strength of the supporting subbasesubgrade system.
For the wheel-load stresses, Westergaard's formula is used. The modulus of subgrade reaction is evaluated by plate load tests, and to account for the subbase contribution, charts are used to modify the subgrade modulus as a composite one. The wheel-load stresses are then evaluated using Westergaard's solution with inputs of wheel load, slab thickness, and composite k-value. This solution is usually provided in charts. The modulus of elasticity for the slab is assumed equal to 4 million psi and the load is distributed over a circular area with contact tire pressure equal to 75 or 80 psi.
The aforementioned method may result in overestimation of the stresses in two ways: (a) by excluding the friction factor in the interface between slab and subbase, and (b) by frequently considering only the truck load acting on one circular area with contact pressure of 80 psi. This is obviously not correct because the load is transmitted through two or four wheels on the pavement.
Computer Program CRCP-2
CRCP-2 is an extension and revision of the CRCP-1 computer program for analysis of CRC pavements, developed by the Center for Highway Research at the University of Texas, Austin (15, 16). The CRCP-2 program incorporates drying shrinkage, temperature drop, and wheel loads. The theoretical model was based on the interaction between steel, concrete, subgrade and the internal forces caused by temperature drop and drying shrinkage. Differences in thermal coefficients of steel and concrete, together with the drying shrinkage of concrete determine the internal stresses in the slab. The frictionmovement characteristics of the slab and the soil determine the degree of restraint of the supporting medium. Crack spacing is also determined by comparing concrete stress with concrete strength. If known, wheel-load stresses are input into the model. Alternatively, they are evaluated by Westergaard 's equation for interior loading and added to those found by the model. Warping stresses and fatigue due to repetitive loads are not considered.
Inputs are the width and material properties of the concrete slab, type and properties of steel reinforcement, tensile strength data, slab-base friction characteristics, temperature data, and external load. Temperature data consist of minimum temperatures during the first 28 days of construction and minimum temperature expected after the 28th day. The program ~olves for cracking spacing, crack width, and maximum steel and concrete stresses.
The most important variable in the program is crack spacing. Because all loads contribute in crack spacing they must be considered as acting together.
The CRCP-2 program is a useful tool; however, the formulation of the mathematical model does not consider wheel loads. If no other information is available, Westergaard's solution is
TRANSPORTATION RESEARCH RECORD 1099
used Also, there is no temperature variation throughout the slab and the resulting stresses due to temperature drop and drying shrinkage are uniformly distributed. The warping effect, perhaps the severest loading, is not considered. The de.ficiencies of temperature-drop isolation have already been discussed. Finally, steel is assumed to be fully bonded with concrete, and stresses caused by drying shrinkage are not dissipated; in other words, creep effects are not considered. Some analyses of CRCP-2 are also compared in this paper.
APPROACH USED
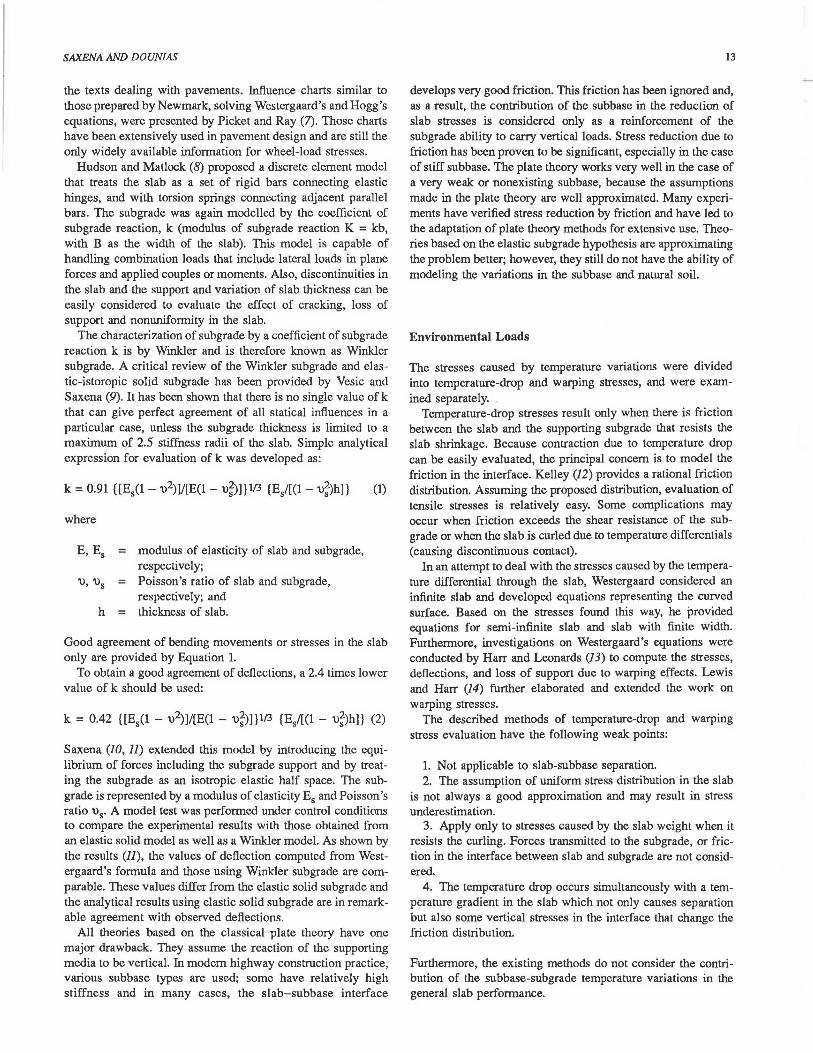
In this paper an examination is made of the stresses induced by static wheel loads and by temperature drop and temperature gradient into the pavement. The same model that was used by Saxena et al. (J) in the study for zero-maintenance anchored pavements will be utilized. A new method of evaluating the wheel-load stresses and some refinement in the model used for thermal stress analysis will be incorporated. The effect of the mechanical loads will be examined by the use of three-dimensional finite-element models and the combined effects of temperature drop and temperature gradient in the slab will be analyzed by two-dimensional finite-element models with two subsequent solutions for heat transfer and thermal stress analysis. The basic tool of analysis will be ANSYS (17, 18), a largecapacity finite-element program, capable of solving static, linear and nonlinear dynamic, harmonic response, and thermal analysis. ANSYS can also easily handle nonlinearities in geomet.&J and material properties. The three-dimensional idealization of the pavement-subb~e-subgrade system is shown in U!~··-- 1 ..l..ll)WC .1.
slab interface subbase
subgrade y
' ,
2-D representation
slab interface subbase
subgrade
x 3-D representat1on
FIGURE 1 Idealization of a pavemeot-subbase-subgrade system.
SAXENA AND DOUN/AS
' : shoulder : lane l lane 2 lane 3 ; shoulder '
"'' > I ...;(!O I'.(\
11-10 ft-+-12 ft-+-- 12 ft........_ 12 ft .......... 10 ft--.j
I I I I I I
I I __ ____ J I +···-·· ... J ... ···-· Al t Bl
I I -·-· ... +- I I Az
I 1-i::p · Bz
I truck I truck t·· car .. ~ ..... .... A3 ..... T ..
B3 I
I I I I
A4 . .. +. . I. ·f . . . . .... .. J .. . .... .... .
B4
I I I I I \}
I I I
Pavement Plan
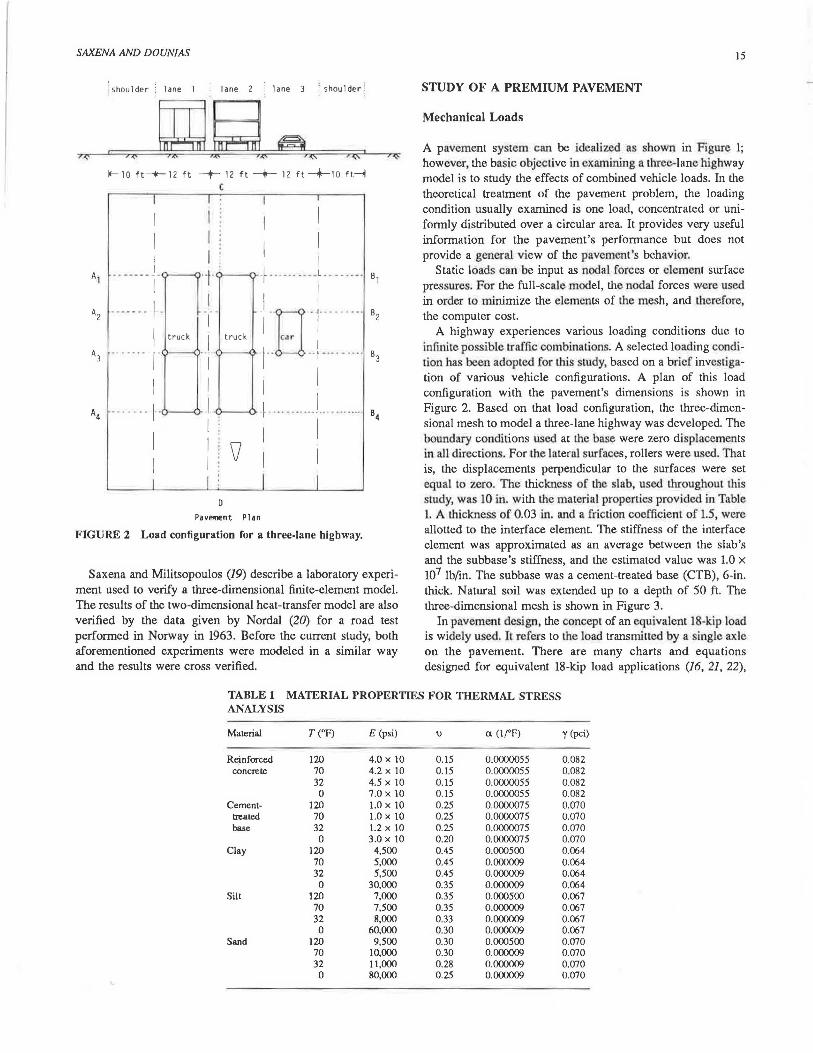
FIGURE 2 Load configuration for a three-lane highway.
Saxena and Militsopoulos (19) describe a laboratory experiment used to verify a three-dimensional finite-element model. The results of the two-dimensional heat-transfer model are also verified by the data given by Nordal (20) for a road test performed in Norway in 1963. Before the current study, both aforementioned experiments were modeled in a similar way and the results were cross verified.
15
STUDY OF A PREMIUM PAVEMENT
Mechanical Loads
A pavement system can be idealized as shown in Figure 1; however, the basic objective in examining a three-lane highway model is to study the effects of combined vehicle loads. In the theoretical treatment of the pavement problem, the loading condition usually examined is one load, concentrated or uniformly distributed over a circular area. It provides very useful information for the pavement's performance but does not provide a general view of the pavement's behavior.
Static loads can be input as nodal forces or element surface pressures. For the full-scale model, the nodal forces were used in order to minimize the elements of the mesh, and therefore, the computer cost.
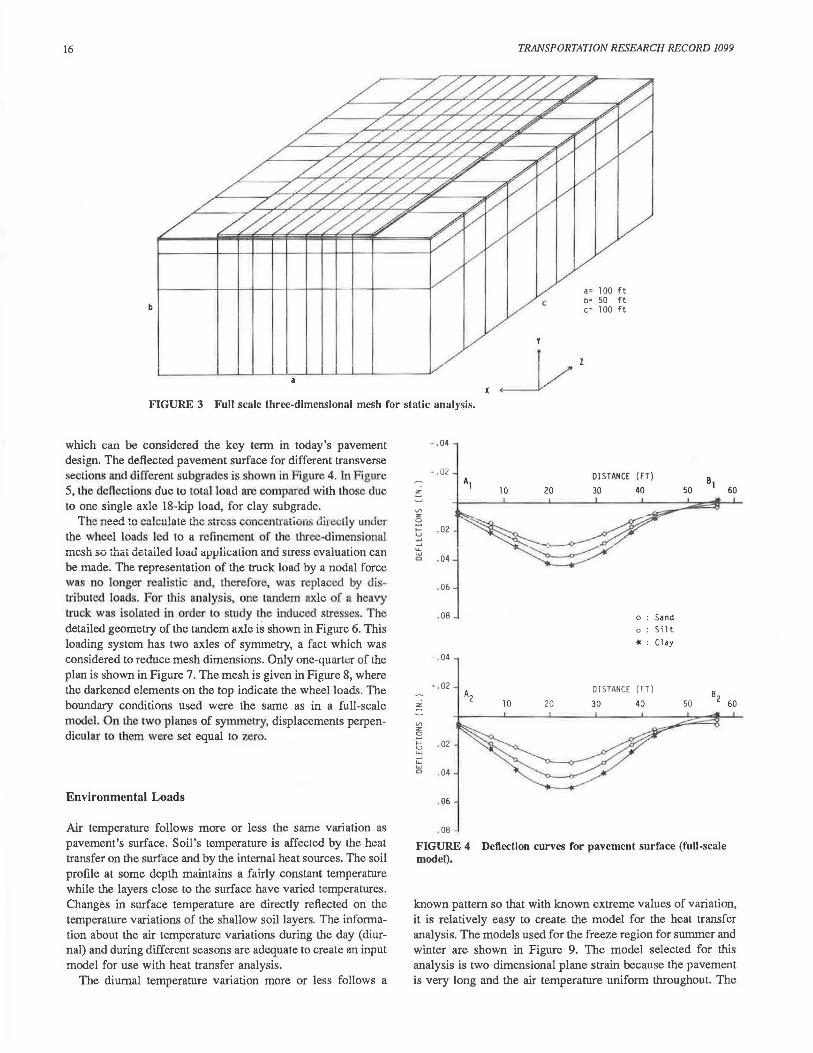
A highway experiences various loading conditions due to infinite possible traffic combinati.ons. A selected loading condition has been adopted for this study, based on a brief inve tigation of various vehicle configurations. A plan of this load configuration with the pavement's dimensions is shown in Figure 2. Based on that load configuration, the three-dimensional mesh to model a three-lane highway was developed. The boundary conditions used at the base were zero displacements in all directions. For the lateral surfaces, rollers were used. That is, the displacements perpendicular to the surfaces were set equal to zero. The thickness of the slab, used throughout this study, was 10 in. with the material properties provided in Table 1. A thickness of 0.03 in. and a friction coefficient of 1.5, were allotted to the interface element. The stiffness of the interface element was approximated as an average between the slab's and the subbase's stillness, and the estimated value was 1.0 x 10⁷ lb/in. The subbase was a cement-treated base (CTB), 6-in. thick. Natural soil was extended up to a depth of 50 ft. The three-dimensional mesh is shown in Figure 3.
In pavement design, the concept of an equivalent 18-kip load is widely used. It refers to the load transmitted by a single axle on the pavement. There are many charts and equations designed for equivalent 18-kip load applications (16, 21, 22),
TABLE 1 MATERIAL PROPERTIES FOR THERMAL STRESS ANALYSIS
Material T (OF) E (psi) \) a (l/°F) 'Y (pci)
Reinforced 120 4.0 x 10 0.15 0.0000055 0.082 concrete 70 4.2 x 10 0.15 0.0000055 0.082
32 4.5 x JO 0.15 0.0000055 0.082 0 7.0 x 10 0.15 0.0000055 0.082
Cement- 120 1.0 x 10 0.25 0.0000075 0.070 treated 70 1.0 x 10 0.25 0.0000075 0.070 base 32 1.2 x 10 0.25 0.0000075 0.070
0 3.0 x 10 0.20 0.0000075 0.070 Clay 120 4,500 0.45 0.000500 0.064
70 5,000 0.45 0.000009 0.064 32 5,500 0.45 0.000009 0.064 0 30,000 0.35 0.000009 0.064
Silt 120 7,000 0.35 0.000500 0.067 70 7,500 0.35 0.000009 0.067 32 8,000 0.33 0.000009 0.067
0 60,000 0.30 0.000009 0.067 Sand 120 9,500 0.30 0.000500 0.070
70 10,000 0.30 0.000009 0.070 32 11.000 0.28 0.000009 0.070 0 80,000 0.25 0.000009 0.070
16
b
TRANSPORTATION RESEARCH RECORD 1099
a= 100 ft b= 50 ft c= 100 ft
FIGURE 3 Full scale three-dimensional mesh for static analysis.
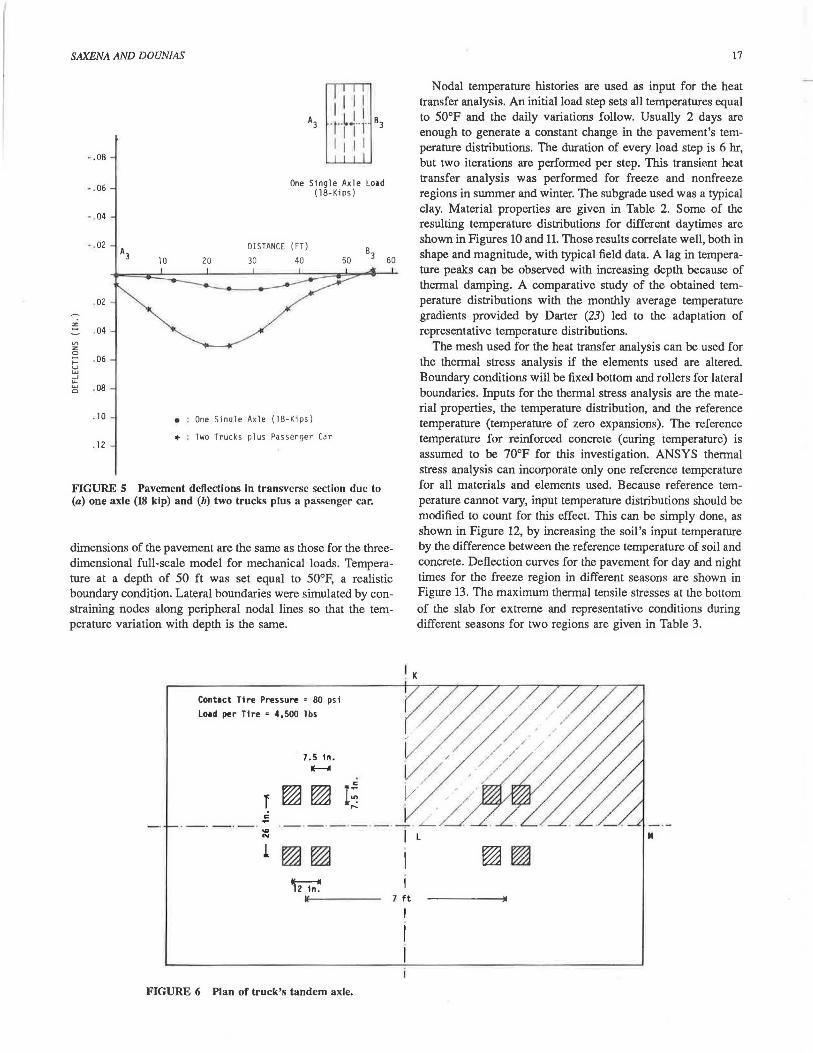
which can be considered the key term in today 's pavement design. The deflected pavement surface for different transverse sec1ions and different subgrades is shown in 'igure 4. In Figure 5, the deflections due to Lota! load are compared with Lhosc due to one single axle 18-kip load, for clay subgrade.
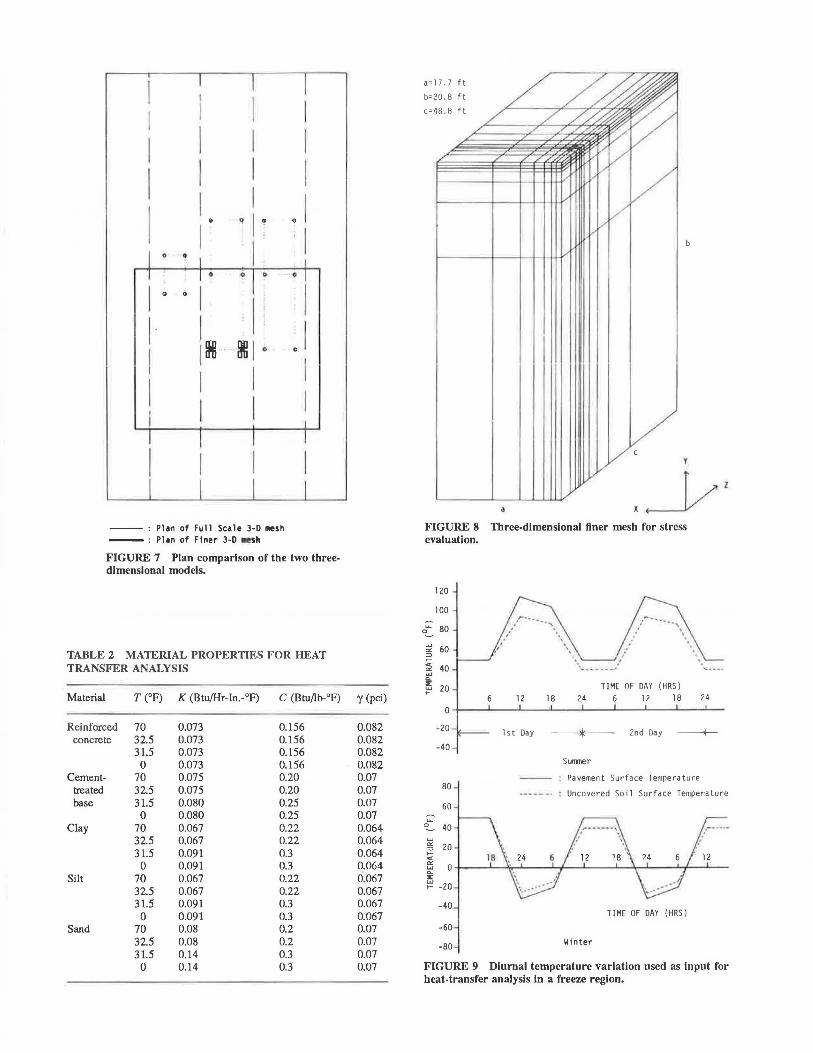
The need to c:-:!culate the stress eoncenLration. di1 1.::cily wider the wheel loads led to a refinemenl of the three-dimensional mesh so that detailed load application and scress evaiuation can be made. The representation of the LrUck load by a nodal force was no longer realistic and, therefore, was replaced by distrfonted loads. For this analysis, one tandem axle of a heavy truck was i olated in order to study the induced stresses. The detailed geomeLry of the tandem axle is shown in Figure 6. This loading system has two axles of symmeLry, a fact which was considered to reduce mesh dimensions. Only one-quarter of the plan is shown in Figure 7. The mesh is given in Figure 8, where the darkened elements on the top indicate the wheel loads. The boundary conditions used were the same as in a full-scale model. On the Lwo planes of symmetry, displacements perpendicular to them were set equal Lo zero.
Environmental Loads
Air temperature follows more or less the same variation as pavement's surface. Soil's temperature is affected by the heat transfer on the surface and by the internal heat sources. The soil profile at some depth maintains a fairly constant temperature while the layers close to the surface have varied temperatures . Changes in surface temperature are directly reflected on the temperature variations of the shallow soil layers. The information about the air temperature variations during the day (diurnal) and during different seasons are adequate to create an input model for use with heat transfer analysis.
The diurnal temperature variation more or less follows a
- .04
- .02
z
V> z 2
. 02 ..... u
"' _, ~ ....,
. 04 c
. 06
.08
. 04
- . 02
Al 10 20
DISTANCE (FT)
30 40
o : Sand
o : Si 1 t
• : Clay
DISTANCE (FT)
50 60
A2 10 20 z 30 40 50
B 2 60
V> z 0
..... u ...., _, u.. ...., c . 04
. 06
.08
FIGURE 4 Deflection curves for pavement surface (full-scale model).
known pattern so that with known extreme values of variation, it is relatively easy to create the model for the heat transfer analysis. The models used for the freeze region for summer and winter are shown in Figure 9. The model selected for this analysis is two-dimensional plane strain because the pavement is very Jong and the air temperature uniform throughout. The
SAXENA AND DOUNIAS
-. OB
•. 06
- ' 04
- . 02
One Single Axle Load ( lB-Kips)
DISTANCE (FT) A3
10 20 30 40 B
50 3 60
.02
z . 04
V> z 0
..... . 06 u ... _J ..... .... . OB 0
. 10 • On e Sinql e Axle (18-Kips)
. 12 it Two Truck s pl us Pa ssenge r Car
FIGURE S Pavement deflections In transverse section due to (a) one axle (18 kip) and (b) two trucks plus a passenger car.
dimensions of the pavement are the same as those for the threedimensional full-scale model for mechanical loads. Temperature at a depth of 50 ft was set equal to 50°F, a realistic boundary condition. Lateral boundaries were simulated by constraining nodes along peripheral nodal lines so that the temperature variation with depth is the same.
Contact T1 re Pressure • BO psi
Load per Tire = 4,500 lbs
... N
7 .5 1n. IE--4
FIGURE 6 Plan of truck's tandem axle.
7 ft
17
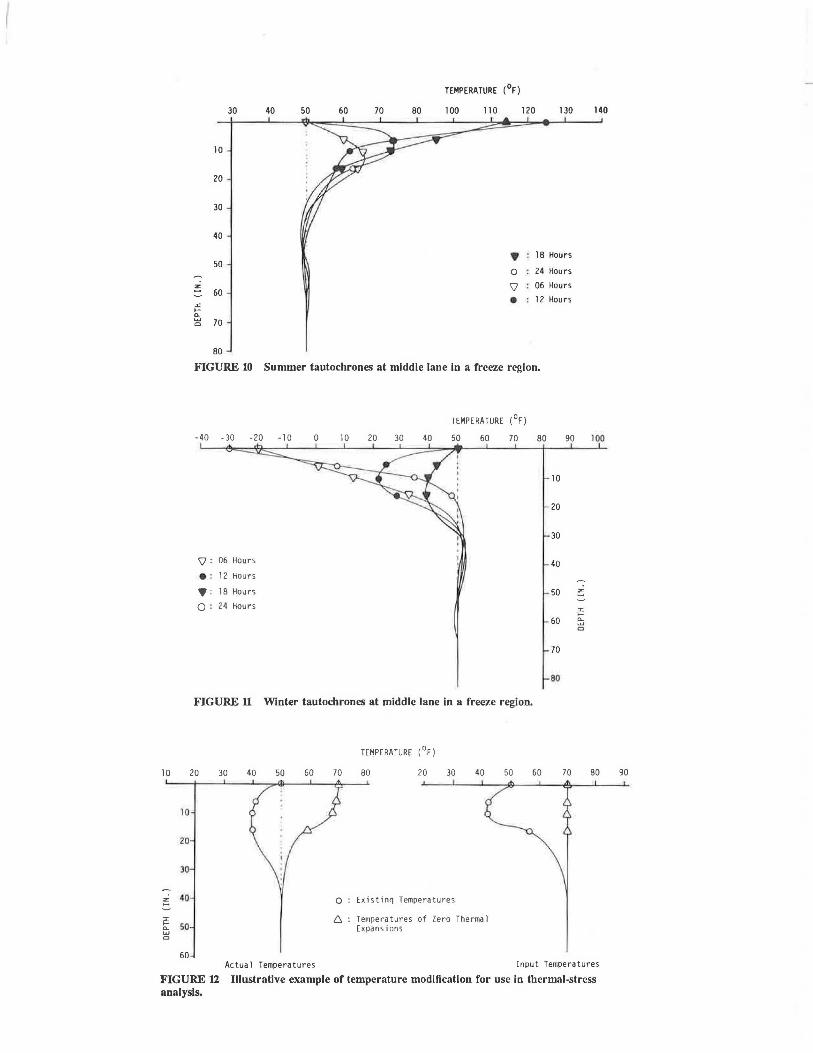
Nodal temperature histories are used as input for the heat transfer analysis. An initial load step sets all temperatures equal to 50°F and the daily variations follow. Usually 2 days are enough to generate a constant change in the pavement's temperature distributions. The duration of every load step is 6 hr, but two iterations are performed per step. This transient heat transfer analysis was performed for freeze and nonfreeze regions in summer and winter. The subgrade used was a typical clay. Material properties are given in Table 2. Some of the resulting temperature distributions for different daytimes are shown in Figures 10 and 11. Those results correlate well, both in shape and magnitude, with typical field data. A lag in temperature peaks can be observed with increasing depth because of thermal damping. A comparative study of the obtained temperature distributions with the monthly average temperature gradients provided by Darter (23) led to the adaptation of representative temperature distributions .
The mesh used for the heat transfer analysis can be used for the thermal stress analysis if the elements used are altered . Boundary conditions will be fixed bottom and rollers for lateral boundaries. Inputs for the thermal stress analysis are the material properties, the temperature distribution, and the reference temperature (temperature of zero expansions). The reference temperature for reinforced concrete (curing temperature) is assumed to be 70°F for this investigation. ANSYS thermal stress analysis can incorporate only one reference temperature for all materials and elements used. Because reference temperature cannot vary, input temperature distributions should be modified to count for this effect. This can be simply done, as shown in Figure 12, by increasing the soil's input temperature by the difference between the reference temperature of soil and concrete. Deflection curves for the pavement for day and night times for the freeze region in different seasons are shown in Figure 13. The maximum thermal tensile stresses at the bottom of the slab for extreme and representative conditions during different seasons for two regions are given in Table 3.
II
I I
I I I I I ~ I ~
0 I ! I
0 ~ I 0 0 ~ 0
I 0 0
I · I I· [ .
I j ltti 00 I 0 0
I I I I I
-- : Plan of Full Scale 3-D niesh - : Plan of Finer 3-D •sh
FIGURE 7 Plan comparison of the two threedlmenslonal models.
TABLE 2 MATERIAL PROPERTIES FOR HEAT TRANSFER ANALYSIS
Material
Reinforced concrete
Cementtreated base
Clay
Silt
Sand
T (°F)
70 32.5 31.5
0 70 32.5 31.5
0 70 32.5 31.5
0 70 32.5 31.5
0 70 32.5 31.5
0
K (Btu/Hr-In.-°F) c (Btu/I b-°F)
0.073 0.156 0.073 0.156 0.073 0.156 0.073 0.156 O.G75 0.20 0.075 0.20 0.080 0.25 0.080 0.25 0.067 0.22 0.067 0.22 0.091 0.3 0.091 0.3 0.067 0.22 0.067 0.22 0.091 0.3 0.091 0.3 0.08 0.2 0.08 0.2 0.14 0.3 0.14 0.3
y (pci)
0.082 0.082 0.082 0.082 O.Q7 0.07 O.Q7 O.Q7 0.064 0.064 0.064 0.064 0.067 0.067 0.067 0.067 0.07 0.07 0.07 0.07
a=l7 .7 ft
b=20. 8 ft
c=48.8 ft
FIGURE 8 Three-dimensional finer mesh for stress evaluation.
120
100
.... 80 0
UJ 60 a:
::::> >-... 40 ·~ - - -- --a: UJ <>.
15 20 TIME OF DAY (HRS) >-
12 18 24 6 12 18 24
0
- 20 1s t Oay 2nd Day --+-- 40
Sumner
Pavement Su rface Temperature 80 -
· Uncovered Soi 1 Surface Temperature
60 ....
0 40
-40 TIME OF DAY (HRS)
-60
-80 Winter
FIGURE 9 Diurnal temperature variation used as input for heat-transfer analysis In a freeze region.
10
10
20
30
z 40
:c ::;: 50 UJ c
60
TEMPERATURE (0F)
30 40 50 60 70 80 100 110 120 130
10
20
30
40
• 18 Hours 50
0 24 Hours
z \} 06 Hours 60 • 12 Hours
:c .... ::!:. 70 c
80
FIGURE 10 Summer tautochrones at middle lane in a freeze region.
-40 -30 -20
\}: 06 Hours
•= 12 Hours
•= 18 Hours
o: 24 Hours
FIGURE 11
20 30 40
TEMPERATURE (OF)
-10 0 10 20 30 40 50 60 70
Winter tautochrones at middle lane in a freeze region.
50 60
TEMPERATURE (OF)
70 80 20 30 40
Q Existin~ Temperatures
C:, Te01pera tu res of Zero Therma 1 Expansions
50
80 90
10
20
30
40
50
60
70
80
60 70
140
100
z
:c .... ::!:. c
80
Ac tual Temper atures !npu t Temperatures
FIGURE 12 Illustrative example of temperature modification for use in thermal-stress analysis.
90
20
- . 15
- • 10
_- . 05 z:
z 0
~
0
~ _, . 05 u. w 0
. 10
. 15
- . 15
-. 10
-:- -. 05 ~
z 0 ~ I-u w _,
. 05 u. w 0
. 10
' 15
"' w 0 _, ::::> 0 :I: V1
u. 0
w
"' 0 w
OISTANCE (FT}
10 15 20 25
Winter
• : Day Time
ii : Niqht Time
DISTANCE (FT)
15 0 25
Summer
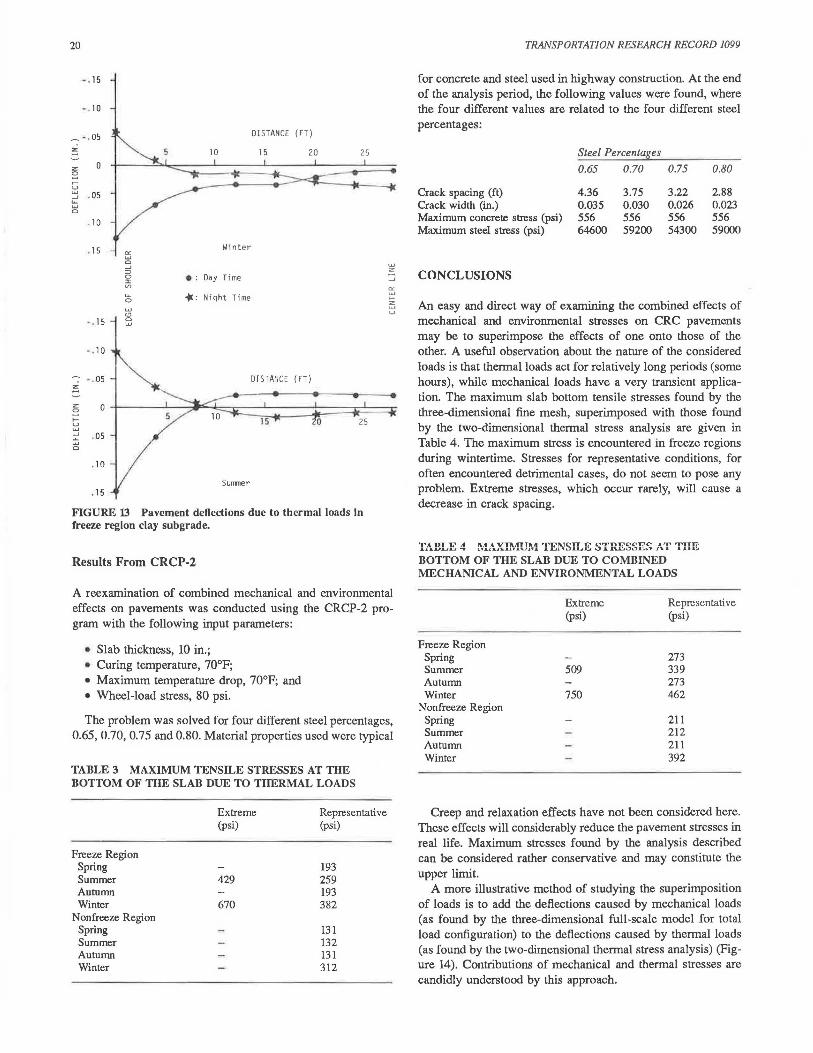
FIGURE 13 Pavement deflections due to thermal loads In freeze region clay subgrade.
Results From CRCP-2
w z _,
"' w 1-
5 u
A reexamination of combined mechanical and environmental effects on pavements was conducted using the CRCP-2 program with the following input parameters:
• Slab thickness, 10 in.; • Curing temperature, 70°F; • Maximum temperature drop, 70°F; and • Wheel-load stress, 80 psi.
The problem was solved for four different steel percentages, 0.65, 0.70, 0.75 and 0.80. Material properties used were typical
TABLE 3 MAXIMUM TENSILE STRESSES AT THE BOTTOM OF THE SLAB DUE TO THERMAL LOADS
Freeze Region Spring Summer Autumn Winter
Nonfreeze Region Spring Summer Autumn Winter
Extreme (psi)
429
670
Representative (psi)
193 259 193 382
131 132 131 312
TRANSPORTATION RESEARCH RECORD 1099
for concrete and steel used in highway construction. At the end of the analysis period, the following values were found, where the four different values are related to the four different steel percentages:
Steel Percentages
0.65 0.70 0.75 0.80
Crack spacing (ft) 4.36 3.75 3.22 2.88 Crack width (in.) 0.035 0.030 0.026 0.023 Maximum concrete stress (psi) 556 556 556 556 Maximum steel stress (psi) 64600 59200 54300 59000
CONCLUSIONS
An easy and direct way of examining the combined effects of mechanical and environmental stresses on CRC pavements may be to superimpose the effects of one onto those of the other. A useful observation about the nature of the considered loads is that thermal loads act for relatively long periods (some hours), while mechanical loads have a very transient application. The maximum slab bottom tensile stresses found by the three-dimensional fine mesh, superimposed with those found by the two-dimensional thermal stress analysis are given in Table 4. The maximum stress is encountered in freeze regions during wintertime. Stresses for representative conditions, for often encountered detrimental cases, do not seem to pose any problem. Extreme stresses, which occur rarely, will cause a decrease in crack spacing.
BOTTOM OF THE SLAB DUE TO COMBINED MECHANICAL AND ENVIRONMENTAL LOADS
Freeze Region Spring Summer Autumn Winter
Nonfreeze Region Spring Summer Autumn Winter
Extreme (psi)
509
750
Representative (psi)
273 339 273 462
211 212 211 392
Creep and relaxation effects have not been considered here. These effects will considerably reduce the pavement stresses in real life. Maximum stresses found by the analysis described can be considered rather conservative and may constitute the upper limit.
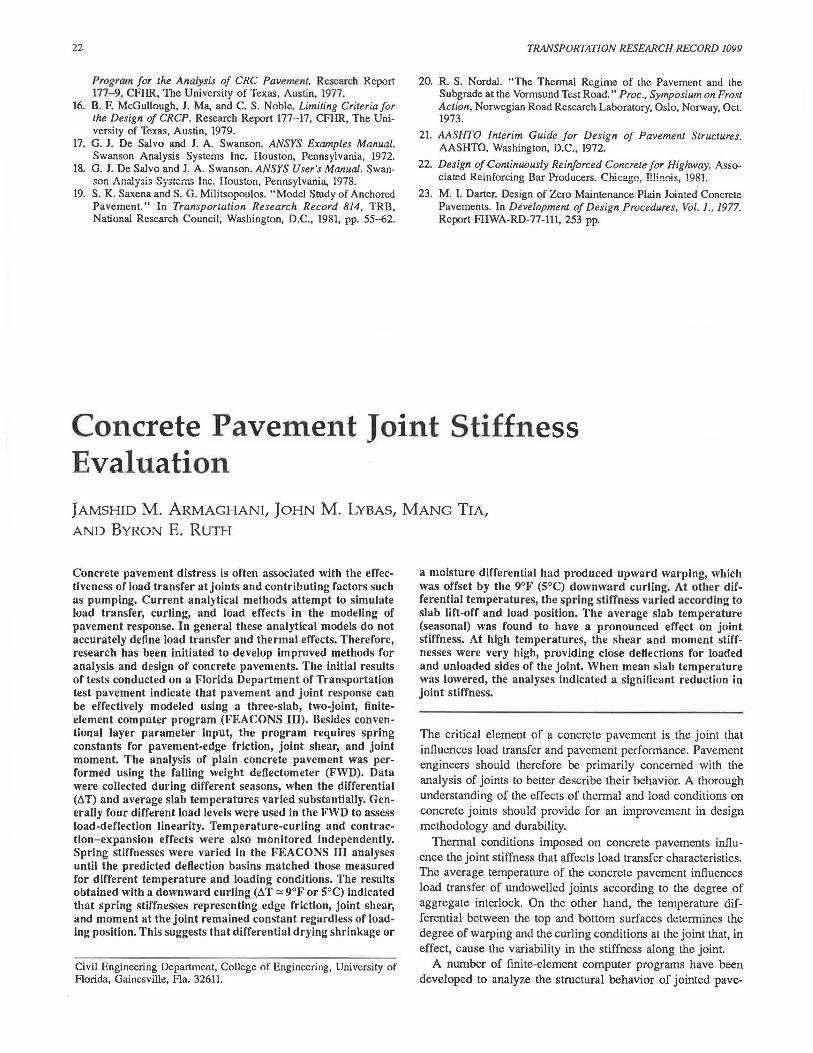
A more illustrative method of studying the superimposition of loads is to add the deflections caused by mechanical loads (as found by the three-dimensional full-scale model for total load configuration) to the deflections caused by thermal loads (as found by the two-dimensional thermal stress analysis) (Figure 14). Contributions of mechanical and thermal stresses are candidly understood by this approach.
SAXENA AND DOUNIAS
- .15
· . lO
-. 05
z: 0
z: ::: . 05 I-u LU ...J .... LU ' 10 0
. 15
- . 15
-. 10
- . 05
z 0
z: ::: . 05 I-u ~ t!:i ' 10 0
• 15
.... 0
(FT)
20
Winter
• : Day Time
* : Night Time
DISTANCE (FT)
15
Surrmer
25
25
FIGURE 14 Pavement deflections due to thermal loads in nonfreeze region clay subgrade.
w z ...J
"" .... >-5 u
The results indicate that a dangerous condition may be created when separation occurs between the slab and the subbase due to curling. Mechanical loads applied at that instant may cause dangerous stress reversals. In the current study, separation was observed only for the edge of the shoulders. Because shoulders are usually confined or continuous, this effect may not occur in real life.
The environmental loads constitute the severest loads the pavement is subjected to. Deflections can be of the same order, perhaps even higher, than those caused by wheel loads. Stresses are many times higher than those caused by mechanical loads. Furthermore, the daily reversal of a pavement's curvature may cause fatigue and deterioration. Mechanical loads may overload or relieve stresses by thermal loads depending on the temperature distribution.
Maximum vertical stresses in the soil were found to be 1.5 psi for this type of premium pavement. This value is lower than what is usually considered as critical (10 psi).
Investigation of different subgrades indicated that soil's contribution in reduction of stress and deflection is very significant. Wheel-load deflections for sand (E = 10,000 psi), were 40 percent lower than those found for clay (E = 5,000 psi). Wheelload stresses for sand were 39 percent lower than those for clay. Nevertheless, thermal stresses and deflections are only slightly affected by the subgrade type.
The comparison between the one single axle 18-kip load and the total load configuration (Figure 2) was intended to yield two ratios. The ratio for the maximum deflections was 1 to 5
21
and for the maximum stresses 1 to 3. Those ratios may be very useful for a comprehensive understanding of a pavement's performance when it is designed by the equivalent 18-kip concept.
The CRCP-2 computer program results cannot be directly compared with the results found by the proposed model, because they account for different loading conditions. Stresses revealed by CRCP-2 are in the same range with those obtained by the current model. CRCP-2 yielded maximum concrete stress equal to 556 psi, while maximum concrete stress revealed by the current model was 750 psi. CRCP-2 does not solve for deflections. The estimation of crack spacing and crack width made by CRCP-2 is very useful for a better understanding of pavement performance. Both crack spacing and crack width are decreasing as steel percentage increases. Regional and serviceability factors will define the required steel percentage.
REFERENCES
1. S. K. Saxena, W. J. Rosenkranz, and S. T. Militsopoulos. Model Study and Analytical Investigations of Anchored Pavement. Report FHWARD-80-26. Office of Research, FI-IWA, U.S . Department of Transportation, 1980.
2. H. M. Westergaard. Stresses in Concrete Pavements Computed by Theoretical Analysis. Public Roads, Vol.. 8, No. 3, 1921, pp. 54-60.
3. H. M. Westergaard. New Formulas for Stresses in Concrete Pavements of Airfields. In Papers and Reporls of Commiilees Published in Proceedings, ASCE, November 1946 to September 1947 Inclusive, Not Published in Transactions, Vol. 112. ASCE, New York, N.Y., 1947.
4. H. Hertz. Uber das Gleichgewicht Schwinnender elastischer platten. Wiedermann's Annalen cler Physik und chemie., Vol. 22, 1884, pp. 449--455.
5. A. H. A. Hogg. Equilibrium of a Thin Slab on Elastic Foundations of Infinite Depth. Philosophical Magazine, Vol. 35, 1944, pp. 2654-276.
6. D. L. Holl. "Thin Plates on Elastic Foundations." Proc., 5th International Congress on Applied Mechanics, Cambridge, Massachusetts, 1938.
7. G. Picket and G. K. Ray. "Influence Charts for Concrete Pavement." Paper 2425, ASCE, New York, N.Y., 1951, p. 49.
8. W. R. Hudson and H. Matlock. Discontinuous Orthotropic Plates and Pavement-Slab. Research Report-56-6, CFHR, The University of Texas, Austin, 1966.
9. A. S. Vesic and S. K. Saxena. NCHRP Report 97: Analysis of Structural Behavior of AASHO Road Test Rigid Pavements. HRB, National Research Council, Washington, D.C., 1970, 35 pp.
10. S. K. Saxena. Foundation Mats and Pavement Slabs Resting on an Elastic Foundation-Analyzed Through a Physical Model. Ph.D. dissertation, Department of Civil Engineering, Duke University, Durham, North Carolina, 1971.
11. S. K. Saxena. "Pavement Slabs Resting on Elastic Foundations." In Highway Research Record 466, HRB, National Research Council, Washington, D.C., 1973, pp. 163-178.
12. E. F. Kelley. Applications of the Results of Research to Structural Design of Concrete Pavements. Public Roads, Vol. 20, No. 5-6, 1939, pp. 83-126.
13. G. A. Leonards and M. E. Harr. Analysis of Concrete Slabs on Ground. Journal of Soil Mechanics and Foundations Division, Proceedings, ASCE, June 1959.
14. K. 1-1. Lewis and M. E. Harr. "Analysis of Concrete Slabs on Ground Subjected to Warping and Moving Loads." In Highway Research Record 291, HRB, National Research Council, Washington, D.C., 1969, pp. 194-211.
15. J. Ma and B. F. McGullough. CRCP-2, and Improved Computer
22
Program for lhe Analysis of CRC Pavement. Research Report 177-9, CFHR, The University of Texas, Austin, 1977.
16. B. F. McGullough, J. Ma, and C. S. Noble. Limiting Criteria for the Design of CRCP. Research Report 177-17, CFHR, The University of Texas, Austin, 1979.
17. G. I. De Salvo and I. A. Swanson. ANSYS Examples Manual. Swanson Analysis Systems Inc. Houston, Pennsyivania, 1972.
18. G. I. De Salvo and J. A. Swanson. ANSYS User's Manual. Swanson Analysis Systems Inc. Houston, Pennsylvania, 1978.
19. S. K. Saxena and S. G. Militsopoulos. "Model Study of Anchored Pavement." In Transportation Research Record 814, TRB, National Research Council, Washington, D.C., 1981, pp. 55-Q2.
TRANSPORTATION RESEARCH RECORD 1099
20. R. S. Nordal. "The Thermal Regime of the Pavement and the Subgrade at the Vormsund Test Road." Proc., Symposium on Frost Action, Norwegian Road Research Laboratory, Oslo, Norway, Oct. 1973.
21. AASHTO Interim Guide for Design of Pavement Structures. AASHTO, Washington, D.C., 1972.
22. Design of Conlinuously Reinforced Concrete for Highway. Associated Reinforcing Bar Producers. Chicago, Illinois, 1981.
23. M. I. Darter. Design of Zero Maintenance Plain Jointed Concrete Pavements. In Developmenl of Design Procedures, Vol. 1., 1977. Report rHWA-RD-77-lll, 253 pp.
Concrete Pavement Joint Stiffness Evaluation JAMSHID M. ARMAGHANI, JOHN M. LYBAS, MANG TIA,
AND BYRON E. RUTH
Concrete pavement distress is often associated with the effectiveness of load transfer at joints and contributing factors such as pumping. Current analytical methods attempt to simulate load transfer, curling, and load effects in the modeling of pavement response. In general these analytical models do not accurately define load transfer and thermal effects. Therefore, research bas been initiated to develop improved methods for analysis and design of concrete pavements. The initial results of tests conducted on a Florida Department of Transportation test pavement Indicate that pavement and joint response can be effectively modeled using a three-slab, two-joint, finiteelement computer program (FEACONS III). Besides conventional layer parameter input, the program requires spring constants for pavement-edge friction, joint shear, and joint moment. The analysis of plain concrete pavement was performed using the falling weight deflectometer (FWD). Data were collected during different seasons, when the differential (LlT) and average slab temperatures varied substantially. Generally four different load levels were used in the FWD to assess load-deflection linearity. Temperature-curling and contraction-expansion effects were also monitored independently. Spring stiffnesses were varied in the FEACONS III analyses until the predicted deflection basins matched those measured for different temperature and loading conditions. The results obtained with a downward curling (LlT = 9°F or 5°C) indicated that spring stiffnesses representing edge friction, joint shear, and moment at the joint remained constant regardless of loadIng position. This suggests that differential drying shrinkage or
Civil Engineering Department, College of Engineering, University of Florida, Gainesville, Fla. 32611.
a moisture differential had produced upward warping, which was offset by the 9°F (5°C) downward curling. At other differential temperatures, the spring s tiffness varied according to slab lift-off and load position. The average slab temperature (seasonal) was found to have a pronounced effect on joint stiffness. At high temperatures, the shear and moment stiffnesses were very high, providing close deflections for loaded and unloaded sides of the joint. When mean slab temperature was lowered, the analyses indicated a significant reduction in joint stiffness.
The critical element of a concrete pavement is the joint that influences load transfer and pavement performance. Pavement engineers should therefore be primarily concerned with the analysis of joints to better describe their behavior. A thorough understanding of the effects of thermal and load conditions on concrete joints should provide for an improvement in design methodology and durability.
Thermal conditions imposed on concrete pavements influence the joint stiffness that affects load transfer characteristics. The average temperature of the concrete pavement influences load transfer of undowelled joints according to the degree of aggregate interlock. On the other hand, the temperature differential between the top and bottom surfaces determines the degree of warping and the curling conditions at the joint that, in effect, cause the variability in the stiffness along the joint.
A number of finite-element computer programs have been developed to analyze the structural behavior of jointed pave-