Embed Size (px)
Citation preview
P O S I V A O Y
O l k i l u o t o
F I -27160 EURAJOKI , F INLAND
Te l +358-2-8372 31
Fax +358-2-8372 3709
I r a O ja la
Jø rn S tenebrå ten
August 2010
Work ing Repor t 2008 -27
Mechanical and Acoustic Properties ofthe Altered Rock at Olkiluoto

August 2010
Base maps: ©National Land Survey, permission 41/MML/10
Working Reports contain information on work in progress
or pending completion.
The conclusions and viewpoints presented in the report
are those of author(s) and do not necessarily
coincide with those of Posiva.
I ra O ja la
Jø rn S tenebrå ten
S INTEF Pe t ro l eum Resea rch
Work ing Report 2008 -27
Mechanical and Acoustic Properties ofthe Altered Rock at Olkiluoto

Mechanical and Acoustic Properties of the Altered Rock at Olkiluoto ABSTRACT This study was motivated by the need to quantify the effect of test temperature and alteration on the mechanical and acoustic properties of the migmatitic gneiss from the Olkiluoto site. A series of compressive loading tests were carried out at four different temperatures (25, 50, 100 and 120 °C). During the initial heating phase the strain and compressional (p-wave) velocities decreased linearly with the sample temperature. In the subsequent compression tests the p- and shear (s-wave) velocities increased in a logarithmic fashion as a function of the axial stress or strain. The strength of the altered migmatitic gneiss varied from 110 MPa to 132 MPa. This is in the reported strength range for the material. Hence, alteration does not appear to reduce the rock strength considerably. The bulk density and acoustic wave velocity did not correlate with the rock strength. Furthermore, the strength of the test specimen was not related to test temperature. While the mechanical properties of this material may be temperature dependent, such a correlation might not be easy to measure due to the large sample-to-sample heterogeneity. Another possible reason for the strength variation is the rock anisotropy. The measured radial p-wave velocities were consistently higher than the axial p-wave velocities. This observation suggests that the rock specimens exhibit anisotropy of physical properties.
Keywords: Olkiluoto, rock strength, altered rock, temperature, p-wave velocity, s-wave velocity
Olkiluodon muuttuneen kiven mekaaniset ja akustiset ominaisuudet TIIVISTELMÄ Tämän tutkimuksen tarkoitus on selvittää lämpötilan ja muuttuneisuuden vaikutusta kiven mekaanisiin ja akustisiin ominaisuuksiin. Tutkimusmateriaalina on Olkiluodon migmatiittinen gneissi. Lämpötilan ja muuttuneisuuden vaikutusta kiven lujuus-ominaisuuksiin tutkittiin kuormituskokein laboratoriossa. Kiven puristuslujuus mitattiin neljässä eri lämpötilassa (25, 50, 100 ja 120 °C). Puristus- (p-aalto) ja leikkausaallon (s-aalto) nopeus kivinäytteessä laski lineaarisesti lämpötilan kohotessa. Samalla kivinäyte venyi lämpölaajenemisen johdosta. Materiaalin puristuslujuus mitattiin yksiaksiaalisen kokeen avulla lämmön tasaannuttua näytteessä. Jännityksen kohotessa puristus- ja leikkausaallon nopeus kohosi venymän tai jännityksen logaritmisena funktiona. Migmatiittisen gneissin puristuslujuus oli 110-132 MPa. Samanlaisia lujuusarvoja on myös mitattu aiemmissa tutkimuksissa. Koetulokset osoittavat siten, että muuttuminen tai lämpötila ei vaikuta olennaisesti gneissin puristuslujuuteen. On kuitenkin tärkeä huomioida, että Olkiluodon migmatiittinen gneissi on heterogeenista ja tämän vuoksi puristuslujuus saattaa vaihdella paljonkin kivinäytteestä toiseen. Kiven mekaaniset ominaisuudet saattavat myös olla anisotrooppisia. Testit osoittavat, että p-aallon nopeus on suurempi sylinterinmuotoisen kivinäytteen säteen suuntaisesti kuin pituusakselin suuntaan. Tämä mittaustulos merkitsee, että kivinäytteen akustiset ominaisuudet ovat anisotrooppisia. Avainsanat: Olkiluoto, kiven lujuus, muuttunut kivi, lämpötila, p-aallon nopeus, s-aallon nopeus

1
TABLE OF CONTENTS ABSTRACT TIIVISTELMÄ 1. INTRODUCTION ................................................................................................... 2 2. METHODOLOGY .................................................................................................. 4
2.1. Test specimens .............................................................................................. 4 2.2. Test system and procedure ............................................................................ 5 2.3. Data analysis .................................................................................................. 7
3. TEST RESULTS .................................................................................................... 8
3.1. Introduction ..................................................................................................... 8 3.2. The initial heating phase ................................................................................ 8 3.3. The strength and deformation properties ..................................................... 17 3.4. The p- and s-wave velocities ........................................................................ 19
4. DISCUSSION ...................................................................................................... 23 5. CONCLUSION .................................................................................................... 26 REFERENCES ............................................................................................................. 27 APPENDIX A ................................................................................................................ 29
2
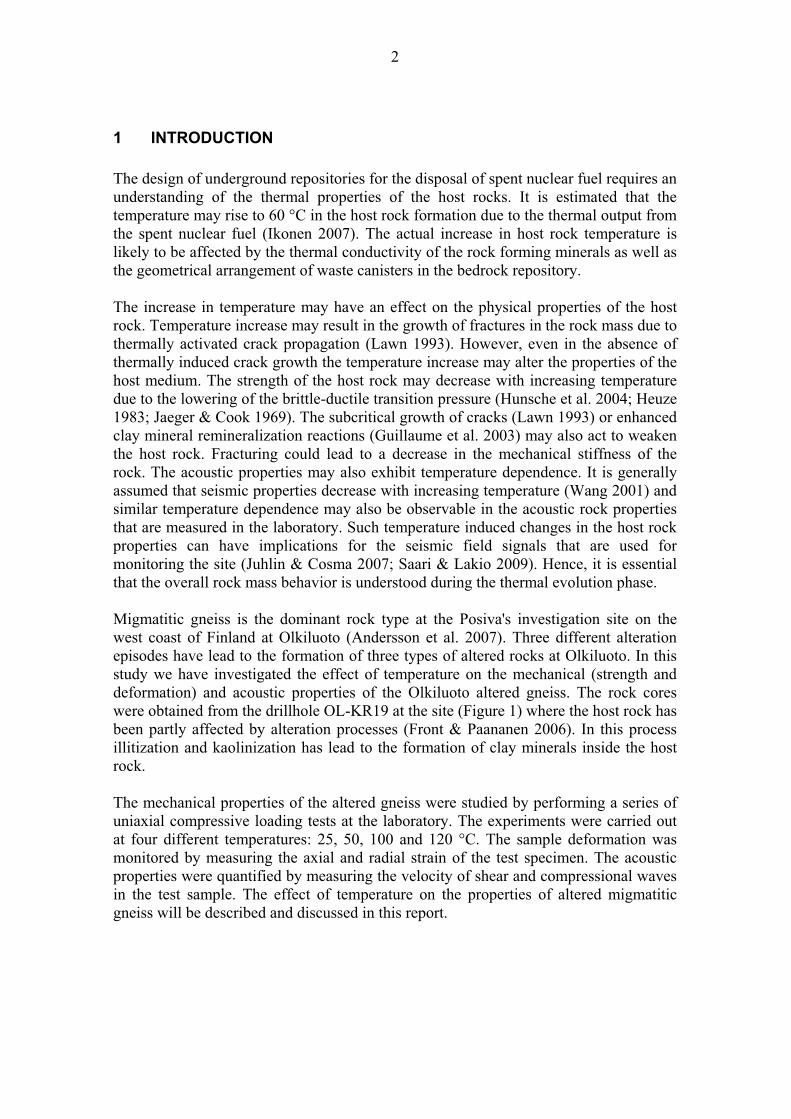
1 INTRODUCTION The design of underground repositories for the disposal of spent nuclear fuel requires an understanding of the thermal properties of the host rocks. It is estimated that the temperature may rise to 60 °C in the host rock formation due to the thermal output from the spent nuclear fuel (Ikonen 2007). The actual increase in host rock temperature is likely to be affected by the thermal conductivity of the rock forming minerals as well as the geometrical arrangement of waste canisters in the bedrock repository. The increase in temperature may have an effect on the physical properties of the host rock. Temperature increase may result in the growth of fractures in the rock mass due to thermally activated crack propagation (Lawn 1993). However, even in the absence of thermally induced crack growth the temperature increase may alter the properties of the host medium. The strength of the host rock may decrease with increasing temperature due to the lowering of the brittle-ductile transition pressure (Hunsche et al. 2004; Heuze 1983; Jaeger & Cook 1969). The subcritical growth of cracks (Lawn 1993) or enhanced clay mineral remineralization reactions (Guillaume et al. 2003) may also act to weaken the host rock. Fracturing could lead to a decrease in the mechanical stiffness of the rock. The acoustic properties may also exhibit temperature dependence. It is generally assumed that seismic properties decrease with increasing temperature (Wang 2001) and similar temperature dependence may also be observable in the acoustic rock properties that are measured in the laboratory. Such temperature induced changes in the host rock properties can have implications for the seismic field signals that are used for monitoring the site (Juhlin & Cosma 2007; Saari & Lakio 2009). Hence, it is essential that the overall rock mass behavior is understood during the thermal evolution phase. Migmatitic gneiss is the dominant rock type at the Posiva's investigation site on the west coast of Finland at Olkiluoto (Andersson et al. 2007). Three different alteration episodes have lead to the formation of three types of altered rocks at Olkiluoto. In this study we have investigated the effect of temperature on the mechanical (strength and deformation) and acoustic properties of the Olkiluoto altered gneiss. The rock cores were obtained from the drillhole OL-KR19 at the site (Figure 1) where the host rock has been partly affected by alteration processes (Front & Paananen 2006). In this process illitization and kaolinization has lead to the formation of clay minerals inside the host rock. The mechanical properties of the altered gneiss were studied by performing a series of uniaxial compressive loading tests at the laboratory. The experiments were carried out at four different temperatures: 25, 50, 100 and 120 °C. The sample deformation was monitored by measuring the axial and radial strain of the test specimen. The acoustic properties were quantified by measuring the velocity of shear and compressional waves in the test sample. The effect of temperature on the properties of altered migmatitic gneiss will be described and discussed in this report.
3
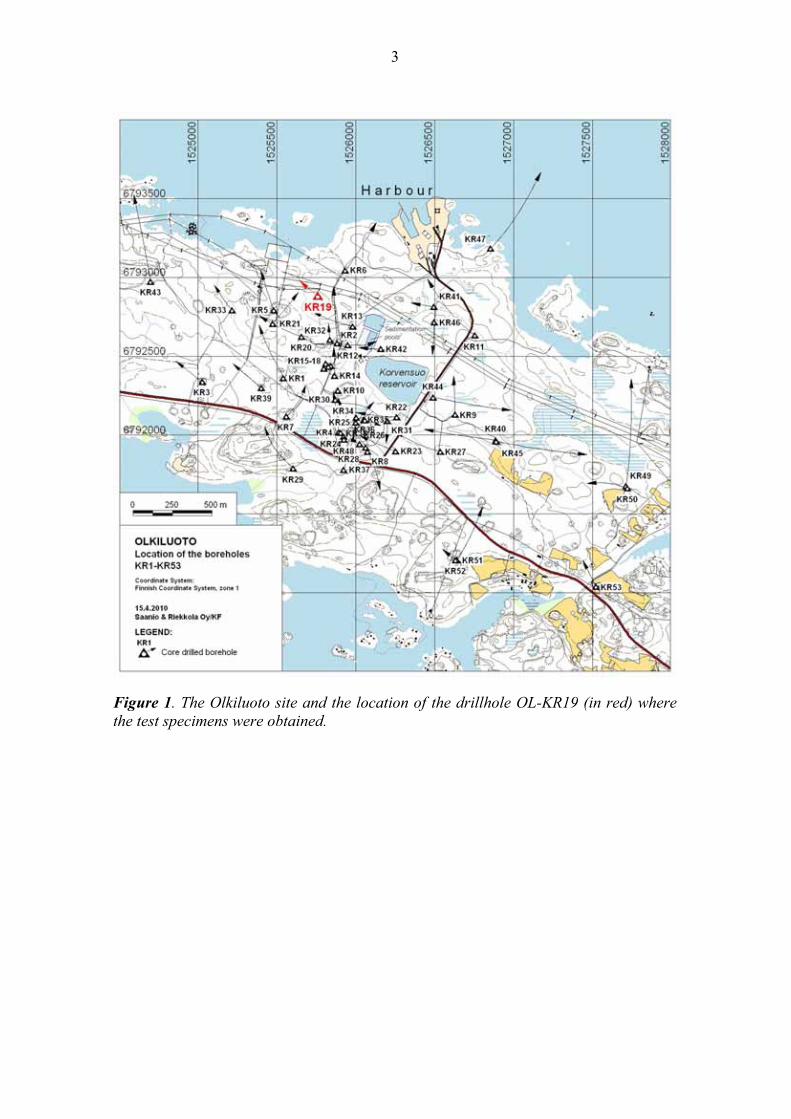
Figure 1. The Olkiluoto site and the location of the drillhole OL-KR19 (in red) where the test specimens were obtained.
4
2 METHODOLOGY
2.1 Test specimens The test material is migmatitic gneiss from the Olkiluoto site. The drill cores were obtained from the drillhole OL-KR19 that is illustrated in Figure 1. We obtained six cores with a diameter of 50 mm and length around 12-13 cm from Posiva. Four cores were selected for further testing. Cylindrical samples (38 mm) were prepared from the larger cores with a diamond coring drill. Details of the test specimens are shown in Table 1. The specimen ends were ground parallel and flat to produce right angled cylinders. The test samples had length to diameter ratio of 2:1 which is recommended for rock mechanics testing (Fairhurst & Hudson 1999; Paterson 1978). If the length to diameter ratio is much smaller than 2-3 a homogeneous distribution of stresses can no longer be assumed. The diameter of the test specimen was chosen to be the same as the platen diameter in order to minimize end effects. Appendix A shows photographs of the test samples. It should be noted that the original drillcores were around 12-13 cm long with a diameter of 50 mm. Hence, it was not possible to adhere to ISRM standards in preparing the samples for this test series. The ISRM standard suggests that the test specimens should have a diameter of 50 mm or more and a length that is 2.5-3.0 times the diameter. Yet, it is Posiva’s procedure to use ISRM (International Society for Rock Mechanics) suggested methods for laboratory testing. Due to the unavailability of suitable size specimens of altered rock it was not possible to follow these guidelines in this study. It is anticipated that the study will be followed by a more through experimental programme on the properties of altered rocks using ISRM standard size specimens. The photographs of the samples are shown in Appendix A. The samples that were chosen for testing were those that seemed most homogeneous on visual inspection. This kind of criteria was adopted in order to avoid the possibility that local inhomogeneities would affect the specimen strength as determined in the laboratory. The extent of alteration was not investigated in detail as this was beyond the scope of the present study.
Table 1. The test specimens. The rock type was Olkiluoto migmatitic gneiss. The test temperature is also given.
Test sample
Drill hole ID
Top m
Bottom m
Length mm
Diameter mm
Density
T °C
ML257_01 OL-KR19 54.85 54.97 77.49 38.11 2.74 120 ML257_02 OL-KR19 95.53 95.68 77.51 38.01 2.69 25 ML257_03 OL-KR19 96.74 96.87 77.55 38.09 2.75 50 ML257_04 OL-KR19 106.29 106.42 77.53 38.01 2.74 100

5
The compressive loading tests were carried out on air-dry samples. This kind of saturation condition was chosen because test regime included zero pore pressure and confining stress. It would not have been possible to carry out a 100 °C test with zero pore pressure on a water saturated sample. It was deemed important that all tests are carried out under identical conditions.
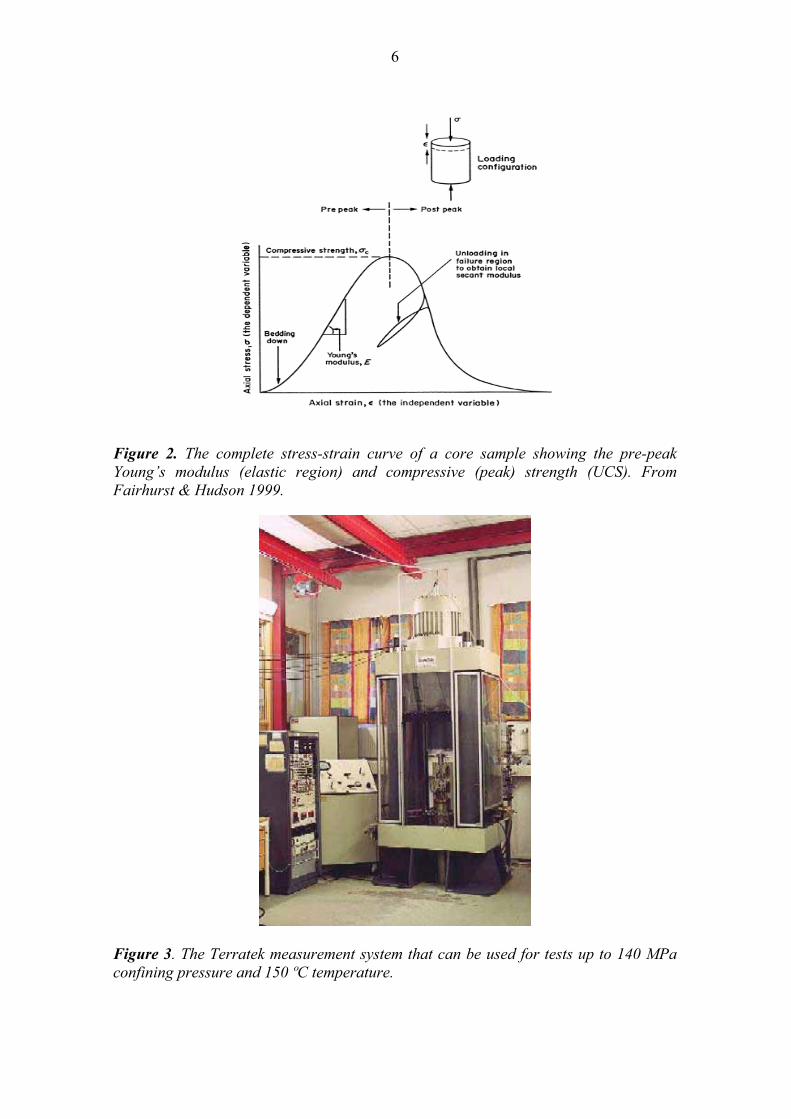
2.2 Test system and procedure The loading path for the rock deformation tests was uniaxial compression (Figure 2). Hence, the confining pressure was zero and the pore pressure system was open to atmosphere. The rock cores were placed in a heat shrink and placed inside a load frame. Confining oil was used around the test sample in order to achieve even distribution of temperature inside the test specimen. The oil pressure was set to zero in order to mimic an unconfined compressive strength (UCS) test. Continuous monitoring of deformation, stress and acoustic velocities was carried out during each test. The radial strain on the sample was monitored by using circumferential chain. Strain gauges were also used for the 120 °C test. Strain gauges were not used for the other tests as the material is rather heterogeneous. The chain method of strain measurement was considered to be sufficient for achieving a global measure of radial strain during the rock deformation tests. The rock deformation tests were carried out on a Terratek load frame that is illustrated in Figure 3. This massive 2.7 MN load frame facilitates the testing of rock samples with a maximum allowable confining pressure of 140 MPa and 250 kN axial load. The maximum axial stress on specimen depends on the diameter of the cylindrical specimen. It is possible to carry out tests up to 150 ºC temperatures by using this load cell. The test equipment is also equipped with measurement systems for fluid permeability and acoustic wave velocities. Both axial and radial wave velocities are measured by using sensors inside the platens and along the circumference of the cylindrical rock sample. The acoustic wave velocities were determined by utilizing the ultrasonic pulse transmission technique (Birch 1960). The axial compressional (p) and shear (s) waves as well as radial p-wave velocities were recorded continuously as a function of time. It should be noted that the laboratory frequency for the measurement of p- and s-wave velocities is in the kilohertz range (500 kHz) while seismic surveys are typically carried out using lower frequency receivers with a resonant frequency of few tens of Hz (Juhlin & Cosma 2007). Because the seismic properties of rocks are frequency dependent we cannot assume that the velocities that are measured in the laboratory are the same velocities that are measured in the field. However, because of the extremely low intrinsic fluid permeability of the Olkiluoto gneiss (10-21 to 10-16 m2) the effects of dispersion are also small and one may assume that the seismic velocities are in the high frequency range (Batzle et al. 2001; Voutilainen et al. 2009). The acoustic and mechanical data were corrected for test temperature.
6
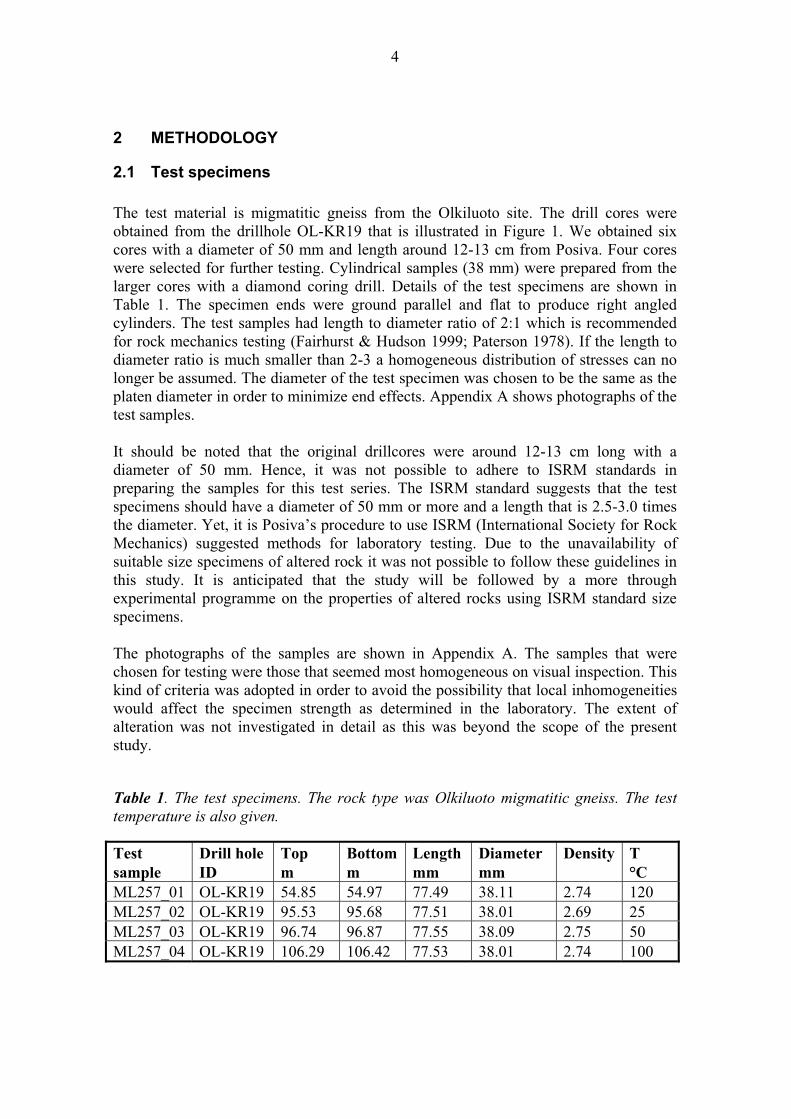
Figure 2. The complete stress-strain curve of a core sample showing the pre-peak Young’s modulus (elastic region) and compressive (peak) strength (UCS). From Fairhurst & Hudson 1999.
Figure 3. The Terratek measurement system that can be used for tests up to 140 MPa confining pressure and 150 ºC temperature.
7
2.3 Data analysis The apparent elastic parameters were determined according to the suggested guidelines for UCS testing (Fairhurst & Hudson 1999). The elastic modulus E was determined from linear part of the stress and strain curve. The elastic modulus is given by the ratio of axial stress to axial strain as shown in Figure 2. For a true uniaxial test the elastic modulus is called the Young’s modulus. Additional parameters such as �ci and �cd were not determined for this test series. In our tests the specimens were jacketed prior to testing so that confining oil could be used for heating the test samples. Because of the presence of a jacket that prevents confining oil from entering the sample but also limits the radial expansion of the test sample our experiments are not strictly speaking uniaxial tests. However, the tests were carried out under zero confining pressure in order to mimic uniaxial tests. The Poisson’s ratio � was determined from the linear portion of the radial and axial stress-strain curve. The Poisson’s ratio is defined as the ratio of lateral expansion to axial contraction. The lateral and axial strains were calculated as described in Fairhurst & Hudson (1999). It is perhaps due to the fact that the test samples were jacketed that the lateral strain exhibited by the sample was somewhat limited. One might expect that the calculated Poisson’s ratios slightly smaller than in a typical UCS test. However, the effect of the jacket corresponds to only about 0.5 MPa. Prior to testing it was anticipated that such small confining pressure has hardly any mechanical effect on a relatively strong material like the Olkiluoto migmatitic gneiss. However, Hakala & Heikkilä (1997) have suggested that the Poisson’s ratio is about 30 % lower with a confinement of 0.5 MPa than in real uniaxial tests. The Poisson’s ratio was not affected by an additional increase in the confining pressure (Hakala & Heikkilä 1997). Hence, it is possible that the 0.5 MPa confining pressure may have had a small effect on the measured Poisson’s ratio in our tests.
8
3 TEST RESULTS
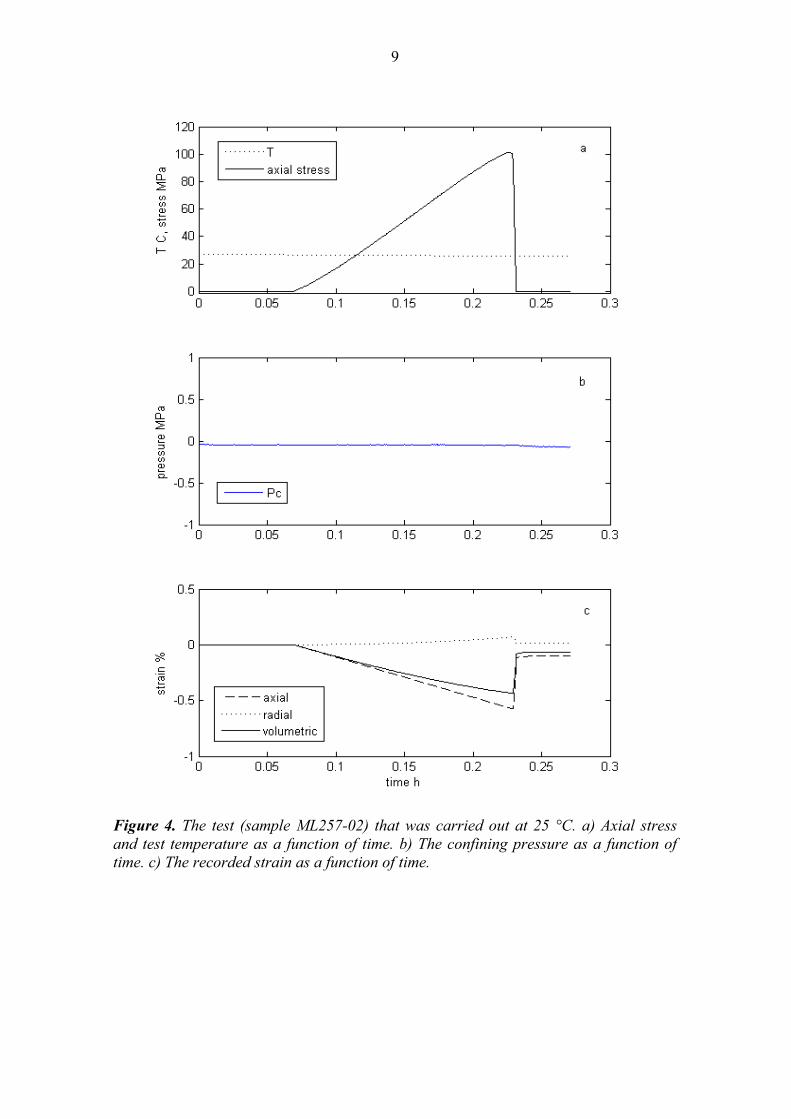
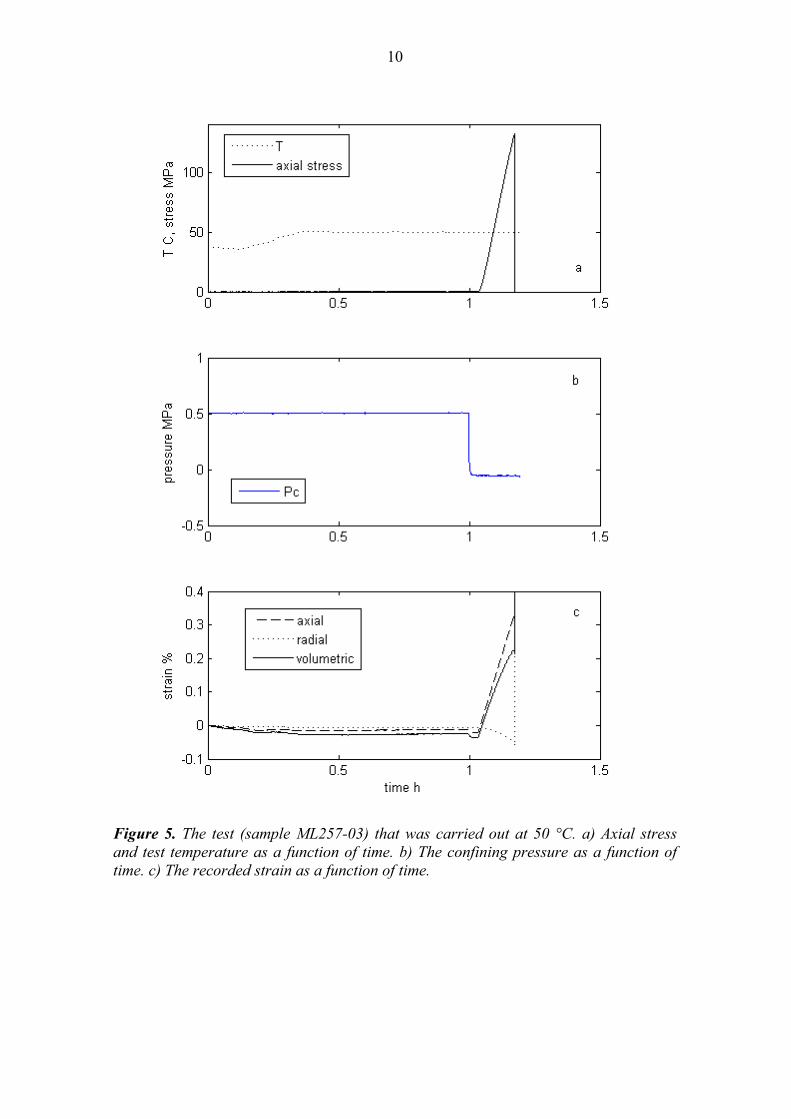
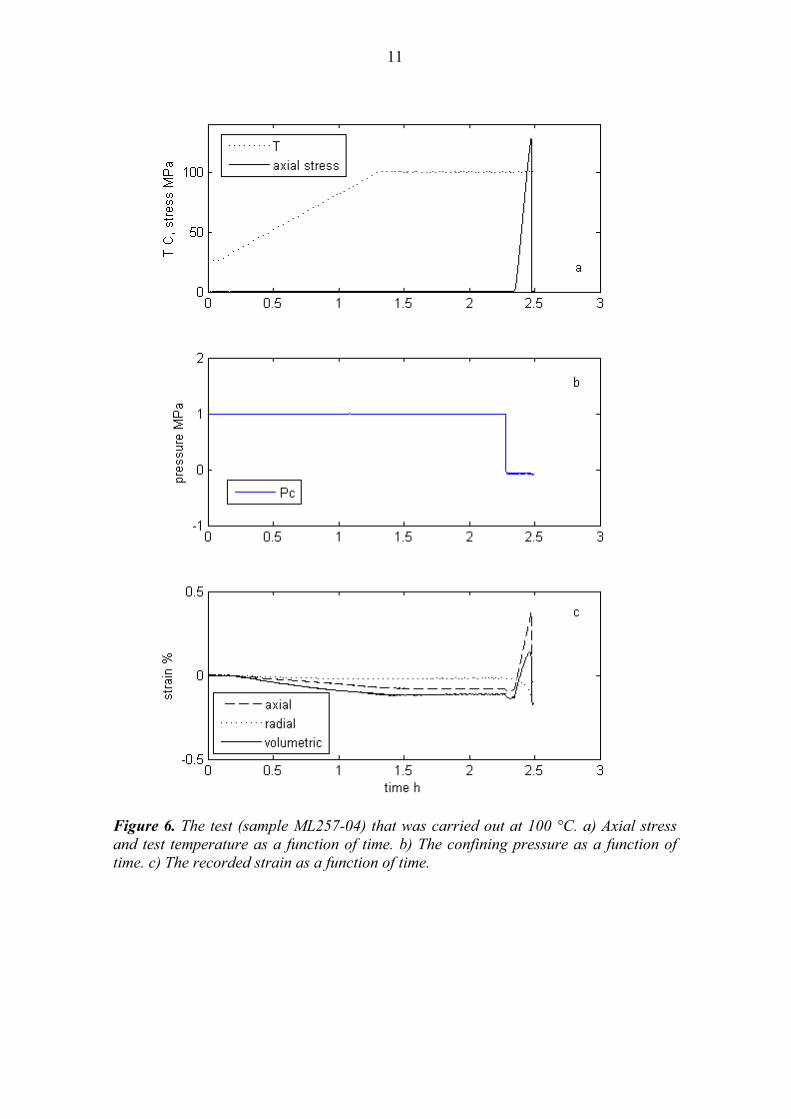
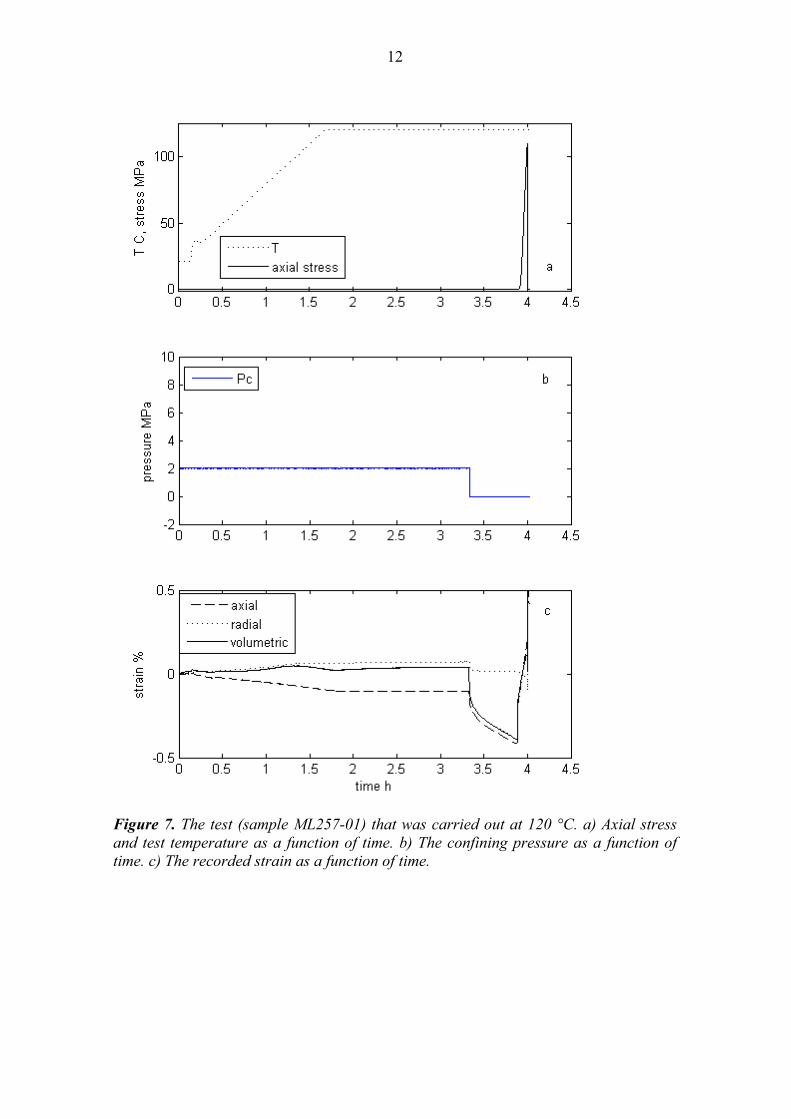
3.1 Introduction The temporal evolution of stress, temperature and confining pressure are illustrated in Figures 4 to 7 for the tests that were carried out at 25, 50, 100 and 120 °C, respectively. Initially, the sample was brought to the required temperature by heating at a constant rate of 1 °C per minute. Subsequently, the specimen temperature was let to stabilize. A small confining load (<2 MPa) was also applied during the initial stage. However, the subsequent loading part of the test was carried out at zero confining pressure in order to mimic a UCS test. The test that was carried out at 25 °C is illustrated in Figure 4. No specific temperature effect was observed for this test as it was carried out in room temperature. During the UCS part of the test the axial load was increased on the sample. The resulting strains were monitored continuously. As the load was increased on the sample the axial strain increased while the radial strain decreased. Hence, we observed compaction in the axial direction and dilation in the radial direction. However, the amount of radial strain was smaller than the strain in the axial direction. The resulting volumetric deformation (strain) was positive. Similar evolution of rock properties were also observed for the 50, 100 and 120 °C tests as shown in Figures 5-7, respectively.
3.2 The initial heating phase The sample deformation during heating is illustrated in Figure 8. Both the radial and axial strain on the sample decrease with increasing temperature. This is due to the thermal expansion of the sample. We observed a concomitant decrease in the axial and radial wave velocities in the sample. However, for the 120 °C test the sample first contracts in the radial direction and subsequently begins to dilate around 100 °C as shown in Figure 9. This could be due to heterogeneities inside the sample or some chemically activated mechanism.
9
Figure 4. The test (sample ML257-02) that was carried out at 25 °C. a) Axial stress and test temperature as a function of time. b) The confining pressure as a function of time. c) The recorded strain as a function of time.
10
Figure 5. The test (sample ML257-03) that was carried out at 50 °C. a) Axial stress and test temperature as a function of time. b) The confining pressure as a function of time. c) The recorded strain as a function of time.
11
Figure 6. The test (sample ML257-04) that was carried out at 100 °C. a) Axial stress and test temperature as a function of time. b) The confining pressure as a function of time. c) The recorded strain as a function of time.
12
Figure 7. The test (sample ML257-01) that was carried out at 120 °C. a) Axial stress and test temperature as a function of time. b) The confining pressure as a function of time. c) The recorded strain as a function of time.

13
Figure 8. The effect of sample heating on the recorded strain data.

14
Figure 9. The strain data from gauges and circumferential chain for test 1 (sample ML257_01).
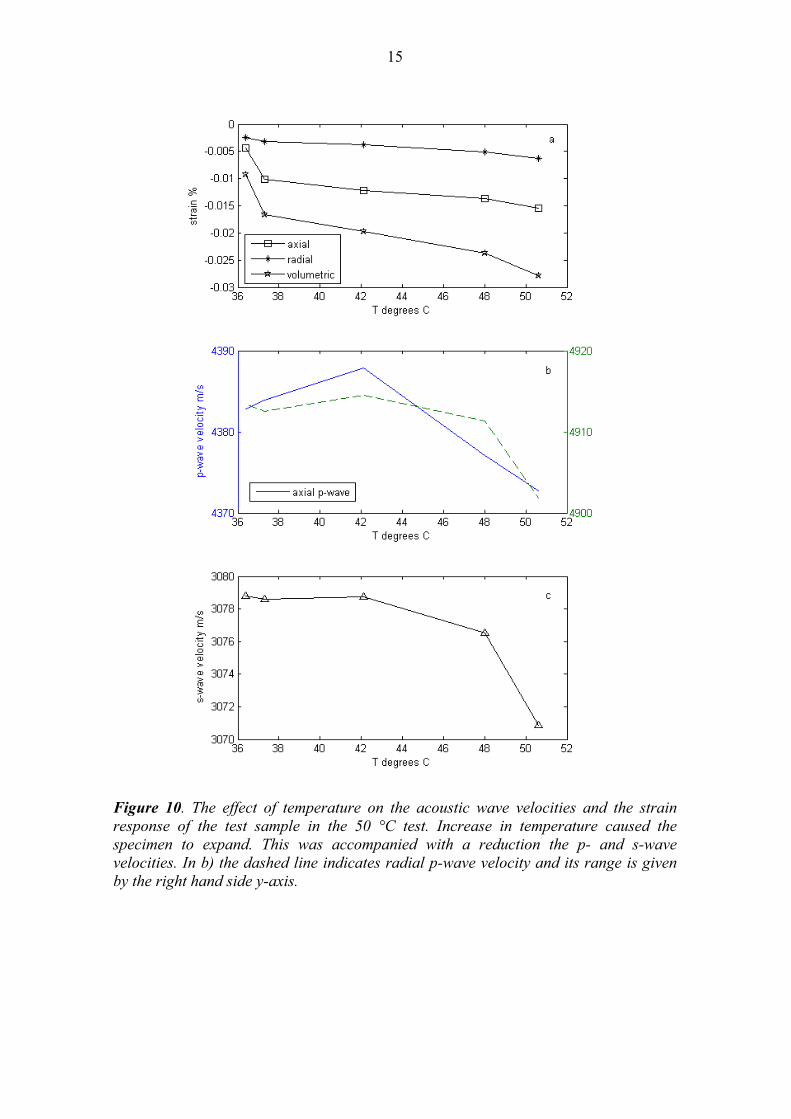
The axial expansion of the sample can be described with a linear relationship between temperature and strain. This property is illustrated in Figure 10 for the test that was carried out at 50 °C. As the temperature is increased to 50 °C the axial, radial and volumetric strains decrease. The sample expansion due to heating is greater in the axial direction than in the axial direction. Both axial and radial p-wave velocities also decrease during heating. We observe a smaller reduction in velocity for the axial s-wave data. These observations suggest that the p-wave velocities are more sensitive to temperature variations than the s-wave velocities. At about 1 % the accuracy of the velocity determination is about the same order as the velocity changes that we observe. However, the systematic decrease with temperature in both p- and s-wave velocities suggests that the wave velocities depend on temperature. This observation is in good agreement with the more general rock physics rule-of-thumb that has been suggested by Wang (2001). He pointed out that seismic properties decrease with increasing temperature. The temperature sensitivity of the wave velocities in Olkiluoto migmatitic gneiss may be an important issue that could be further investigated if field seismic techniques are used for monitoring the storage site.
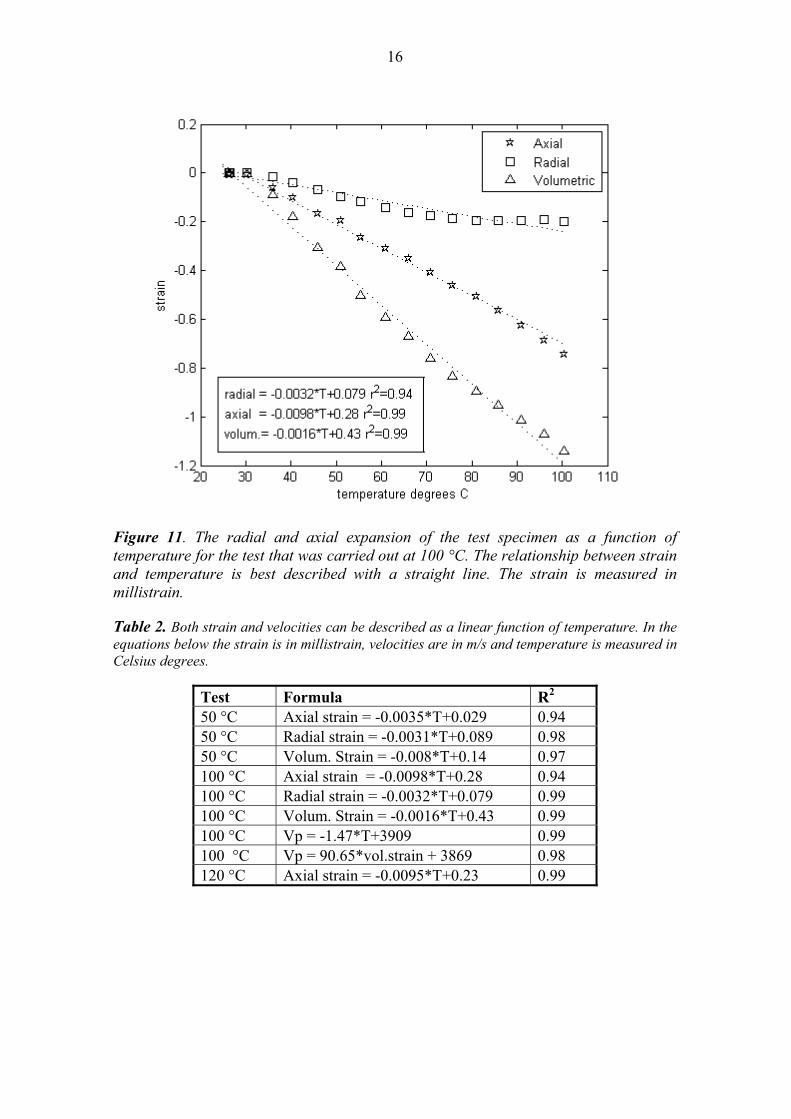
The dependence of strain on temperature is best modeled by a straight line as shown in Figure 11. It illustrates the fashion by which how both axial and radial strains decrease as a linear function of temperature. The equations that relate strains to temperature are listed in Table 2. For the 100 °C test both axial p-wave velocities and the volumetric strain decrease in a similar fashion as a function of temperature. This observation indicates a linear relationship between p-wave velocities and volumetric strain during the heating phase.
15
Figure 10. The effect of temperature on the acoustic wave velocities and the strain response of the test sample in the 50 °C test. Increase in temperature caused the specimen to expand. This was accompanied with a reduction the p- and s-wave velocities. In b) the dashed line indicates radial p-wave velocity and its range is given by the right hand side y-axis.
16
Figure 11. The radial and axial expansion of the test specimen as a function of temperature for the test that was carried out at 100 °C. The relationship between strain and temperature is best described with a straight line. The strain is measured in millistrain.
Table 2. Both strain and velocities can be described as a linear function of temperature. In the equations below the strain is in millistrain, velocities are in m/s and temperature is measured in Celsius degrees.
Test Formula R2 50 °C Axial strain = -0.0035*T+0.029 0.94 50 °C Radial strain = -0.0031*T+0.089 0.98 50 °C Volum. Strain = -0.008*T+0.14 0.97 100 °C Axial strain = -0.0098*T+0.28 0.94 100 °C Radial strain = -0.0032*T+0.079 0.99 100 °C Volum. Strain = -0.0016*T+0.43 0.99 100 °C Vp = -1.47*T+3909 0.99 100 °C Vp = 90.65*vol.strain + 3869 0.98 120 °C Axial strain = -0.0095*T+0.23 0.99
17
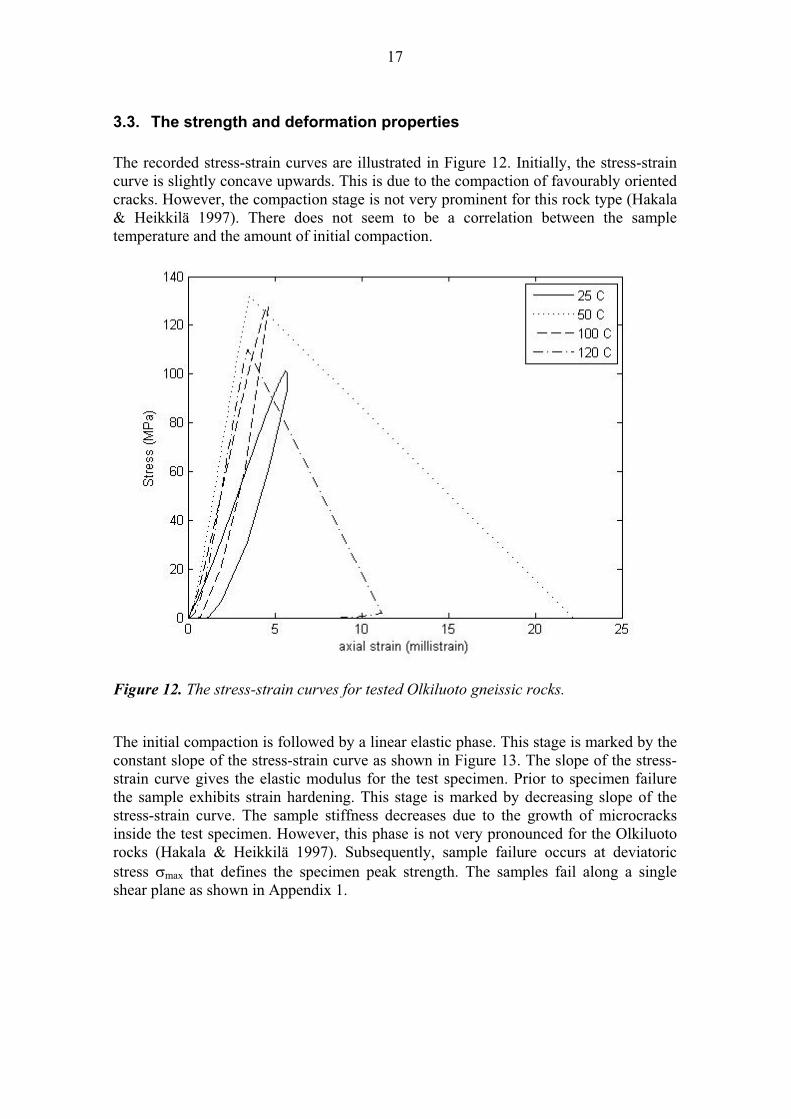
3.3. The strength and deformation properties The recorded stress-strain curves are illustrated in Figure 12. Initially, the stress-strain curve is slightly concave upwards. This is due to the compaction of favourably oriented cracks. However, the compaction stage is not very prominent for this rock type (Hakala & Heikkilä 1997). There does not seem to be a correlation between the sample temperature and the amount of initial compaction.
Figure 12. The stress-strain curves for tested Olkiluoto gneissic rocks.
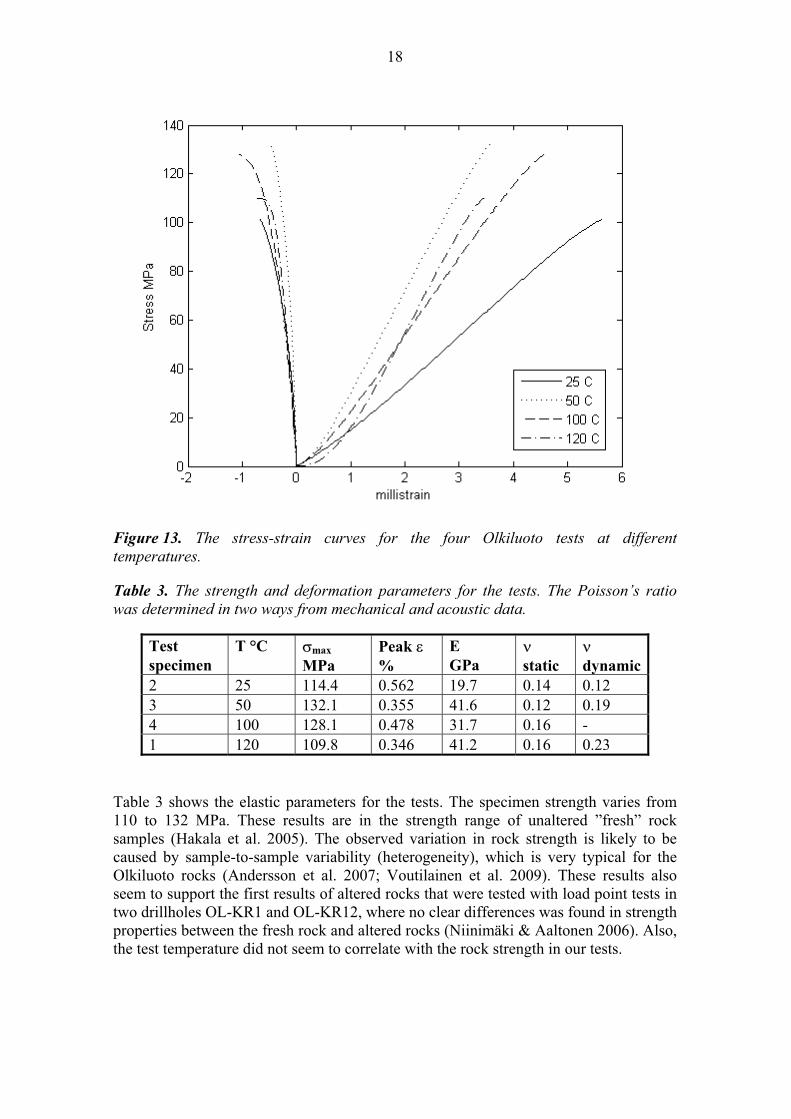
The initial compaction is followed by a linear elastic phase. This stage is marked by the constant slope of the stress-strain curve as shown in Figure 13. The slope of the stress-strain curve gives the elastic modulus for the test specimen. Prior to specimen failure the sample exhibits strain hardening. This stage is marked by decreasing slope of the stress-strain curve. The sample stiffness decreases due to the growth of microcracks inside the test specimen. However, this phase is not very pronounced for the Olkiluoto rocks (Hakala & Heikkilä 1997). Subsequently, sample failure occurs at deviatoric stress �max that defines the specimen peak strength. The samples fail along a single shear plane as shown in Appendix 1.
18
Figure 13. The stress-strain curves for the four Olkiluoto tests at different temperatures.
Table 3. The strength and deformation parameters for the tests. The Poisson’s ratio was determined in two ways from mechanical and acoustic data.
Test specimen
T °C �max MPa
Peak � %
E GPa
� static
� dynamic
2 25 114.4 0.562 19.7 0.14 0.12 3 50 132.1 0.355 41.6 0.12 0.19 4 100 128.1 0.478 31.7 0.16 - 1 120 109.8 0.346 41.2 0.16 0.23
Table 3 shows the elastic parameters for the tests. The specimen strength varies from 110 to 132 MPa. These results are in the strength range of unaltered ”fresh” rock samples (Hakala et al. 2005). The observed variation in rock strength is likely to be caused by sample-to-sample variability (heterogeneity), which is very typical for the Olkiluoto rocks (Andersson et al. 2007; Voutilainen et al. 2009). These results also seem to support the first results of altered rocks that were tested with load point tests in two drillholes OL-KR1 and OL-KR12, where no clear differences was found in strength properties between the fresh rock and altered rocks (Niinimäki & Aaltonen 2006). Also, the test temperature did not seem to correlate with the rock strength in our tests.
19
The axial strain at failure ranged from 0.36 to 0.56 %. There was no correlation between the axial strain at failure and the sample strength. The elastic modulus E was calculated from the linear part of the stress-strain curve. The elastic modulus varied from 19.7 to 41.6 GPa. This range is somewhat less than previously reported values (Andersson et al. 2007; Hakala et al. 2005). They observed that the apparent Young’s modulus of Olkiluoto gneissic fresh rocks ranges from 37 to 95 GPa. It is possible that the lower elastic moduli that were measured in our tests are caused by the alteration processes that have resulted in a relatively soft material in comparison with unaltered rocks. The Poisson’s ratio was determined by using two methods. The negative slope of the recorded radial stress-strain curve was divided by the slope of the axial stress-strain curve in order to obtain the static Poisson’s ratio. The p- and s-wave velocities were utilized for calculating the dynamic Poisson’s ratio from the acoustic data at 50 % peak strength. The static Poisson’s ratio ranged from 0.12 to 0.16 while the dynamic Poisson’s ratio ranged from 0.12 to 0.23. The values that were determined by using the dynamic method were greater than the static ones for samples 1 and 3.
3.4. The p- and s-wave velocities The p- and s-wave velocities were observed to increase as a logarithmic function of axial stress and strain. Figures 14 to 17 illustrate the dependence of acoustic velocities on the applied stress for the 25, 50, 100 and 120 °C tests, respectively. The axial p-wave velocities range from 3213 m/s at 1.63 MPa to 4382 m/s at 97 MPa for the 25 °C test. The radial p-wave velocities are larger than the axial ones. They range from 4053 to 4706 m/s for the same pressure range. The s-wave velocities are less sensitive to stress changes. They vary from 2483 to 2760 m/s. The axial p-wave velocities increase continuously as the load on the sample increases. In contrast, there is very little change in the s-wave velocities in the 87 to 97 MPa range. The s-wave velocities appear to stabilize to 2760 m/s at high stresses close to the sample failure.
Figure 14. The a) p-wave and b) s-wave velocities for the 25 °C test as a function of axial stress.

20
Figure 15 illustrates the evolution of acoustic velocities for the 50 °C test. The p- and s-wave velocities increase with increasing stress in a logarithmic fashion. The axial p-wave velocities vary from 4429 m/s at 2.4 MPa to 5350 m/s at 129 MPa. Hence, the initial velocities are considerable higher for this sample than for the 25 °C. At 132 MPa the sample strength is also greater than the 114 MPa that we measured for the 25 ºC test. The radial p-wave velocities are larger than the axial ones at low stresses. They range from 5031 m/s to 5278 m/s as the axial load increases from 2.4 MPa to 129 MPa, respectively. However, at axial stresses above 49 MPa the axial p-wave velocities are larger than the radial ones. The axial s-wave velocities vary from 3104 m/s at 2.4 MPa to 3240 m/s at 129 MPa. They increase continuously as the load increases to 97 MPa. At axial stresses above 97 MPa the s-wave velocities decrease continuously.
Figure 15. The a) p-wave and b) s-wave velocities for the 50 °C test as a function of axial stress.
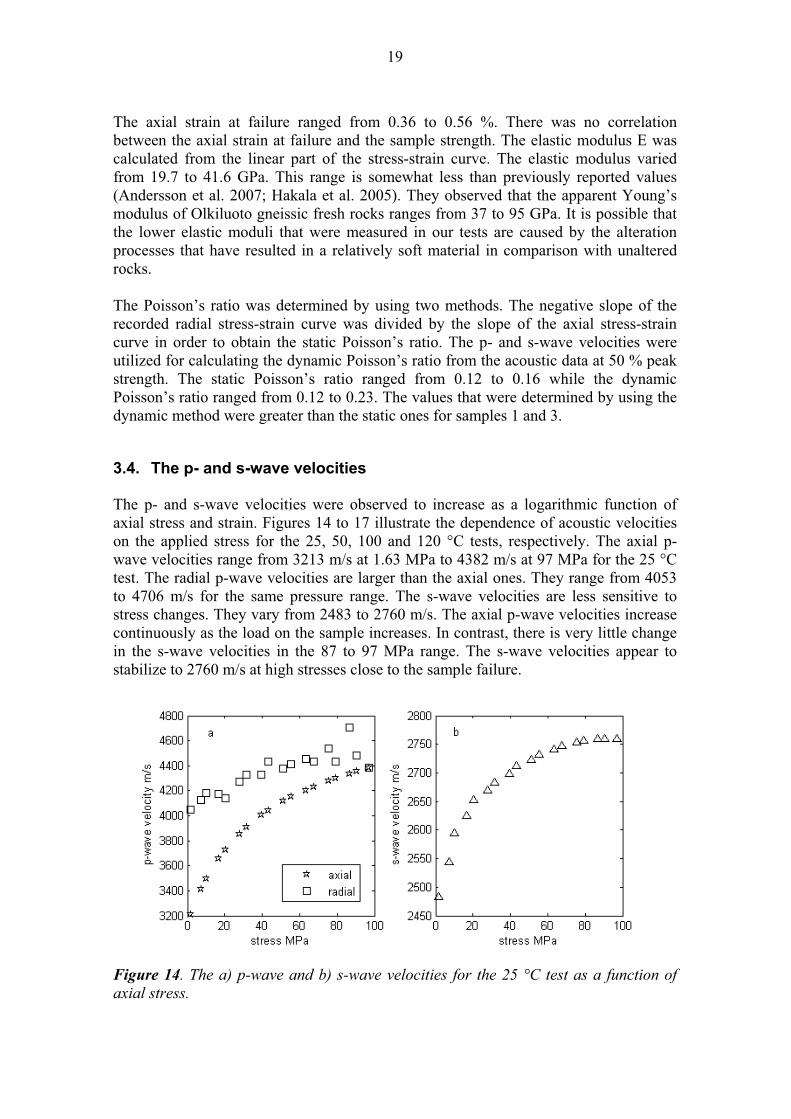
The p-wave velocities for the 100 °C test are shown in Figure 16. We did not measure any s-wave velocities for the 100 °C test due to technical difficulties. Namely, the s-wave transducers that are housed inside the rig platens were damaged during the previous test at 50 °C. This problem was only noticed once the 100 °C test was started. The axial p-wave velocities ranged from 3765 m/s at 1 MPa to 4780 m/s at 100 MPa. The evolution of the p-wave velocities with axial strain is similar to the fashion by which the velocities depend on the axial stress.
21
Figure 16. The a) p-wave for the 100 °C test as a function of a) axial stress and b) axial strain.
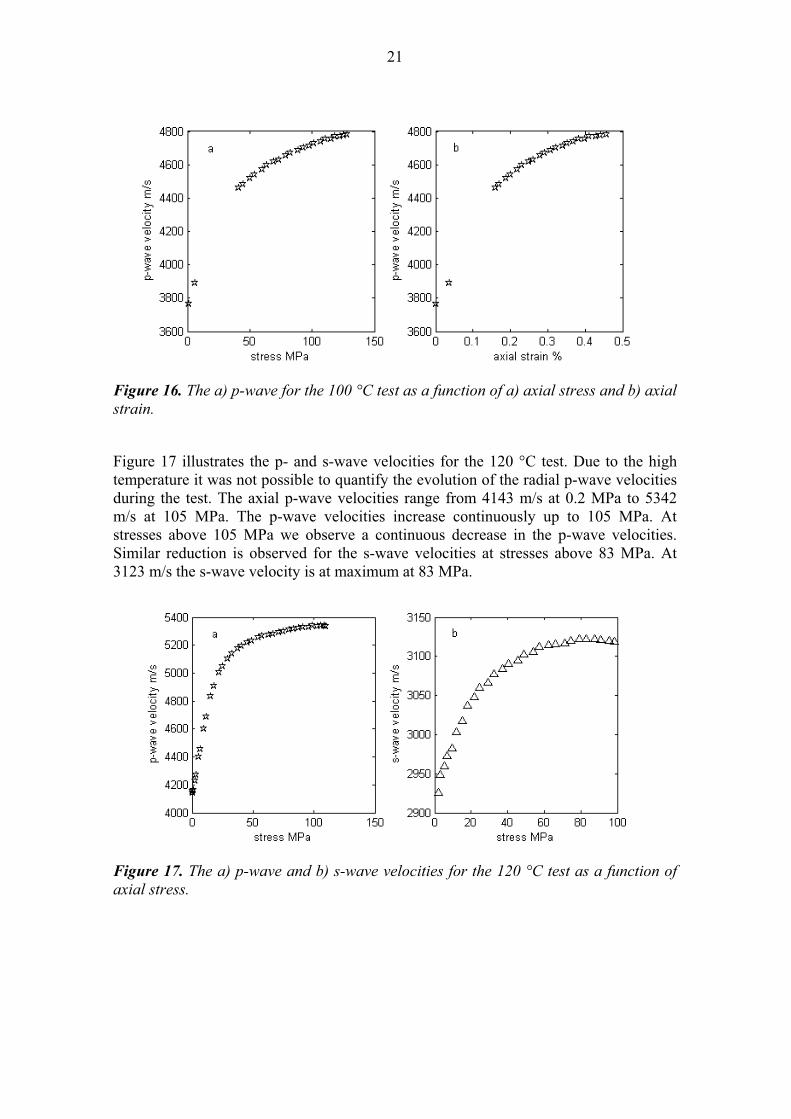
Figure 17 illustrates the p- and s-wave velocities for the 120 °C test. Due to the high temperature it was not possible to quantify the evolution of the radial p-wave velocities during the test. The axial p-wave velocities range from 4143 m/s at 0.2 MPa to 5342 m/s at 105 MPa. The p-wave velocities increase continuously up to 105 MPa. At stresses above 105 MPa we observe a continuous decrease in the p-wave velocities. Similar reduction is observed for the s-wave velocities at stresses above 83 MPa. At 3123 m/s the s-wave velocity is at maximum at 83 MPa.
Figure 17. The a) p-wave and b) s-wave velocities for the 120 °C test as a function of axial stress.
22
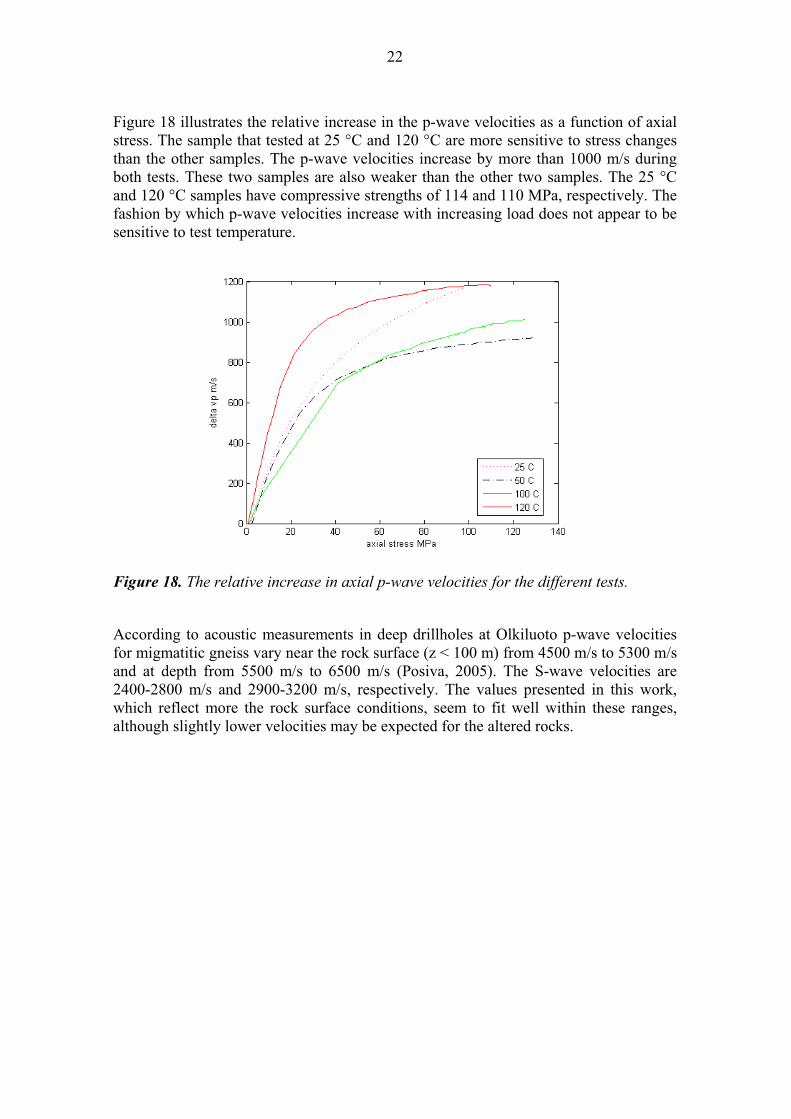
Figure 18 illustrates the relative increase in the p-wave velocities as a function of axial stress. The sample that tested at 25 °C and 120 °C are more sensitive to stress changes than the other samples. The p-wave velocities increase by more than 1000 m/s during both tests. These two samples are also weaker than the other two samples. The 25 °C and 120 °C samples have compressive strengths of 114 and 110 MPa, respectively. The fashion by which p-wave velocities increase with increasing load does not appear to be sensitive to test temperature.
Figure 18. The relative increase in axial p-wave velocities for the different tests.
According to acoustic measurements in deep drillholes at Olkiluoto p-wave velocities for migmatitic gneiss vary near the rock surface (z < 100 m) from 4500 m/s to 5300 m/s and at depth from 5500 m/s to 6500 m/s (Posiva, 2005). The S-wave velocities are 2400-2800 m/s and 2900-3200 m/s, respectively. The values presented in this work, which reflect more the rock surface conditions, seem to fit well within these ranges, although slightly lower velocities may be expected for the altered rocks.
23
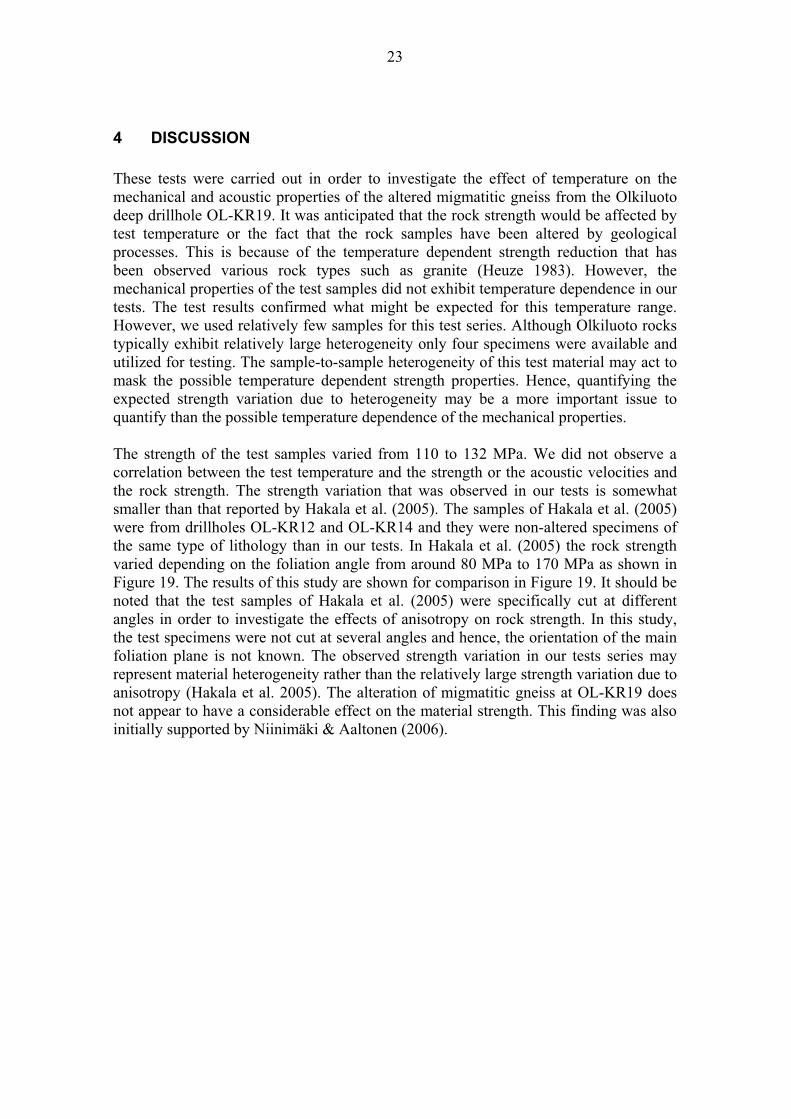
4 DISCUSSION These tests were carried out in order to investigate the effect of temperature on the mechanical and acoustic properties of the altered migmatitic gneiss from the Olkiluoto deep drillhole OL-KR19. It was anticipated that the rock strength would be affected by test temperature or the fact that the rock samples have been altered by geological processes. This is because of the temperature dependent strength reduction that has been observed various rock types such as granite (Heuze 1983). However, the mechanical properties of the test samples did not exhibit temperature dependence in our tests. The test results confirmed what might be expected for this temperature range. However, we used relatively few samples for this test series. Although Olkiluoto rocks typically exhibit relatively large heterogeneity only four specimens were available and utilized for testing. The sample-to-sample heterogeneity of this test material may act to mask the possible temperature dependent strength properties. Hence, quantifying the expected strength variation due to heterogeneity may be a more important issue to quantify than the possible temperature dependence of the mechanical properties. The strength of the test samples varied from 110 to 132 MPa. We did not observe a correlation between the test temperature and the strength or the acoustic velocities and the rock strength. The strength variation that was observed in our tests is somewhat smaller than that reported by Hakala et al. (2005). The samples of Hakala et al. (2005) were from drillholes OL-KR12 and OL-KR14 and they were non-altered specimens of the same type of lithology than in our tests. In Hakala et al. (2005) the rock strength varied depending on the foliation angle from around 80 MPa to 170 MPa as shown in Figure 19. The results of this study are shown for comparison in Figure 19. It should be noted that the test samples of Hakala et al. (2005) were specifically cut at different angles in order to investigate the effects of anisotropy on rock strength. In this study, the test specimens were not cut at several angles and hence, the orientation of the main foliation plane is not known. The observed strength variation in our tests series may represent material heterogeneity rather than the relatively large strength variation due to anisotropy (Hakala et al. 2005). The alteration of migmatitic gneiss at OL-KR19 does not appear to have a considerable effect on the material strength. This finding was also initially supported by Niinimäki & Aaltonen (2006).
24
Figure 19. Rock strength and density for the drillholes OL-KR12 and OL-KR14 from Hakala et al. (2005) and test results from this work (OL-KR19).
Our test results are likely to be affected by anisotropy due to the existence of a major foliation plane in the rock specimens. Indeed, the large differences between the axial and radial wave velocities suggest that the rock properties are anisotropic. Laboratory tests at oriented cores have confirmed that the Olkiluoto gneissic rocks exhibit anisotropy (Hakala et al. 2005). However, it was beyond the scope of this study to carry out a detailed investigation of the foliation plane and its effect on rock properties. The identification of the main foliation plane and its spatial coordinates requires the preparation of oriented cores or thin sections. Subsequently, the resulting acoustic anisotropy can be determined by carrying out wave velocity measurements in the axial direction of several oriented cores. The effects of anisotropy on mechanical or fluid flow properties can also be determined by carrying out laboratory measurements on oriented cores. Alternatively, the anisotropy of physical properties can be investigated by point counting on photographs of thin sections of rocks that are taken under the microscope. However, if we had used the available core for the preparation of smaller oriented rock cores, it would have not been possible to perform compressive loading tests on the same core samples. The material supplied for this test series was used for rock mechanical testing instead of carrying out a detailed study in the magnitude of anisotropy in the rock samples. To sum up, there are two possible explanations for the strength variation that was observed in this test series. Rock strength may vary due to sample-to-sample variability or because of the anisotropy of rock properties. It may also have been caused by the

25
combination of both effects. Figure 19 illustrates how the strength variation in our tests lies in the expected range for this rock type. However, there were only four samples in this test series. It is anticipated that the effects of alteration will be studied in the future by using a larger number of samples. Such procedure would ensure that there is enough statistical variation in the test results to account for the natural variability of rock strength that is caused by material heterogeneity (Voutilainen et al. 2009).

26
5 CONCLUSION This study was performed in order to investigate the effect of temperature and alteration on the mechanical and acoustic properties of the altered gneiss from the Olkiluoto area. We carried out a series of rock deformation tests at different test temperatures (25-120 °C). During the initial heating phase the strain and p-wave velocities were linearly correlated with the sample temperature. In the subsequent loading phase the p- and s-wave velocities increased in a logarithmic fashion as a function of axial stress or strain. The strength of the altered migmatitic gneiss varied from 110 MPa to 132 MPa which lies in the previously reported strength range for the “fresh” material. It also confirms previous test results for the altered rocks. The p- and s-wave velocities were in the range of previously measured velocities from the deep drillholes. Alteration does not appear to reduce the rock strength in our tests. Similarly, the initial bulk density and acoustic wave velocities did not correlate with rock strength. Furthermore, the specimen strength did not correlate with the test temperature. While the mechanical properties of this material may be temperature dependent, such a correlation may not be straightforward to measure due to the large sample-to-sample variability. Another possible reason for the observed strength variation is the anisotropy of rock properties. The measured radial p-wave velocities were consistently higher in than the axial p-wave velocities in our tests. This observation tells that the rock specimens exhibit velocity anisotropy.
27
REFERENCES Andersson, J., Ahokas, H., Hudson, J. A., Koskinen, L., Luukkonen, A., Löfman, J., Keto, V., Pitkänen, P., Mattila, J., Ikonen, A. & Ylä-Mella, M. 2007. Olkiluoto Site Description 2006. Posiva Oy, POSIVA Report 2007-03. Batzle, M., Hofmann, R., Han, D.-H., Castagna, J. 2001. Fluids and frequency dependent seismic velocity of rocks, The Leading Edge, February, 2001. Birch, F. 1960. The velocity of compressional waves in rocks to 10 kilobars, 1. J. Geophys. Res., 65, 1083-1102. Fairhurst, C. E. & Hudson, J. A. 1999. Draft ISRM suggested method for the complete stress-strain curve for intact rock in uniaxial compression, Int. J. Rock Mech. Min. Sci., 36, 279-289. Front, K. & Paananen, M. 2006. Hydrothermal alteration at Olkiluoto: Mapping of drill core samples. Posiva Oy, Posiva Working Report 2006-59. Guillaume,D., Neaman, A., Cathelineau, M., Mosser-ruck, R., Peiffert, C., Abdelmoula, M., Dubessy, J., Villieras, F., Baronnet, A. & Michau, N. 2003. Experimental synthesis of chlorite from smectite at 300 ºC in the presence of metallic Fe, Clay minerals, 38, 281-302. Hakala, M. & Heikkilä, E. 1997. Laboratory testing of Olkiluoto mica gneiss in borehole OL-KR10. Posiva Oy, Work report POSIVA-97-07e. Hakala, M., Kuula, H. & Hudson, J. 2005. Strength and strain anisotropy of Olkiluoto mica gneiss. Posiva Oy, Posiva Working Report 2005-61. Heuze, F. E. 1983. High temperature mechanical, physical and thermal properties of granitic rocks, Int. J. Rock Mech Min Sci. & Geomech. Abst., 20, 3-10. Hunsche, U., Walter, F. & Schnier, H. 2004. Evolution and failure of the Opalinus clay: relationship between deformation and damage, experimental results and constitutive equation, Applied Clay science, 26, 403-411. Ikonen, K. 2007. Far-field thermal-mechanical response of one- and two-storey repositories in Olkiluoto. Posiva Oy, Posiva Working Report 2007-29. Jaeger, J. C. & Cook, N. G. W. 1969. Fundamentals of rock mechanics, Chapman & Hall. Juhlin, C., Cosma, C. 2007. A 3D surface seismic pilot study at Olkiluoto, Finland: Acquisition and processing report, Posiva Oy, Posiva Working Report 2007-65. Lawn, B. 1993. Fracture of brittle solids, Cambridge Univ. Press.

28
Niinimäki, R. & Aaltonen, I. 2006. Rock mechanical tests of deep drillholes OL-KR1 and OL-KR12 at Olkiluoto 2006. Posiva Oy, Posiva Working Report 2006-106. Paterson, M. S. 1978. Experimental rock deformation – the brittle field. Springer Verlag, New York. Posiva Oy, 2005. Olkiluoto Site Description 2004. Posiva Oy, POSIVA Report 2005-03. Saari, J. & Lakio, A. 2009. Feasibility study and technical proposal for seismic monitoring of tunnel boring machine in Olkiluoto. Posiva Oy, 24 p. Posiva Working Report 2009-03. Voutilainen, M., Myllys, M., Timonen, J. 2009. Structural and transport properties of illitized samples from drillhole OL-KR12 in Olkiluoto: Porosity, diffucion coefficient, permeability and tomographic imaging, Posiva Oy, Posiva Working Report 2009-80. Wang, Z. 2001. Fundamentals of seismic rock physics, Geophysics, 66, 398-412.
29
APPENDIX A
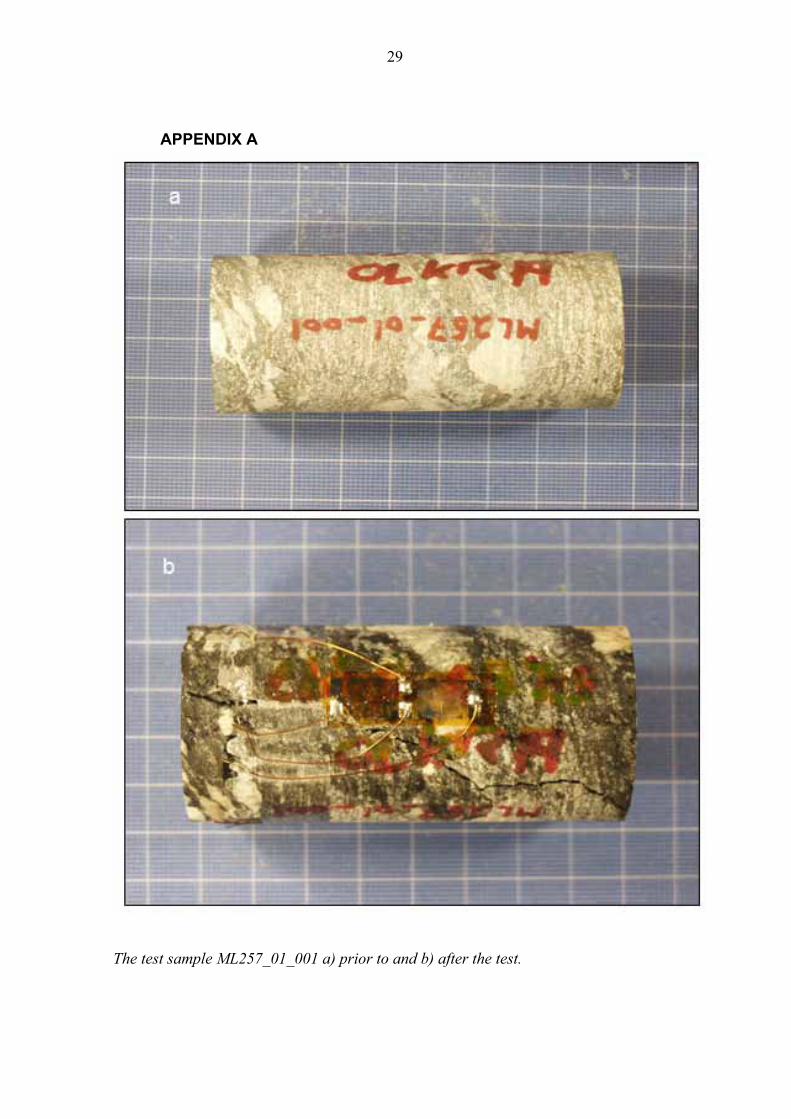
The test sample ML257_01_001 a) prior to and b) after the test.
30
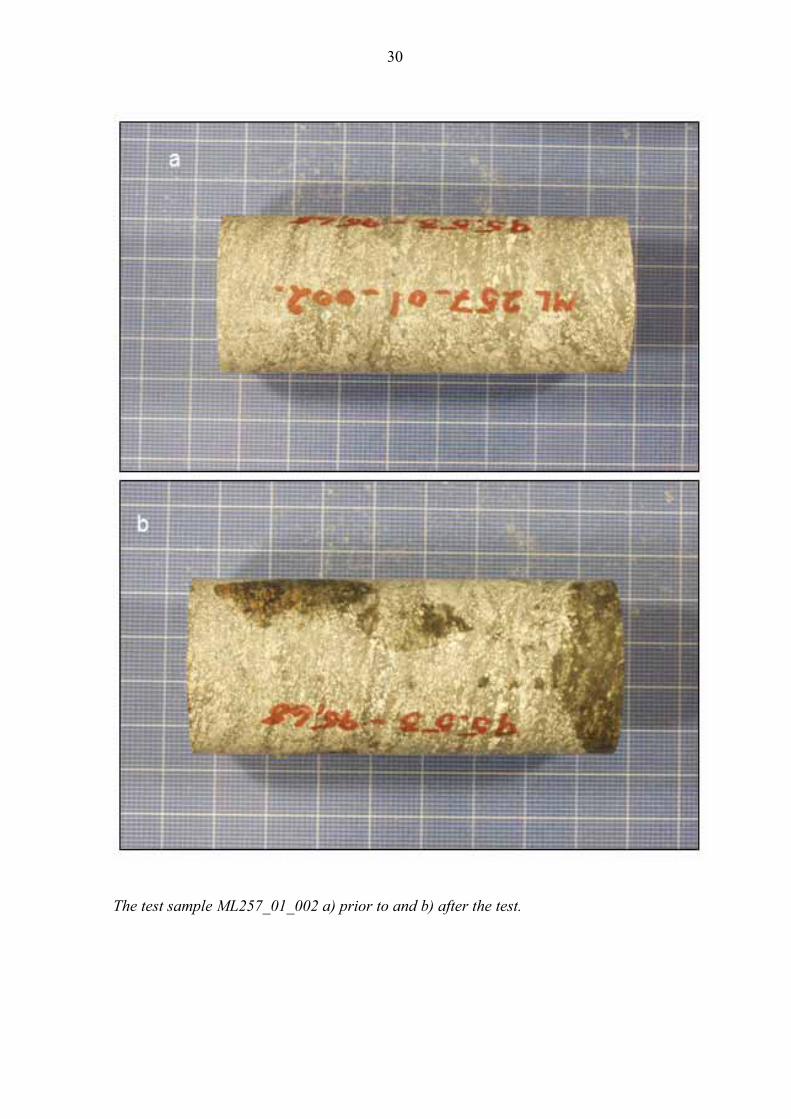
The test sample ML257_01_002 a) prior to and b) after the test.

31
The test sample ML257_01_003 a) prior to and b) after the test.
32
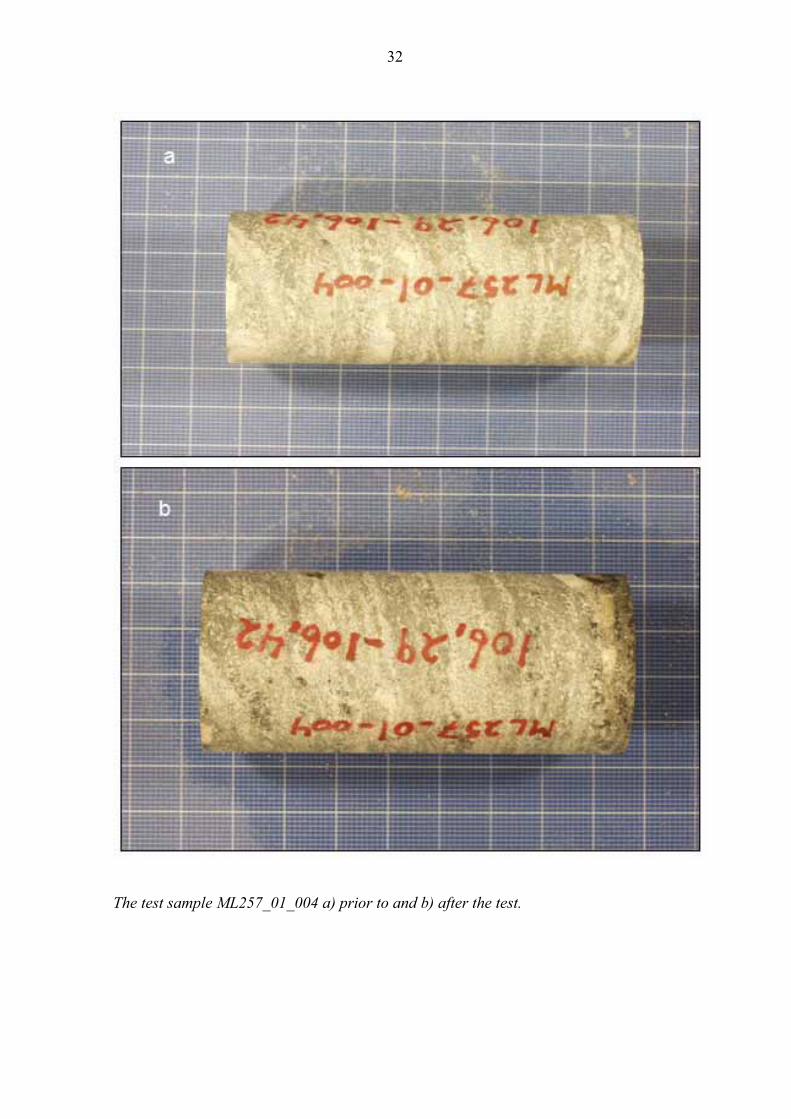
The test sample ML257_01_004 a) prior to and b) after the test.