Embed Size (px)
Citation preview

Engineering Conferences InternationalECI Digital ArchivesInternational Workshop on the EnvironmentalDamage in Structural Materials Under Static Load/Cyclic Loads at Ambient Temperatures
Proceedings
6-1-2016
Mechanical & chemical driving force affectingcrack nucleationK. SadanandTDA,Inc, Falls Church, VA,USA, [email protected]
Asuri K. VasudevanRetired,Navy, Reston, VA , USA, [email protected]
Follow this and additional works at: http://dc.engconfintl.org/edsm
Part of the Engineering Commons
This Abstract and Presentation is brought to you for free and open access by the Proceedings at ECI Digital Archives. It has been accepted for inclusionin International Workshop on the Environmental Damage in Structural Materials Under Static Load/Cyclic Loads at Ambient Temperatures by anauthorized administrator of ECI Digital Archives. For more information, please contact [email protected].
Recommended CitationK. Sadanand and Asuri K. Vasudevan, "Mechanical & chemical driving force affecting crack nucleation" in "International Workshop onthe Environmental Damage in Structural Materials Under Static Load/Cyclic Loads at Ambient Temperatures", A.K. Vasudevan,Office of Naval Research (retired), USA Ronald Latanision, Exponent, Inc., USA Henry Holroyd, Luxfer, Inc. (retired) Neville Moody,Sandia National Laboratories, USA Eds, ECI Symposium Series, (2016). http://dc.engconfintl.org/edsm/15

SUBCRITICAL CRACK GROWTH AND
CRACK TIP DRIVING FORCES
K. Sadananda, A.K. Vasudevan,
TDA,Inc.,Falls Church, VA
&
K.N. Solanki
School for Engineering of Matter, Transport, and Energy, Arizona
State University, Tempe, AZ

1. Examination of Some Basic Concepts
2. Discreet Dislocation Modelling
&
3. Some Applications to
Notches, Short Cracks

A Simplified Method to Quantify Chemical Forces
Cyclic
Thresholds
σmax,th
Δσth
σmax
Δσ NF1
σth
Conc
Saturation
Threshold
Inert
dσth/dc
Static Load –
Inert Environment
Cyclic Loads
Inert Environment
Static Load –
Aggressive Environment
Cyclic Loads
Aggressive Environment
Time/Cycles
Str
ess
/
Lo
ad
Thresholds
C1
C1
KIC
KISCC
Chemical
force
Force-
cyclic-
strain
Reduction in
Mechanical Force

Fatigue: 2-Load Parameters Required
3-D reduced to 2D by taking cuts at constant da/dN(s).
R - is not a load-parameter – No threshold in R.
da/dN
Or
da/dt
ΔK or Kmax
A B C D E
A – Inert Environment-
negligible R effects
B –Static Load – Creep-SCC
C – Low R- Air-Cyclic
D-High R- Air Cyclic
E- Low R-Corrosion Fatigue
da/dN1
da/dN2
R3 R2 R1
da/d
N
da/dN = f(ΔK,Kmax)
For a given
Crack growth
rate
R= const.
is a plane

Crack Tip Driving Force
Force = (-ve) Potential Energy Gradient with respect to
Crack length increment = (– dE/dX)

Crack-tip Driving Forces
Elastic Crack - Griffith condition, Fσ ≥ FR-material (gamma) Rc
σ
Rc
ET
γInert
γCh
σ= const.
σ 0
Cases 1 and 2 – constant stress
Case 3 – large stress gradient
Case 4 – Decreasing & increasing
stress gradient.
Internal Stresses & Gradients
**Crack nucleation and growth
require stress magnitude and
Gradient**
Lo
g σ
Log R
Griffith’s Stress
Stress
Gradient
Chemical
Force
σ= √{2Eγ/(1-ν2)πR)}
Non-Propagating
Cracks
Lo
g σ
Log R
1
2
3
4 Internal Stresses
Application
Kitagawa

ET
Rc
Inert
Env
Log σ
Log R
Inert Env
Stress Gradients
Chemical Force
Non-Propagating
Cracks
ET
Continuous
Plastic-Elastic
Cracks
Elastic
g2 < g1 g1
a
Elastic-Plastic Crack
BCS model
T
T
T
T
T
Continuous Elastic-Plastic Crack
ac
(d)
αc depends on gamma

Elastic case:Gc = (π σapl a)/E, and σapl = {2Eγ/πa}0.5 ..(1)
Elastic-Plastic Case G ≥ 2γ + P ------- (2).
Under some limiting Conditions; G – P ≥ 2γ ------ (3),
P, is reinterpreted not as dissipating energy term but as a contributing factor to
the net mechanical driving force needed to overcome the material resistance.
Ref: J.R. Rice,, J. Appl. Mech. 1961, Vol. 23, PP. 544-50
e) Chemical Stress concentration factor: Kch = σsmooth/σnotch ≥ 1 ----- (9),
Some generalization of the crack tip driving forces
---------------
K2/E’ ≥ 2 γ + P ------ (4) and
K2/E’ – P ≥ 2γ ----- (5), Kapl - KInt ≥ (γ) or Kth --------- (6)
Kapl ± KInt ≥ Kth -------- (7)
{Kapl ± KInt ± Kch} ≥ Kth -------- (8)
Linear Approximation – small scale plasticity

How far These Linear Approximations
Are valid for Crack Nucleation and Growth
in Engineering Materials?

y-
Normalized Kitagawa-TakahashiDiagram
0.1
1
10-2 10-1 100 101 102
S20c-366- Tanaka,1981
S20C-194-Tanaka,1981
MildSteel-289-Frost,1959
G40-11 - -Haddad,1979
SM41- 251- Ohuchida,1975
SM41-251-Usami,1979
SM50-373-Kitagawa,1976
HT80-726-Kitagawa,1979
13Cr-castSteel-760-Usami,1979
13Cr-castSteel-769-Usami,1979
Copper- - Frost,1963
Al- 30.4-Frost,1964
Relative Crack Length a/a*
Reploted from K. Tanaka, Y. Nakai and M. Yamashita, Int. J. Fatigue, Vol. 17, 1981, pp. 519-533.
Slope 0.5

0.01
0.1
1
10
100
0.001 0.01 0.1 1 10 100 1000 104
R = 0.8
R = 0
R = 0.5
R = -1.0
R elative crack length a/a*c
13Cr - Steel
Data from Usami 1987
Inc lu sion size
Cas tin gpo ro sity
Internal Stress

Consideration of Elastic-Plastic Cracks

Discrete Dislocation Models
Ref. I. Adlakha, K. Sadananda, K.N.
Solanki -Discrete dislocation modeling
of stress corrosion cracking in an iron –
From Vehoff and Rothe, 1983

αc depends on gamma
ET
Continuous
Plastic-Elastic
Cracks
Elastic
g2 < g1 g1
a
a
T
T T
Ductile extension
T
T
T
T
a + da Brittle extension
Initial Crack y
(a)
(b) (c)
T
T
T
T
T
Continuous Plastic-Elastic Crack
ac
(d) (e)
Discrete Dislocation Model

al stress
T
T
T
T
T a
c
(d)
Notice Log-Log coordinates

T
T
T
T
T
Continuous Elastic-Plastic Crack
ac
(d)
Crack Grows by Alternating glide and cleavage

HOW DO I APPLY THESE CONCEPTS
FOR ENGINEERING APPLICATIONS?

Application to Sub-Critical Crack Growth
with thresholds and overload fracture
Engineering Problem –
Diagnostics and Prognostics
a)Fatigue Crack Growth
b)Stress-Corrosion Crack Growth
c)Corrosion-Fatigue Crack Growth
Use of Failure Diagram

ac
∆σ = ∆Kth /{y(πa)0.5}
Log
(∆σ)
Log(Crack length)
∆σe
Non-Propagating
Cracks
Original Kitagawa-Takahashi
Diagram
Experimental
Data and curve
Application to Fatigue
Notice Log-Log Coordinates
Our explanation in the short
Crack regime differs from
Conventional explanation.

Internal Stress
σIN
σmax,e.
Log (cl)
Lo
g (
σ)
A
B
C
D
a*
E σf
σ = Kmax,th /{y(πa)0.5}
σ = KIC /{y(πa)0.5}
Non-Propagating
Cracks
Modified Kitagawa-
Takahashi Diagram
Crack Growth at
Constant σ
a
c Concept of Internal Stress
Two factors: Maximum Stress and Gradient.
Nucleation and Propagation
KF ≤ Kt
Fatigue Stress
Con. Factor
σNf – Smooth
σNf - Notch =

10
100
1000
10-4 10-3 10-2 10-1 100 101 102
Kitagawa Diagam for
various initial defect-sizes
and Yield Strengths
Defect Depth, mm
1000 MPa
500 MPa
250 MPa
113 MPa
Yield Stress
Usami, 1981
Usami S. In: Blacklund I, Bloom A, Beevers CJ, editors. Symposium
on fatigue threshold. Stockholm, Sweden: EMAS; 1981. p. 205-38.
Internal
Stress
contribution.
Generalization of Kitagawa Diagram
Non-Propagating Cracks
INTERNAL STRESSES
ACCUMULATE BY LOCALISED
PLASTICITY

Short Crack is Long Crack which is Short!
Application to Short-Crack Problem

Overload
Underload
Short
cracks
Long
Crack
DK
da/d
N
DKint
crack
arrest
dl
Perturbations from
Long Crack Growth
da/dN1
Deviations from Long crack growth Behavior
All Deviations arise due to Local Internal Stresses
10-9
10-8
10-7
10-6
10-5
1 10
Ti-6Al-4V
D MPa(m)0.5
Long Crack
Data collected by Airforce
Microstructurally
Short Cracks
1
2
3
4
5
Crack tip driving forces are defined for a given crack growth rate, da/dN

Crack growth is insured only when total force (applied + internal) exceeds the
material crack growth resistance in a given environment – expressed as thresholds
101
102
103
10-5
10-4
10-3
10-2
10-1
Ti-6Al-4V
Crack Length, mm
Threshold K
Curve
Modified Kitagawa Diagram
Crack Growth
Regime
Microstructually
short cracks
Localized
Internal Stress
Regime
e Endurance
Crack Growth Under
Remote Stress
KAppl
+KInt.S
> = Kth

10-12
10-11
10-10
10-9
10-8
10-7
10-6
10-5
10-4
1 10 100
da/d
N,
m/c
ycle
D MPa(m)0.5
Al-2024 T3Long and Short Crack Data
Smax
= 105 MPa
R = -1
80 MPa
70 MPa
60 MPa
Long Crack
Data Collected by Newman

101
102
0.0001 0.001 0.01
Short Crack to Long Crack
Crack Length, m
e,max
70 MPa
60 MPa
Short Crack Growth
Long Crack Growth
Internal Stress
Regime
Long Crack
Threshold
Merging with Long Crack
ac
Al 2024-T3R = -1
Crack
Arrest

Application to Corrosion & Corrosion Fatigue
Refs.
1. K. Sadananda and A.K. Vasudevan, Review of
Environmentally Assisted Cracking, Met. Trans.A,
42A, pp. 279-295, 2011
2. K. Sadananda and A.K. Vasudevan, Failure Diagram
for Chemically Assisted Cracking, Met. Trans. A, 42A,
pp. 296-303, 2011
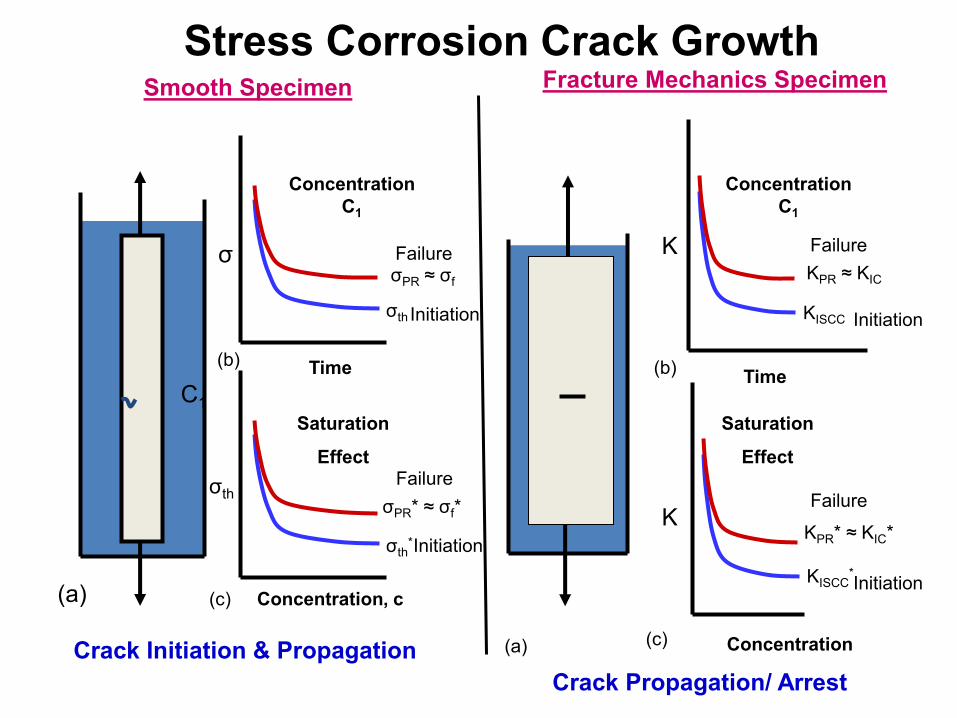
Initiation
C1
(a)
σ
Time
σth
σPR ≈ σf
Concentration
C1
(b)
Initiation
Failure
σth
Concentration, c
σth*
σPR* ≈ σf*
Saturation
Effect
(c)
Failure
Smooth Specimen
Crack Initiation & Propagation
K
Time
KISCC
KPR ≈ KIC
Concentration
C1
(b)
Initiation
Failure
K
Concentration
KISCC*
KPR* ≈ KIC*
Saturation
Effect
(c)
Initiation
Failure
(a)
Fracture Mechanics Specimen
Crack Propagation/ Arrest
Stress Corrosion Crack Growth

σ
Time
Concentration
C1
(b)
Kt1
Kt2
Changing ρ
and/or Kt
σ
Kt
σPR
σIN
Non-Propagating
Cracks
No-cracks (c) (a)
Behavior of a Notched Specimen with Non-propagating Cracks

Defining a new concept – Mechanical Equivalent of Chemical Internal Stress
σth*
Log (Crack Length)
Log
(S
tre
ss)
σPR*
σf*
Internal stress
Non-Propagating
Cracks
c1
KISCC/{√(πa)}
KIC/{√(πa)
Failure Diagram
A
B
C D
cS
σth ac
Long crack threshold is steady-state
property of the material/environment.
Deviations are due to fluctuating local
Forces.
Diagram demonstrates that chemical force acts similar to Mechanical force.
σth = Threshold for smooth specimen for concentration C1
σth* = Saturation Threshold for given chemical Environment.
Failure Diagram for Stress – Corrosion
σth-Smooth
σth-Notch KCH
Chemical Str.Con
Factor KCH =
For any Kt
σ th
Concentration
CS σth*
σinert
σch
σ
t
σth C1
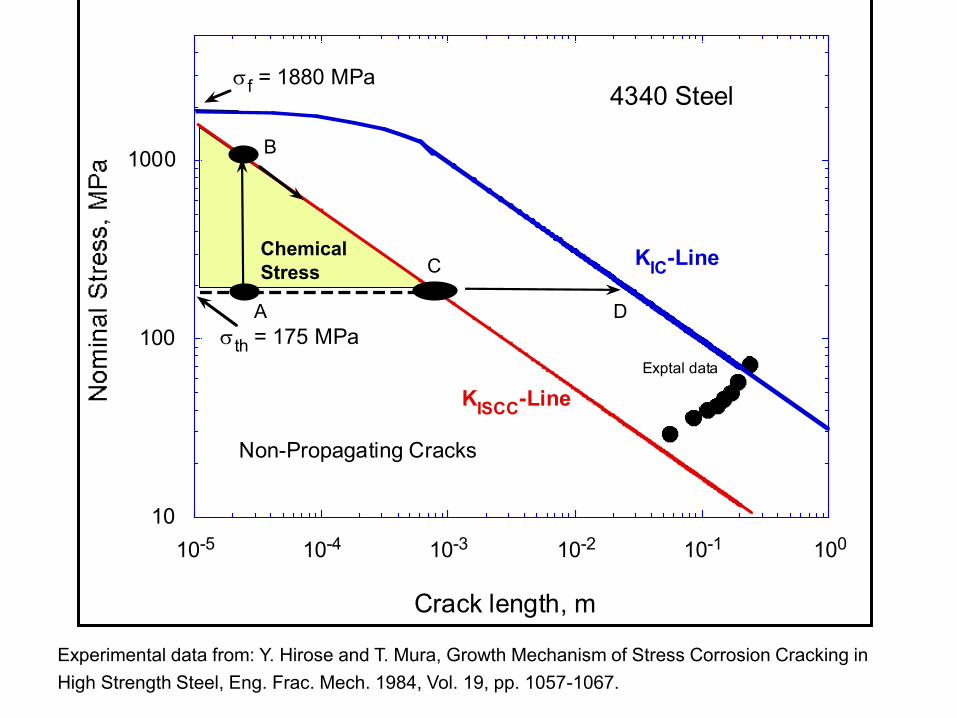
10
100
1000
10-5 10-4 10-3 10-2 10-1 100
Crack length, m
4340 Steel
Exptal data
KIC
-Line
KISCC
-Line
Non-Propagating Cracks
f = 1880 MPa
th = 175 MPa
Chemical
Stress
A
B
C
D
Experimental data from: Y. Hirose and T. Mura, Growth Mechanism of Stress Corrosion Cracking in
High Strength Steel, Eng. Frac. Mech. 1984, Vol. 19, pp. 1057-1067.

Critical Experiments are needed to evaluate
The crack initiation at sharp notches under
Stress Corrosion.
Transition from Corrosion Pit to Fatigue crack
Pit Growth Kinetics to Crack Growth Kinetics

101
102
103
100
101
102
103
104
Pit to Fatigue Crack (X10-6
meters)
Kitagawa Diagram
Transition from Pit to Fatigue Crack
10 Hz1 Hz
Data extracted
from Genkin, 1996
R=0.05
1M NaCl - 660mV
Pit-sizes Measured
from Fracture Surfaces
Size depends on
Frequency and Stress
J.M. Genkin, Ph.D. Thesis - MIT, 1996 -"Corrosion Fatigue Crack Initiation in 2091-T351 Alclad".
Chemical &
Mechanical
forces
1Hz 1 Hz 10 Hz
Pit to Crack

0
5
10
15
10-1
100
101
102
103
104
105
Pressure (H2) - Pa
343 K
313 KVehoff & Rothe, 1983
Fe-3%Si
aN= cot(a)
Crack Grows at a constant α for a given H. 2. Cot(α) reaches
a plateau with H
Effect of Hydrogen Pressure
α
Γ depends on H

Analysis of Crack Nucleation of ahead of a notch
Using Discrete Dislocation modelling

Summary and Conclusion
1. Crack tip driving forces are defined based on simple thermodynamic
Principles for elastic and elastic-plastic crack growth.
2. Internal stresses and stress gradients are required for both crack
Initiation and propagation.
3. Propagating and non-propagating conditions are defined
4. Kitagawa-Takahashi diagram is modified to include internal stresses
And their gradients to define crack growth or crack arrest conditions.
5. Mechanical equivalent of Chemical driving forces are defined that
Augment applied stresses in initiation and propagation.
6. Chemical stress concentration and stress intensity can be defined
Using crack growth behavior in inert conditions as reference.

THE END

R-ratio effects are intrinsic to Fatigue – Kitagawa Diagram
S-N Fatigue
•Two load-parameter Requirement (a) σmax & ∆σ – for S-N
(b) Kmax & ∆K – for Crack
Growth LEFM
(c) Cyclic Plasticity Governs
∆σ
NF
R
∆σe
UTS
∆σe
σmax,e
NF
107 cycles
∆σe*
σmax,e* σmax,e* > ∆σe*
Two Endurance limits
σ
time
Kmax,th*
∆K
Two Limiting Thresholds
da/dN
∆Kth
*
Kmax
Threshold
Kmax,th*> ∆Kth*
Fatigue Crack Growth
R
da/d
N
∆K
∆K*
Kmax*
A
B
C A
B C
AB = AC + CB
Kma
x
Same crack growth rates form a
basis to determine crack tip driving forces
Crack Growth
Trajectory

0
200
400
600
800
1000
1200
200 400 600 800 1000 1200 1400
max
, MPa
Ti-6Al-4V, Bimodal
RT, Air
3X10⁴ cycles
1X10⁵
1X10⁶
1X10⁷
1X10⁸
max,e
De
Two Load parametric description of S-N Fatigue