Embed Size (px)
Citation preview

1
Steve Bowers, Extension forester, Lane County; Jim Reeb, Extension forester, Lincoln County; Bob Parker, Extension forester; Baker County; all of Oregon State University. This publication replaces OSU Extension publication EC 1190, Stand Volume and Growth: Getting the Numbers.
Steve Bowers, Jim Reeb, and Bob Parker
EM 9058 • Apr i l 2013
Measuring Your Trees
Abbreviations at a glanceThe following abbreviations are used throughout this publication.DBH: Diameter at breast heightMBF: 1,000 board feetARG: Average radial growthGPF: Growth projection factorMAI: Mean annual incrementPAI: Periodic annual incrementSDI: Stand density indexRD: Relative density
Woodland owners value their lands for many reasons, including aesthetics, pri-vacy, recreation, fish and wildlife, income,
and more. Whatever your objectives, sound forest management plans require a thorough inventory: basic information such as tree size, species, density, growth rates, and merchantable volume. An accurate estimate of these parameters helps answer important management questions: Do I have too few trees? Too many trees? Are my trees growing well? How much volume is in my trees?
How do you obtain this information? One approach is to measure every tree in the stand and add it all up. However, this is impractical for even small acreages. A more sensible alternative is to select an appropriate sample of trees that are repre-sentative of the entire stand, accurately measure that sample, and then use the information to estimate stand characteristics. If done correctly, this sampling process will give satisfactory results and save time and money.
The step-by-step procedures in this publica-tion show how to estimate standing volume and annual growth of individual timber stands that are relatively uniform in species, age, size, and density. Estimates of volume and growth are helpful in plan-ning when to harvest or how much to remove in a thinning operation. These estimates also can assist with financial analysis and the tax implications of a timber harvest.
Don’t confuse this simplified process for collect-ing and analyzing a forest inventory with the more complex and precise techniques professional for-esters use to estimate timber values for sales, land appraisals, or legal purposes. This simplified process allows you to get reasonably accurate gross volumes of timber but does not address net volumes, log grades, or monetary values.
ContentsThe tarif system ................................................................. 2
Key numbers to generate .............................................. 2
Measure stand volume and growth .......................... 4
Calculate stand volume and growth ......................... 9
Use the numbers ............................................................12
Where to go from here .................................................14
For more information ....................................................14
Appendices A1–A6 (Tarif access tables) .................15
Appendices B1–B3 (Tree volume tables) ...............21
Appendix C (Tree Tally Card) ......................................24
Appendix D (Volume Computation Form) ............25
2
The tarif systemAll forest inventory systems generate estimates of
tree volume and growth. The tarif system originated in Europe and was adapted for Pacific Northwest use by the State of Washington. Very simply, tarif refers to the relationship between tree height and diameter.
The tarif system is a type of tree volume table that allows you to determine the gross wood volume of individual trees on the basis of species, tree diam-eter at breast height (DBH), and total height. The system applies a tarif number that signifies the total height-to-diameter relationship of an individual tree. The tree volume tables supported by this publica-tion include Douglas-fir, grand fir, western hemlock, ponderosa pine, western redcedar, and red alder.
This simplified system is appealing to woodland owners because it is easier to use and requires fewer measurements than other systems, lessening the chance for error. Many professionals use the form class inventory method, which requires additional measurements along the tree stem, necessitating additional measuring tools and experience to obtain accurate tree estimates.
If you have questions about the appropriateness of using the tarif system to make management deci-sions regarding your timber stand or need help with a complex situation, contact the Extension forester who serves your county, a Stewardship Forester from the Oregon Department of Forestry, or a private consulting forester.
Key numbers to generateBy following the procedures in this publication,
you’ll generate several numbers that describe your timber stand.
Number of trees per acreThis is a good start and the basis for many other
calculations.
Number of trees per acre by diameter classAlso called a stand table, these numbers can be
used to plan logging jobs and evaluate tree sizes available to merchandise. This is important because many mills require a narrow range of log specifica-tions. You’ll also use these numbers as the starting point for projecting future stand growth.
Average stand diameterThis number is valuable for making decisions
about merchantability and selecting appropriate logging equipment. It is also used to project stand growth and, along with trees per acre, can provide useful information for making thinning decisions.
Basal areaThis is the cross-sectional (circular) area of
a tree. It is measured at breast height (4.5 feet above the ground) and taken on the uphill side of the tree. The sum of the basal area for all trees in the stand is the total stand basal area, a common measure of stand density and tree size and a very important piece of information for making stand-management decisions.
Tarif numberA tarif number identifies the taper, or shape,
of trees and is the key to determining tree and individual log volumes. A tarif number is the cubic-foot volume of a tree with a basal area of 1 square foot and a given height. For example, a tree that’s 13.56 inches in diameter has a basal area of 1 square foot. If this tree had a volume of 35 cubic feet, its tarif number would be 35.
Given two trees with the same DBH, the easiest way to understand the corresponding tarif numbers is that a low tarif number means the tree has a lot of taper and less volume, and a high tarif number means the tree has minimal taper and greater volume. For example, a 90-foot-tall Douglas-fir with a 12-inch DBH has a tarif number of 30, while a 130-foot-tall Douglas-fir with the same DBH has a tarif number of 40.
Tarif numbers differ slightly among species, but in general, a low tarif number for a timber stand is less than 30, a medium tarif number is between 30 and 40, and a high tarif number is greater than 40. Typically, higher quality sites have trees with higher tarif numbers.
Stand volumesYou can use the tarif number of your sample trees
to look up volumes of trees of various diameters in board-foot or cubic-foot volume tables. Then, you can convert these into per-acre volumes by diameter class by multiplying individual tree volumes by the
3
number of trees per acre. Tree volumes are some of the most useful numbers to generate. It is important to remember that these numbers are gross volumes. They don’t consider losses for defects and breakage that can occur during harvest or natural defects in a tree, all of which can affect net volumes.
Board-foot volumeThis number is often of greatest interest since
most timber is sold at a price per 1,000 board feet (MBF). There are several methods of scaling or measuring board feet. This publication uses the most common method in the Pacific Northwest: the Scribner volume table.
Cubic-foot volumeThis is a basic measure of the total wood volume
in a tree and is independent of how the tree is cut into various log lengths and diameters. It is also useful for determining basic growth relationships for the stand and for comparing stands or species.
You can use the numbers described above along with tree ring widths from increment cores to mea-sure past growth and estimate future growth:
• Growth projection factor (GPF). This number can be used in conjunction with board-foot or cubic-foot volumes to esti-mate future stand volumes given current growth rates.
• Mean annual increment (MAI). This number is the average volume growth per year over the total life of the stand.
• Periodic annual increment (PAI). This number is the annual volume growth mea-sured over a specified period, usually 5 or 10 years (5 years is recommended).
There’s help availableTo complete the procedures described in
this publication, you need a basic understand-ing of how to measure trees and distance and how to do simple math calculations. Consult the following OSU Extension publications for more information:
EC 1133, Mapping and Managing Poorly Stocked Douglas-fir Stands, defines terms, shows how to divide trees into separate stands, and explains how to make sampling plans.
EC 1129, Tools for Measuring Your Forest, describes tools used to measure your trees.
EM 9059, Measuring Your Trees Workbook, is a computer-based calculator you can use instead of doing calculations by hand. This workbook does the following:
• Uses measurements of tarif trees and plot trees to estimate trees per acre, basal area per acre, and cubic-foot and board-foot volumes per acre. Stand parameters are reported by diameter classes of 1-inch increments for the total stand.
• Estimates average diameter at breast height (DBH), growth projection factor (GPF), and board-foot volume growth expressed as mean annual increment (MAI) and periodic annual increment (PAI).
• Estimates stand density index (SDI) and relative density (RD), which are measures of stand density and competition—two important considerations in managing a timber stand.
Example: Coleman’s ConifersThroughout this publication, we use a fictional stand called Coleman’s Conifers to illustrate the steps
needed to take an inventory of your trees. Where you see shaded boxes, like this one, you’ll find an exam-ple from Coleman’s Conifers that will help you work through the procedures. Each box applies the steps explained in nearby text and moves the calculations one step further.
4
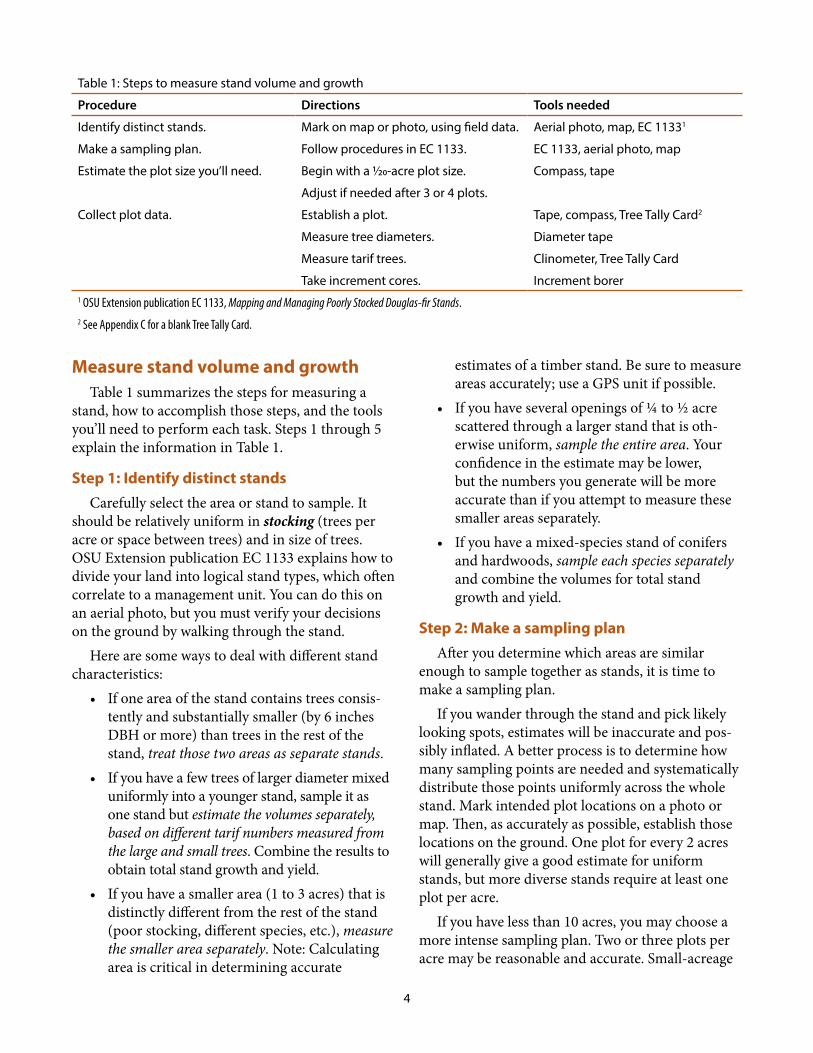
Table 1: Steps to measure stand volume and growth
Procedure Directions Tools needed
Identify distinct stands. Mark on map or photo, using field data. Aerial photo, map, EC 11331
Make a sampling plan. Follow procedures in EC 1133. EC 1133, aerial photo, map
Estimate the plot size you’ll need. Begin with a 1/20-acre plot size.
Adjust if needed after 3 or 4 plots.
Compass, tape
Collect plot data. Establish a plot.
Measure tree diameters.
Measure tarif trees.
Take increment cores.
Tape, compass, Tree Tally Card2
Diameter tape
Clinometer, Tree Tally Card
Increment borer1 OSU Extension publication EC 1133, Mapping and Managing Poorly Stocked Douglas-fir Stands.2 See Appendix C for a blank Tree Tally Card.
Measure stand volume and growthTable 1 summarizes the steps for measuring a
stand, how to accomplish those steps, and the tools you’ll need to perform each task. Steps 1 through 5 explain the information in Table 1.
Step 1: Identify distinct standsCarefully select the area or stand to sample. It
should be relatively uniform in stocking (trees per acre or space between trees) and in size of trees. OSU Extension publication EC 1133 explains how to divide your land into logical stand types, which often correlate to a management unit. You can do this on an aerial photo, but you must verify your decisions on the ground by walking through the stand.
Here are some ways to deal with different stand characteristics:
• If one area of the stand contains trees consis-tently and substantially smaller (by 6 inches DBH or more) than trees in the rest of the stand, treat those two areas as separate stands.
• If you have a few trees of larger diameter mixed uniformly into a younger stand, sample it as one stand but estimate the volumes separately, based on different tarif numbers measured from the large and small trees. Combine the results to obtain total stand growth and yield.
• If you have a smaller area (1 to 3 acres) that is distinctly different from the rest of the stand (poor stocking, different species, etc.), measure the smaller area separately. Note: Calculating area is critical in determining accurate
estimates of a timber stand. Be sure to measure areas accurately; use a GPS unit if possible.
• If you have several openings of ¼ to ½ acre scattered through a larger stand that is oth-erwise uniform, sample the entire area. Your confidence in the estimate may be lower, but the numbers you generate will be more accurate than if you attempt to measure these smaller areas separately.
• If you have a mixed-species stand of conifers and hardwoods, sample each species separately and combine the volumes for total stand growth and yield.
Step 2: Make a sampling planAfter you determine which areas are similar
enough to sample together as stands, it is time to make a sampling plan.
If you wander through the stand and pick likely looking spots, estimates will be inaccurate and pos-sibly inflated. A better process is to determine how many sampling points are needed and systematically distribute those points uniformly across the whole stand. Mark intended plot locations on a photo or map. Then, as accurately as possible, establish those locations on the ground. One plot for every 2 acres will generally give a good estimate for uniform stands, but more diverse stands require at least one plot per acre.
If you have less than 10 acres, you may choose a more intense sampling plan. Two or three plots per acre may be reasonable and accurate. Small-acreage
5
tracts usually develop from regional zoning changes that have allowed farm or forestry land to be sub-divided into rural residential zoning. These areas have been previously harvested, often with marginal reforestation efforts, resulting in many different tree species and sizes.
If you have less than 5 acres, you may choose to measure each individual tree (a 100% sampling plan). This is feasible but requires a lot of work. It might be more efficient to use two, three, or four plots per acre.
It is important to remember that regardless of acreage, using more plots does not necessarily result in greater accuracy.
Step 3: Develop a strategyTo ensure a successful timber evaluation and
nonbiased coverage, use a systematic approach to establish plots and measure each stand. Do every-thing the same, each time, every time.
Begin at one corner of the timber stand. Regardless of the number of plots in your sampling plan, measure or pace 50 feet along the edge of the stand, perpendicular to your planned compass line. Then proceed 50 feet along the compass line to the first plot center. By avoiding the stand boundaries, you’ll ensure that all plots will contain trees inside the desired timber stand even if you make slight errors when traversing the compass line (it’s difficult to stay in a perfectly straight line).
Whatever your sampling plan, if a plot happens to be adjacent to the boundary line and some of the trees will be outside the stand, measure 50 feet back-wards along the compass line to establish the plot.
Step 4: Estimate the plot size you’ll needSelect a plot size that will give you five to eight
sample trees per plot. The proper plot size to use for sampling depends on the number of trees per acre, which is directly related to distance between trees.
Before starting your fieldwork, use Table 2 as a checklist to ensure you have the proper equipment.
To begin, refer to the sampling plan you devel-oped for the stand under Step 2. Locate the point where you’ll start the sample. Place a flag, stick, or stake in the ground so you can locate the plot in the future.
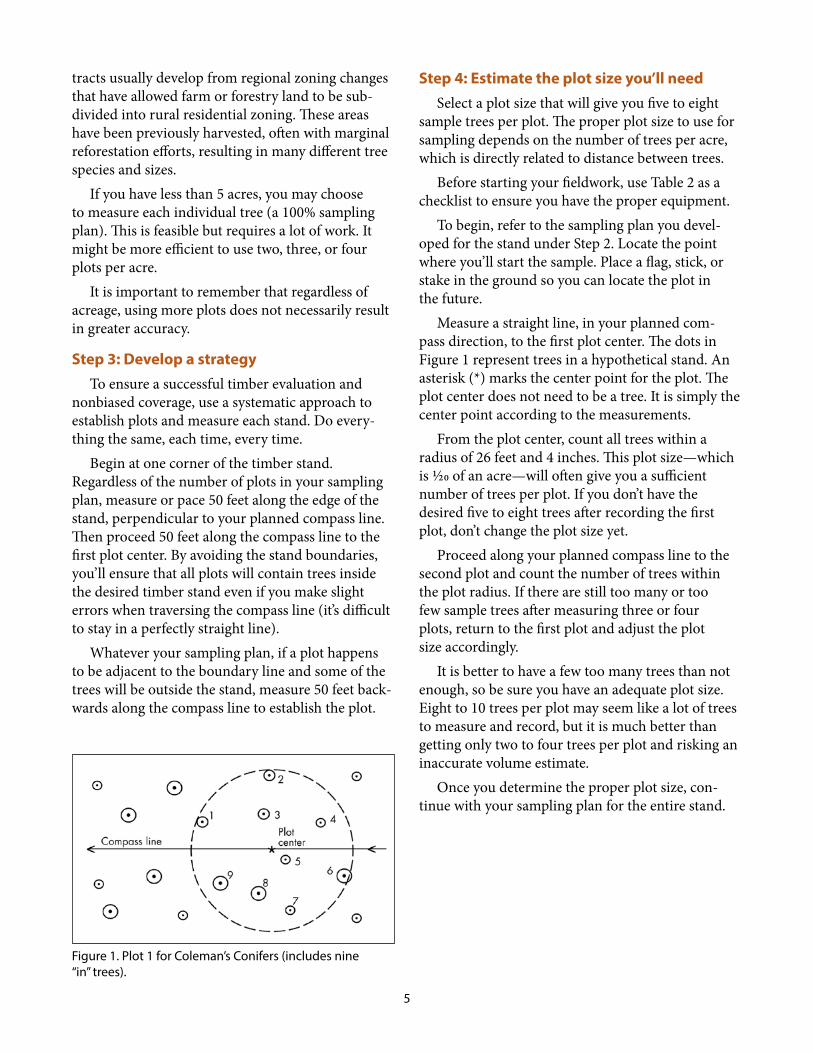
Measure a straight line, in your planned com-pass direction, to the first plot center. The dots in Figure 1 represent trees in a hypothetical stand. An asterisk (*) marks the center point for the plot. The plot center does not need to be a tree. It is simply the center point according to the measurements.
From the plot center, count all trees within a radius of 26 feet and 4 inches. This plot size—which is ½0 of an acre—will often give you a sufficient number of trees per plot. If you don’t have the desired five to eight trees after recording the first plot, don’t change the plot size yet.
Proceed along your planned compass line to the second plot and count the number of trees within the plot radius. If there are still too many or too few sample trees after measuring three or four plots, return to the first plot and adjust the plot size accordingly.
It is better to have a few too many trees than not enough, so be sure you have an adequate plot size. Eight to 10 trees per plot may seem like a lot of trees to measure and record, but it is much better than getting only two to four trees per plot and risking an inaccurate volume estimate.
Once you determine the proper plot size, con-tinue with your sampling plan for the entire stand.
Figure 1. Plot 1 for Coleman’s Conifers (includes nine “in” trees).
6
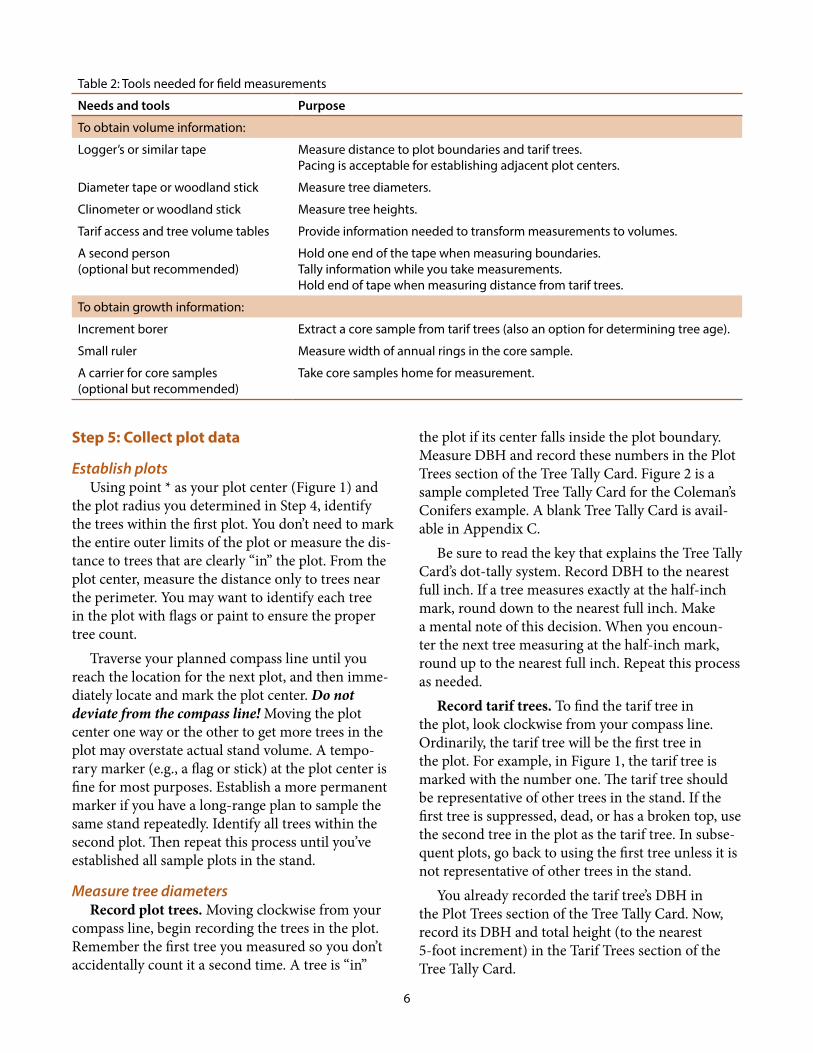
Table 2: Tools needed for field measurements
Needs and tools Purpose
To obtain volume information:
Logger’s or similar tape Measure distance to plot boundaries and tarif trees. Pacing is acceptable for establishing adjacent plot centers.
Diameter tape or woodland stick Measure tree diameters.
Clinometer or woodland stick Measure tree heights.
Tarif access and tree volume tables Provide information needed to transform measurements to volumes.
A second person (optional but recommended)
Hold one end of the tape when measuring boundaries. Tally information while you take measurements. Hold end of tape when measuring distance from tarif trees.
To obtain growth information:
Increment borer Extract a core sample from tarif trees (also an option for determining tree age).
Small ruler Measure width of annual rings in the core sample.
A carrier for core samples (optional but recommended)
Take core samples home for measurement.
Step 5: Collect plot data
Establish plotsUsing point * as your plot center (Figure 1) and
the plot radius you determined in Step 4, identify the trees within the first plot. You don’t need to mark the entire outer limits of the plot or measure the dis-tance to trees that are clearly “in” the plot. From the plot center, measure the distance only to trees near the perimeter. You may want to identify each tree in the plot with flags or paint to ensure the proper tree count.
Traverse your planned compass line until you reach the location for the next plot, and then imme-diately locate and mark the plot center. Do not deviate from the compass line! Moving the plot center one way or the other to get more trees in the plot may overstate actual stand volume. A tempo-rary marker (e.g., a flag or stick) at the plot center is fine for most purposes. Establish a more permanent marker if you have a long-range plan to sample the same stand repeatedly. Identify all trees within the second plot. Then repeat this process until you’ve established all sample plots in the stand.
Measure tree diametersRecord plot trees. Moving clockwise from your
compass line, begin recording the trees in the plot. Remember the first tree you measured so you don’t accidentally count it a second time. A tree is “in”
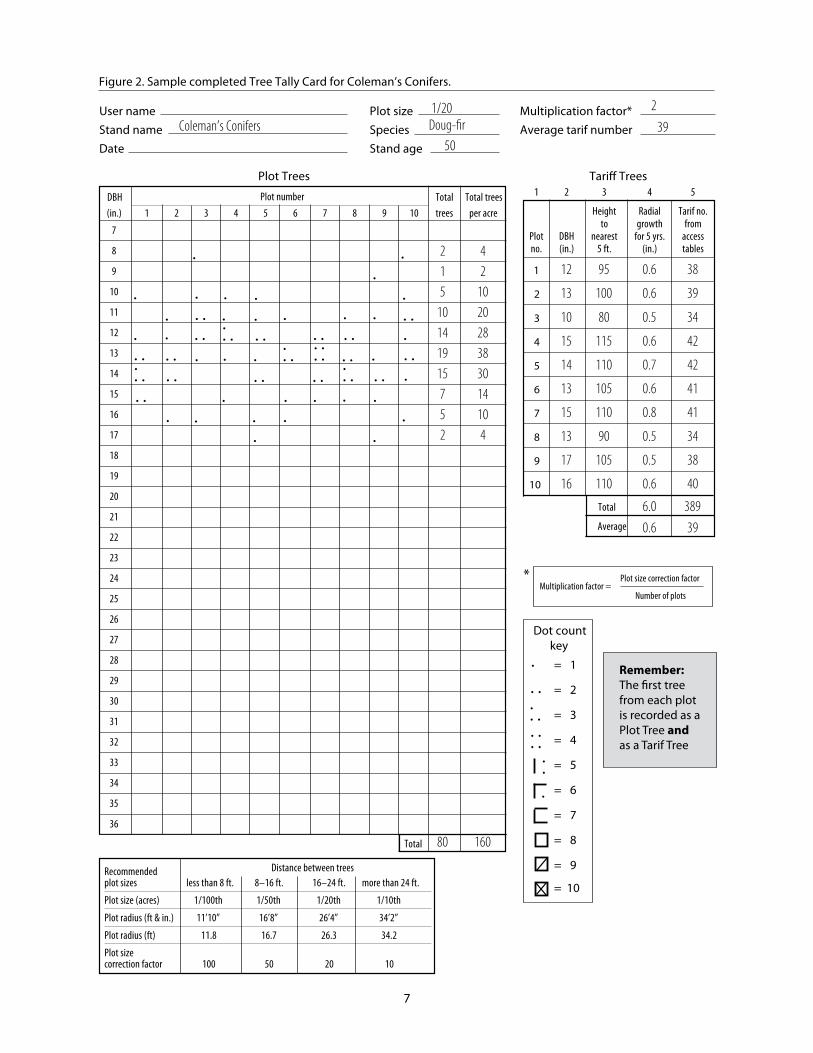
the plot if its center falls inside the plot boundary. Measure DBH and record these numbers in the Plot Trees section of the Tree Tally Card. Figure 2 is a sample completed Tree Tally Card for the Coleman’s Conifers example. A blank Tree Tally Card is avail-able in Appendix C.
Be sure to read the key that explains the Tree Tally Card’s dot-tally system. Record DBH to the nearest full inch. If a tree measures exactly at the half-inch mark, round down to the nearest full inch. Make a mental note of this decision. When you encoun-ter the next tree measuring at the half-inch mark, round up to the nearest full inch. Repeat this process as needed.
Record tarif trees. To find the tarif tree in the plot, look clockwise from your compass line. Ordinarily, the tarif tree will be the first tree in the plot. For example, in Figure 1, the tarif tree is marked with the number one. The tarif tree should be representative of other trees in the stand. If the first tree is suppressed, dead, or has a broken top, use the second tree in the plot as the tarif tree. In subse-quent plots, go back to using the first tree unless it is not representative of other trees in the stand.
You already recorded the tarif tree’s DBH in the Plot Trees section of the Tree Tally Card. Now, record its DBH and total height (to the nearest 5-foot increment) in the Tarif Trees section of the Tree Tally Card.
7
User name Plot size Multiplication factor*Stand name Species Average tarif numberDate Stand age
Recommendedplot sizes less than 8 ft. 8–16 ft. 16–24 ft. more than 24 ft.
Plot size (acres) 1/100th 1/50th 1/20th 1/10th
Plot radius (ft & in.) 11’10” 16’8” 26’4” 34’2”
Plot radius (ft) 11.8 16.7 26.3 34.2
Plot sizecorrection factor 100 50 20 10
Distance between trees
DBH Total Total trees(in.) 10 trees per acre
7
8
9
10
11
12
13
14
15
16
17
18
19
20
21
22
23
24
25
26
27
28
29
30
31
32
33
34
35
36
Total
Plot number
Plot Trees Tari� Trees
1
2
3
4
5
6
7
8
9
10
Total
Average
Height Radial Tarif no.to growth from
Plot DBH nearest for 5 yrs. accessno. (in.) 5 ft. (in.) tables
Figure 2. Sample completed Tree Tally Card for Coleman’s Conifers.
Coleman’s Conifers1/20
Doug-�r50
1010 2014 2819 381575
301410
39
= 1
= 2
= 3
= 4
= 5
= 6
= 7
= 8
=
=
9
10
•
Dot countkey
• •• •
•
• •
•• •
••
Multiplication factor =Plot size correction factor
Number of plots
*
12 95 0.6 38
13 100 0.6 39
10 80 0.5 34
15 115 0.6 42
14 110 0.7 42
13 105 0.6 41
15 110 0.8 41
13 90 0.5 34
17 105 0.5 38
16 110 0.6 40
6.0 3890.6 39
2
•
• •
•• •
••• ••
• •• •
• •• ••• •
•• •
•• •
• •• • • •
• •
• •
• •
• •
• •• •
• •
• •• •
•
•
•••••
••
•
•
•
•
•
•
• •
•
•••
• ••
•
••
•
98765
5
4
4
3
3
2
2
1
2
2
25
4
4
1
80 160
1
Remember:The �rst tree from each plot is recorded as a Plot Tree and as a Tarif Tree
8
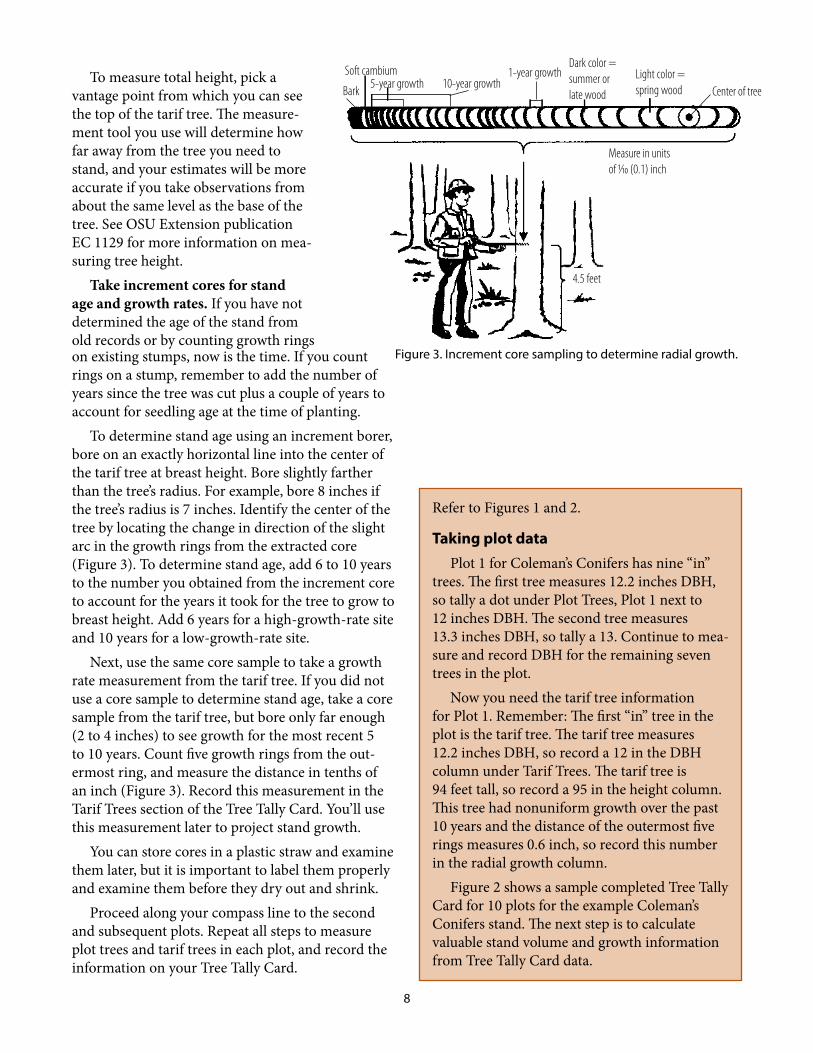
To measure total height, pick a vantage point from which you can see the top of the tarif tree. The measure-ment tool you use will determine how far away from the tree you need to stand, and your estimates will be more accurate if you take observations from about the same level as the base of the tree. See OSU Extension publication EC 1129 for more information on mea-suring tree height.
Take increment cores for stand age and growth rates. If you have not determined the age of the stand from old records or by counting growth rings
Figure 3. Increment core sampling to determine radial growth.
Refer to Figures 1 and 2.
Taking plot dataPlot 1 for Coleman’s Conifers has nine “in”
trees. The first tree measures 12.2 inches DBH, so tally a dot under Plot Trees, Plot 1 next to 12 inches DBH. The second tree measures 13.3 inches DBH, so tally a 13. Continue to mea-sure and record DBH for the remaining seven trees in the plot.
Now you need the tarif tree information for Plot 1. Remember: The first “in” tree in the plot is the tarif tree. The tarif tree measures 12.2 inches DBH, so record a 12 in the DBH column under Tarif Trees. The tarif tree is 94 feet tall, so record a 95 in the height column. This tree had nonuniform growth over the past 10 years and the distance of the outermost five rings measures 0.6 inch, so record this number in the radial growth column.
Figure 2 shows a sample completed Tree Tally Card for 10 plots for the example Coleman’s Conifers stand. The next step is to calculate valuable stand volume and growth information from Tree Tally Card data.
on existing stumps, now is the time. If you count rings on a stump, remember to add the number of years since the tree was cut plus a couple of years to account for seedling age at the time of planting.
To determine stand age using an increment borer, bore on an exactly horizontal line into the center of the tarif tree at breast height. Bore slightly farther than the tree’s radius. For example, bore 8 inches if the tree’s radius is 7 inches. Identify the center of the tree by locating the change in direction of the slight arc in the growth rings from the extracted core (Figure 3). To determine stand age, add 6 to 10 years to the number you obtained from the increment core to account for the years it took for the tree to grow to breast height. Add 6 years for a high-growth-rate site and 10 years for a low-growth-rate site.
Next, use the same core sample to take a growth rate measurement from the tarif tree. If you did not use a core sample to determine stand age, take a core sample from the tarif tree, but bore only far enough (2 to 4 inches) to see growth for the most recent 5 to 10 years. Count five growth rings from the out-ermost ring, and measure the distance in tenths of an inch (Figure 3). Record this measurement in the Tarif Trees section of the Tree Tally Card. You’ll use this measurement later to project stand growth.
You can store cores in a plastic straw and examine them later, but it is important to label them properly and examine them before they dry out and shrink.
Proceed along your compass line to the second and subsequent plots. Repeat all steps to measure plot trees and tarif trees in each plot, and record the information on your Tree Tally Card.
Bark
Soft cambium5-year growth 10-year growth
1-year growthCenter of tree
Measure in units of 1⁄10 (0.1) inch
Dark color = summer or late wood
Light color = spring wood
4.5 feet

9
Calculate stand volume and growthAfter collecting plot data, take it home or to your
office and translate it into numbers that will more accurately describe the stand:
• Trees per acre• Tarif number for the stand• Average radial growth (ARG)• Current stand volume (board feet and cubic feet)• Basal area and average stand diameter• Volume projections (5 or 10 years)Use the sample completed Tree Tally Card
(Figure 2) and Volume Computation Form (Figure 4) for Coleman’s Conifers to follow along with these computations. Use the blank Tree Tally Card (Appendix C) and Volume Computation Form (Appendix D) for your own timber stand calculations.
Trees per acreRefer to the Plot Trees section of the Tree Tally
Card. Total the trees tallied for each diameter class, and record that number in the total trees column.
Next, find the plot size and corresponding plot size correction factor in the table at the bottom of the Tree Tally Card. Divide this factor by the number of plots in the sample to get the multiplication factor.
The multiplication factor expresses how many trees per acre each tree in a sample plot represents. To find the number of trees per acre in each diame-ter class, multiply the value in the total trees column for each diameter class by the multiplication factor, and record that number in the total trees per acre column. Transfer this information to column 1 of the Volume Computation Form.
Tarif number for the standThe average tarif number for the stand is the aver-
age of tarif numbers from all sampled tarif trees. It identifies the taper of your trees and is key to deter-mining tree volumes.
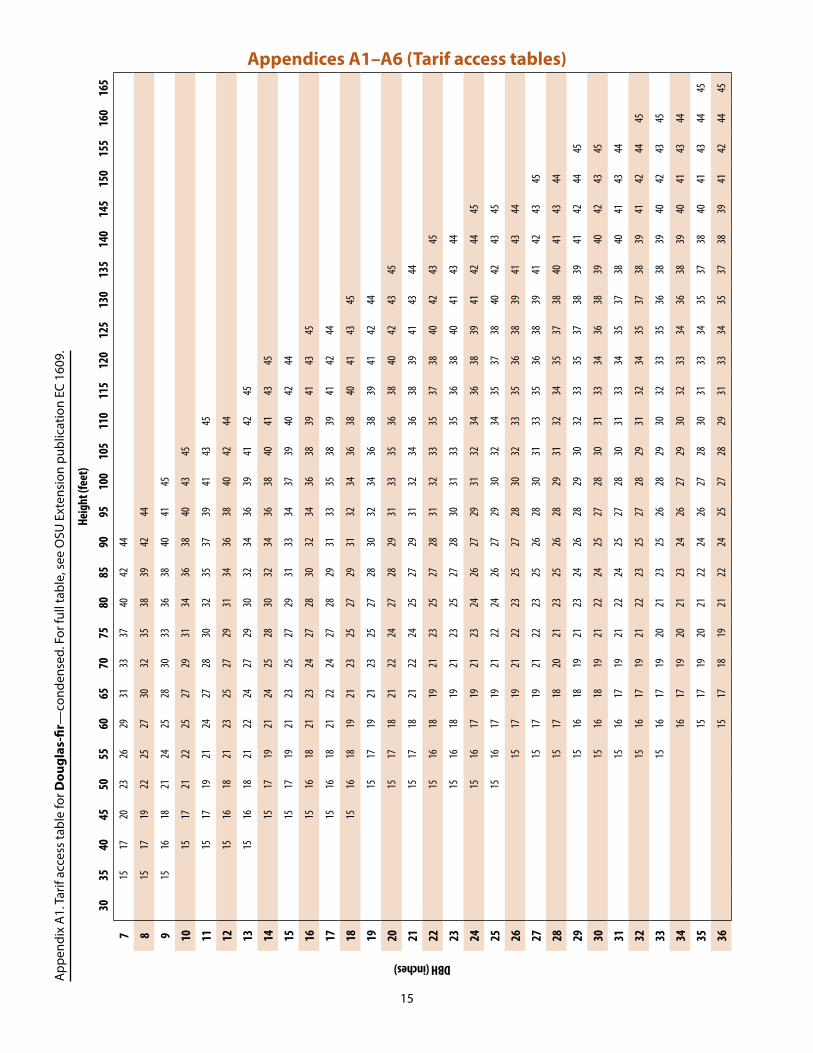
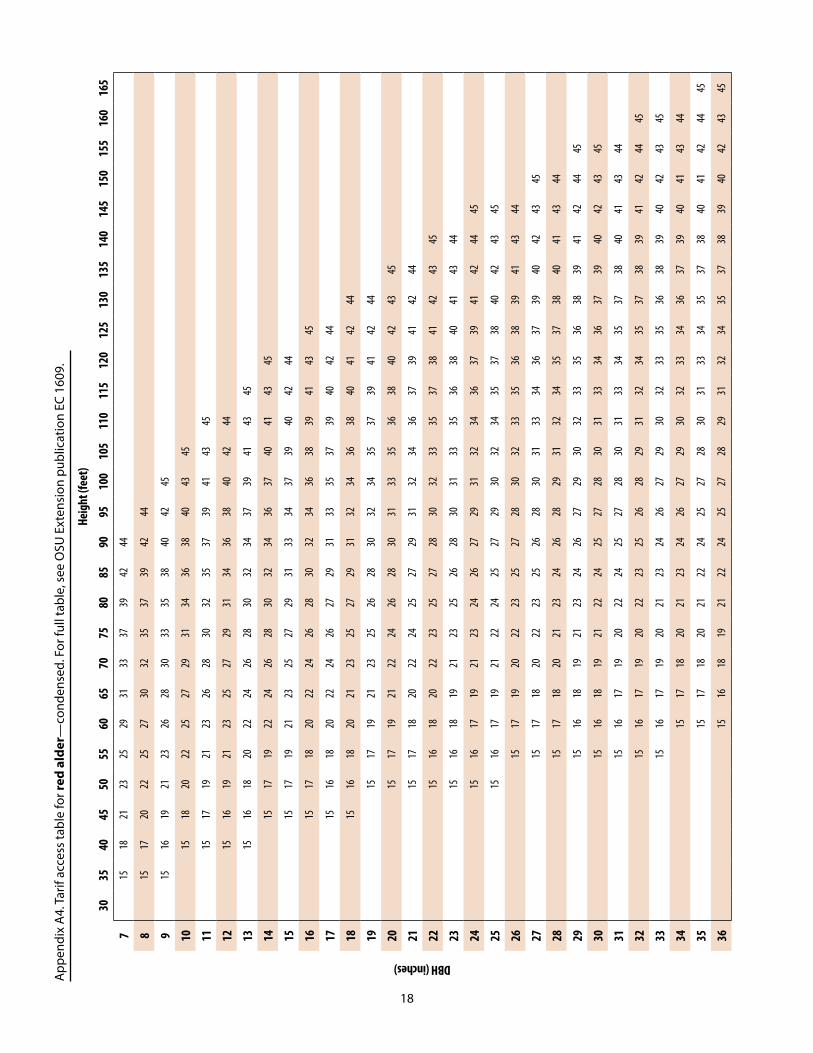
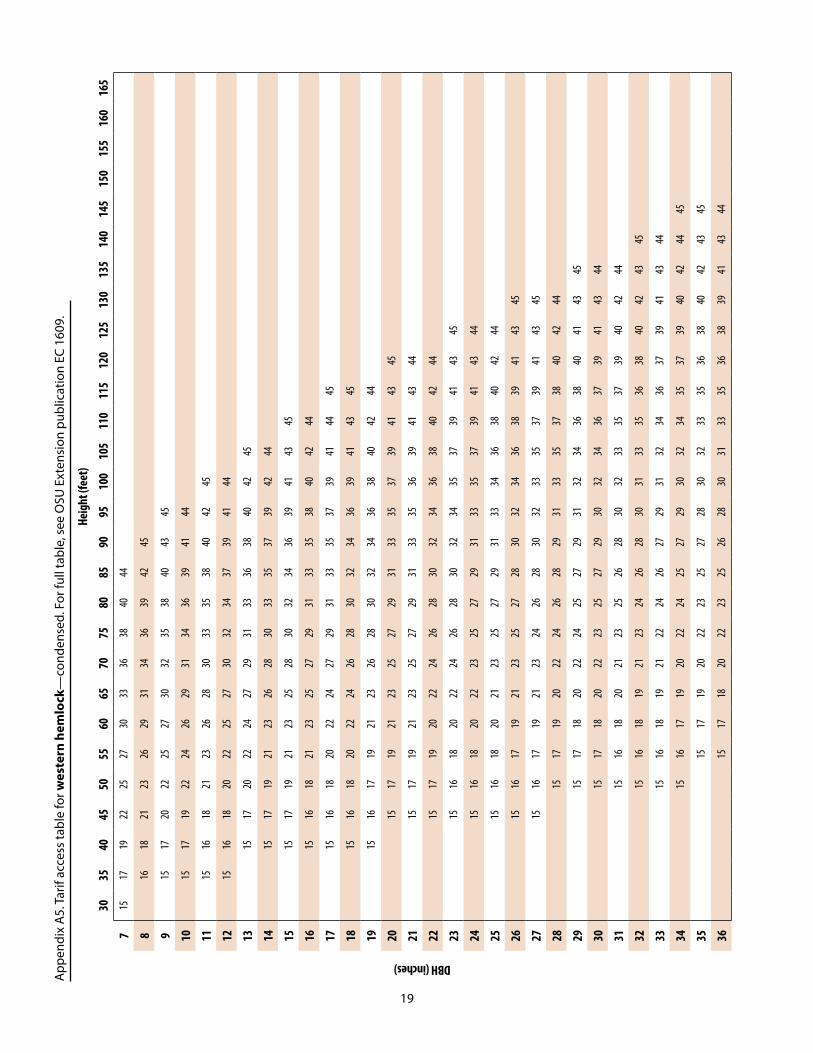
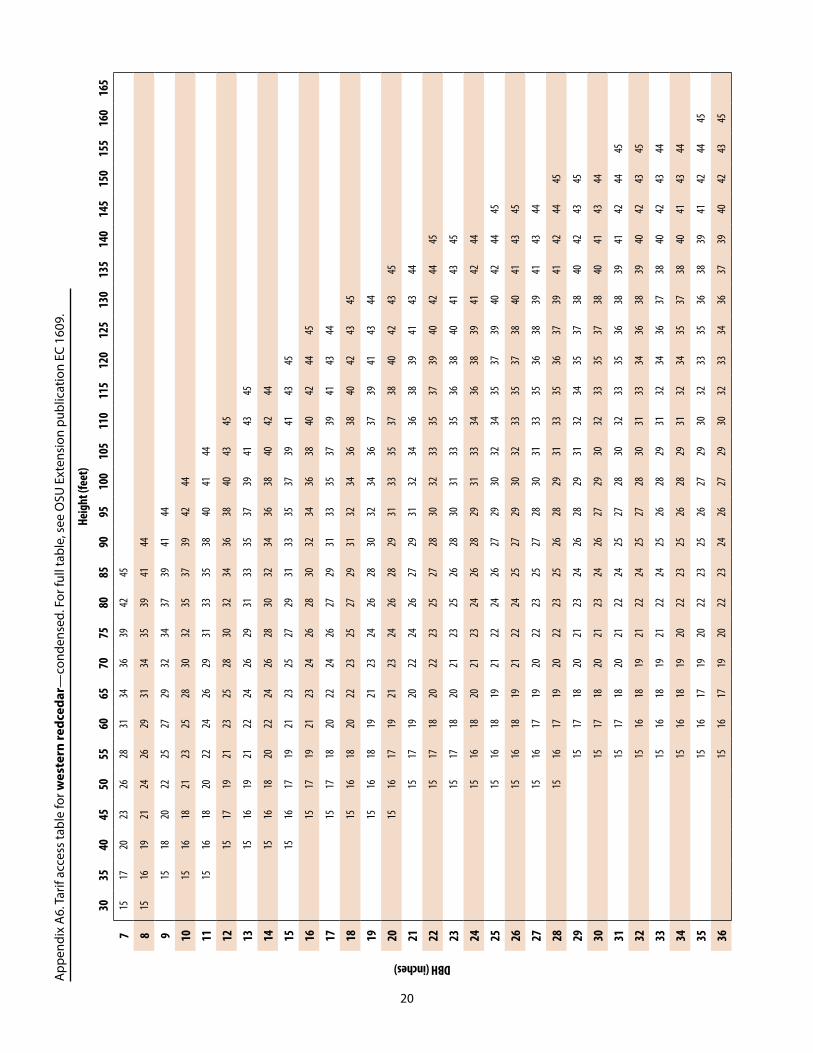
To determine the tarif number for each sample tree in the Tarif Trees section of the Tree Tally Card, look up the value in a tarif access table for that tree species (Appendices A1–A6). These tables list tarif numbers based on tree species, DBH, and total tree height.
Next, total these values and divide by the total number of tarif trees to determine the average tarif number of the stand. Record this number at the top of the Volume Computation Form.
Average radial growth (ARG) and diameter growth
To estimate radial growth for the stand, first total all core sample values in column 4 of the Tarif Trees section of the Tree Tally Card. Then divide that number by the total number of tarif trees to calculate ARG. Remember: This is a radial—not a diameter—measurement (Figure 3 illustrates radial growth). Record this number at the top of the Volume Computation Form. Diameter growth is two times radial growth.
Refer to Figures 2 and 4.
Calculating trees per acreColeman’s Conifers has a total of 80 trees on
10 plots. The multiplication factor is 2 (plot size correction factor of 20 divided by the number of plots, which is 10). There are 14 trees with a 12-inch DBH, so there are 28 (14 plot trees times a multiplication factor of 2) 12-inch-DBH trees per acre in the stand.
Getting the tarif numbersUse Appendix A1 (Tarif access table for
Douglas-fir) to determine the tarif numbers for each of the 10 tarif trees in the Coleman’s Conifers stand. Total these values and divide by 10 to get an average of 38.9 Round to the nearest whole number, and record 39 as the average tarif number for the stand.
Calculating average radial growth (ARG) and diameter growth
The total of column 4 in the Tarif Trees sec-tion of the sample completed Tree Tally Card is 6.0 inches. This means the average tree had 0.6 inches radial growth (6.0/10 trees mea-sured) in the 5-year period. Diameter growth is 1.2 inches (0.6 radial growth × 2).

10
7654321
Board ft. Cubic ft.vol./tree Board ft. vol./tree Cubic ft. Basal area/acre
(from Tree vol./acre (from Tree vol./acre by diameter classTrees/ Volume col. 1 Volume col. 1 Basal (col. 1
DBH acre Tables) x col. 2) Tables) x col. 4) area/tree x col. 6)
.267
.349
.442
10 0.545
11 0.66
12 0.785
13 0.922
14 1.069
15 1.227
16 1.396
17 1.576
18 1.767
19 1.969
20 2.182
21 2.405
22 2.64
23 2.885
24 3.142
25 3.409
26 3.687
27 3.976
28 4.276
29 4.587
30 4.909
31 5.241
32 5.585
33 5.939
34 6.305
35 6.681
36 7.068
Total Total board-foot Total cubic-foot Totaltrees/acre volume/acre volume/acre basal area/acre
Stand name DateSpecies Average radial growthStand age Average basal area/treeAverage tarif number Average stand diameterMultiplication factor Board foot volumes (16’ or 32’)
7
89
Coleman’s ConifersDoug-�r
50392
0.60.92213.002
32
Figure 4. Sample completed Volume Computation Form for Coleman’s Conifers.
4 40 160 11 1.396442 70 140 15 0.88430
10 90 900 20 5.4520020 100 2000 24 13.248028 120 3360 30 21.9884038 150 5700 36 35.036136830 180 5400 42 32.07126014 210 2940 49 17.17868610 230 2300 56 13.965604 250 1000 64 6.304
160 23,900 5724 147.458
256
11
Estimate stand volumeThe next step is to estimate stand volume on the
basis of average tarif number. You’ve already trans-ferred the number of trees per acre by diameter class, ARG, and average tarif number from the Tree Tally Card to the Volume Computation Form.
Tree volume tables are in Appendices B1–B3. These tables list volumes based on average tarif number and DBH. To estimate board-foot volumes in 32-foot logs, use Appendix B1. Appendix B2 is for volumes in 16-foot logs, and Appendix B3 is for cubic-foot volumes. Record board feet in column 2 and cubic feet in column 4 of the Volume Computation Form.
Appendix B1 more closely resembles board-foot volumes that correlate to requirements found in most purchase orders. Appendix B2 gives a better estimate of log volume if you are using a portable sawmill. Appendix B3 may provide more useful information for making stand-management decisions.
To estimate total board-foot and cubic-foot vol-umes per acre for each diameter class, multiply trees per acre (column 1) by volume per tree (columns 2 and 4, respectively) on the Volume Computation Form. Record these calculated values in columns 3 and 5. The sum of column 3 is the total board-foot volume per acre, and the sum of column 5 is the total cubic-foot volume per acre.
Basal area and average stand diameterColumn 6 of the Volume Computation Form lists
the basal area per tree for each diameter class on the form. To determine basal area per acre by diameter class, multiply trees per acre (column 1) by basal area per tree (column 6). Record these calculated values in column 7. The sum of column 7 is the total basal area per acre. To calculate average basal area per tree, use the following formula:
Average basal area per tree = Total basal area (total column 7)/Total trees per acre (total column 1)Average stand diameter is the diameter of a
tree with average basal area. To find this diameter, convert from basal area (square feet) to diameter (inches) using the following formula:
Average stand diameter = √(Average basal area per tree/0.005454)
You can also calculate average stand diameter by multiplying total trees per acre by each diameter class, summing those values, and then dividing by the total trees per acre. Using the above formula merely makes the process faster and easier.
Record average basal area per tree and aver-age stand diameter at the top of the Volume Computation Form.
Refer to Figure 4.
Estimating Stand VolumeFor this example, assume you want to esti-
mate board-foot volumes in 32-foot logs. There are four trees per acre with 8-inch DBH, and average tarif number is 39. According to Appendix B1, the corresponding board-foot volume is 40.
Multiply four trees per acre (column 1) by 40 board feet (column 2) to get 160 board feet per acre for trees in the 8-inch diameter class (column 3). Repeat this process for each diam-eter class, and total the values in column 3.
The Coleman’s Conifers stand has a total of 160 trees per acre with a volume of 23,900 board feet (about 24 MBF) per acre.
Calculating basal areaStill using the example of trees with 8-inch
DBH, multiply four trees per acre (column 1) by 0.349 basal area per tree (column 6) to get a total basal area per acre of 1.396 square feet for the 8-inch diameter class (column 7). Repeat this process for each diameter class, and total the values in column 7 to get a total basal area per acre of 147.458 square feet.
Calculating average basal area per treeTotal basal area per acre for the stand is
147.458, and there are 160 trees per acre.Average basal area per tree = 147.458 square feet/160 = 0.922 square feet
Calculating average stand diameterGiven an average basal area per tree of
0.922 square feet, average stand diameter is:√(0.922 square feet/0.005454) = 13.002 inches

12
Use the numbers
Volume projectionsA completed Volume Computation Form includes
all the information you need to determine past and present stand volumes and calculate the volume growth rate to project future volumes. Volume pro-jections provide essential information to help you make well-informed management decisions.
To project volumes, you need to perform some basic calculations and follow a few simple steps.
Step 1: Calculate beginning average stand diameter
For this example, assume you want to use 5 years as a measurement period because growth rings in your increment core (Figure 3) were quite different for the most recent 5 years. First double the ARG value (remember: diameter growth is two times radial growth). Then calculate average stand diame-ter at the beginning of the most recent 5-year growth period using the following formula:
Beginning average stand diameter = Current average stand diameter – (2 × ARG)
Step 2: Calculate beginning average basal area per tree
To find basal area per tree at the beginning of the 5-year growth period, convert from diameter (inches) to basal area (square feet) using the follow-ing formula:
Beginning average basal area per tree = (Beginning average stand diameter)2 × 0.005454
Step 3: Calculate growth projection factor (GPF)To estimate how fast the stand is growing, calcu-
late its GPF using the following formula:GPF = Current average basal area per tree/Beginning average basal area per tree
Step 4: Calculate future volume per acreNow you can use current volume and GPF to
project the future stand volume per acre:Future volume of stand = Current volume × GPFThis assumes that current stand volume growth
will continue at the same rate as in the previous 5-year growth period, so the projection’s accuracy depends on how consistently the stand is growing. For most young stands (less than 50 years old), this estimate may be somewhat conservative—that is, it may be slightly less than actual growth. As the stand ages beyond 50 years, tree growth rate tends to slow.
Step 5: Calculate mean annual increment (MAI)The MAI of volume growth is another useful
stand number. It represents average volume growth per acre per year over the total life of the stand. Think of MAI as the long-term average, or track record, of the stand’s growth. Calculate MAI using the following formula:
MAI = Total current volume per acre/ stand age (years)
Step 6: Calculate periodic annual increment (PAI)The PAI is the average annual volume growth of
a timber stand measured over a specific time period. This number is useful because volume growth per acre can vary substantially as the stand ages. You can calculate the PAI of board-foot or cubic-foot volumes for any time period, but 5- or 10-year periods are most common. Calculate PAI using the following formula:
PAI = (Total volume per acre at end of time period – Total volume per acre at beginning of time period)/Number of years in the time periodThe PAI can measure previous growth or project
future growth. You can use core samples to record measurements from the past or use the calculated GPF to estimate a future PAI. This enables you to determine how a stand is growing by taking “snap-shots” over time.

13
Figure 5. Periodic and mean annual increments of board-foot volume for Douglas-fir, showing culmination of mean annual increment at about 80 years. Absolute age of culmination varies, but the pattern in this graph is similar for all species. Adapted from McArdle et al., The Yield of Douglas Fir in the Pacific Northwest, USDA Technical Bulletin 201, 1961.
Growth of the Timber StandForesters have a long tradition of analyzing
timber stand growth. Figure 5 shows the growth pat-tern for Douglas-fir, but the pattern for even-aged stands tends to be similar for all tree species.
From analyses and long experience, forest-ers have derived a general rule that when PAI falls below MAI, the timber stand is mature—that is, it has passed its peak of wood growth production in the biological sense. You might harvest such a stand if growth rate is the overriding factor in your harvest decision.
The point where the PAI line crosses the MAI line also is the highest value for MAI. This point is referred to as culmination of MAI. The stand will continue to add volume after this point, but at a slower rate. Comparing estimates of PAI and MAI shows whether stands are biologically mature. Thinning may increase the growth of residual trees and delay culmination of MAI.
Board
feet
per a
cre pe
r yea
r (10
00s)
Mean annual increment (board feet)
Periodic annual increment (board feet)
Age (years)0
0
1
2
20 40 60 80 100 120 140 160
Projecting volumesRefer to Figure 4.
Beginning average stand diameterUse the current average stand diameter of
13.002 inches and ARG of 0.6 inches to calculate average stand diameter 5 years ago:
13.002 inches – (2 × 0.6 inches) = 11.8 inches
Beginning average basal area per treeUse the beginning average stand diameter of
11.8 inches to calculate average basal area per tree at the beginning of the growth period:
(11.8 inches)2 × 0.005454 = 0.759 square feet
Growth projection factor (GPF)Use current and beginning average basal area
per tree to calculate the GPF:0.922 square feet/0.759 square feet = 1.215
Future volumesMultiply current stand volume by the GPF to
project the volume of the stand in 5 years:23,900 board feet per acre × 1.215 = 29,039 board feet per acre
Or: 5,724 cubic feet per acre × 1.215 = 6,955 cubic feet per acre
Mean annual increment (MAI)Divide current total volume per acre by stand
age to calculate MAI for the life of the stand:23,900 board feet per acre/50 years = 478 board feet per acre per year
Periodic annual increment (PAI)To calculate PAI for the next 5 years, subtract
the current total volume per acre of the stand from the future volume (which was determined using the GPF), and divide by the number of years in the growth period:
(29,039 board feet per acre – 23,900 board feet per acre)/5 years = 1,028 board feet per acre per year for the next 5 years.In this example, PAI exceeds MAI. This sug-
gests the stand is not biologically mature and should be allowed to continue growing, although it may need thinning.

14
You can examine a stand in even more detail by determining stand density index (SDI) and relative density (RD). The SDI is a measure of the stocking of a stand of trees based on the number of trees per unit area and DBH of the tree of average basal area. It can also be defined as the degree of crowding within stocked areas, using various ratios based on crown length or diameter, tree height or diameter, and spac-ing. Basal area is usually satisfactory as a measure of SDI because it is easier to calculate than SDI.
Growth models commonly adjust maximum densities for local growing conditions. When using RD, be aware that timber stands and conditions are unique, and published values for maximum densities may change over time. Because RD is a function of maximum density, RD may change accordingly.
Trees compete for resources such as light, water, and nutrients. The bigger the tree, the more resources it needs to survive. Both SDI and RD are based on the concept that each acre can support only a certain number of trees of a given size. When a stand approaches this maximum, some trees must die before others can grow larger. For any range of densities below the maximum, foresters can approxi-mate the health, vigor, growth rates, crown ratios, and other characteristics of trees in the stand.
The following zones represent averages estab-lished from examinations of hundreds of stands and many experiments. As with any average, there are stands that do better or worse.
• Mortality zone: SDI of 330–600 (RD of 55–100)
• Optimum or healthy zone: SDI of 210–330 (RD of 35–55)
• Diversity zone: SDI of 120–240 (RD of 20–40)
In the mortality zone, trees will self-thin to survive. The healthy zone represents optimum growth for the timber stand. The diversity zone promotes growth of understory vegetation or tree regeneration. If you are interested in further stand examination, use the following formulas to calculate SDI and RD:
SDI = total trees per acre × (average stand diameter/10)1.6
RD (expressed as a percentage) = (SDI/maximum density for that tree species) × 100
Using numbers previously calculated in the Coleman’s Conifers example:
SDI = 160 × (13.002/10)1.6 = 243RD = (243/600) × 100 = 41%Keep in mind there are also stand-management
considerations that have nothing to do with how trees are growing. Often, factors such as cash flow or market cycles dictate whether a timber harvest occurs before or after culmination of MAI. Combine biological information with financial analysis to tailor management decisions to unique situations and objectives.
Where to go from hereGood stand information is essential to making
the decisions necessary for managing your wood-land. Stand measurements are critical when determining logging and marketing options. They are also important indicators of stand health, vigor, and susceptibility to insect and disease problems. And stand measurements might help you decide whether a harvest operation will generate the desired cash flow.
This publication introduced concepts of timber volume and growth and outlined how to calculate important stand numbers. Measurements taken according to the procedures described here are suit-able for understanding how a timber stand may develop over time; however, this simplified process is not a substitute for professional timber appraisals or inventories done by foresters.
If you want to refine these techniques or study timber growth further, contact your Extension for-ester for assistance.
For more informationOSU Extension publications
http://extension.oregonstate.edu/catalogEC 1127. Measuring Timber Products Harvested
from Your Woodland.EC 1129. Tools for Measuring Your Forest.EC 1133. Mapping and Managing Poorly Stocked
Douglas-fir Stands.EC 1609. Tarif Access Tables: A Comprehensive Set.
15
Appendices A1–A6 (Tarif access tables)A
ppen
dix
A1.
Tar
if ac
cess
tabl
e fo
r Dou
glas
-fir—
cond
ense
d. F
or fu
ll ta
ble,
see
OSU
Ext
ensi
on p
ublic
atio
n EC
160
9.
Heig
ht (f
eet)
3035
4045
5055
6065
7075
8085
9095
100
105
110
115
120
125
130
135
140
145
150
155
160
165
DBH (inches)
715
1720
2326
2931
3337
4042
44
815
1719
2225
2730
3235
3839
4244
915
1618
2124
2528
3033
3638
4041
45
1015
1721
2225
2729
3134
3638
4043
45
1115
1719
2124
2728
3032
3537
3941
4345
1215
1618
2123
2527
2931
3436
3840
4244
1315
1618
2122
2427
2930
3234
3639
4142
45
1415
1719
2124
2528
3032
3436
3840
4143
45
1515
1719
2123
2527
2931
3334
3739
4042
44
1615
1618
2123
2427
2830
3234
3638
3941
4345
1715
1618
2122
2427
2829
3133
3538
3941
4244
1815
1618
1921
2325
2729
3132
3436
3840
4143
45
1915
1719
2123
2527
2830
3234
3638
3941
4244
2015
1718
2122
2427
2829
3133
3536
3840
4243
45
2115
1718
2122
2425
2729
3132
3436
3839
4143
44
2215
1618
1921
2325
2728
3132
3335
3738
4042
4345
2315
1618
1921
2325
2728
3031
3335
3638
4041
4344
2415
1617
1921
2324
2627
2931
3234
3638
3941
4244
45
2515
1617
1921
2224
2627
2930
3234
3537
3840
4243
45
2615
1719
2122
2325
2728
3032
3335
3638
3941
4344
2715
1719
2122
2325
2628
3031
3335
3638
3941
4243
45
2815
1718
2021
2325
2628
2931
3234
3537
3840
4143
44
2915
1618
1921
2324
2628
2930
3233
3537
3839
4142
4445
3015
1618
1921
2224
2527
2830
3133
3436
3839
4042
4345
3115
1617
1921
2224
2527
2830
3133
3435
3738
4041
4344
3215
1617
1921
2223
2527
2829
3132
3435
3738
3941
4244
45
3315
1617
1920
2123
2526
2829
3032
3335
3638
3940
4243
45
3416
1719
2021
2324
2627
2930
3233
3436
3839
4041
4344
3515
1719
2021
2224
2627
2830
3133
3435
3738
4041
4344
45
3615
1718
1921
2224
2527
2829
3133
3435
3738
3941
4244
45

16
App
endi
x A
2. T
arif
acce
ss ta
ble
for g
rand
fir—
cond
ense
d. F
or fu
ll ta
ble,
see
OSU
Ext
ensi
on p
ublic
atio
n EC
160
9.
Heig
ht (f
eet)
3035
4045
5055
6065
7075
8085
9095
100
105
110
115
120
125
130
135
140
145
150
155
160
165
DBH (inches)
715
1820
2326
2934
3739
44
815
1720
2124
2831
3437
3944
915
1821
2425
2932
3538
4144
1015
1720
2325
2729
3336
3841
44
1115
1719
2124
2629
3134
3739
4145
1215
1820
2325
2830
3235
3839
4245
1315
1720
2224
2729
3134
3638
4244
1415
1719
2123
2628
3033
3538
4043
45
1515
1718
2023
2527
2931
3437
3941
4445
1615
1718
2022
2426
2931
3335
3840
4345
1715
1719
2124
2628
3032
3537
3942
44
1815
1719
2123
2528
2932
3436
3841
4345
1915
1718
2023
2527
2931
3335
3840
4245
2015
1718
2021
2426
2830
3234
3739
4144
45
2115
1718
2021
2426
2830
3234
3638
4043
45
2215
1717
1921
2325
2729
3133
3538
4042
44
2315
1719
2123
2527
2831
3335
3739
4143
45
2415
1719
2122
2426
2830
3234
3639
4143
45
2515
1718
2022
2426
2830
3234
3638
4042
44
2615
1718
2022
2426
2729
3133
3537
3942
4445
2715
1718
2021
2325
2729
3133
3537
3941
4345
2815
1718
1921
2325
2729
3132
3436
3840
4345
2915
1718
1921
2325
2628
3032
3436
3840
4244
3015
1718
1921
2224
2628
2932
3435
3839
4143
45
3115
1719
2022
2426
2830
3133
3537
3941
4345
3215
1719
2022
2426
2729
3133
3537
3941
4345
3315
1718
2022
2325
2729
3133
3436
3840
4244
3415
1718
2021
2325
2729
3032
3436
3840
4244
45
3515
1718
2021
2325
2628
3032
3436
3739
4143
45
3615
1718
2021
2325
2628
3032
3435
3739
4143
45

17
App
endi
x A
3. T
arif
acce
ss ta
ble
for p
onde
rosa
pin
e—co
nden
sed.
For
full
tabl
e, s
ee O
SU E
xten
sion
pub
licat
ion
EC 1
609.
Heig
ht (f
eet)
3035
4045
5055
6065
7075
8085
9095
100
105
110
115
120
125
130
135
140
145
150
155
160
165
DBH (inches)
716
1820
2224
2729
3132
3638
4043
45
815
1619
2123
2527
2831
3436
3840
4245
915
1618
2022
2426
2830
3234
3738
4043
45
1015
1719
2023
2527
2931
3335
3739
4143
45
1115
1718
2022
2426
2830
3234
3638
4042
4445
1215
1618
2022
2325
2729
3133
3537
3840
4244
1315
1618
1921
2325
2728
3032
3436
3739
4143
45
1415
1819
2122
2426
2830
3133
3537
3940
4244
1515
1718
2022
2425
2729
3133
3436
3840
4143
45
1615
1618
2021
2325
2728
3032
3435
3739
4142
44
1715
1618
1921
2325
2628
3031
3335
3638
4042
4445
1815
1618
1921
2324
2628
3031
3334
3638
3941
4345
1915
1617
1921
2224
2527
2930
3234
3637
3941
4244
2015
1617
1920
2224
2527
2830
3233
3537
3840
4244
45
2115
1719
2022
2325
2728
3031
3335
3638
4041
4345
2215
1718
2021
2325
2628
2931
3334
3638
3941
4344
2315
1718
2021
2324
2628
2931
3234
3637
3941
4244
2415
1718
2021
2324
2628
2931
3234
3537
3940
4243
45
2515
1618
1921
2224
2627
2930
3233
3537
3840
4143
45
2615
1618
1921
2224
2527
2830
3233
3536
3840
4143
44
2715
1618
1921
2224
2527
2830
3133
3536
3839
4142
44
2815
1617
1920
2223
2527
2830
3133
3436
3739
4142
4445
2915
1617
1920
2223
2526
2829
3133
3436
3739
4042
4345
3015
1617
1920
2223
2526
2829
3133
3435
3738
4042
4345
3115
1617
1920
2223
2526
2829
3132
3435
3738
4041
4344
3215
1617
1920
2123
2426
2729
3032
3335
3638
4041
4344
3315
1617
1820
2123
2426
2729
3032
3335
3638
3941
4244
45
3415
1718
2021
2324
2627
2930
3233
3536
3839
4142
4445
3515
1718
2021
2324
2527
2830
3133
3436
3739
4142
4345
3615
1718
2021
2224
2527
2830
3133
3436
3739
4142
4345
18
App
endi
x A
4. T
arif
acce
ss ta
ble
for r
ed a
lder
—co
nden
sed.
For
full
tabl
e, s
ee O
SU E
xten
sion
pub
licat
ion
EC 1
609.
Heig
ht (f
eet)
3035
4045
5055
6065
7075
8085
9095
100
105
110
115
120
125
130
135
140
145
150
155
160
165
DBH (inches)
715
1821
2325
2931
3337
3942
44
815
1720
2225
2730
3235
3739
4244
915
1619
2123
2628
3033
3538
4042
45
1015
1820
2225
2729
3134
3638
4043
45
1115
1719
2123
2628
3032
3537
3941
4345
1215
1619
2123
2527
2931
3436
3840
4244
1315
1618
2022
2426
2830
3234
3739
4143
45
1415
1719
2224
2628
3032
3436
3740
4143
45
1515
1719
2123
2527
2931
3334
3739
4042
44
1615
1718
2022
2426
2830
3234
3638
3941
4345
1715
1618
2022
2426
2729
3133
3537
3940
4244
1815
1618
2021
2325
2729
3132
3436
3840
4142
44
1915
1719
2123
2526
2830
3234
3537
3941
4244
2015
1719
2122
2426
2830
3133
3536
3840
4243
45
2115
1718
2022
2425
2729
3132
3436
3739
4142
44
2215
1618
2022
2325
2728
3032
3335
3738
4142
4345
2315
1618
1921
2325
2628
3031
3335
3638
4041
4344
2415
1617
1921
2324
2627
2931
3234
3637
3941
4244
45
2515
1617
1921
2224
2527
2930
3234
3537
3840
4243
45
2615
1719
2022
2325
2728
3032
3335
3638
3941
4344
2715
1718
2022
2325
2628
3031
3334
3637
3940
4243
45
2815
1718
2021
2324
2628
2931
3234
3537
3840
4143
44
2915
1618
1921
2324
2627
2930
3233
3536
3839
4142
4445
3015
1618
1921
2224
2527
2830
3133
3436
3739
4042
4345
3115
1617
1920
2224
2527
2830
3133
3435
3738
4041
4344
3215
1617
1920
2223
2526
2829
3132
3435
3738
3941
4244
45
3315
1617
1920
2123
2426
2729
3032
3335
3638
3940
4243
45
3415
1718
2021
2324
2627
2930
3233
3436
3739
4041
4344
3515
1718
2021
2224
2527
2830
3133
3435
3738
4041
4244
45
3615
1618
1921
2224
2527
2829
3132
3435
3738
3940
4243
45
19
App
endi
x A
5. T
arif
acce
ss ta
ble
for w
este
rn h
emlo
ck—
cond
ense
d. F
or fu
ll ta
ble,
see
OSU
Ext
ensi
on p
ublic
atio
n EC
160
9.
Heig
ht (f
eet)
3035
4045
5055
6065
7075
8085
9095
100
105
110
115
120
125
130
135
140
145
150
155
160
165
DBH (inches)
715
1719
2225
2730
3336
3840
44
816
1821
2326
2931
3436
3942
45
915
1720
2225
2730
3235
3840
4345
1015
1719
2224
2629
3134
3639
4144
1115
1618
2123
2628
3033
3538
4042
45
1215
1618
2022
2527
3032
3437
3941
44
1315
1720
2224
2729
3133
3638
4042
45
1415
1719
2123
2628
3033
3537
3942
44
1515
1719
2123
2528
3032
3436
3941
4345
1615
1618
2123
2527
2931
3335
3840
4244
1715
1618
2022
2427
2931
3335
3739
4144
45
1815
1618
2022
2426
2830
3234
3639
4143
45
1915
1617
1921
2326
2830
3234
3638
4042
44
2015
1719
2123
2527
2931
3335
3739
4143
45
2115
1719
2123
2527
2931
3335
3639
4143
44
2215
1719
2022
2426
2830
3234
3638
4042
44
2315
1618
2022
2426
2830
3234
3537
3941
4345
2415
1618
2022
2325
2729
3133
3537
3941
4344
2515
1618
2021
2325
2729
3133
3436
3840
4244
2615
1617
1921
2325
2728
3032
3436
3839
4143
45
2715
1617
1921
2324
2628
3032
3335
3739
4143
45
2815
1719
2022
2426
2829
3133
3537
3840
4244
2915
1718
2022
2425
2729
3132
3436
3840
4143
45
3015
1718
2022
2325
2729
3032
3436
3739
4143
44
3115
1618
2021
2325
2628
3032
3335
3739
4042
44
3215
1618
1921
2324
2628
3031
3335
3638
4042
4345
3315
1618
1921
2224
2627
2931
3234
3637
3941
4344
3415
1617
1920
2224
2527
2930
3234
3537
3940
4244
45
3515
1719
2022
2325
2728
3032
3335
3638
4042
4345
3615
1718
2022
2325
2628
3031
3335
3638
3941
4344
20
App
endi
x A
6. T
arif
acce
ss ta
ble
for w
este
rn re
dced
ar—
cond
ense
d. F
or fu
ll ta
ble,
see
OSU
Ext
ensi
on p
ublic
atio
n EC
160
9.
Heig
ht (f
eet)
3035
4045
5055
6065
7075
8085
9095
100
105
110
115
120
125
130
135
140
145
150
155
160
165
DBH (inches)
715
1720
2326
2831
3436
3942
45
815
1619
2124
2629
3134
3539
4144
915
1820
2225
2729
3234
3739
4144
1015
1618
2123
2528
3032
3537
3942
44
1115
1618
2022
2426
2931
3335
3840
4144
1215
1719
2123
2528
3032
3436
3840
4345
1315
1619
2122
2426
2931
3335
3739
4143
45
1415
1618
2022
2426
2830
3234
3638
4042
44
1515
1617
1921
2325
2729
3133
3537
3941
4345
1615
1719
2123
2426
2830
3234
3638
4042
4445
1715
1718
2022
2426
2729
3133
3537
3941
4344
1815
1618
2022
2325
2729
3132
3436
3840
4243
45
1915
1618
1921
2324
2628
3032
3436
3739
4143
44
2015
1617
1921
2324
2628
2931
3335
3738
4042
4345
2115
1719
2022
2426
2729
3132
3436
3839
4143
44
2215
1718
2022
2325
2728
3032
3335
3739
4042
4445
2315
1718
2021
2325
2628
3031
3335
3638
4041
4345
2415
1618
2021
2324
2628
2931
3334
3638
3941
4244
2515
1618
1921
2224
2627
2930
3234
3537
3940
4244
45
2615
1618
1921
2224
2527
2930
3233
3537
3840
4143
45
2715
1617
1920
2223
2527
2830
3133
3536
3839
4143
44
2815
1617
1920
2223
2526
2829
3133
3536
3739
4142
4445
2915
1718
2021
2324
2628
2931
3234
3537
3840
4243
45
3015
1718
2021
2324
2627
2930
3233
3537
3840
4143
44
3115
1718
2021
2224
2527
2830
3233
3536
3839
4142
4445
3215
1618
1921
2224
2527
2830
3133
3436
3839
4042
4345
3315
1618
1921
2224
2526
2829
3132
3436
3738
4042
4344
3415
1618
1920
2223
2526
2829
3132
3435
3738
4041
4344
3515
1617
1920
2223
2526
2729
3032
3335
3638
3941
4244
45
3615
1617
1920
2223
2426
2729
3032
3334
3637
3940
4243
45

21
Appendices B1–B3 (Tree volume tables)A
ppen
dix
B1. T
ree
volu
me
tabl
e (S
crib
ner v
olum
e, 3
2-fo
ot lo
gs to
5-in
ch to
p)—
cond
ense
d. F
or fu
ll ta
ble,
see
OSU
Ext
ensi
on p
ublic
atio
n EC
160
9.
Tarif
num
bers
1516
1718
1920
2122
2324
2526
2728
2930
3132
3334
3536
3738
3940
4142
4344
45
DBH (inches)
710
1010
1010
1010
1010
1010
1010
1020
2030
3030
3030
3030
3030
3030
3030
3030
810
1010
1010
1010
1010
1030
3030
3030
3030
4040
4040
4040
4040
4040
6070
7070
920
2020
2020
2020
3030
3030
3040
4040
7070
6060
6060
6060
7070
7070
7070
8080
1020
2020
2020
3030
3030
4040
6070
7060
6060
7070
8080
8080
8090
9090
9090
9090
1120
2020
3030
3030
4060
6070
7070
7070
7080
8080
9090
100
100
100
100
100
100
100
110
110
130
1220
2030
3030
4060
6080
8080
7070
8090
9090
9090
100
100
100
100
120
120
120
150
150
150
150
150
1320
3030
3060
6070
8080
7080
8090
9090
110
110
120
120
120
120
120
120
130
150
150
150
150
160
200
200
1430
3030
6060
7080
9080
8080
110
110
110
110
120
120
120
150
150
150
180
180
180
180
190
190
200
200
200
220
1530
3060
7070
8090
8080
110
110
110
110
140
150
150
150
150
150
170
180
200
210
210
210
220
230
230
230
240
240
1630
6070
7090
9080
100
110
110
140
140
150
150
150
170
170
170
190
200
210
210
210
220
230
230
250
260
280
280
280
1750
6070
9090
110
100
110
140
140
140
150
170
170
170
170
170
220
220
230
230
230
250
250
250
270
280
280
280
280
310
1860
7080
9011
010
013
014
014
016
016
017
017
019
019
019
022
022
023
023
027
028
028
030
030
031
031
034
034
034
037
0
1970
8080
110
110
130
140
160
160
160
190
190
190
190
190
240
260
260
270
270
280
300
300
300
380
380
380
380
400
430
430
2070
8011
011
013
013
016
016
018
019
019
019
022
022
024
026
026
031
031
034
034
034
037
038
038
038
040
040
043
044
044
0
2180
8011
014
013
016
016
018
018
019
022
022
022
028
029
030
031
031
033
034
042
042
043
045
045
045
045
050
051
051
052
0
2280
100
140
140
150
180
180
180
220
220
220
260
260
280
300
360
360
380
390
420
420
420
450
450
490
510
540
550
550
590
600
2380
110
140
160
170
180
210
210
220
260
260
260
330
350
350
360
380
380
460
460
480
490
490
510
510
530
580
580
590
600
670
2410
014
016
015
018
021
021
025
026
026
031
031
033
039
040
042
042
046
046
048
054
056
056
056
061
062
063
064
069
071
071
0
2510
014
016
017
021
021
025
026
031
031
031
037
039
040
040
042
050
051
053
053
056
056
059
061
068
069
074
075
077
077
086
0
2613
016
018
017
021
025
025
031
031
035
035
037
044
045
047
050
051
053
059
061
062
065
065
067
073
074
074
082
082
085
091
0
2713
016
018
020
025
025
030
031
035
035
040
042
044
045
053
056
059
059
061
062
070
070
076
078
078
084
087
087
090
095
097
0
2813
018
021
020
025
030
034
035
035
040
042
049
051
053
056
059
064
066
066
070
070
074
076
083
092
094
095
010
2010
2010
5010
50
2915
018
021
024
030
034
034
040
040
046
048
050
056
058
061
064
066
066
078
078
082
084
091
091
092
099
010
2010
2010
5011
2011
20
3015
018
025
024
030
034
039
040
046
046
053
055
058
061
071
074
074
077
082
082
092
094
096
010
1010
3010
7011
2011
4011
7011
7012
00
3115
021
025
029
034
039
039
046
046
051
053
064
066
069
071
074
082
082
087
092
092
098
010
1010
3011
5011
8012
0012
3012
9013
2013
40
3215
021
025
033
034
039
045
046
051
059
062
064
071
076
078
079
082
086
098
098
010
4010
6011
2011
4011
8012
6012
6012
9013
2013
2014
40
3317
021
030
033
039
045
050
051
059
059
067
069
074
076
085
088
092
098
098
010
2011
2011
9012
2012
5013
2013
4013
7014
5014
5015
1015
30
3417
025
030
033
045
045
050
059
059
064
067
077
080
082
085
088
010
0010
6011
0011
0011
8012
0012
8013
2013
4014
7014
8015
1015
5016
6017
20
3517
025
034
038
045
050
058
059
064
066
073
077
082
092
096
010
0010
5011
0011
6012
3012
4013
2013
4014
3014
5014
7015
1016
3016
5017
2017
30
3617
025
034
038
050
058
058
064
070
072
082
085
090
092
010
2010
6011
1011
6012
1012
3013
1014
5015
3015
6015
8017
0017
0017
4018
1018
8019
50

22
App
endi
x B2
. Tre
e vo
lum
e ta
ble
(Scr
ibne
r vol
ume,
16-
foot
logs
to 5
-inch
top)
—co
nden
sed.
For
full
tabl
e, s
ee O
SU E
xten
sion
pub
licat
ion
EC 1
609.
Tarif
num
bers
1516
1718
1920
2122
2324
2526
2728
2930
3132
3334
3536
3738
3940
4142
4344
45
DBH (inches)
70
00
00
00
00
00
00
030
3030
3030
3030
3040
4040
4040
4040
4040
810
1010
1010
1010
1010
1030
3030
3040
4040
5050
5050
5050
5050
5050
5060
6060
910
1010
1010
1010
3030
3040
4050
6060
6070
6060
6060
6070
7070
7070
8080
8080
1010
1010
1010
4040
5050
6060
6070
7060
6060
6080
8080
8090
9090
9090
9090
100
100
1110
1010
4040
5050
6060
6070
7070
7070
8080
8080
9090
100
100
100
100
110
110
120
120
130
130
1210
1040
5050
6060
6070
9090
8080
9090
9010
010
010
010
010
010
011
012
013
013
014
014
014
014
014
0
1310
4050
5070
7070
9090
8080
110
110
110
120
120
130
130
140
140
150
150
150
150
160
160
160
160
160
180
200
1440
6060
7070
100
110
110
100
100
110
110
120
130
140
140
150
150
150
180
180
180
190
190
190
200
210
220
220
220
230
1560
6090
9010
011
011
011
011
013
013
013
014
014
017
017
017
018
019
019
020
021
022
023
023
024
024
024
027
027
027
0
1680
8090
110
120
120
110
120
140
140
140
170
180
180
180
180
200
200
210
220
220
230
230
250
260
260
290
300
300
310
320
1780
100
110
110
130
130
130
140
160
160
190
200
210
210
210
220
230
230
250
250
280
280
290
290
290
310
320
320
330
330
340
1890
110
120
130
140
150
160
180
180
190
210
210
210
220
250
250
250
260
290
290
290
300
330
330
350
350
360
360
400
400
400
1911
012
012
016
016
017
018
019
021
022
022
023
023
025
025
025
030
034
034
035
036
036
037
038
039
042
043
044
044
044
046
0
2012
014
014
016
018
019
020
020
025
026
026
026
029
030
032
033
034
035
036
036
039
039
040
042
043
045
048
049
049
051
051
0
2114
014
017
019
021
023
023
025
026
026
030
031
032
034
036
038
038
038
039
041
041
047
049
050
051
052
052
053
054
057
059
0
2215
016
020
022
022
023
026
028
030
030
031
032
035
037
039
040
044
044
046
048
050
051
052
053
054
057
059
060
063
063
066
0
2315
019
022
025
025
026
026
032
032
034
034
037
037
042
043
044
044
050
051
055
056
059
059
059
062
062
063
069
071
072
073
0
2418
023
024
024
028
028
031
032
036
037
042
043
044
045
049
049
052
053
055
056
059
061
062
067
067
072
073
076
077
079
082
0
2521
023
027
026
028
033
035
036
037
042
043
047
049
052
052
055
057
061
061
063
067
068
069
072
074
080
082
083
084
086
087
0
2621
026
027
030
033
033
039
039
043
045
049
049
051
060
060
062
065
065
069
074
075
075
081
083
084
087
087
089
092
096
010
00
2723
030
031
033
036
037
042
047
052
051
053
056
060
060
062
065
071
072
075
079
079
085
088
089
093
094
098
010
0010
2010
5010
60
2828
030
034
035
041
044
046
049
052
056
058
058
065
066
067
072
074
079
082
082
085
088
091
093
097
010
2010
7010
9011
4011
5011
70
2928
034
040
039
041
047
050
051
057
056
061
066
069
073
078
079
082
084
087
093
095
098
099
010
7010
8010
8011
4011
6011
9012
3012
50
3031
038
040
042
046
049
053
058
059
064
066
071
072
076
083
091
092
096
098
010
0010
6010
9011
3011
5011
7012
4012
6013
0013
2013
6013
80
3136
038
043
042
049
052
056
063
067
072
074
077
084
085
089
091
094
010
0010
3010
5011
1011
4012
2012
2012
5012
8013
4013
6014
4014
8015
20
3238
042
046
048
056
059
064
066
071
076
081
083
087
091
094
098
010
0010
5010
7011
8012
0012
2012
5012
7013
4013
8014
0014
7014
8015
4015
60
3338
045
046
053
058
061
066
072
073
080
081
088
097
099
010
3011
0011
3011
5012
2012
4012
8013
4014
4014
5014
9015
2015
9016
1016
9017
0017
40
3441
050
054
057
060
064
075
078
083
087
092
094
010
0010
5011
0011
2012
2012
7013
3014
1014
2014
6014
8015
5015
8016
2016
8017
2017
6018
4018
60
3546
051
056
057
069
073
077
082
091
093
099
010
3010
8011
2011
9012
4012
7013
5013
9014
3014
8015
2015
7015
9016
7017
3017
5017
8018
8018
8019
70
3646
053
064
065
073
077
085
089
091
096
010
6011
3011
8012
2012
9013
2014
1014
2014
8015
2015
3016
0017
1018
0018
1018
6019
4019
5020
4021
2021
60

23
App
endi
x B3
. Tre
e vo
lum
e ta
ble
(cub
ic v
olum
e, to
4-in
ch to
p)—
cond
ense
d. F
or fu
ll ta
ble,
see
OSU
Ext
ensi
on p
ublic
atio
n EC
160
9.
Tarif
num
bers
1516
1718
1920
2122
2324
2526
2728
2930
3132
3334
3536
3738
3940
4142
4344
45
DBH (inches)
73
33
44
44
45
55
55
66
66
67
77
77
78
88
88
99
84
55
55
66
67
77
78
88
99
99
1010
1011
1111
1112
1212
1313
96
67
77
88
99
910
1010
1111
1212
1213
1314
1414
1515
1616
1617
1717
108
89
910
1011
1112
1213
1314
1415
1516
1617
1718
1819
1920
2021
2122
2223
119
1011
1112
1313
1414
1516
1617
1818
1919
2021
2122
2323
2424
2526
2627
2828
1211
1213
1415
1516
1718
1819
2021
2122
2324
2425
2627
2828
2930
3131
3233
3434
1314
1516
1617
1819
2021
2223
2425
2627
2728
2930
3132
3334
3536
3737
3839
4041
1416
1718
1920
2223
2425
2627
2829
3031
3233
3435
3738
3940
4142
4344
4546
4748
1519
2021
2224
2526
2729
3031
3234
3536
3739
4041
4244
4546
4749
5051
5254
5556
1622
2324
2627
2930
3233
3436
3739
4042
4344
4647
4950
5253
5456
5759
6062
6365
1724
2628
2931
3334
3638
3941
4244
4647
4951
5254
5557
5960
6264
6567
6970
7273
1828
2931
3335
3739
4042
4446
4850
5253
5557
5961
6364
6668
7072
7475
7779
8183
1931
3335
3739
4143
4547
4952
5456
5860
6264
6668
7072
7476
7880
8285
8789
9193
2034
3739
4144
4648
5053
5557
6062
6467
6971
7376
7880
8385
8789
9294
9699
101
103
2138
4143
4648
5153
5658
6163
6669
7174
7679
8184
8689
9194
9799
102
104
107
109
112
114
2242
4548
5053
5659
6264
6770
7376
7881
8487
8992
9598
101
103
106
109
112
115
117
120
123
126
2346
4952
5558
6164
6771
7477
8083
8689
9295
9810
110
410
711
011
311
612
012
312
612
913
213
513
8
2450
5457
6064
6770
7477
8084
8790
9497
100
104
107
110
114
117
120
124
127
131
134
137
141
144
147
151
2555
5862
6669
7376
8084
8791
9598
102
106
109
113
116
120
124
127
131
135
138
142
146
149
153
156
160
164
2659
6367
7175
7983
8791
9599
103
106
110
114
118
122
126
130
134
138
142
146
150
154
158
162
166
170
174
177
2764
6872
7781
8589
9498
102
107
111
115
119
124
128
132
136
141
145
149
153
158
162
166
170
175
179
183
187
192
2869
7378
8387
9296
101
106
110
115
119
124
129
133
138
142
147
151
5616
116
517
017
417
918
418
819
319
720
220
7
2974
7984
8994
9910
410
811
311
812
312
813
313
814
314
815
315
816
316
817
317
718
218
719
219
720
220
721
221
722
2
3079
8590
9510
010
611
111
612
112
713
213
714
314
815
315
816
416
917
418
018
519
019
520
120
621
121
722
222
723
223
8
3185
9096
102
107
113
119
124
130
136
141
147
152
158
164
169
175
181
186
192
198
203
209
215
220
226
232
237
243
248
254
3290
9610
210
811
412
012
613
313
914
515
115
716
316
917
518
118
719
319
920
521
121
722
322
923
524
124
725
325
926
527
1
3396
103
109
115
122
128
135
141
147
154
160
167
173
180
186
192
199
205
212
218
224
231
237
244
250
256
263
269
276
282
289
3410
210
911
612
312
913
614
315
015
716
317
017
718
419
119
820
421
121
822
523
223
824
525
225
926
627
227
928
629
330
030
7
3510
811
612
313
013
714
415
215
916
617
318
118
819
520
221
021
722
423
123
824
625
326
026
727
528
228
929
630
331
131
832
5
3611
512
213
013
814
515
316
116
817
618
419
119
920
721
422
222
923
724
525
226
026
827
528
329
129
830
631
432
132
933
734
4
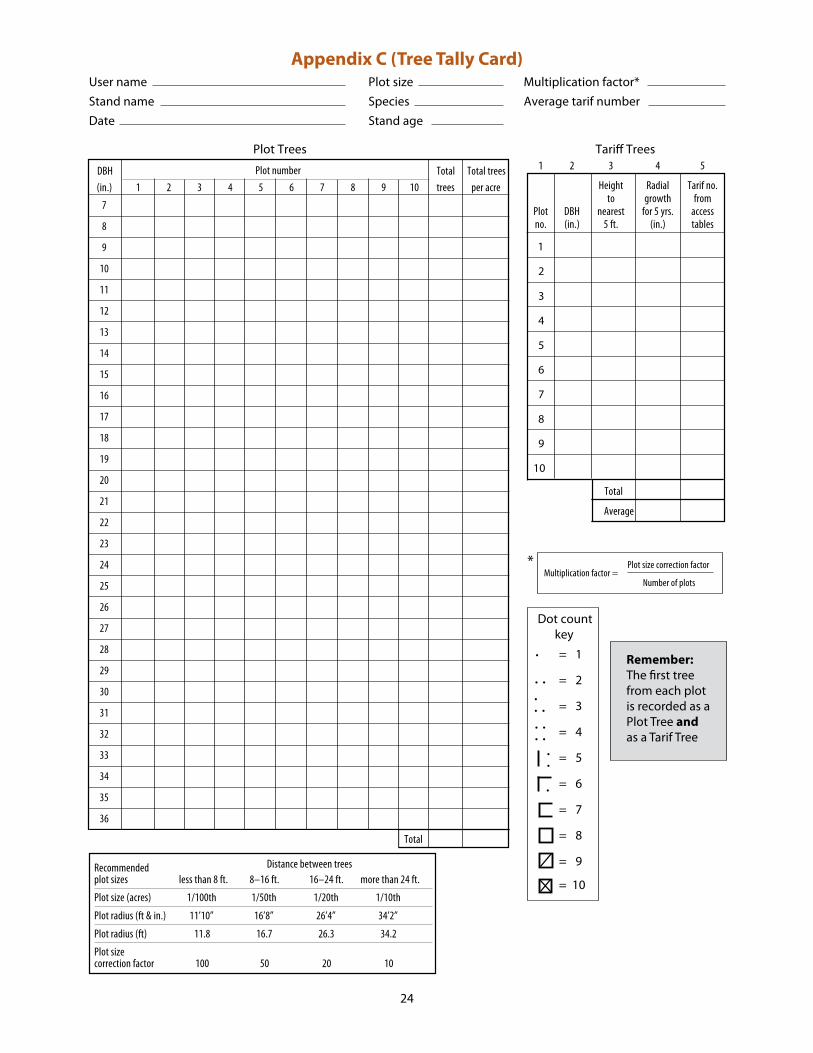
24
Appendix C (Tree Tally Card)User name Plot size Multiplication factor*Stand name Species Average tarif numberDate Stand age
Recommendedplot sizes less than 8 ft. 8–16 ft. 16–24 ft. more than 24 ft.
Plot size (acres) 1/100th 1/50th 1/20th 1/10th
Plot radius (ft & in.) 11’10” 16’8” 26’4” 34’2”
Plot radius (ft) 11.8 16.7 26.3 34.2
Plot sizecorrection factor 100 50 20 10
Distance between trees
DBH Total Total trees(in.) 10 trees per acre
7
8
9
10
11
12
13
14
15
16
17
18
19
20
21
22
23
24
25
26
27
28
29
30
31
32
33
34
35
36
Total
Plot number
Plot Trees Tari� Trees
1
2
3
4
5
6
7
8
9
10
Total
Average
Height Radial Tarif no.to growth from
Plot DBH nearest for 5 yrs. accessno. (in.) 5 ft. (in.) tables
= 1
= 2
= 3
= 4
= 5
= 6
= 7
= 8
=
=
9
10
•
Dot countkey
• •• •
•
• •
•• •
••
Multiplication factor =Plot size correction factor
Number of plots
*
98765
5
4
4
3
3
2
2
1
1
Remember:The �rst tree from each plot is recorded as a Plot Tree and as a Tarif Tree
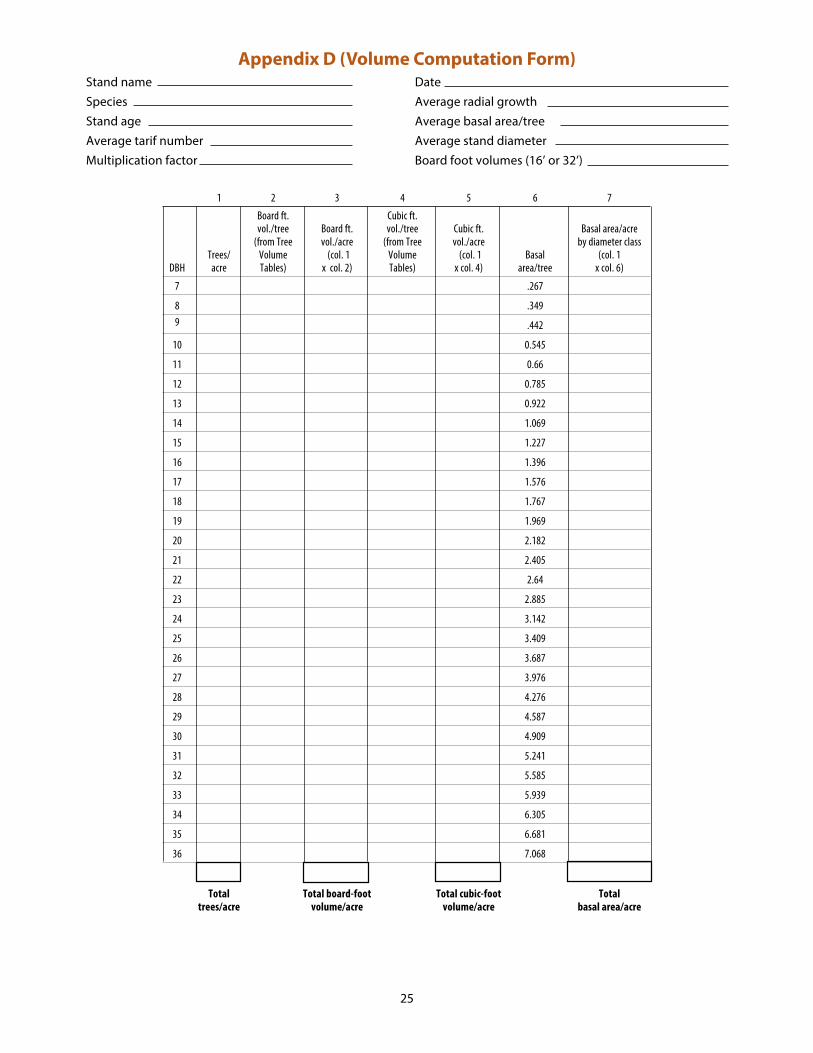
25
Appendix D (Volume Computation Form)
7654321
Board ft. Cubic ft.vol./tree Board ft. vol./tree Cubic ft. Basal area/acre
(from Tree vol./acre (from Tree vol./acre by diameter classTrees/ Volume (col. 1 Volume (col. 1 Basal (col. 1
DBH acre Tables) x col. 2) Tables) x col. 4) area/tree x col. 6)
.267
.349
.442
10 0.545
11 0.66
12 0.785
13 0.922
14 1.069
15 1.227
16 1.396
17 1.576
18 1.767
19 1.969
20 2.182
21 2.405
22 2.64
23 2.885
24 3.142
25 3.409
26 3.687
27 3.976
28 4.276
29 4.587
30 4.909
31 5.241
32 5.585
33 5.939
34 6.305
35 6.681
36 7.068
Total Total board-foot Total cubic-foot Totaltrees/acre volume/acre volume/acre basal area/acre
Stand name DateSpecies Average radial growthStand age Average basal area/treeAverage tarif number Average stand diameterMultiplication factor Board foot volumes (16’ or 32’)
7
89

26
Trade-name products and services are mentioned as illustrations only. This does not mean that the Oregon State University Extension Service either endorses these products and services or intends to discriminate against products and services not mentioned. © 2013 Oregon State University. Extension work is a cooperative program of Oregon State University, the U.S. Department of Agriculture, and Oregon coun-ties. Oregon State University Extension Service offers educational programs, activities, and materials without discrimination based on age, color, disability, gender identity or expression, genetic information, marital status, national origin, race, religion, sex, sexual orientation, or veteran’s status. Oregon State University Extension Service is an Equal Opportunity Employer. Published April 2013.


![MEASURING WOOD DENSITY FOR TROPICAL FOREST TREES …1].pdf · Measuring wood density for tropical forest trees field manual ... as well as its exact dbh. ... Measuring wood density](https://img.pdfslide.us/doc/110x75/5a8f0aea7f8b9a085a8d8bee/measuring-wood-density-for-tropical-forest-trees-1pdfmeasuring-wood-density.jpg)