Embed Size (px)
Citation preview
Templ ref: PPT-ISO-colour.001 Doc Ref no: Air Quality Lekgotla: 6-7 Oct 2014; KZN
Measuring trace gases at Cape Point GAW: Operation, Data management and QA/QC procedures
E-G. Brunke, C. Labuschagne, N. Mbatha, L. Martin, T. Mkololo, G. Coetzee and D. vd Spuy
Templ ref: PPT-ISO-colour.001 Doc Ref no: Air Quality Lekgotla: 6-7 Oct 2014; KZN
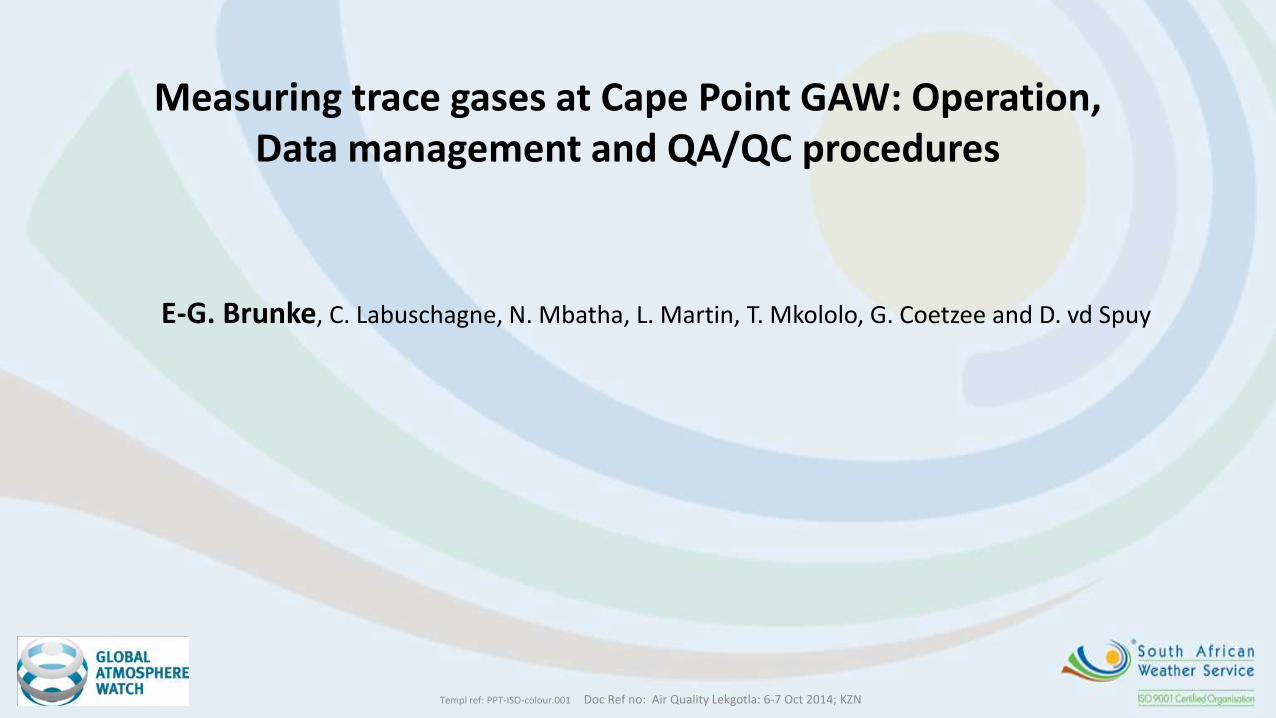
Measuring of trace gases at Cape Point
Outline of Talk
1. What is Global Atmosphere Watch (GAW) ?
2. Measuring program and a few trace gas results
3. The need for Quality Assurance and Control (QA/QC)
4. Calibration scales, traceability and audits
5. Operation of Station (instrumental parameters)
6. Data Management and Protocols
7. QA/QC Procedures within GAW
Templ ref: PPT-ISO-colour.001 Doc Ref no: Air Quality Lekgotla: 6-7 Oct 2014; KZN
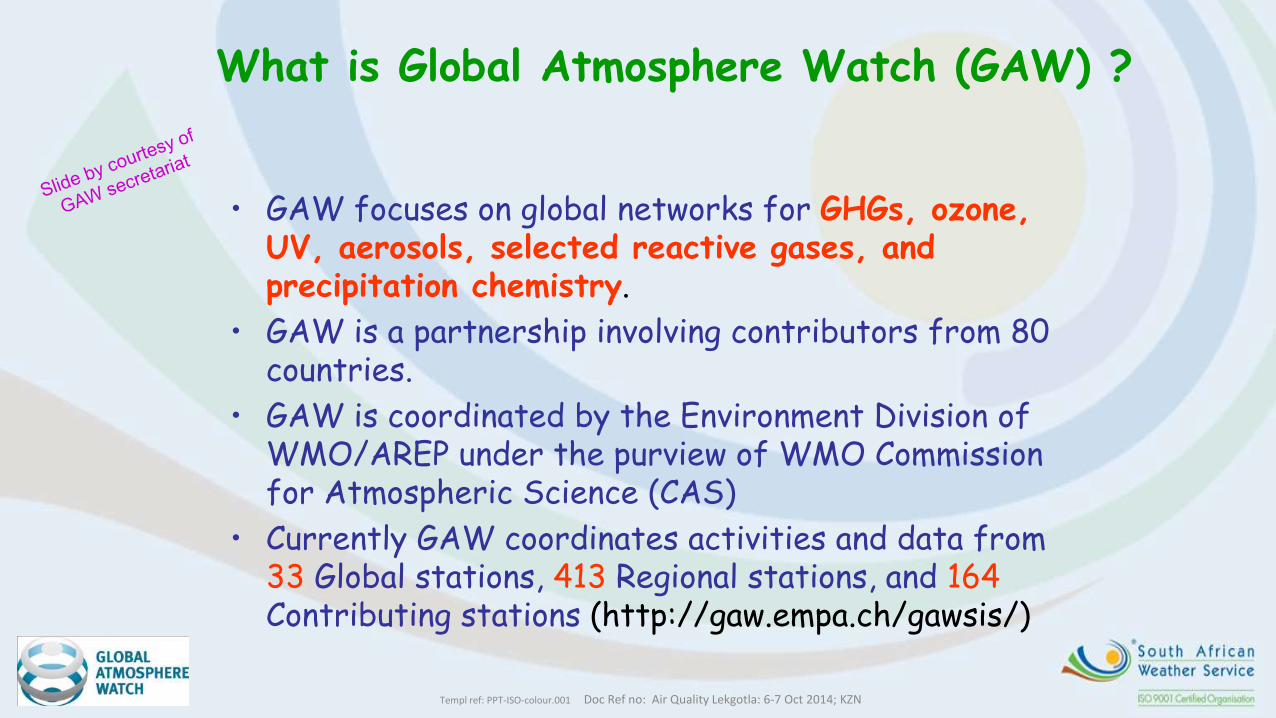
What is Global Atmosphere Watch (GAW) ?
• GAW focuses on global networks for GHGs, ozone, UV, aerosols, selected reactive gases, and precipitation chemistry.
• GAW is a partnership involving contributors from 80 countries.
• GAW is coordinated by the Environment Division of WMO/AREP under the purview of WMO Commission for Atmospheric Science (CAS)
• Currently GAW coordinates activities and data from 33 Global stations, 413 Regional stations, and 164 Contributing stations (http://gaw.empa.ch/gawsis/)
Templ ref: PPT-ISO-colour.001 Doc Ref no: Air Quality Lekgotla: 6-7 Oct 2014; KZN
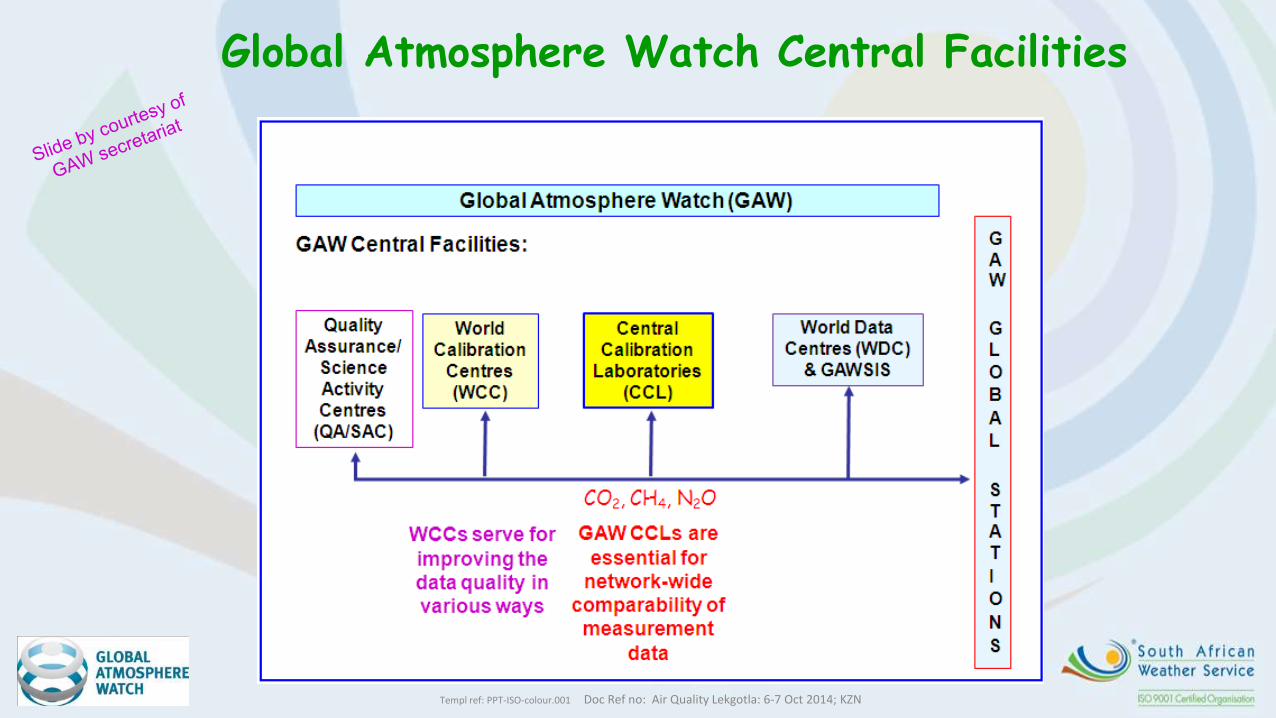
Global Atmosphere Watch Central Facilities
Templ ref: PPT-ISO-colour.001 Doc Ref no: Air Quality Lekgotla: 6-7 Oct 2014; KZN
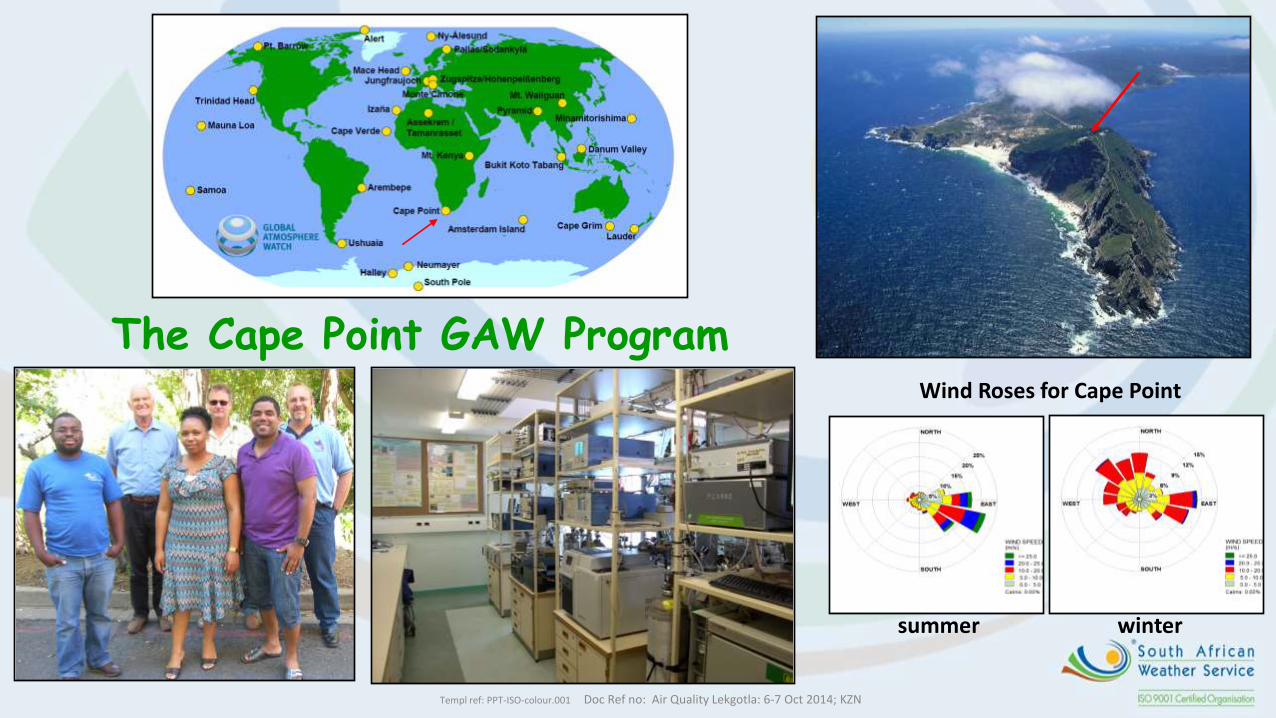
The Cape Point GAW Program
summer winter
Wind Roses for Cape Point
Templ ref: PPT-ISO-colour.001 Doc Ref no: Air Quality Lekgotla: 6-7 Oct 2014; KZN
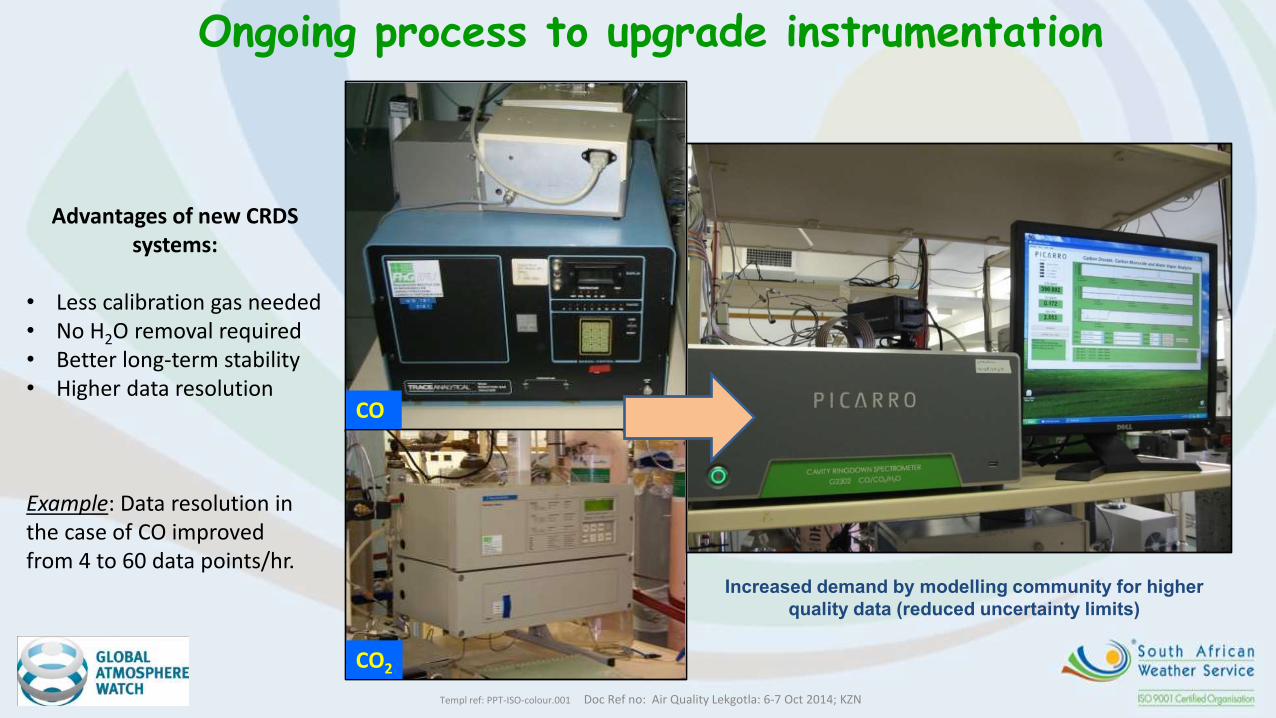
Ongoing process to upgrade instrumentation
CO2
Increased demand by modelling community for higher
quality data (reduced uncertainty limits)
CO
Advantages of new CRDS systems:
• Less calibration gas needed • No H2O removal required • Better long-term stability • Higher data resolution Example: Data resolution in the case of CO improved from 4 to 60 data points/hr.
Templ ref: PPT-ISO-colour.001 Doc Ref no: Air Quality Lekgotla: 6-7 Oct 2014; KZN
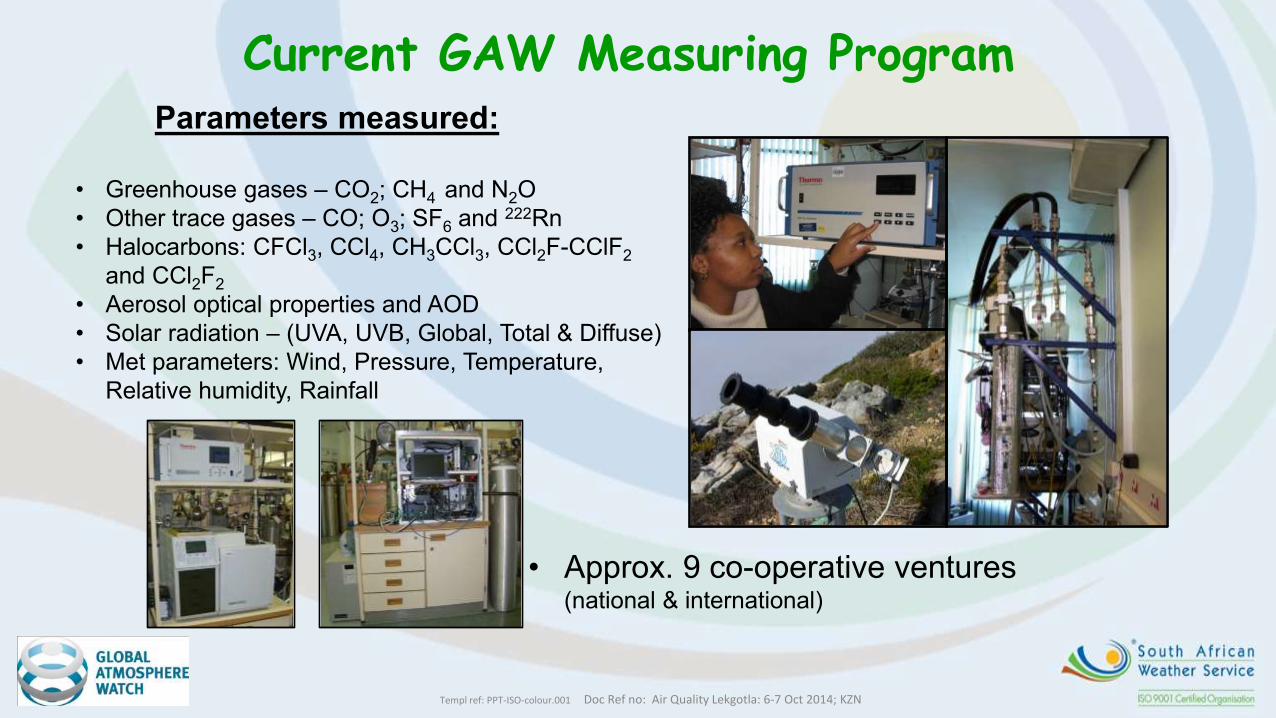
Current GAW Measuring Program Parameters measured:
• Greenhouse gases – CO2; CH4 and N2O
• Other trace gases – CO; O3; SF6 and 222Rn
• Halocarbons: CFCl3, CCl4, CH3CCl3, CCl2F-CClF2
and CCl2F2
• Aerosol optical properties and AOD
• Solar radiation – (UVA, UVB, Global, Total & Diffuse)
• Met parameters: Wind, Pressure, Temperature,
Relative humidity, Rainfall
• Approx. 9 co-operative ventures (national & international)
Templ ref: PPT-ISO-colour.001 Doc Ref no: Air Quality Lekgotla: 6-7 Oct 2014; KZN
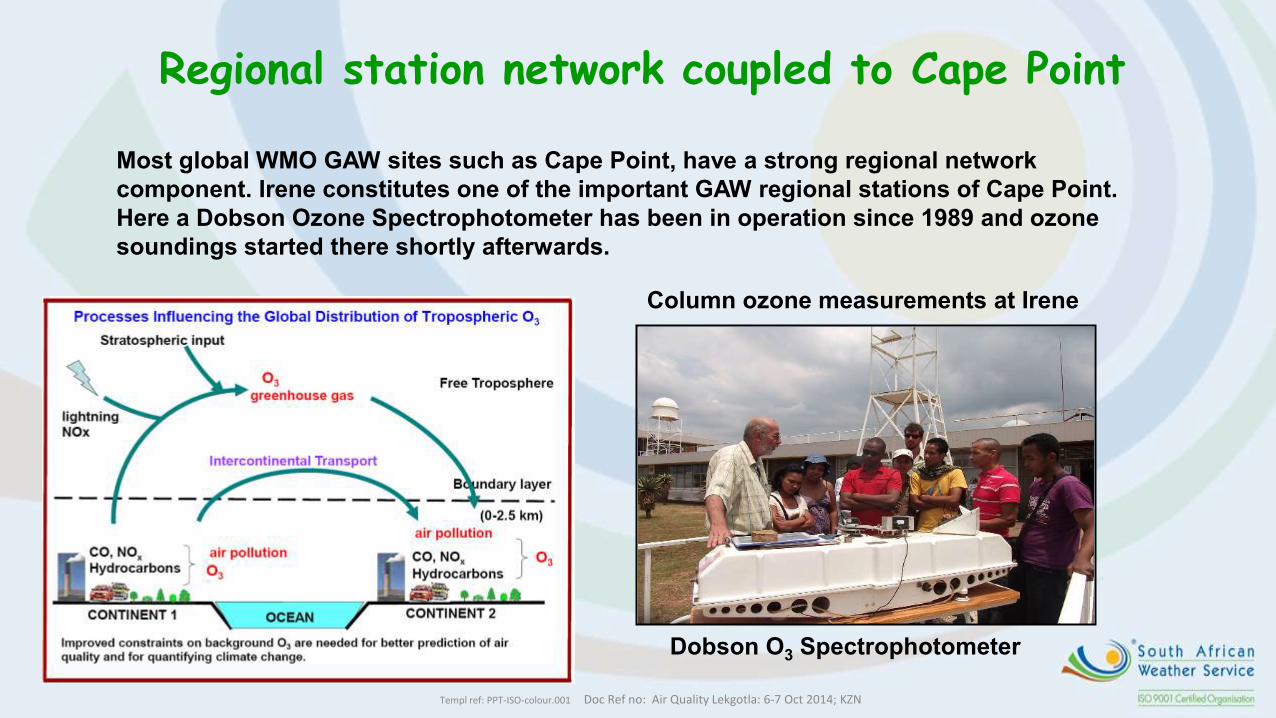
Regional station network coupled to Cape Point
Most global WMO GAW sites such as Cape Point, have a strong regional network
component. Irene constitutes one of the important GAW regional stations of Cape Point.
Here a Dobson Ozone Spectrophotometer has been in operation since 1989 and ozone
soundings started there shortly afterwards.
Column ozone measurements at Irene
Dobson O3 Spectrophotometer
Templ ref: PPT-ISO-colour.001 Doc Ref no: Air Quality Lekgotla: 6-7 Oct 2014; KZN
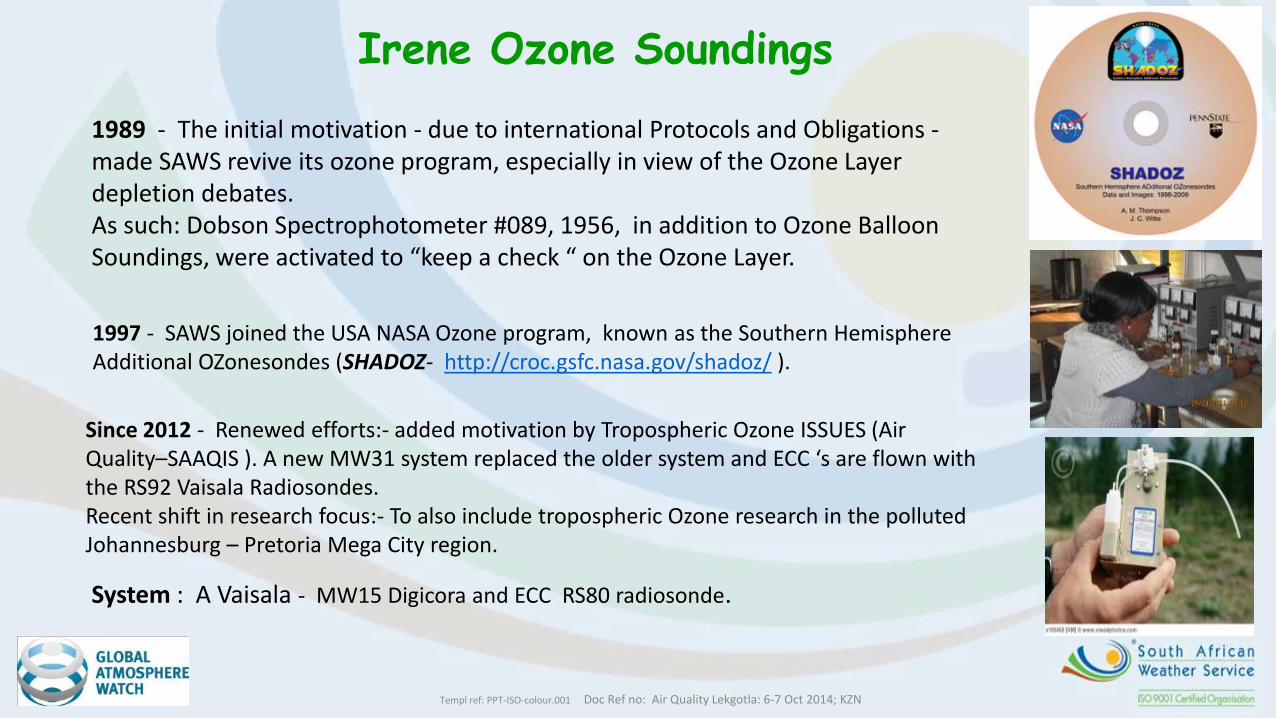
Irene Ozone Soundings
Since 2012 - Renewed efforts:- added motivation by Tropospheric Ozone ISSUES (Air Quality–SAAQIS ). A new MW31 system replaced the older system and ECC ‘s are flown with the RS92 Vaisala Radiosondes. Recent shift in research focus:- To also include tropospheric Ozone research in the polluted Johannesburg – Pretoria Mega City region.
System : A Vaisala - MW15 Digicora and ECC RS80 radiosonde.
1997 - SAWS joined the USA NASA Ozone program, known as the Southern Hemisphere Additional OZonesondes (SHADOZ- http://croc.gsfc.nasa.gov/shadoz/ ).
1989 - The initial motivation - due to international Protocols and Obligations - made SAWS revive its ozone program, especially in view of the Ozone Layer depletion debates. As such: Dobson Spectrophotometer #089, 1956, in addition to Ozone Balloon Soundings, were activated to “keep a check “ on the Ozone Layer.
Templ ref: PPT-ISO-colour.001 Doc Ref no: Air Quality Lekgotla: 6-7 Oct 2014; KZN
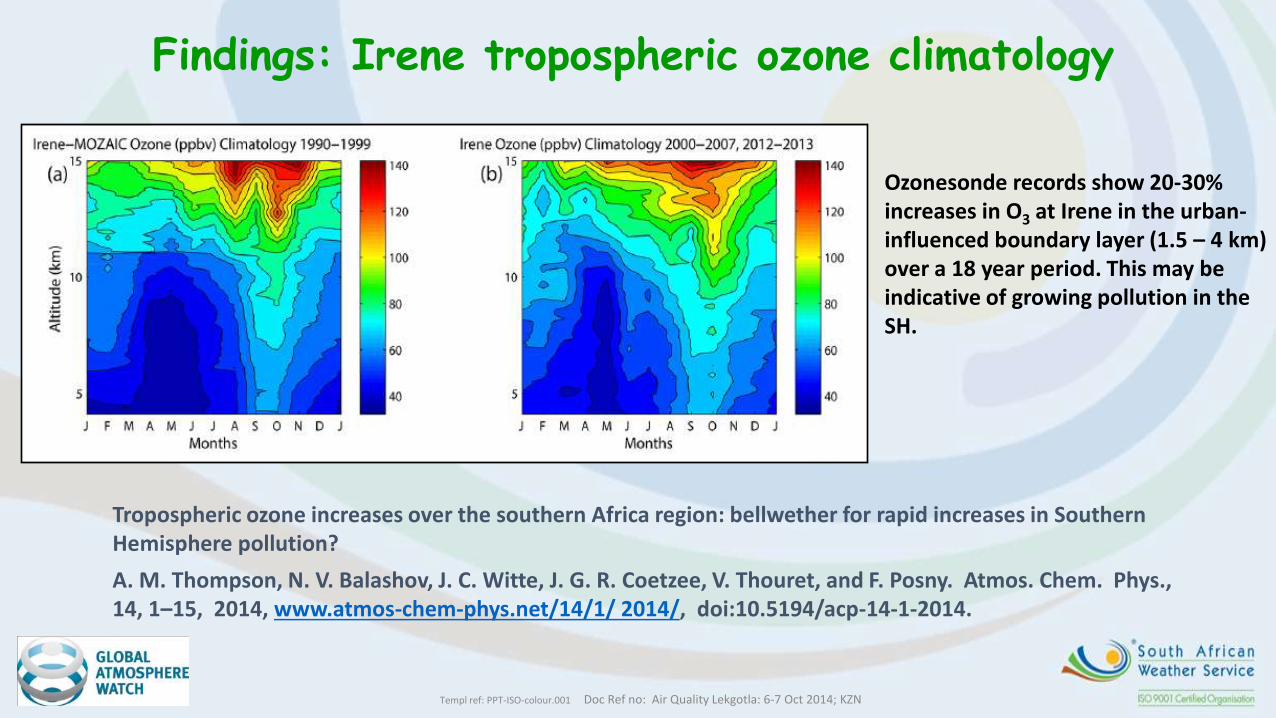
Findings: Irene tropospheric ozone climatology
Tropospheric ozone increases over the southern Africa region: bellwether for rapid increases in Southern Hemisphere pollution?
A. M. Thompson, N. V. Balashov, J. C. Witte, J. G. R. Coetzee, V. Thouret, and F. Posny. Atmos. Chem. Phys., 14, 1–15, 2014, www.atmos-chem-phys.net/14/1/ 2014/, doi:10.5194/acp-14-1-2014.
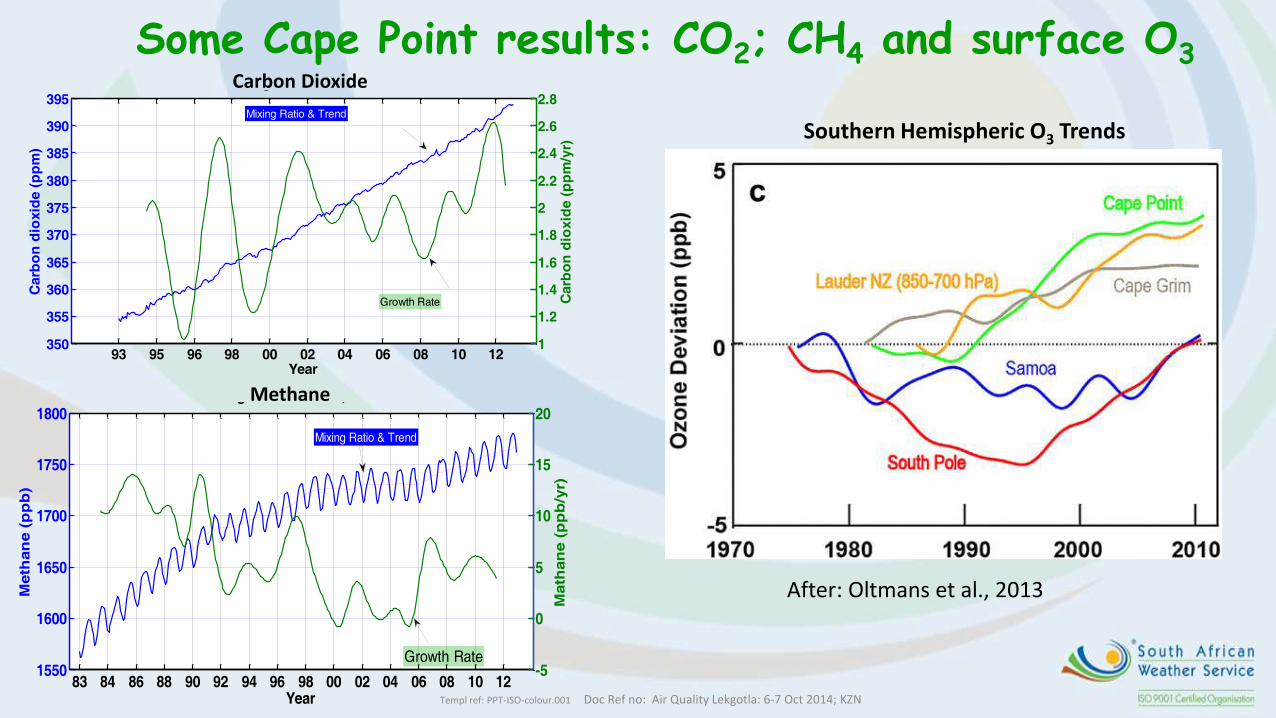
Ozonesonde records show 20-30% increases in O3 at Irene in the urban- influenced boundary layer (1.5 – 4 km) over a 18 year period. This may be indicative of growing pollution in the SH.
Templ ref: PPT-ISO-colour.001 Doc Ref no: Air Quality Lekgotla: 6-7 Oct 2014; KZN
Some Cape Point results: CO2; CH4 and surface O3 C
arb
on
dio
xid
e (
pp
m)
Mixing Ratio & Trend
Growth Rate
Carbon dioxide Mixing Ratio & Trend, and Growth Rate
Year93 95 96 98 00 02 04 06 08 10 12
350
355
360
365
370
375
380
385
390
395
1
1.2
1.4
1.6
1.8
2
2.2
2.4
2.6
2.8
Carb
on
dio
xid
e (
pp
m/y
r)
Carbon Dioxide
Meth
an
e (
pp
b)
Mixing Ratio & Trend
Growth Rate
Methane Mixing Ratio & Trend, and Growth Rate
Year83 84 86 88 90 92 94 96 98 00 02 04 06 08 10 12
1550
1600
1650
1700
1750
1800
-5
0
5
10
15
20
Math
an
e (
pp
b/y
r)
Methane
After: Oltmans et al., 2013
Southern Hemispheric O3 Trends
Templ ref: PPT-ISO-colour.001 Doc Ref no: Air Quality Lekgotla: 6-7 Oct 2014; KZN
The need for quality control
•Detect small trends (via Data Quality Objectives [DQOs])
•Detect small spatial gradients (e.g. between hemispheres)
•Ensure long-term stability of observations
•Data comparability (on the same scale)
The 2nd International Workshop on Atmosphere Watch in Asia “Greenhouse Gases Monitoring Activities”, Oct. 21-22, 2010
comparability: Measurement results that are metrologically traceable to the same reference standard
Templ ref: PPT-ISO-colour.001 Doc Ref no: Air Quality Lekgotla: 6-7 Oct 2014; KZN
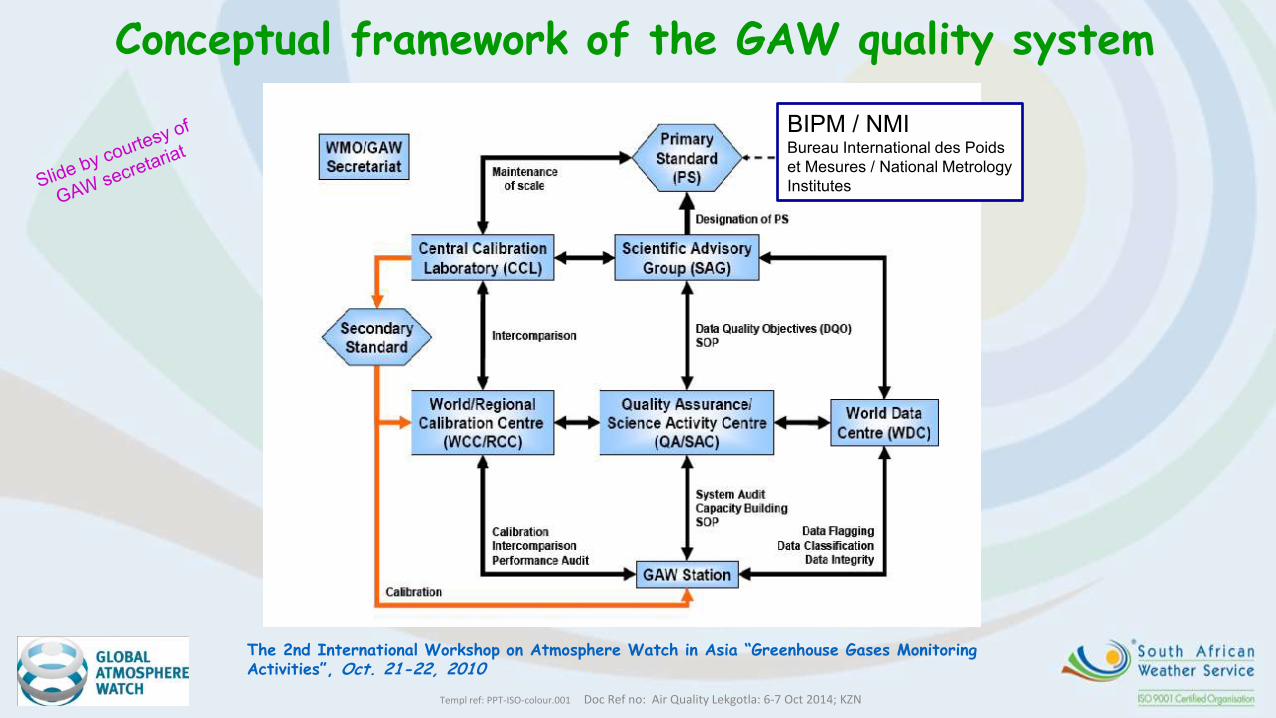
Conceptual framework of the GAW quality system
The 2nd International Workshop on Atmosphere Watch in Asia “Greenhouse Gases Monitoring Activities”, Oct. 21-22, 2010
BIPM / NMI Bureau International des Poids
et Mesures / National Metrology
Institutes
Templ ref: PPT-ISO-colour.001 Doc Ref no: Air Quality Lekgotla: 6-7 Oct 2014; KZN
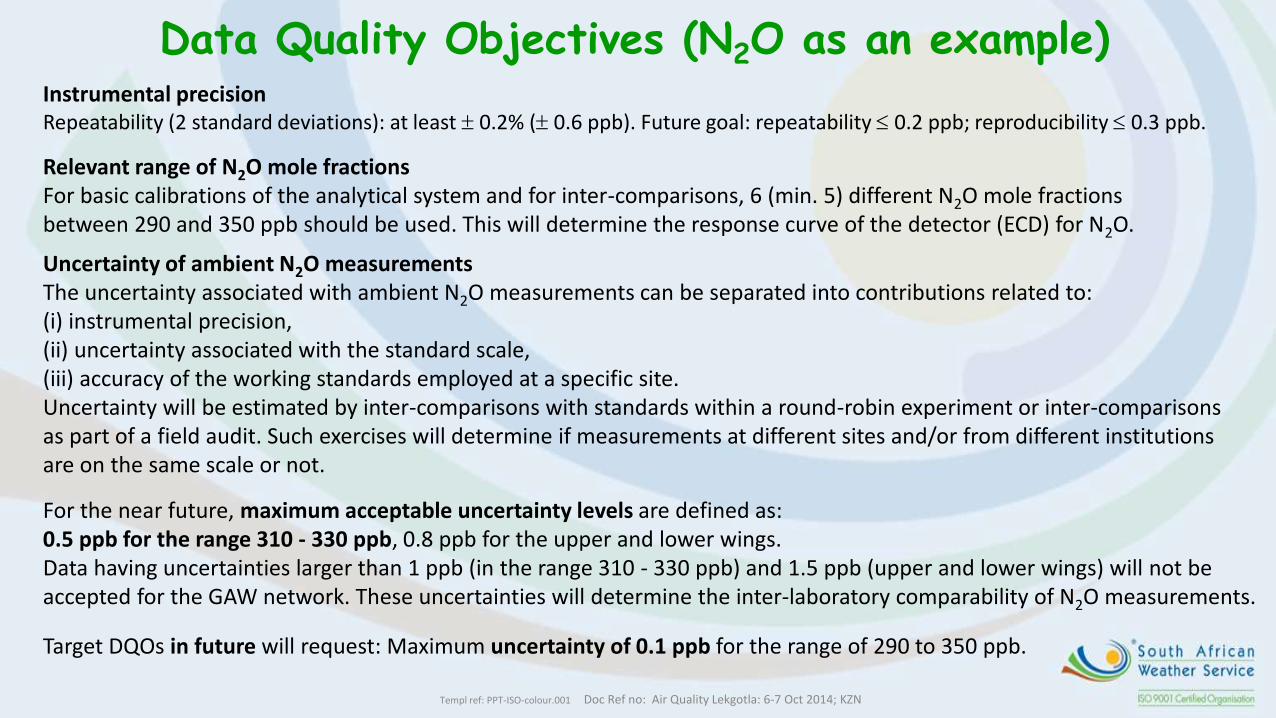
Data Quality Objectives (N2O as an example) Instrumental precision Repeatability (2 standard deviations): at least 0.2% ( 0.6 ppb). Future goal: repeatability 0.2 ppb; reproducibility 0.3 ppb.
Relevant range of N2O mole fractions For basic calibrations of the analytical system and for inter-comparisons, 6 (min. 5) different N2O mole fractions between 290 and 350 ppb should be used. This will determine the response curve of the detector (ECD) for N2O.
Uncertainty of ambient N2O measurements The uncertainty associated with ambient N2O measurements can be separated into contributions related to: (i) instrumental precision, (ii) uncertainty associated with the standard scale, (iii) accuracy of the working standards employed at a specific site. Uncertainty will be estimated by inter-comparisons with standards within a round-robin experiment or inter-comparisons as part of a field audit. Such exercises will determine if measurements at different sites and/or from different institutions are on the same scale or not.
For the near future, maximum acceptable uncertainty levels are defined as: 0.5 ppb for the range 310 - 330 ppb, 0.8 ppb for the upper and lower wings. Data having uncertainties larger than 1 ppb (in the range 310 - 330 ppb) and 1.5 ppb (upper and lower wings) will not be accepted for the GAW network. These uncertainties will determine the inter-laboratory comparability of N2O measurements.
Target DQOs in future will request: Maximum uncertainty of 0.1 ppb for the range of 290 to 350 ppb.
Templ ref: PPT-ISO-colour.001 Doc Ref no: Air Quality Lekgotla: 6-7 Oct 2014; KZN
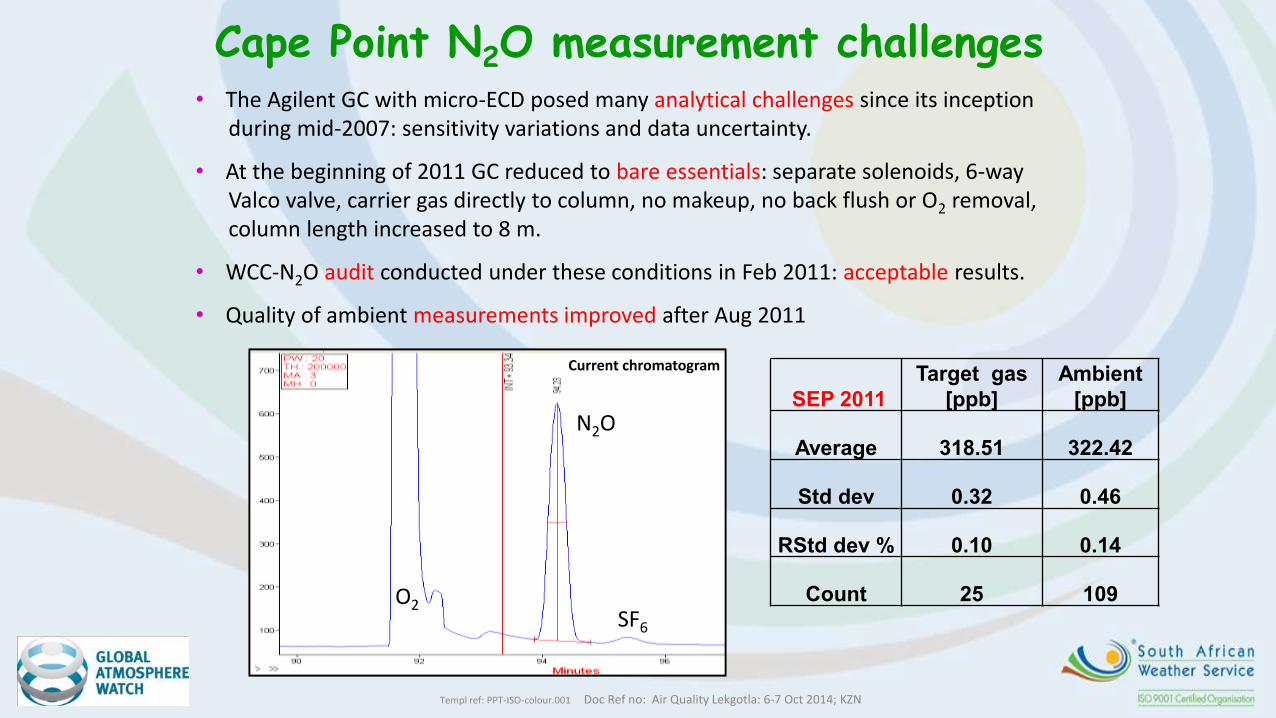
• The Agilent GC with micro-ECD posed many analytical challenges since its inception during mid-2007: sensitivity variations and data uncertainty.
• At the beginning of 2011 GC reduced to bare essentials: separate solenoids, 6-way Valco valve, carrier gas directly to column, no makeup, no back flush or O2 removal, column length increased to 8 m.
• WCC-N2O audit conducted under these conditions in Feb 2011: acceptable results.
• Quality of ambient measurements improved after Aug 2011
Cape Point N2O measurement challenges
Current chromatogram
O2
N2O
SF6
SEP 2011
Target gas
[ppb]
Ambient
[ppb]
Average 318.51 322.42
Std dev 0.32 0.46
RStd dev % 0.10 0.14
Count 25 109
Templ ref: PPT-ISO-colour.001 Doc Ref no: Air Quality Lekgotla: 6-7 Oct 2014; KZN
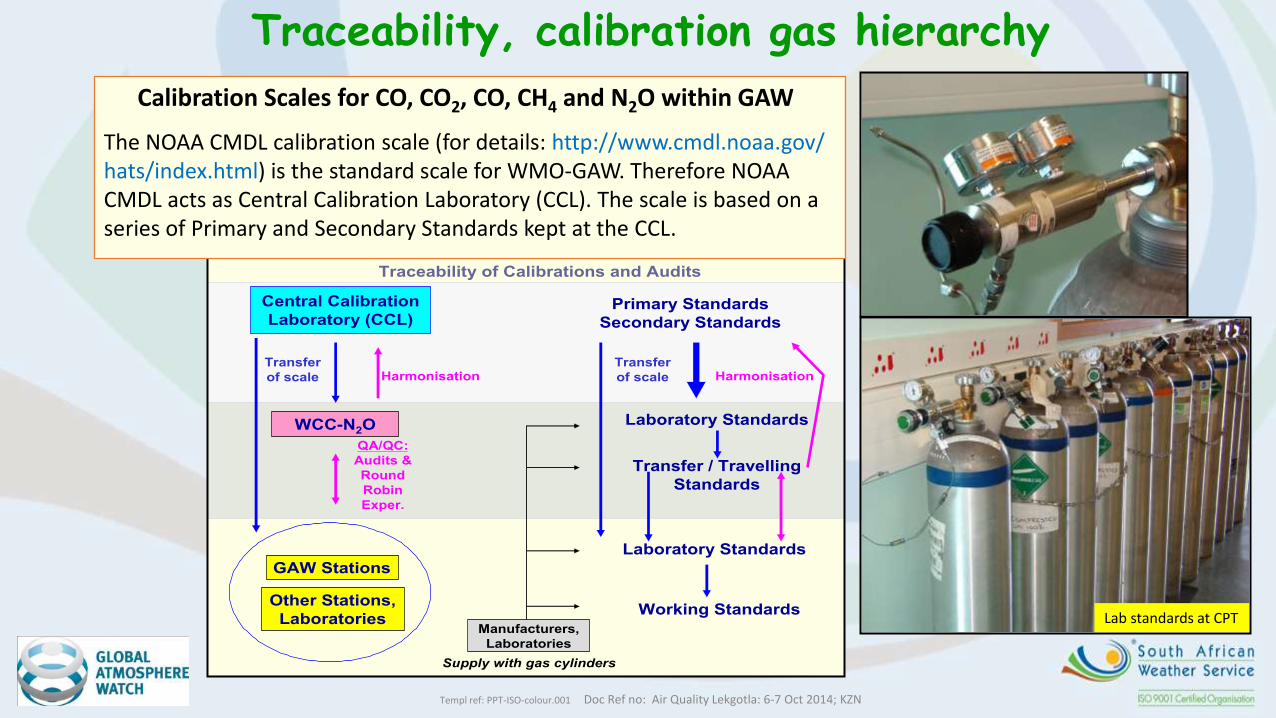
Central Calibration
Laboratory (CCL)
WCC-N2O
GAW Stations
Other Stations,
Laboratories
Transfer
of scale
QA/QC:
Audits &
Round
Robin
Exper.
Harmonisation
Traceability of Calibrations and Audits
Manufacturers,
Laboratories
Supply with gas cylinders
Primary Standards
Secondary Standards
Laboratory Standards
Laboratory Standards
Working Standards
Harmonisation
Transfer / Travelling
Standards
Transfer
of scale
Calibration Scales for CO, CO2, CO, CH4 and N2O within GAW
The NOAA CMDL calibration scale (for details: http://www.cmdl.noaa.gov/ hats/index.html) is the standard scale for WMO-GAW. Therefore NOAA CMDL acts as Central Calibration Laboratory (CCL). The scale is based on a series of Primary and Secondary Standards kept at the CCL.
Traceability, calibration gas hierarchy
Lab standards at CPT
Templ ref: PPT-ISO-colour.001 Doc Ref no: Air Quality Lekgotla: 6-7 Oct 2014; KZN
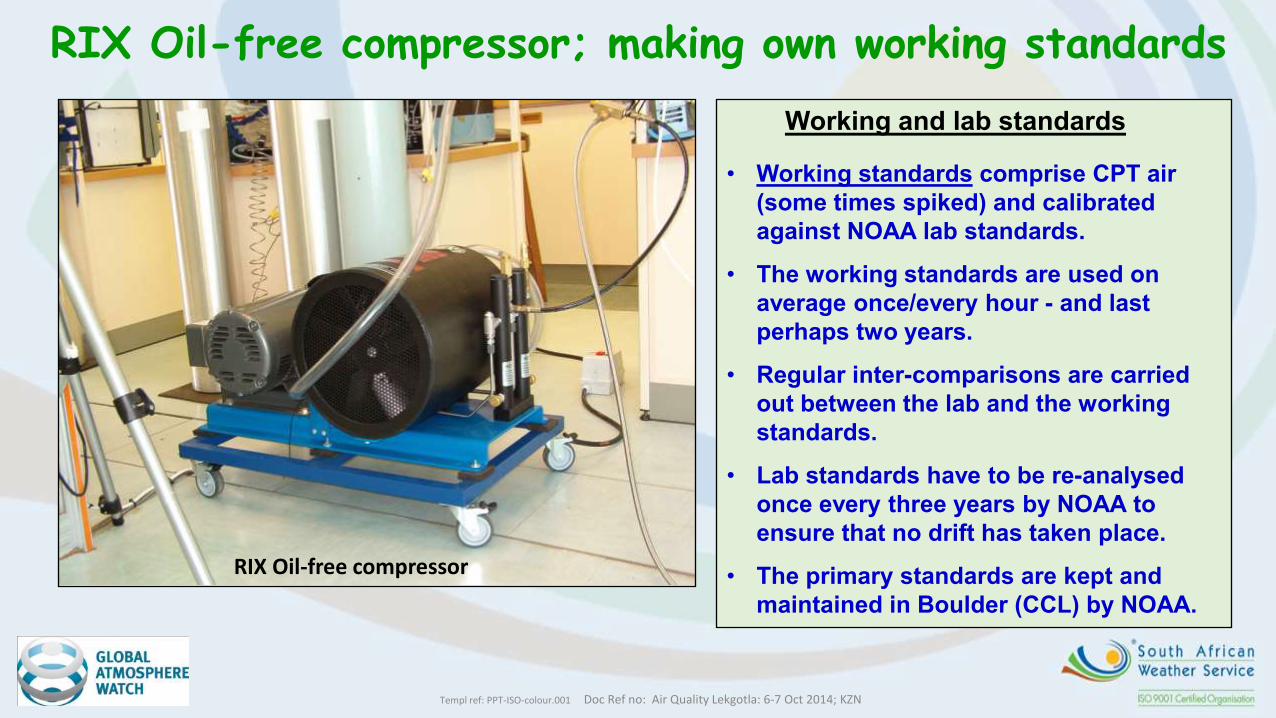
RIX Oil-free compressor; making own working standards
Working and lab standards
• Working standards comprise CPT air
(some times spiked) and calibrated
against NOAA lab standards.
• The working standards are used on
average once/every hour - and last
perhaps two years.
• Regular inter-comparisons are carried
out between the lab and the working
standards.
• Lab standards have to be re-analysed
once every three years by NOAA to
ensure that no drift has taken place.
• The primary standards are kept and
maintained in Boulder (CCL) by NOAA.
RIX Oil-free compressor
Templ ref: PPT-ISO-colour.001 Doc Ref no: Air Quality Lekgotla: 6-7 Oct 2014; KZN
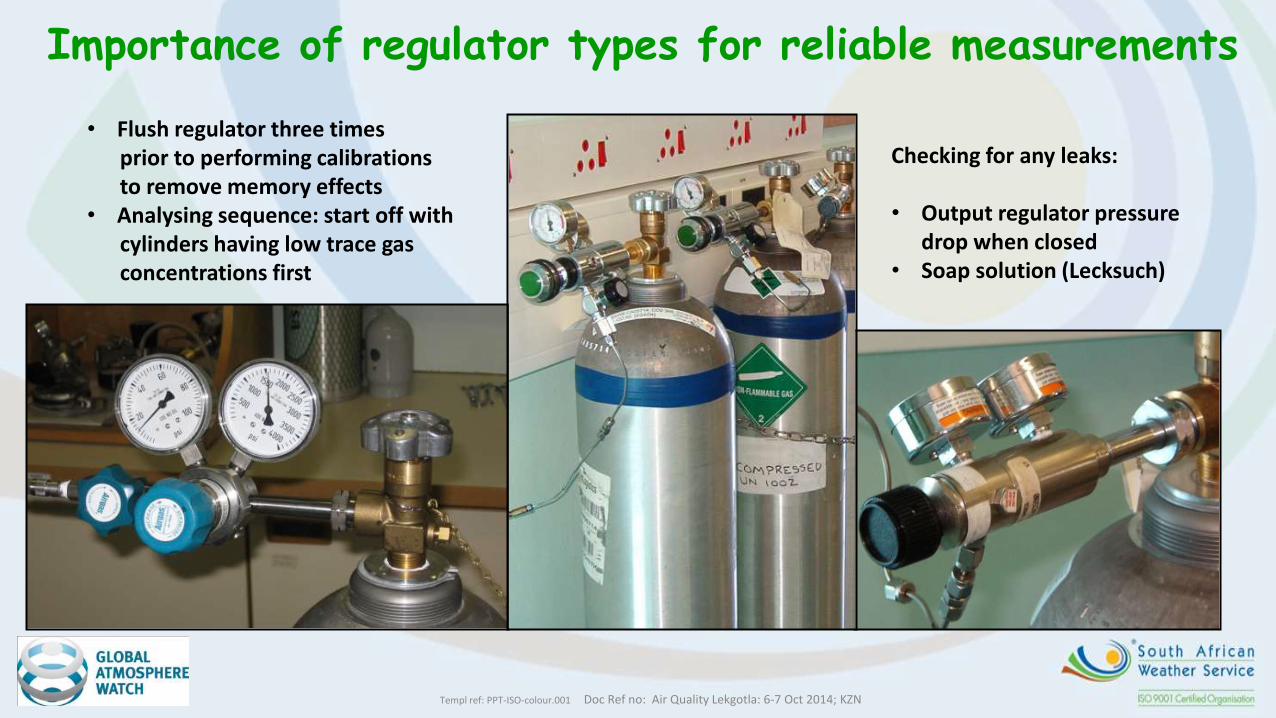
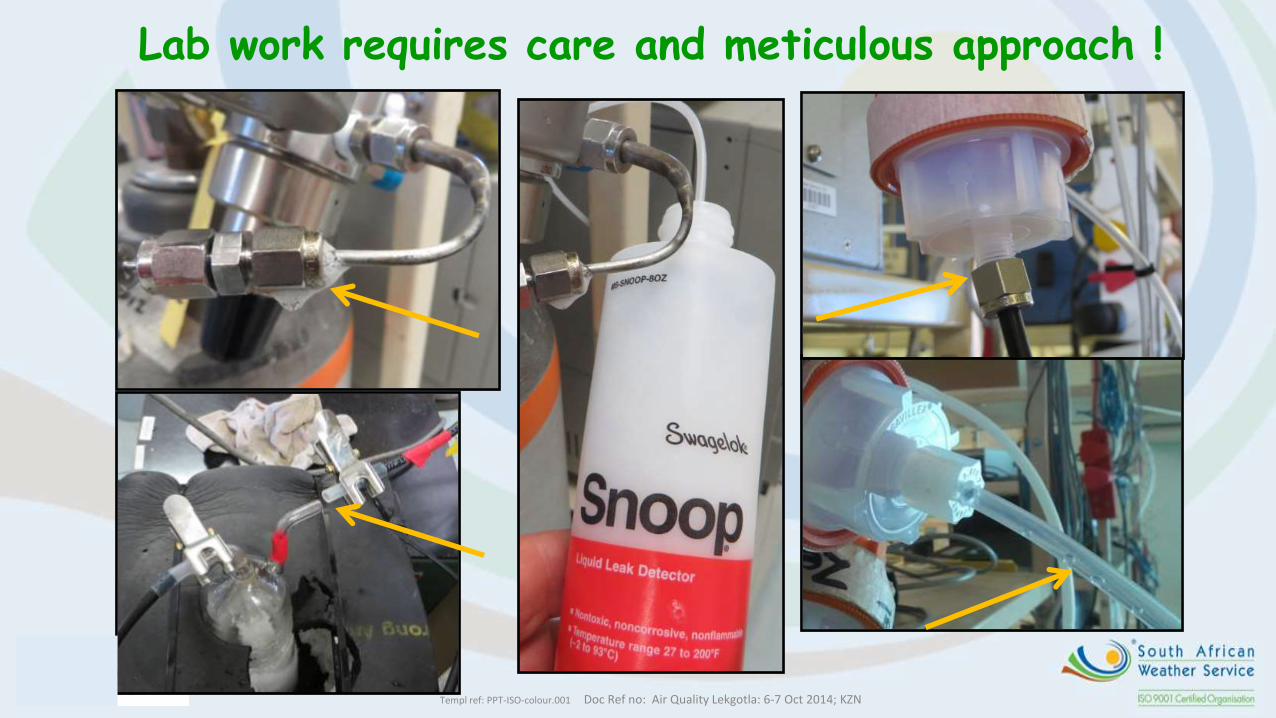
Importance of regulator types for reliable measurements
• Flush regulator three times prior to performing calibrations to remove memory effects • Analysing sequence: start off with cylinders having low trace gas concentrations first
Checking for any leaks: • Output regulator pressure
drop when closed • Soap solution (Lecksuch)
Templ ref: PPT-ISO-colour.001 Doc Ref no: Air Quality Lekgotla: 6-7 Oct 2014; KZN
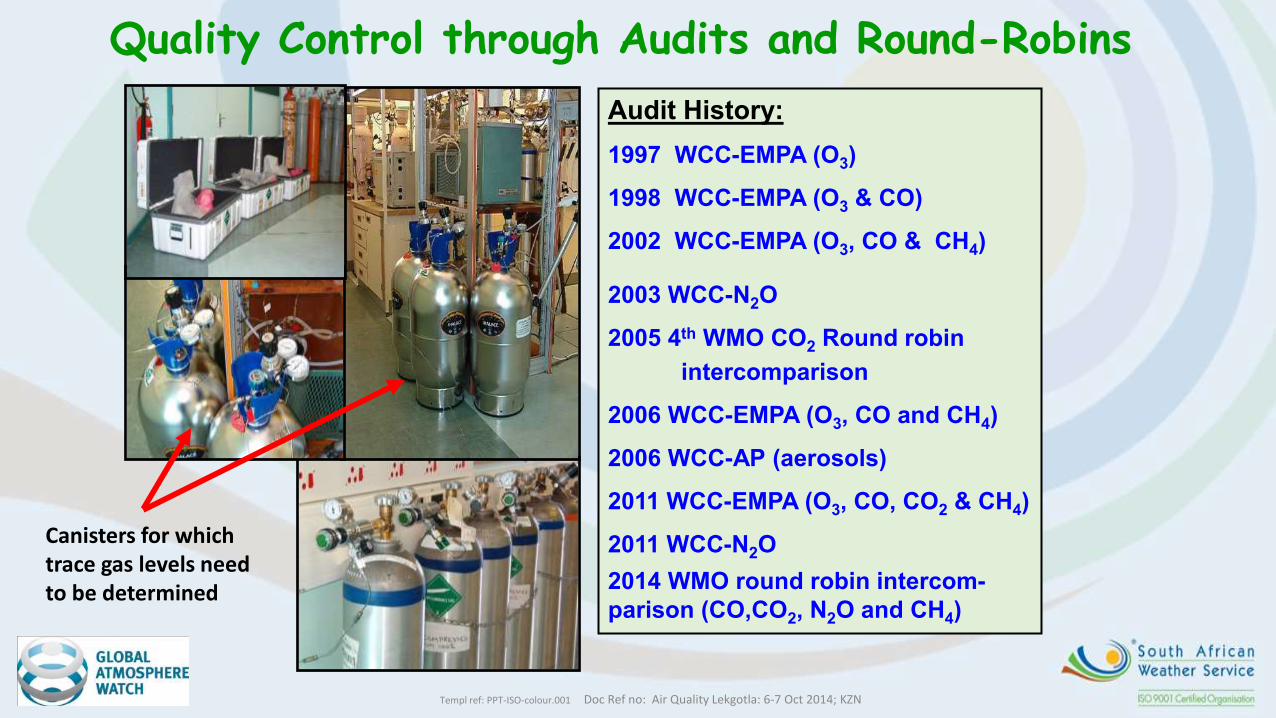
Quality Control through Audits and Round-Robins
Audit History:
1997 WCC-EMPA (O3)
1998 WCC-EMPA (O3 & CO)
2002 WCC-EMPA (O3, CO & CH4)
2003 WCC-N2O
2005 4th WMO CO2 Round robin
intercomparison
2006 WCC-EMPA (O3, CO and CH4)
2006 WCC-AP (aerosols)
2011 WCC-EMPA (O3, CO, CO2 & CH4)
2011 WCC-N2O
2014 WMO round robin intercom-
parison (CO,CO2, N2O and CH4)
Canisters for which trace gas levels need to be determined
Templ ref: PPT-ISO-colour.001 Doc Ref no: Air Quality Lekgotla: 6-7 Oct 2014; KZN
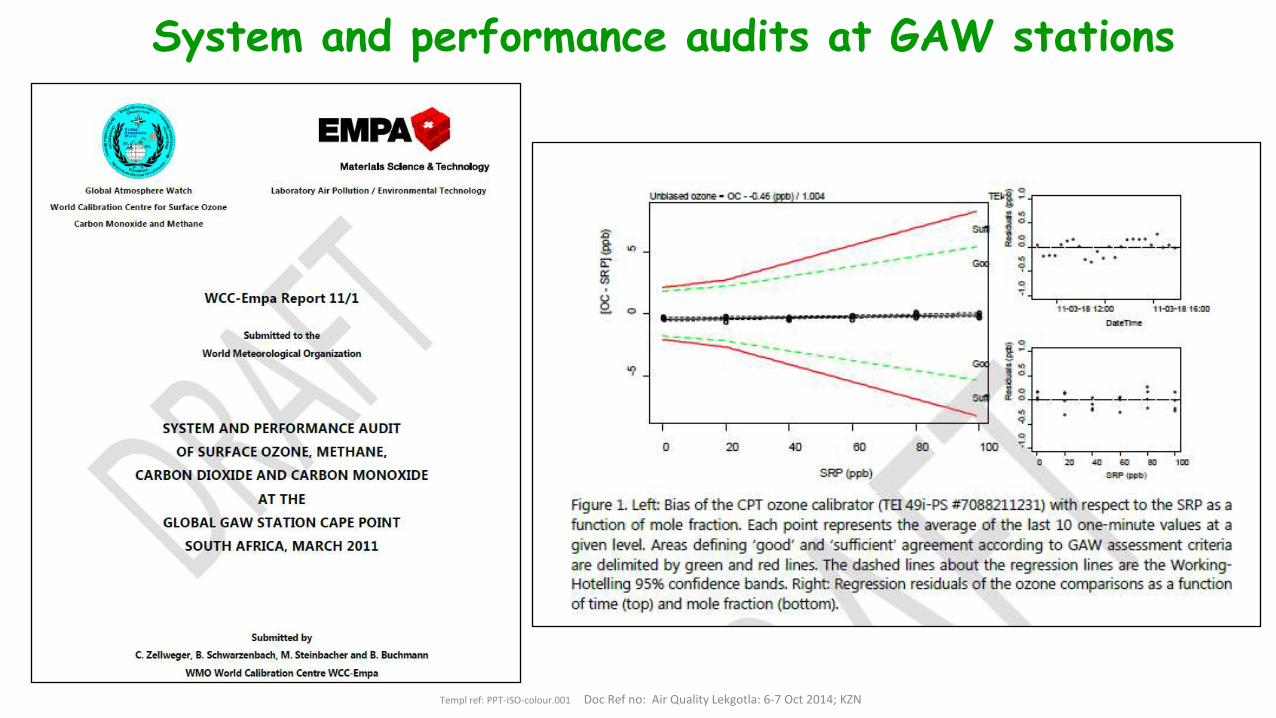
System and performance audits at GAW stations
Templ ref: PPT-ISO-colour.001 Doc Ref no: Air Quality Lekgotla: 6-7 Oct 2014; KZN
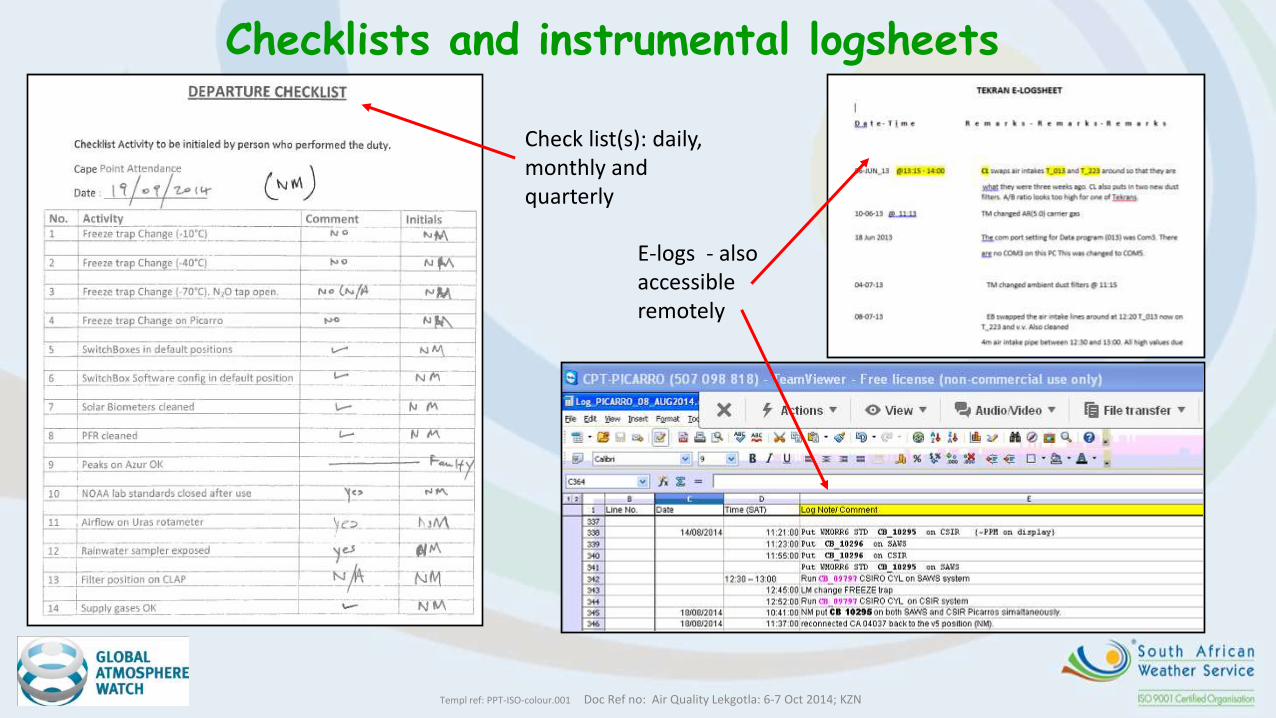
Checklists and instrumental logsheets
E-logs - also accessible remotely
Check list(s): daily, monthly and quarterly
Templ ref: PPT-ISO-colour.001 Doc Ref no: Air Quality Lekgotla: 6-7 Oct 2014; KZN
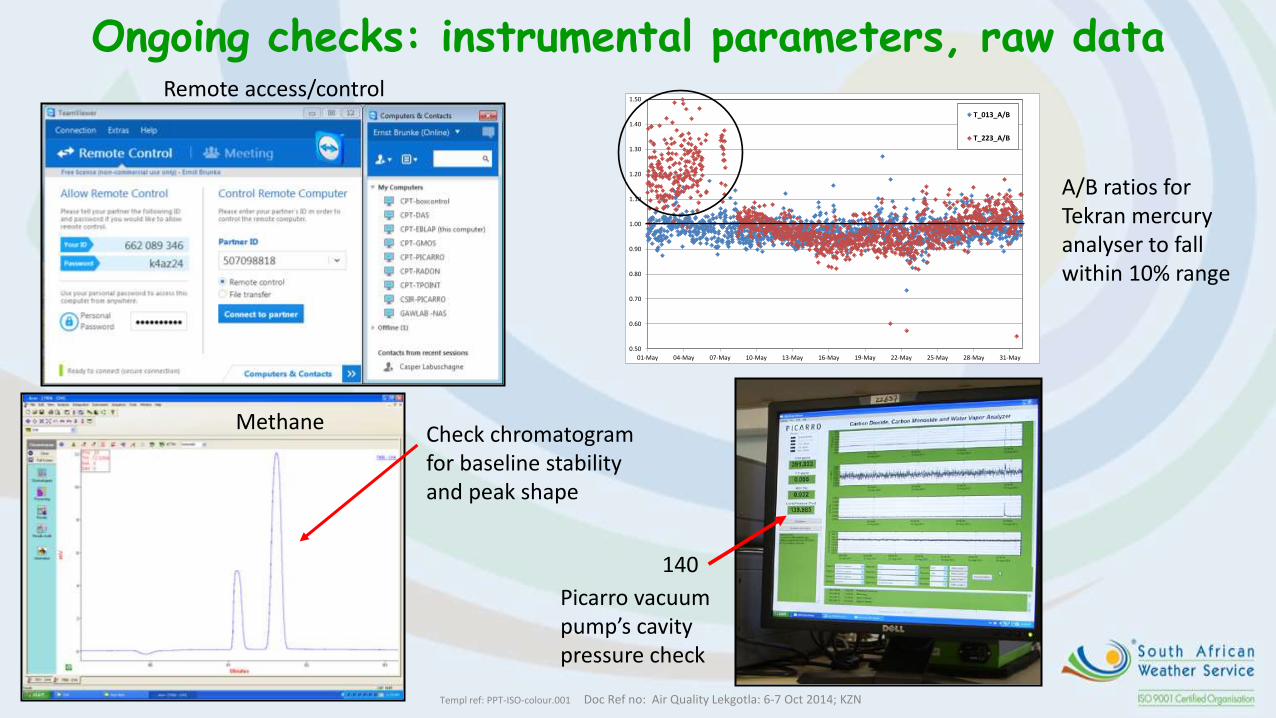
Ongoing checks: instrumental parameters, raw data
0.50
0.60
0.70
0.80
0.90
1.00
1.10
1.20
1.30
1.40
1.50
01-May 04-May 07-May 10-May 13-May 16-May 19-May 22-May 25-May 28-May 31-May
T_013_A/B
T_223_A/B
140
A/B ratios for Tekran mercury analyser to fall within 10% range
Picarro vacuum pump’s cavity pressure check
Remote access/control
Methane Check chromatogram for baseline stability and peak shape
Templ ref: PPT-ISO-colour.001 Doc Ref no: Air Quality Lekgotla: 6-7 Oct 2014; KZN
Lab work requires care and meticulous approach !
Templ ref: PPT-ISO-colour.001 Doc Ref no: Air Quality Lekgotla: 6-7 Oct 2014; KZN
480
490
500
510
520
530
540
550
560
570
580
Feb-07 Jun-08 Nov-09 Mar-11 Aug-12 Dec-13 May-15
Mo
le f
racti
on
[p
pt]
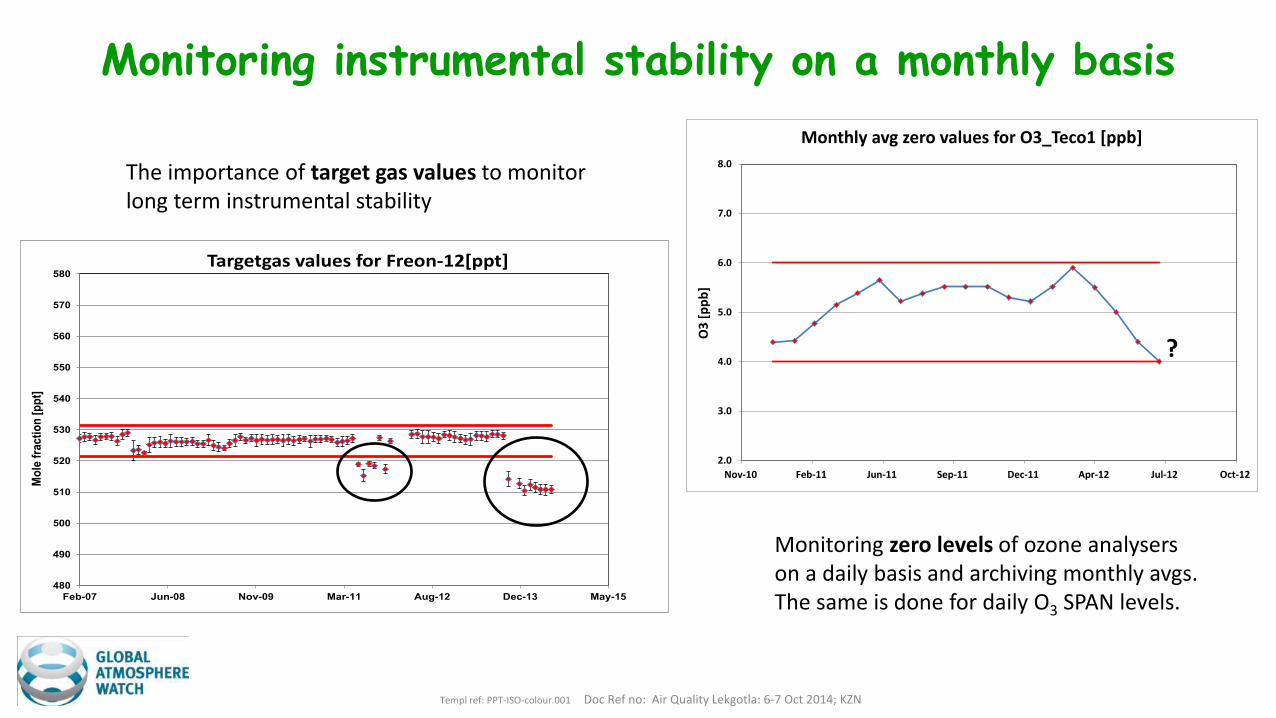
Targetgas values for Freon-12[ppt]
2.0
3.0
4.0
5.0
6.0
7.0
8.0
Nov-10 Feb-11 Jun-11 Sep-11 Dec-11 Apr-12 Jul-12 Oct-12
O3
[p
pb
]
Monthly avg zero values for O3_Teco1 [ppb]
Monitoring zero levels of ozone analysers on a daily basis and archiving monthly avgs. The same is done for daily O3 SPAN levels.
?
The importance of target gas values to monitor long term instrumental stability
Monitoring instrumental stability on a monthly basis
Templ ref: PPT-ISO-colour.001 Doc Ref no: Air Quality Lekgotla: 6-7 Oct 2014; KZN
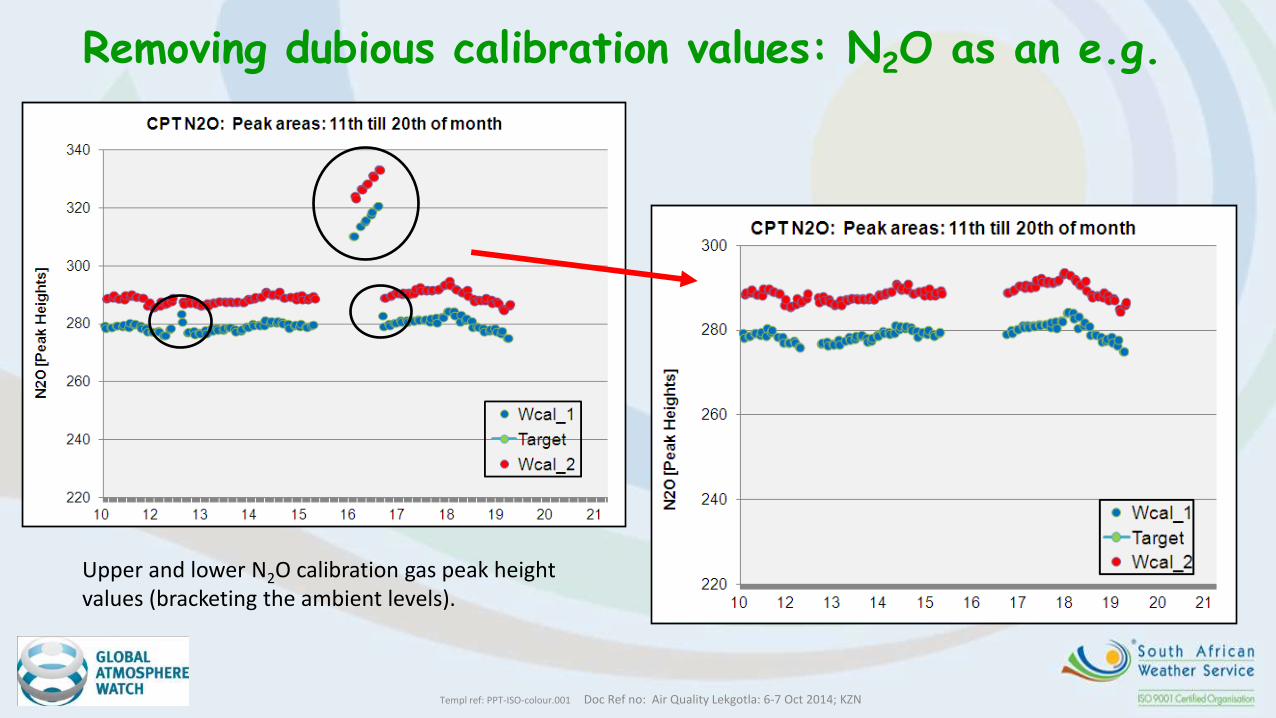
Removing dubious calibration values: N2O as an e.g.
Upper and lower N2O calibration gas peak height values (bracketing the ambient levels).
Templ ref: PPT-ISO-colour.001 Doc Ref no: Air Quality Lekgotla: 6-7 Oct 2014; KZN
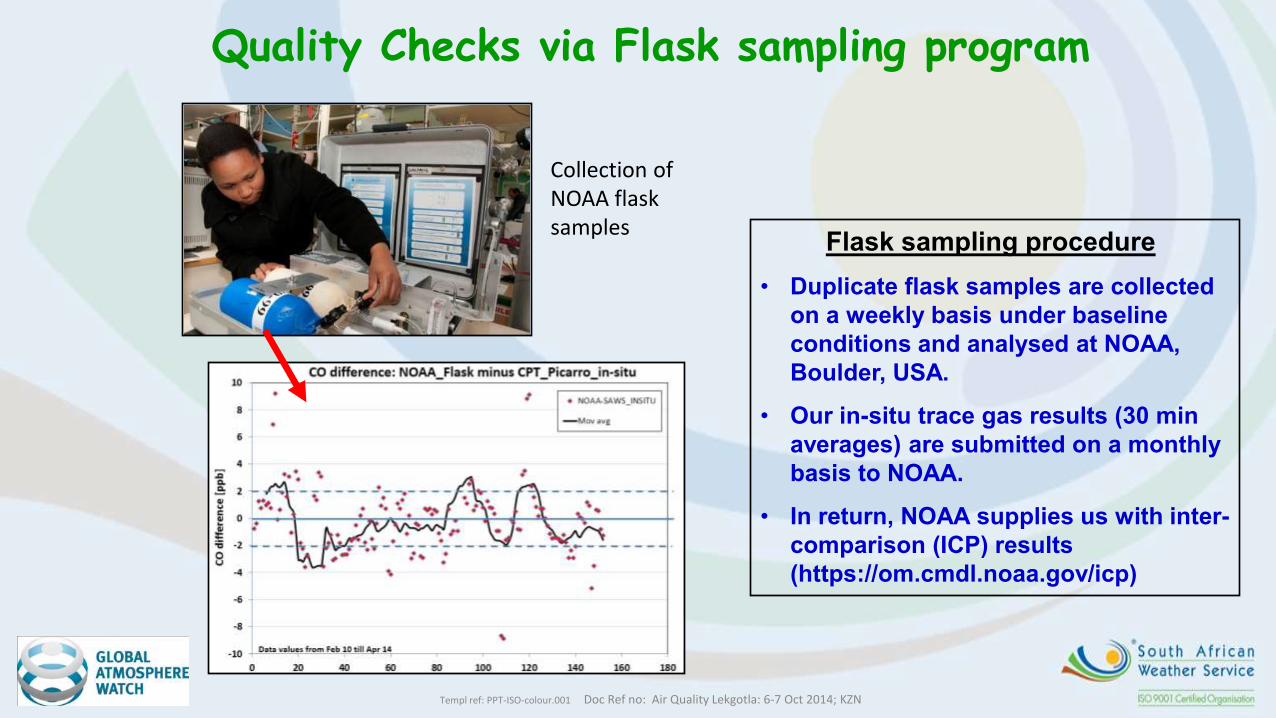
Flask sampling procedure
• Duplicate flask samples are collected
on a weekly basis under baseline
conditions and analysed at NOAA,
Boulder, USA.
• Our in-situ trace gas results (30 min
averages) are submitted on a monthly
basis to NOAA.
• In return, NOAA supplies us with inter-
comparison (ICP) results
(https://om.cmdl.noaa.gov/icp)
Quality Checks via Flask sampling program
Collection of NOAA flask samples
Templ ref: PPT-ISO-colour.001 Doc Ref no: Air Quality Lekgotla: 6-7 Oct 2014; KZN
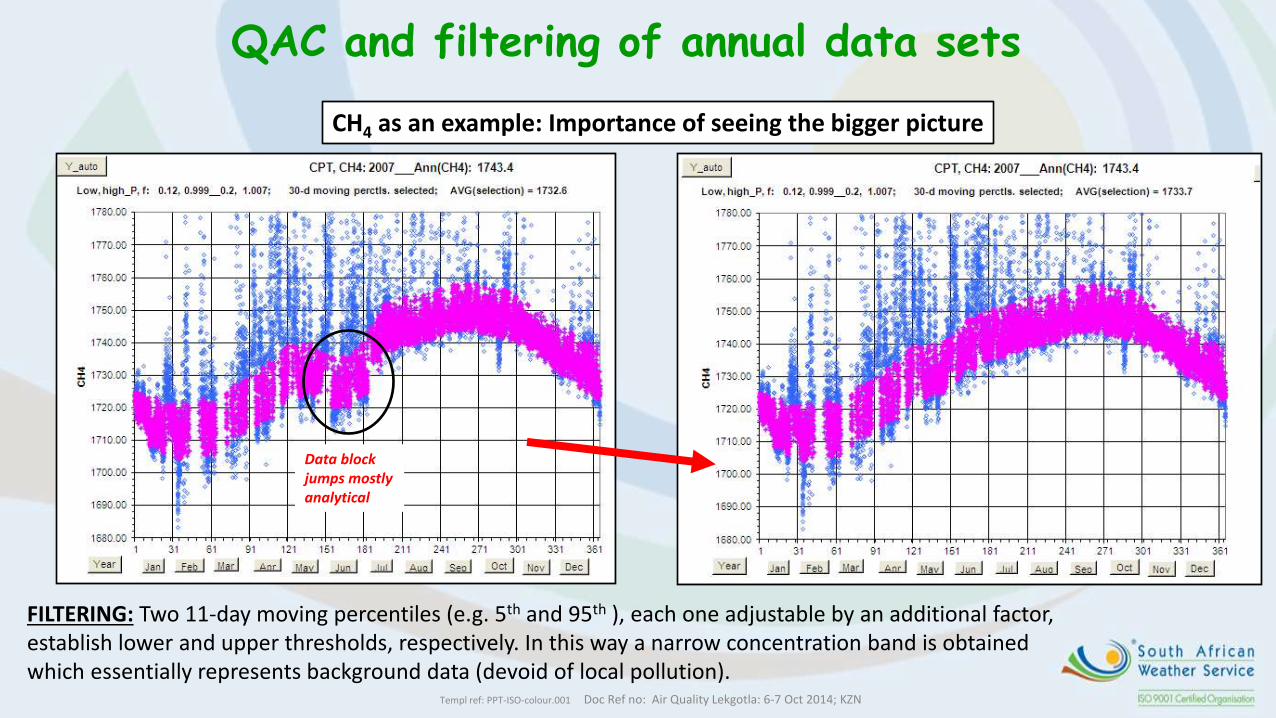
QAC and filtering of annual data sets
CH4 as an example: Importance of seeing the bigger picture
FILTERING: Two 11-day moving percentiles (e.g. 5th and 95th ), each one adjustable by an additional factor, establish lower and upper thresholds, respectively. In this way a narrow concentration band is obtained which essentially represents background data (devoid of local pollution).
Data block jumps mostly analytical
Templ ref: PPT-ISO-colour.001 Doc Ref no: Air Quality Lekgotla: 6-7 Oct 2014; KZN
370
375
380
385
390
395
400
405
410
1 31 61 91 121 151 181 211 241 271 301 331 361
CO
2 [
pp
m]
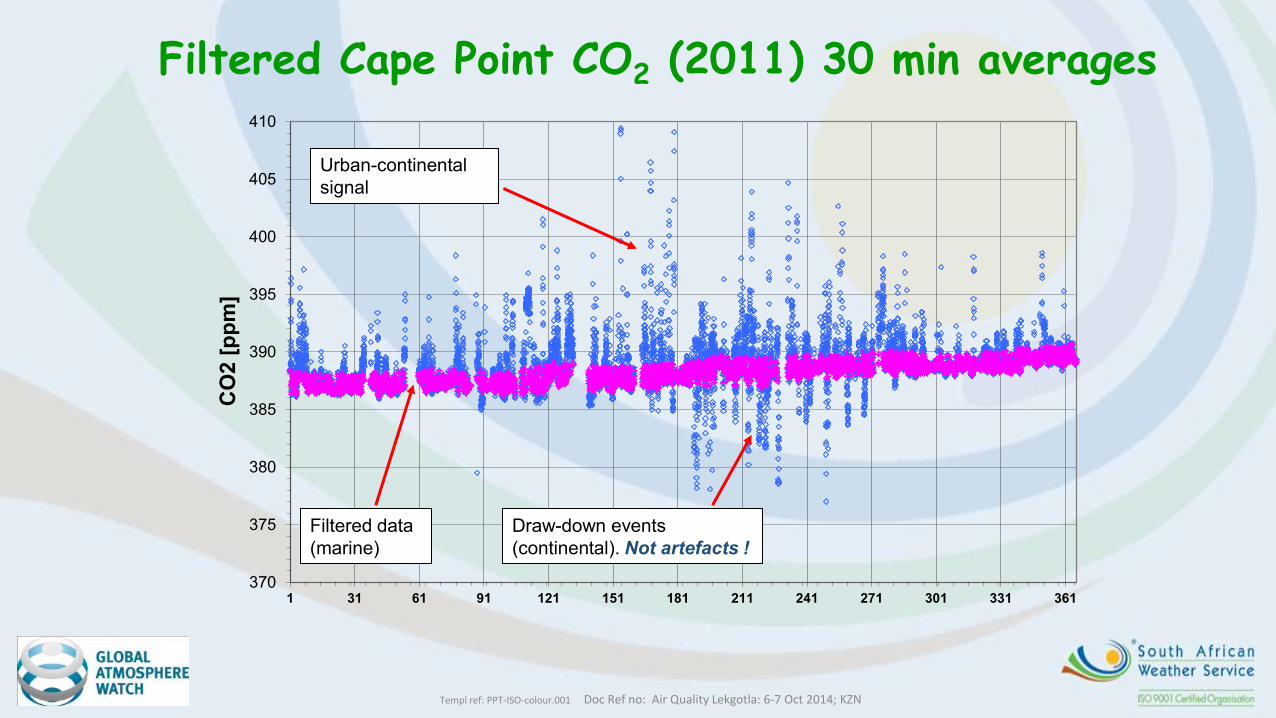
Filtered Cape Point CO2 (2011) 30 min averages
Urban-continental
signal
Filtered data
(marine)
Draw-down events
(continental). Not artefacts !
Templ ref: PPT-ISO-colour.001 Doc Ref no: Air Quality Lekgotla: 6-7 Oct 2014; KZN
Halley, Antarctica
Barrow, Alaska Minamitorishima, Japan
Neumayer, Antarctica
Cape Grim, Australia
Cape Point, SA
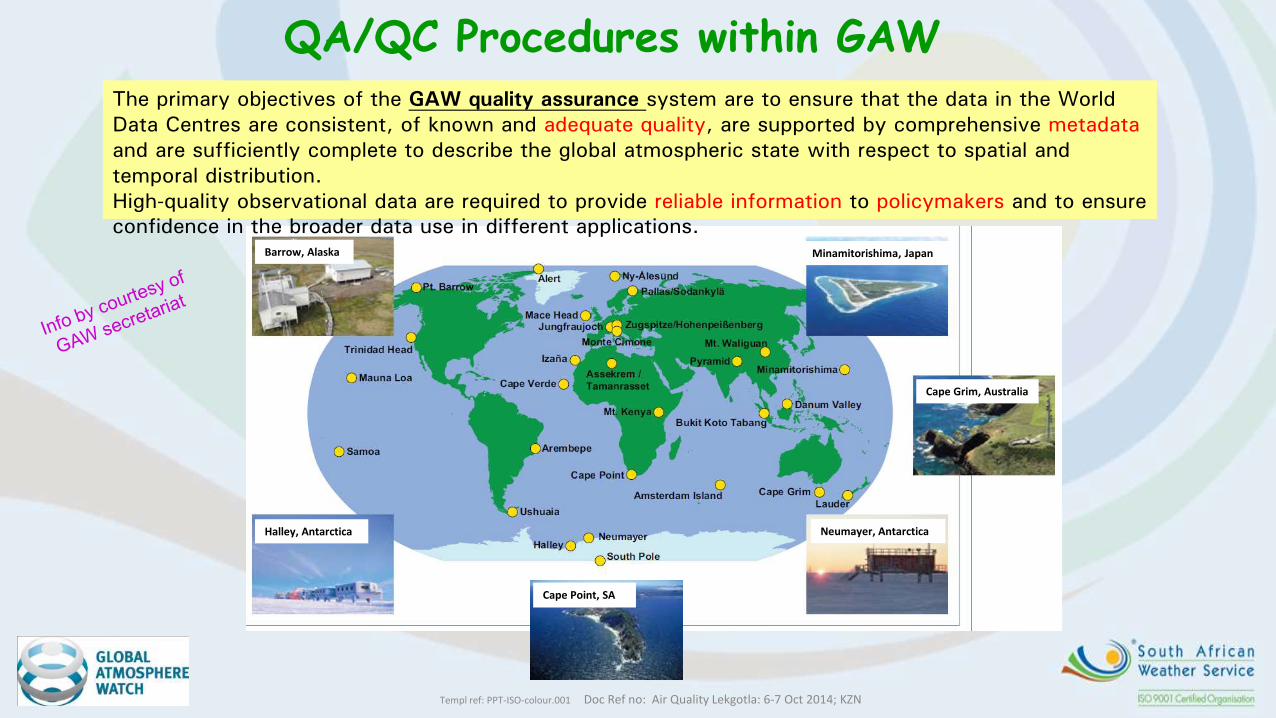
The primary objectives of the GAW quality assurance system are to ensure that the data in the World
Data Centres are consistent, of known and adequate quality, are supported by comprehensive metadata
and are sufficiently complete to describe the global atmospheric state with respect to spatial and
temporal distribution.
High-quality observational data are required to provide reliable information to policymakers and to ensure
confidence in the broader data use in different applications.
QA/QC Procedures within GAW
Templ ref: PPT-ISO-colour.001 Doc Ref no: Air Quality Lekgotla: 6-7 Oct 2014; KZN
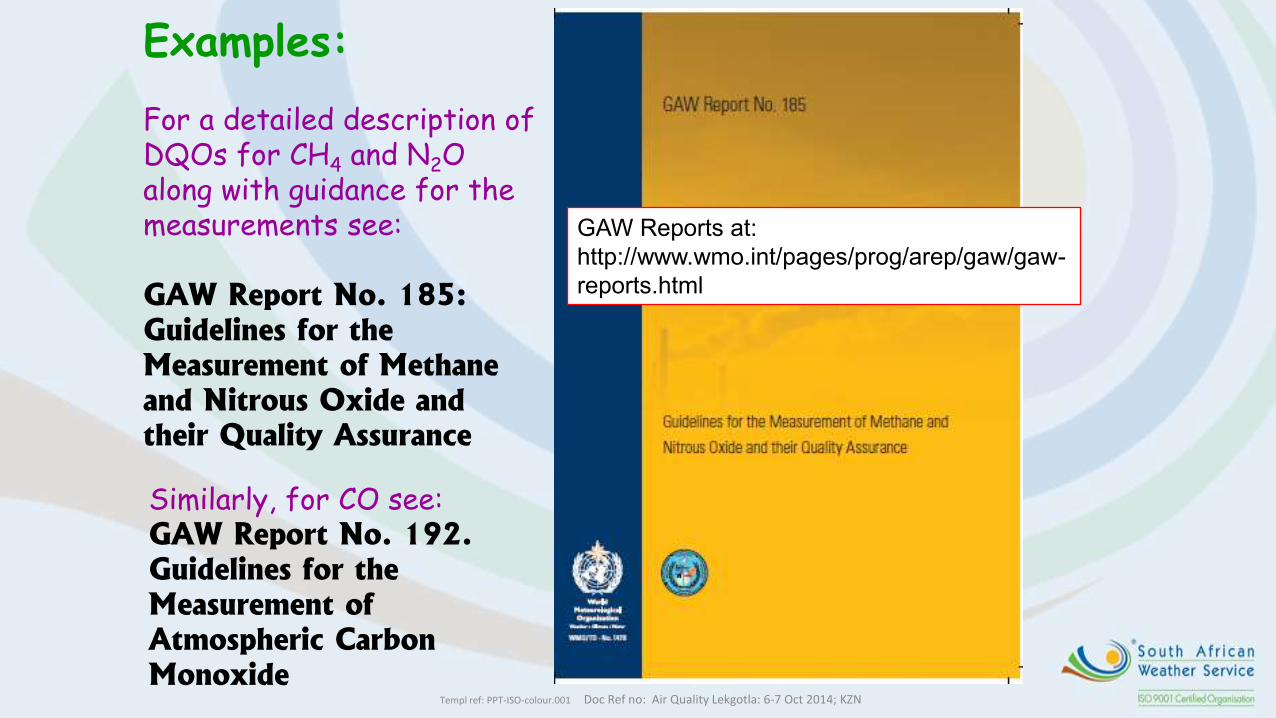
Examples: For a detailed description of DQOs for CH4 and N2O along with guidance for the measurements see:
GAW Report No. 185:
Guidelines for the
Measurement of Methane
and Nitrous Oxide and
their Quality Assurance
Similarly, for CO see: GAW Report No. 192.
Guidelines for the
Measurement of
Atmospheric Carbon
Monoxide
GAW Reports at:
http://www.wmo.int/pages/prog/arep/gaw/gaw-
reports.html
Templ ref: PPT-ISO-colour.001 Doc Ref no: Air Quality Lekgotla: 6-7 Oct 2014; KZN
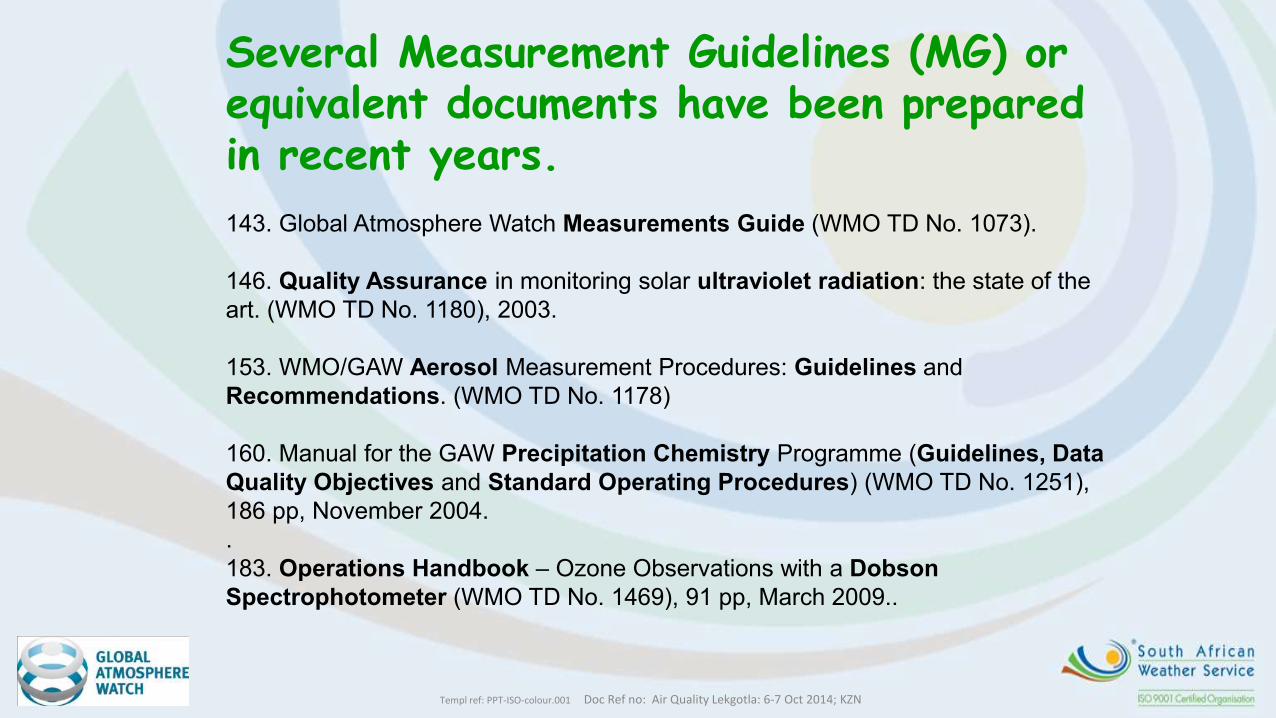
Several Measurement Guidelines (MG) or equivalent documents have been prepared in recent years.
143. Global Atmosphere Watch Measurements Guide (WMO TD No. 1073).
146. Quality Assurance in monitoring solar ultraviolet radiation: the state of the
art. (WMO TD No. 1180), 2003.
153. WMO/GAW Aerosol Measurement Procedures: Guidelines and
Recommendations. (WMO TD No. 1178)
160. Manual for the GAW Precipitation Chemistry Programme (Guidelines, Data
Quality Objectives and Standard Operating Procedures) (WMO TD No. 1251),
186 pp, November 2004.
.
183. Operations Handbook – Ozone Observations with a Dobson
Spectrophotometer (WMO TD No. 1469), 91 pp, March 2009..
Templ ref: PPT-ISO-colour.001 Doc Ref no: Air Quality Lekgotla: 6-7 Oct 2014; KZN
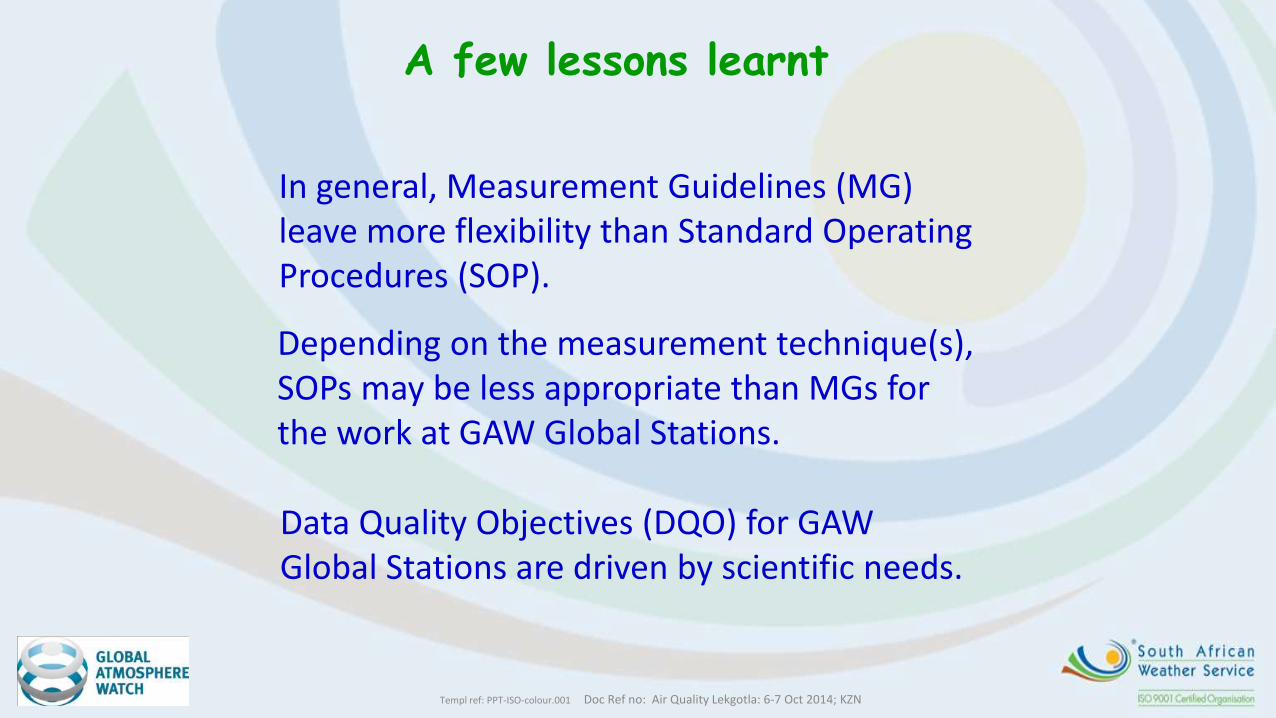
In general, Measurement Guidelines (MG) leave more flexibility than Standard Operating Procedures (SOP).
Depending on the measurement technique(s), SOPs may be less appropriate than MGs for the work at GAW Global Stations.
Data Quality Objectives (DQO) for GAW Global Stations are driven by scientific needs.
A few lessons learnt
Templ ref: PPT-ISO-colour.001 Doc Ref no: Air Quality Lekgotla: 6-7 Oct 2014; KZN
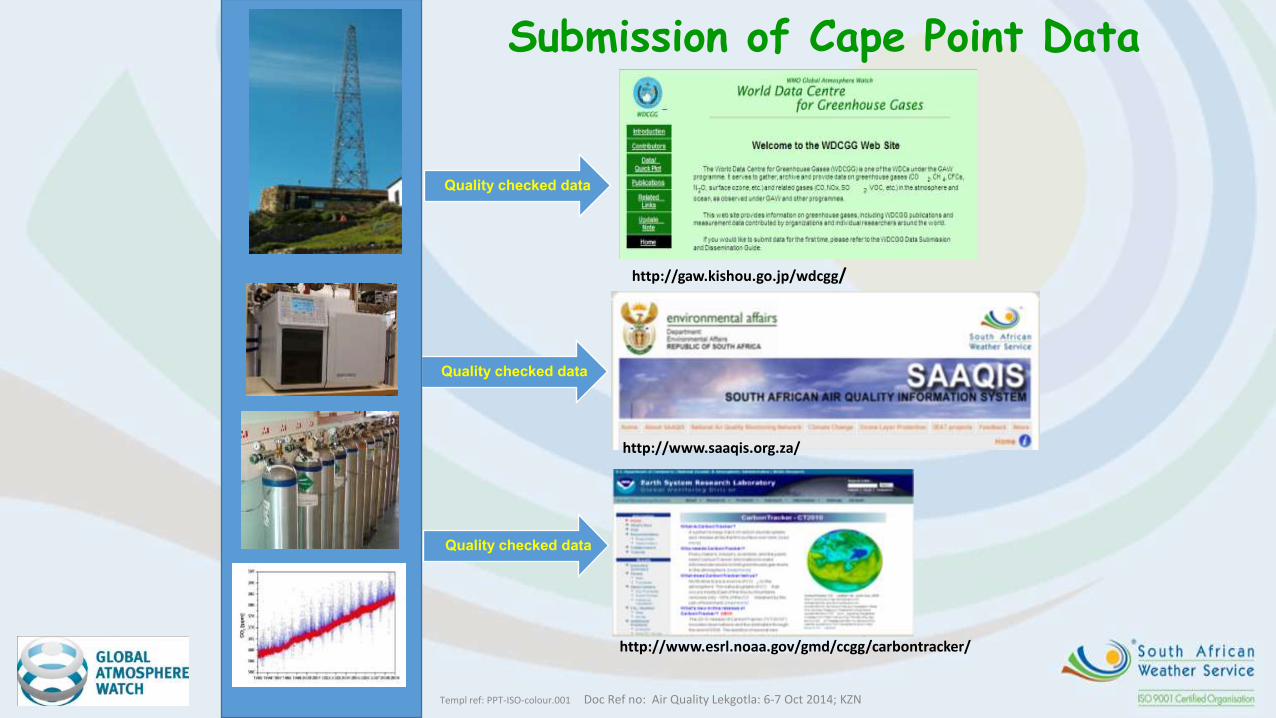
Submission of Cape Point Data
Quality checked data
http://www.esrl.noaa.gov/gmd/ccgg/carbontracker/
http://gaw.kishou.go.jp/wdcgg/
http://www.saaqis.org.za/
Quality checked data
Quality checked data
Templ ref: PPT-ISO-colour.001 Doc Ref no: Air Quality Lekgotla: 6-7 Oct 2014; KZN
Acknowledgements
Local authorities:
Templ ref: PPT-ISO-colour.001 Doc Ref no: Air Quality Lekgotla: 6-7 Oct 2014; KZN
THANK YOU !