Embed Size (px)
Citation preview

Measuring Tidal Wetland Response to Restoration Using Performance
Benchmarks from Local Reference Sites
Michele Dionne and Christopher PeterWith contributions from Kenneth Raposa, Robin Weber, John Fear, Scott Lerberg, Craig Cornu, Heidi Harris, and Nina Garfield
National Estuarine Research Reserve System, May 2012

Table of Contents
Overview ................................................................................. 1
Primary Findings ...................................................................... 1
Project Results Summary and Recommendations ................... 2
The Study ............................................................................... 15
Background ............................................................................ 15
Study Sites ............................................................................. 15
Methods Summary ................................................................ 22
Project Discussion .................................................................. 24
Reference Cited ..................................................................... 35
Appendix A: Methods Detail ................................................. 38
Appendix B: Results Detail .................................................... 45
Appendix C: Data Management ............................................ 59
AcknowledgementsProject participants would like to thank Melanie Gange and the staff at the NOAA Restoration Center, Sliver Spring, MD for pro-viding the support and guidance that made this project possible.
Cover photos: Top- New England salt marsh, ME; Second row left- Duke Marine Lab marsh, NC; Second row right- Hermatage marsh breakwater, VA; Third row- South Slough salt marsh, OR; Bottom row- Nag marsh, RI.

In this study we collected data from a series of relatively undisturbed tidal wetlands at or near five National Estuarine Research Reserves (Reserves) located in Maine, Rhode Island, Virginia, North Carolina and Oregon as refer-ence sites against which to compare the restoration status of 17 local tidal wetland restoration projects previously funded by the Estuarine Restoration Act since 2000.
The objectives of this study, funded by the NOAA Restoration Center, are fourfold:
1. Determine the level of restoration achieved at each project restoration site;
2. Identify key biotic (vegetation) and abiotic (hydrology, soils, marsh eleva-tion) indicators that best explain varia-tion in restoration response;
3. Determine the utility of long-term wetland monitoring sites at Reserves as reference sites for restoration projects implemented within the region; and
4. Compare responses of hydrologic and excavation/fill types of restoration.
This report summarizes findings at all study sites for three years (2008-2010). Each Reserve has also provided a report to the Restoration Center with detailed site information, maps, analyses and conclusions specific to that region (Cornu et al. 2011, Dionne and Peter 2011, Fear 2011, Lerberg and Reay 2011, Raposa and Weber 2011).
Overview
Primary FindingsThrough our data collection, analyses and interpreta-tion, we offer the following conclusions:
• Reserve tidal wetland sites can provide appro-priate long-term reference sites for local tidal wetland restoration projects.
• A recently formalized ecological index, the Resto-ration Performance Index (RPI) which compares change in user-selected indicator variables over time between reference and restoration sites (Moore et al. 2009) offers promise as an effec-tive trajectory analysis strategy (SER 2004) for measuring restoration status.
• According to our RPI values, most restoration projects surveyed in this study appeared to have achieved an intermediate level of restoration with two sites appearing to have become very similar to their paired reference sites, suggesting a high level of restoration.
• Two abiotic variables – 1) elevation of marsh platform, and 2) depth to groundwater were significantly correlated with plant community structure, providing important indicators of tidal wetland restoration performance.

2
Data CollectionWe collected data describing a suite of specific biotic and abiotic parameters at all reference and restoration sites at the five Reserves involved in the project (Table 1). Monitored param-eters were based on NOAA’s reference manual for restoration monitoring (Thayer et al. 2005) and selected in consultation with the NOAA Resto-ration Center. Data collected from reference sites served as benchmark parameter values for the restoration sites.
Project Results Summary and Recommendations
Level of restoration achieved by each restoration project and the utility of the Restoration Perfor-mance Index (RPI)
Using the RPI as a tidal wetland restoration evaluation tool along with other data analyses, we were able to conclude the following about our study sites, and about the use of the RPI:
1. Among the hydrologic param-eters analyzed (pore water salinity, tidal inundation period, depth to groundwater, maximum high tide), there were few large differences between reference and restoration values, suggest-ing hydrologic equivalence with reference conditions at most sites. These results also suggest that key physical processes needed to support the continued recovery of plant communities at these sites are in place.
2. Of the vegetation parameters analyzed (percent cover of the five most common reference spe-cies, species richness), there were large differences between refer-ence and restoration sites, which suggests that most sites are still in transition to full restoration.
Over three years, species richness appeared to be quite variable, frequently leading to noticeable annual change in the RPI veg-etation component (from 2009 to 2010, in particular), often trending to lower species richness (fewer species).
This trend is likely explained more by our sampling design than by site changes: the small number of species present per square
Table 1. Biotic and abiotic parameters monitored for this study.
Parameters
Biotic: Species, composition and percent cover of herbaceous vascular plants Plant height Stem Density
Abiotic: Hydrological- water fluctuation over time Salinity in tidal areas Soil/sediment: organic content and bulk density Soil/sediment: pore water salinity Wetland surface elevation
3
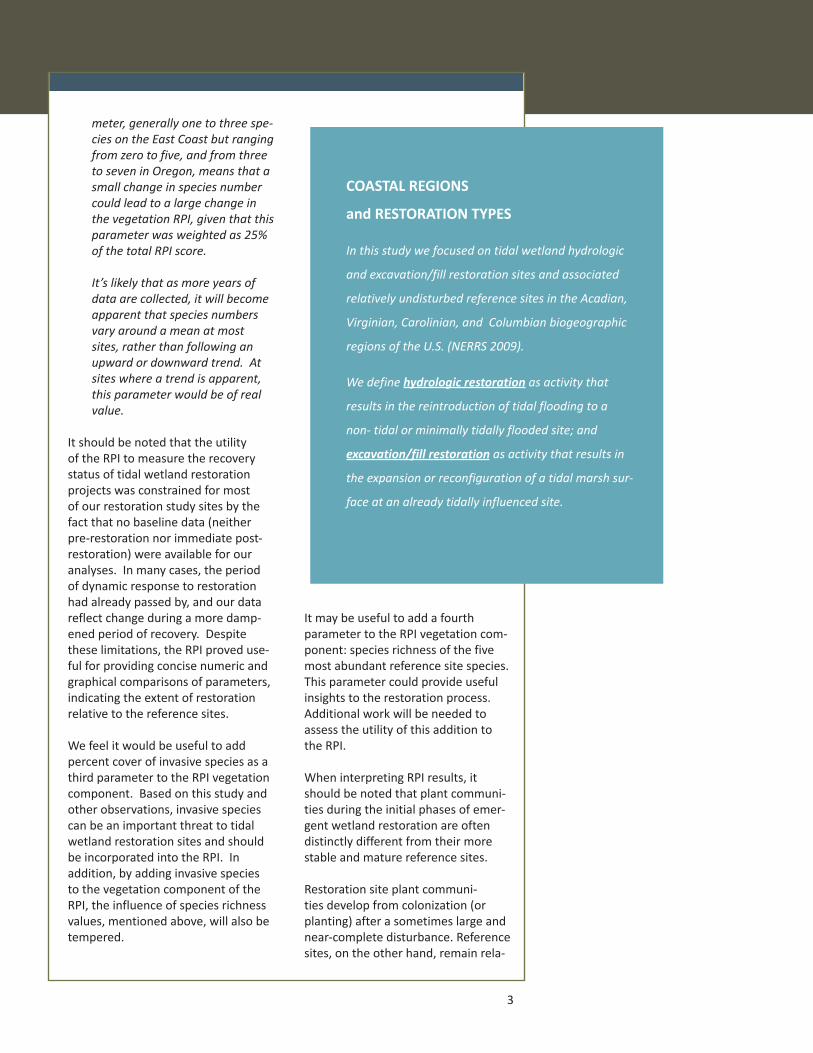
meter, generally one to three spe-cies on the East Coast but ranging from zero to five, and from three to seven in Oregon, means that a small change in species number could lead to a large change in the vegetation RPI, given that this parameter was weighted as 25% of the total RPI score.
It’s likely that as more years of data are collected, it will become apparent that species numbers vary around a mean at most sites, rather than following an upward or downward trend. At sites where a trend is apparent, this parameter would be of real value.
It should be noted that the utility of the RPI to measure the recovery status of tidal wetland restoration projects was constrained for most of our restoration study sites by the fact that no baseline data (neither pre-restoration nor immediate post-restoration) were available for our analyses. In many cases, the period of dynamic response to restoration had already passed by, and our data reflect change during a more damp-ened period of recovery. Despite these limitations, the RPI proved use-ful for providing concise numeric and graphical comparisons of parameters, indicating the extent of restoration relative to the reference sites.
We feel it would be useful to add percent cover of invasive species as a third parameter to the RPI vegetation component. Based on this study and other observations, invasive species can be an important threat to tidal wetland restoration sites and should be incorporated into the RPI. In addition, by adding invasive species to the vegetation component of the RPI, the influence of species richness values, mentioned above, will also be tempered.
It may be useful to add a fourth parameter to the RPI vegetation com-ponent: species richness of the five most abundant reference site species. This parameter could provide useful insights to the restoration process. Additional work will be needed to assess the utility of this addition to the RPI.
When interpreting RPI results, it should be noted that plant communi-ties during the initial phases of emer-gent wetland restoration are often distinctly different from their more stable and mature reference sites.
Restoration site plant communi-ties develop from colonization (or planting) after a sometimes large and near-complete disturbance. Reference sites, on the other hand, remain rela-
COASTAL REGIONS
and RESTORATION TYPES
In this study we focused on tidal wetland hydrologic
and excavation/fill restoration sites and associated
relatively undisturbed reference sites in the Acadian,
Virginian, Carolinian, and Columbian biogeographic
regions of the U.S. (NERRS 2009).
We define hydrologic restoration as activity that
results in the reintroduction of tidal flooding to a
non- tidal or minimally tidally flooded site; and
excavation/fill restoration as activity that results in
the expansion or reconfiguration of a tidal marsh sur-
face at an already tidally influenced site.

4
tively undisturbed and can maintain their “late successional” plant commu-nity structure while incorporating al-tered community patches maintained by small scale, episodic disturbances due to drivers (such as ice cover, wrack, waterlogged soils, etc.), related to variation in soil drainage. Because of these early site recovery dynam-ics (that may not be well understood by all restoration practitioners), RPI restoration site values may linger in the lower ranges for some time after restoration plan implementation.
Interpretation of the RPI scores without the benefit of a solid under-standing of restoration processes has the potential to lead to the implemen-tation of unnecessary or premature adaptive management actions on the part of less experienced restoration practitioners and land owners.
Recommendations � Formal outside review of the im-
plementation of the RPI described in this study should be conducted to provide important perspectives on this approach to restoration monitoring.
RESTORATION PERFORMANCE INDEX: RPI
We calculated the Restoration Performance Index using structural and functional variables for which we
had more than one year’s data. The RPI provides a quantitative measure of change in the restoration
site, relative to the reference site or reference benchmarks over time. The index is the weighted sum
of RPI scores measured for each selected variable over the specified time interval, and can be used to
describe restoration trajectories.
The RPI score for a given variable is defined as:
(Restoration present state (tx)) - (Initial restoration state (t0))
(Reference present state (tx)) - (Initial restoration state (t0))
Pore water salinity example:
(Salinity @ tx restoration) – (Salinity @ t0 restoration)
(Salinity @ tx reference) – (Salinity @ t0 restoration)
or (23psu – 11psu) / (35psu – 11psu) = 0.5
= RPI
= RPI Pore water Salinity

5
� The version of the RPI developed for this study should be revised by adding percent cover of invasive species as a third subcomponent of the Vegetation Component score.
� Restoration monitoring should occur until observations indicate that the original (or adaptively modified) restoration goal has been reached. In addition, the RPI developed for this study (and revised as above) should be ap-plied to project sites as early as possible (prior to restoration, then every year for the first three years of restoration, and every 2 to 5 years thereafter) until the original (or adaptively modified) restora-tion goal has been reached.
� The NERR System should develop a detailed training document and training workshops in the use of the RPI for performance evalua-tion of tidal wetland restoration projects, from sampling design, to data collection methods, to data organization, analysis and interpretation.
� The Restoration Center should en-courage their grantees to consult with restoration monitoring pro-fessionals at local NERR sites for assistance in choosing restoration monitoring protocols relevant to the region.
� Since, for a wide variety of reasons, the potential level of restoration possible at many disturbed tidal wetland sites can be less than 100% over the near-term (e.g., 20 years) and possibly longer, we encourage a realistic assessment of the level of restora-tion possible at sites be conducted during project design. The as-sessment should be wide ranging, taking into account any factors that would likely prevent or slow full site recovery (e.g., marsh sur-face subsidence, climate-related impacts, or financial, practical,
or social constraints placed on restoration design or subsequent project implementation, monitor-ing and adaptive management…etc.).
Key Vegetation, Hydrologic, Soil and Elevation Indicators that Best Explain Variation in Restoration Response
Emergent Vegetation Species Percent CoverFor the purposes of evaluating res-toration of plant communities, using similarity of percent cover between restoration and reference sites as the primary plant community metric worked well in our study. We also agreed that the use of the point – intercept method for estimating plant species and other types of cover would provide the most accurate observations. Monitoring personnel including consultants, agency staff, volunteers…etc., can vary from site to site and year to year. Using the point-intercept method requires less personal judgment for data collec-tion compared to visual percent cover estimation methods.
The use of percent cover of the five most abundant reference site species provided RPI scores that agreed with ANOSIM (analysis of similarity) and SIMPER (similarity percentages) re-sults, in that they both indicated that plant communities were only partly restored at the majority of restoration sites. Given that there were up to 21 species contributing to the cumulative 90% cover in each reference-restora-tion site pair, this greatly simplified calculating the RPI total score, and focused attention on the species that provide evenness or stability (in the context of the marsh plant commu-nity, stability means the opposite of variability).

6
It’s important to note that because of local and regional variability associ-ated with tidal wetland habitats (e.g., site size, plant community diversity, landscape setting), emergent vegeta-tion sampling design needs to be responsive to local site attributes.
For example, west coast salt marsh plant communities tend to be more diverse than those on the east coast and plant zonation tends to be more limited in scale due to the generally smaller wetland area. Sampling design power analyses con-ducted by the South Slough NERR sci-ence staff in Oregon determined that
in order to characterize change in per-cent cover year to year, the number of salt marsh plots sampled needed to be greater than the 20 replicate plots per marsh area recommended in the vegetation sampling protocol used in this study (Roman et al. 2001). In addition, transects oriented perpen-dicular to plant zones per Roman et al. (2001) in west coast emergent wetlands do not allow enough plots to be placed in each intertidal plant zone to adequately characterize each plant community in its zone. Veg-etation sampling plots in west coast salt marshes should be oriented per Roegner et al. (2008).
NORTH CAROLINA NERR: POINT-INTERCEPT
VERSUS VISUAL PERCENT COVER METHOD
We conducted our vegetation surveys using both the point
intercept method as described in Roman et al. (2001), and
the visual percent cover method as described in Pete et al.
(1998). The point intercept method was more labor inten-
sive than the visual observation method, but was judged
by our field crew to be less subjective. The point intercept
method had a tendency to miss small individuals of rare
species. For example, many times a lone Limonium plant
was present in the sampling quadrat and was detected with
the visual method, but was not touched by one of the point
intercepts and so would not have been counted with this
method alone. The visual assessment method consistently
provided a lower estimate for the percent cover compared
to that derived from the point intercept data. (see Figure
1). Despite the difference in magnitude, the overall trends
for the data in Figure 1 are essentially mirror images. At our
site where a core group of field investigators are always
present during vegetation data collection, we would have
reached the same conclusions regarding our marsh com-
parisons if we had used the visual percent cover method
instead of the point intercept method.
DUML NCMM PKS MM0123456789
101112
DUML NCMM PKS MM0123456789
101112
2008 2009 20100123456789
101112
2008 2009 20100123456789
101112
Cove
r Cla
sses
Cove
r Cla
sses
Figure 1. Point intercept versus visual percent cover method comparison. The point intercept method consistently provided higher estimates of vegetation cover. Error bars represent one standard deviation.
Visual Point Intercept

7
Recommendations � Emergent vegetation species
percent cover should be used as the primary plant community metric in evaluating the similarity between restoration and refer-ence site plant communities.
� The point-intercept method (Godinez-Alvarez et al. 2009) should be considered for collec-tion of plant species presence and relative abundance in all layers within one-square-meter quadrats, in particular if different field investigators are estimating percent cover year to year, or site to site (see sidebar).
� Picturepost (http://picturepost.unh.edu/) should be used to col-lect standardized photo points of reference and restoration sites. Photos should be taken the first week of every third month (March, June, September, De-cember), at least once prior to restoration, then every year for the first three years of restora-tion, and every two to five years thereafter). (We did not
use picture-post photo points in the current study, but consider this an important technique for documenting visible change at reference and restoration sites.)
� The RPI vegetation component score should use the five most abundant reference site species for the percent cover subcompo-nent score.
� NOAA Restoration Center restora-tion grant recipients on the west coast should consult with the Reserve site in their region or other knowledgeable agency or consulting sources about ap-propriate tidal wetland vegeta-tion sampling design. See also Roegner et al. (2008).
BIOTIC
Salin
ity
Inun
datio
n
Gro
undw
ater
Max
Hig
h Ti
de
Bulk
Den
sity
% O
rgan
ic M
atte
r
Sam
ple
Poin
ts/P
lots
Tran
sect
Pro
files
Tran
sect
Tr
ansit
ions
% 5
Dom
inan
t Sp
ecie
s-Re
f
% In
vasiv
es
Spec
ies R
ichn
ess
Nat
ive
Stem
De
nsity
Inva
sive
Stem
De
nsity
& H
eigh
t
Nat
ive
Stem
He
ight
Core (X) X X X X X X X X X X X X
Option (x) X X X
Sampling Scheme
1 2 or 3 2 or 3 1 4 4 1 4 4 1 1 1 1 1 1
Post-restoration sampling scheme codes:
1. Data collected annually during growing season for the first three years following restoration, then every two to five years, until the restoration goal achieved. The goal can be changed over time through adaptive management.
2. Data collected monthly, following yearly sampling as in Sampling Scheme 1.
3. Data is collected on four dates, following yearly sampling as in Sampling Scheme 1 (option is an alternative to Sampling Scheme 2).
4. Data is collected at intervals of one, two and five years following restoration, then every five years until restoration goal is achieved. Goal can be changed over time through adaptive management.
TIDAL WETLAND PERFORMANCE INDICATOR VARIABLESABIOTIC
Hydrology Soils Elevation Vegetation
Table 2. Recommended use of indicator variables for evaluating tidal wetland restoration per-formance. All monitoring should include at least one year of pre-restora-tion data collection.

8
Emergent Vegetation Species Stem Height and Density
Estimating stem density and height for dominant and subdominant reference species can be a very time consuming process. However, these data can be very helpful for understanding site variation that affects plant growth, such as competition for nutrients and light, and response to stressors such as soil salinity and soil oxygen avail-ability.
For our study these estimates proved to be quite variable across sites at most Reserves, with many significant differences among restoration sites, and between pairs of reference and
restoration sites. Stem height and density patterns did not agree with RPI results or ANOSIM and SIMPER results.
Plant species density and height can be monitored to test specific hypothe-ses about plant ecology under varying site conditions, or to precisely follow changes in the abundance of planted species. Stem height and density for dominant species can be measured, but for the most part, we do not consider these to be core variables to consider for restoration evaluation.
The one exception is that invasive species plant density and stem heights should be recorded if possible.
CHESAPEAKE BAY VA NERR: IMPORTANCE OF
ACCURATE ELEVATION DATA
Our study demonstrated the need to have very precise
elevation data due to the very shallow grades in these
restoration settings. Accurate elevation data was critical
for interpreting the inundation data from the groundwa-
ter wells as well as some of the vegetation patterns. The
elevation data was also very useful in understanding some
of the “nuances” of the reference and restoration sites (for
example, some localized depressional areas adjacent to the
upland area of both Cheatham Annex and Taskinas Creek).
With access to multiple types of equipment for measur-
ing marsh elevations in our study, we collected elevation
information each year using a combination of approaches
(standard visual leveling, digital bar code leveling, and real
time kinematic (RTK) GPS). While there was some variation
in the data collected using the different approaches, all
three methods produced reliable results.
Our approach is to determine the level of accuracy needed
to answer your research questions, and then assess the
costs (i.e. training, field time, processing time), versus the
benefits (in terms of accuracies) of the different options.
We suggest installing a network of local benchmarks for
any long-term restoration monitoring, along with a main-
tenance schedule on which to repeat elevation surveys (for
long-term restoration monitoring).

9
Invasive species in some regions of the U.S. (e.g., Phragmites australis in the Northeast) can be large and therefore less dense, and occur in fewer plots, hence they can be relatively easy to count and measure. Change in density and/or plant height may occur earlier than a change in percent cover for some invasive species. These data may serve as an early indicator to guide management actions designed to reduce or eliminate their threat.
Recommendations � Stem height and stem density
measurements should be required only for invasive species. Invasive species stem height and density should be measured annually dur-ing seasonal peak above-ground biomass, beginning the year prior to restoration, for three years fol-lowing restoration, and then every two to five years thereafter.
� Stem height and stem density measurements should remain an option for testing specific hypoth-eses that directly address or shed light on specific restoration goals. The same general field sampling methods would apply as described above.
Groundwater and Surface Water LevelsThese data were collected with the extensive use of continuously record-ing water level loggers (pressure sen-sors) that provide robust data sets for measuring tidal wetland inundation patterns. Some project participants chose to use In Situ Aquatroll 200™ loggers, which measure water level, salinity and temperature, in combina-tion with manual spot measurements. At other sites a combination of In Situ Aquatroll 200™ loggers, Onset HOBO™ water level loggers, and Solinst Leveloggers which measure water level and temperature only, were used. Because of varying financial constraints, some sites were not able
to purchase enough loggers to mea-sure groundwater and surface water levels simultaneously at both the restoration and reference sites. Most were not able to collect continuous water level and salinity data at every vegetation plot.
To carry out environmental parameter-plant community correlations we used the groundwater levels measured peri-odically by hand, as they were mostly associated with individual vegetation plots. A financially practical way to obtain continuous water level data would be to encourage the use of relatively inexpensive ($595) Onset HOBO™ water level loggers (vs. $2500 for Aquatroll™ loggers) placed at the bottom of each shallow PVC well at each vegetation plot or some subset of these plots. Given the small volume of water contained in shallow wells, the effects of water temperature and salinity on water level are likely to be too small to be of concern. This could be verified by including an Onset HOBO™ temperature / conductivity / salinity logger ($750) at several loca-tions within the study marsh, adjacent to a water level logger.
Barometric pressure can be measured (for water level correction) by plac-ing one water level logger anywhere above the high water level at the site. Single Aquatrolls™ (or combination of the two HOBO™ loggers described above) could be deployed in the main channel adjacent to both the reference and restoration marshes to provide water level, temperature and salinity of the estuarine source water.
Recommendations � Many continuously recording
mini-loggers should be used in shallow, small volume wells as-sociated with a representative set of vegetation plots to record patterns of inundation, rather than using fewer, more expen-sive loggers, deployed in deep

10
groundwater monitoring wells. Loggers would not necessarily be deployed at every plot, but the more the better. Loggers should be deployed simultaneously at reference and restoration sites for a minimum of one growing season lunar cycle annually, be-ginning one year prior to restora-tion, with a maximum 30-minute time interval between readings.
Additional deployments should capture water levels during sea-sonal transition periods.
If collecting continuous water lev-el data using loggers is not pos-sible, we suggest collecting depth to groundwater measurements by hand from shallow groundwater wells placed adjacent to every vegetation monitoring plot (or a representative set of plots). Data should be collected a minimum of four times annually (beginning one year prior to restoration) dur-ing each growing season. Data collection should occur at mid to
low tide, as close together in time as possible (same day or next day, or same week providing weather has been stable) for reference and restoration sites.
Pore Water/Groundwater Salinity Soil salinity is a primary determinant of plant species communities in tidal emergent marshes, and is a subcom-ponent of the RPI hydrology compo-nent. Soil salinity was not a primary correlate of plant community assem-blages within sites, possibly because there was rather low variation in this parameter within sites.
In this study, soil salinity was mea-sured from water samples taken from shallow groundwater wells, with Aquatrolls from deep groundwater wells, and with sippers probed into the root zone (10-25 cm or deeper if needed), and from water squeezed from replicate soil samples taken from the top 15 cm of the emergent marsh root zone using a garlic press and cof-fee filter.
Soil salinity measurement can be simplified by measuring salinity from water samples collected from the shallow groundwater wells. These data can also be used to determine whether there is a significant effect of salinity on water levels measured by water level loggers deployed in shallow wells. That there is likely little difference between salinity measured in shallow groundwater wells or by sippers can be verified with data collected by the Wells NERR for this study (Dionne and Peter 2011).
Recommendations
� Soil salinity measurement should be collected from shallow ground-water wells placed adjacent to every vegetation monitoring plot, or a representative set of plots. Data should be collected a minimum of four times annu-
Placing a water quality and depth data sonde for the NERRS System-Wide Monitoring Program (SWMP) in North Caro-lina. SWMP data can be used to augment tidal wetland refreence site data at NERR sites.

11
ally (beginning one year prior to restoration) during the growing season. Data collection should occur at mid to low tide, as close together in time as possible (same day or next day, or same week providing weather has been stable) for reference and restora-tion sites. At least two collection dates should coincide with the deployment period of continu-ously recording loggers (when used) within the wells, preferably the start and end dates.
Soil Structure (Bulk Density and Percent Organic Content)Under stable natural conditions, soil parameters change more gradually than do hydrologic and vegetation parameters.
Bulk density and percent organic content were correlated with the plant community assemblage at only one Reserve (Wells ME), where these parameters were measured adja-cent to every vegetation plot. These parameters can be quite different be-tween restoration and reference sites prior to hydrologic restoration, due to soil oxidation, or water logging and subsidence. For excavation/fill resto-ration, the soils that are exposed or that are brought to the site for project construction will often be quite differ-ent from those of the natural refer-ence system. For both excavation/fill and hydrologic restoration types, soils may change noticeably during early restoration due to sediment deposi-tion or erosion. Once the site hydrol-ogy has been established, surface soils will change more gradually, but may undergo rapid alteration due to storm events.
Root zone soil measurements allow us to follow incremental recovery of both mineral content and below ground plant biomass. Bulk density and percent organic content of the soils tend to be related (higher bulk
density soils have higher mineral content and lower organic content), so both parameters may not need to be measured if the equipment for combusting soil carbon (to assess per-cent organic carbon) is not available, or sending soil samples to a soils lab is not feasible.
Soil pore water oxidation-reduction (redox) potential provides a mea-sure of the ability of a soil to provide electron acceptors for the oxidation process, characterizing hydrologic conditions, microbial activity, plant root processes, and mineral, organic and nutrient content of tidal marsh soils (Davy et al. 2011). It can be mea-sured quickly (as mV) in a root zone pore water sample extracted with a sipper using a hand-held mv/pH field probe. We did not collect redox data for this study.
Recommendations � Soil bulk density and percent
organic content should be measured at every vegetation plot (or as many as needed to adequately represent the plant community), beginning one year prior to restoration, and repeated at intervals of one, two, five and 10 years after restoration work is completed. If measurement of percent organic content presents a logistical or financial challenge, it can be omitted.
� Soil redox (not measured in this study) should be measured an-nually at every vegetation plot at least once per year, beginning one year prior to restoration, at mid to low tide, during the period of peak vegetation biomass (coin-ciding with salinity and depth to groundwater measurements). Data should be collected as close together in time as possible (same day or next day, or same week providing weather has been stable) for reference and resto-
Collecting elevation data in North Carolina tidal flats using survey grade Real-Time Kinematic GPS instru-ments.

12
ration sites. If more sampling periods are possible, they should also coincide with salinity and depth to groundwater measure-ments.
Wetland Surface Elevation ProfilesWetland surface elevation is a critical factor determining wetland plant community assemblages. In our study, vegetation plot elevations were a primary correlate of plant
species assemblages. Elevation was also a critical factor determining tidal wetland plant community struc-ture and function. Since elevation and tidal hydrology determine the pattern, frequency and duration of marsh inundation, elevation should be monitored for change over time.
Increases in marsh elevation indicate the ability of the marsh to sustain itself in response to increased inundation, either from restoration or from sea level rise. Decreases in marsh elevation signal subsidence or erosion, and indicate the loss of ability of the marsh to sustain itself in response to increased inunda-tion. Profiles of monitoring transects showing the elevation and location of zonal transitions, channels, pools and other surface features of note provide an excellent coarse-scale qualitative and quantitative summary of marsh ecogeomorphology that can be compared easily in time series.
Rod-surface elevation tables (RSETs) provide an excellent fine-scale quantitative summary of year-to-year or season-to-season change in marsh surface elevation. Feldspar soil horizon markers provide a critical understanding of the relative contri-bution of vertical accretion (mineral and organic matter accumulation on the marsh surface) to marsh surface elevation change at sites. Our ability to interpret our data would have been further enhanced by having information acquired from a mod-est network of rod-surface eleva-tion tables (RSETs) and feldspar soil horizon markers established at the site pairs.
Recommendations � Elevations of vegetation plots
and groundwater wells should be measured annually, beginning at least one year prior to restora-tion. Elevations should be tied to the North American Vertical Datum 1988 (NAVD88).
� Elevation data should be col-lected along vegetation monitor-ing transects beginning at least one year prior to restoration and repeated during the first, second and fifth years, and every five years thereafter. Elevation pro-files should be created showing all marsh zones, vegetation plots and transitions, from the eleva-tion data. Elevations should be tied to NAVD88 or a local tidal datum.
� Marsh surface elevations and vertical accretion using RSETs and feldspar soil horizon markers at restoration and reference sites should be measured annually (or seasonally, if possible), begin-ning at least one year prior to restoration.
Figure 2. Carex Lyngbyei monoculture at 14 year old tidal wetland restoration site in Oregon.

13
� The NERR System should develop training workshops focused on the measurement of marsh surface elevation changes and vertical accretion using survey-grade GPS RTK survey instru-ments, RSETs and feldspar horizon marker techniques to facilitate the evaluation of tidal wetland restoration projects.
Utility of long-term wetland monitoring sites at Reserves as reference sites for restoration sites within the region
The use of reference sites, especially those permanently protected within NERRS boundaries, provided, for the most part, appropriate benchmarks to evaluate the local restoration sites included in this study. Two reference
SOUTH SLOUGH NERR OR:
MONOTYPIC DOMINANCE BY ROBUST
NATIVE SEDGE
Percent cover data collected and analyzed for this three
year project shows the dominance of the common
native sedge, Carex Lyngbyei persisting at the Kunz
Marsh restoration site and the greater species diversity
at the Danger Point Marsh reference site (e.g., Figure
3). Many mid- to high marsh tidal wetland restoration
projects in Oregon develop plant communities over-
whelmingly dominated by C. lyngbyei (Figure 2). Some
have persisted for as long as 30 years (and counting).
The low diversity of these recovering emergent wet-
lands may be cause for concern but it helps to know
that some naturally-occurring marsh habitats can also
be dominated by this robust plant. And 30 years is
insignificant compared with the time tidal marshes may
need to develop diverse and complex biological and
physical attributes. It may be that disturbance events at
varying scales over the long term will push Kunz Marsh
vegetation cover inevitably towards a more diverse
plant community.
But since one of the most often cited justifications for
habitat restoration is the re-establishment of physical
and biological complexity, we wonder if the “Carex-
dominance” issue in the Pacific Northwest should
be investigated to determine whether tidal wetland
restoration practices for projects that would normally
rely on natural recruitment should include measures to
accelerate the development of more diverse plant com-
munities.
Figure 3. Percent cover means in the Kunz and Danger Point high marsh zone for each of the domi-nant emergent marsh species or species or element of interest at both sites. Asterisk denotes significant difference between sites for individual species. Species code for C. Lyngbyei is CARLYN.

14
sites outside of NERRS boundaries, permanently protected by national or local conservation groups, were also used in our analyses: 1) the Yaquina-28 (Y-28) site in the Yaquina estuary in Oregon was paired with the Yaquina-27 (Y-27) restoration site nearby (both sites are about 145 km from South Slough NERR), and 2) the Jacobs Point restoration site in Rhode Island used an adjacent reference site within the same estuary.
Since many of the NERRS reference sites in this study are part of system wide, long-term, monitoring programs that include emergent vegetation monitoring (e.g., NERRS Sentinel Sites), time series reference condition data for use in restoration project design and evaluation will continue to be available over the long term.
Recommendations � The NOAA Restoration Center and
others involved with tidal wetland restoration around the nation should consider the NERRS in their regions as sources of high quality reference condition data and ex-pertise in restoration monitoring and evaluation.
�� The NOAA Restoration Center and the NERRS Sentinel Site Work Group should collaborate to ensure that the variables selected for evaluating emergent wetland restoration for projects funded by the Restoration Center be included in the NERRS long-term emergent vegetation monitor-ing program. This will provide a usable, long-term, reference site data base for the Restoration Center.
South Slough NERR
Study Sites
Wells NERR
Narragansett Bay NERR
Chesapeake Bay VA NERR
North Carolina NERR
Figure 4.. Location of Nation-al Estuarine Research Reserve sites along coastlines in the continental U.S. and Alaska. Locations of the five sites participating in this project are indicated: Wells NERR, Maine; Narragansett Bay NERR, Rhode Island; Chea-speake Bay VA NERR, Virginia; North Carolina NERR; and South Slough NERR, Oregon.