Embed Size (px)
Citation preview

Measuring the use of Lightpath services
SURFnet – March 2007
Version: 0.9
1 Introduction National Research Networks (NRENs) and other modern data networks are gradually moving away from a single service IP model and towards a hybrid networking model. The hybrid network offers both IP services and lower-layer services, such as the transparent data pipes known as lightpaths. Lightpaths may be static connections, or they may be set up and torn down on a more dynamic basis. In this environment, measuring the use of services is less straightforward than in more traditional IP networks. Each of the services offered has its own characteristics and dynamics, and particularly the dynamic lightpath service differs from other, more traditional services. Although there are some parallels to the telephony world, the standard metrics used in telephony (the Erlang model) can not readily be applied to lightpaths. There is, therefore, a need for methods to measure the usage of each service provided, and for metrics which effectively summarise the use of the entire network.
2 Requirements for new metrics Usage metrics from the NREN serve several stakeholders, each with their own purposes and requirements. A set of metrics for the usage of the network and its services will therefore have to match the different requirements of each of these stakeholders. For the purpose of this paper, the following stakeholders were identified: • The general public and policy makers; • Connected organizations; • Functions within the network operator itself: accounting and charging; and planning and design. Based on a short set of interviews with representatives of each of these stakeholders, the following requirements were identified:
General public and policy makers An NREN will usually be funded, at least in part, through public funds. This implies an obligation to provide some insight to the public and to policy makers about the value provided through the network in order to justify the expenditures. Therefore, the NREN will need a simple way to express that value in terms of services provided. The general public and policy makers need to be shown the ‘general picture’. Metrics used for this ‘general picture’ should be easy to explain, and easy to represent in a simple graphic. A ‘balanced scorecard’ approach, which combines different measurements into a single metric, is therefore less suitable. A metric based on a balanced scorecard is easy to chart, but very complex to explain.

In the past, the main metric used for this purpose was the number of Terabytes transported across the network through the IP service. This provides a somewhat oversimplified, but useful representation of use of the network. It disregards packet overhead, overprovisioning and other factors which are an integral part of the service provided, but it provides a good proxy for the value of the service to the connected organizations. It is therefore a useful metric as long as IP is the only service provided. Figure 1 shows an example of a chart currently provided for this stakeholder group, showing the number of Terabytes transported per month:
Figure 1: IP traffic per month (Source: SURFnet annual report)
New metrics, representing the use of other services as well as IP, should be equally simple to chart, and equally easy to explain as this metric.
Connected organizations Organizations connected to the Research Network expect to receive some feedback regarding the services provided to them. Currently, connected organizations have access to IP statistics comparable to the chart above, showing the traffic on their interfaces. These charts are available on different timescales, as an organization will need to know minute-by-minute as well as year-by-year developments. Figure 1 shows an example of such a chart, showing 1-minute average IP traffic on a single 1 Gigabit interface.

Figure 2: 1-Minute average IP traffic for a single interface (Source: SURFnet statistics)
As organizations start using other services of the hybrid network, they will require more feedback on the use of these services as well. In contrast to the general public, these organizations do not expect an aggregated chart combining several services, but separate metrics on each service. Connected organizations need metrics that allow them to understand their own use of the network, to anticipate capacity bottlenecks, and to justify the cost of the connection internally in terms of value provided. They may also need data in order to allocate costs to different internal users, and to spot anomalies which may indicate failures or security incidents. For these purposes, connected organizations will expect reports on the capacity of each interface, the network capacity available to that interface (which is not necessarily the same), and the usage patterns of each service at different timescales. Preferably, they would want to correlate the use of the interface to their internal users. This may imply separating traffic by IP address or other endpoint characteristics. Some of the more sophisticated users will also have their own measurement systems in place, and will therefore not require complex measurements from the operator of the network. For these users, usage measurements from the operator only serve as a confirmation of their own measurements.
Network operator: accounting and charging; planning and design The operator of the network has a number of purposes in extracting usage data from the network. Besides the need to inform the above stakeholders, the operator has its own needs. Data is needed on which to base charging mechanisms and cost allocation, and as a basis for capacity planning and for network design. Usage data can also be useful for troubleshooting and network health monitoring. For charging and accounting purposes, the operator requires metrics which have a clear link to the claim on resources corresponding to each unit of service. Although NRENs tend to have fairly straightforward charging structures, understanding the costs of services at a more detailed level is important for decisions on tariffs. By mapping usage metrics on the cost of the resources used, the operator can accurately model the cost of services provided as a basis for pricing decisions. For capacity planning and network design, the operator needs data which highlight current or future bottlenecks in the network, both at a local level and across the network. This implies measuring the capacity and the fill grade for each link and for each device, at each level of the network and at each moment in time. It also implies an understanding of the manual and automated routing decisions that
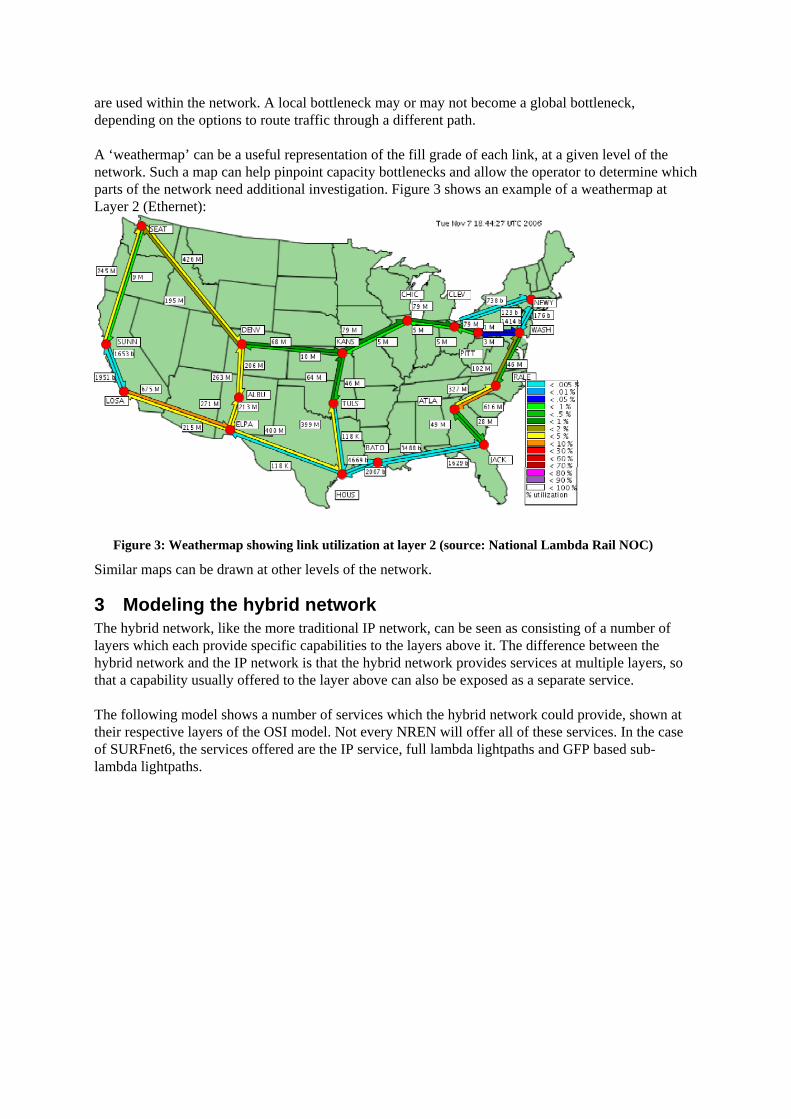
are used within the network. A local bottleneck may or may not become a global bottleneck, depending on the options to route traffic through a different path. A ‘weathermap’ can be a useful representation of the fill grade of each link, at a given level of the network. Such a map can help pinpoint capacity bottlenecks and allow the operator to determine which parts of the network need additional investigation. Figure 3 shows an example of a weathermap at Layer 2 (Ethernet):
Figure 3: Weathermap showing link utilization at layer 2 (source: National Lambda Rail NOC)
Similar maps can be drawn at other levels of the network.
3 Modeling the hybrid network The hybrid network, like the more traditional IP network, can be seen as consisting of a number of layers which each provide specific capabilities to the layers above it. The difference between the hybrid network and the IP network is that the hybrid network provides services at multiple layers, so that a capability usually offered to the layer above can also be exposed as a separate service. The following model shows a number of services which the hybrid network could provide, shown at their respective layers of the OSI model. Not every NREN will offer all of these services. In the case of SURFnet6, the services offered are the IP service, full lambda lightpaths and GFP based sub-lambda lightpaths.

IP
Lightpath (λ rate)
Dark fiberFiber
Lambda
TDM (GFP/VCAT)
Ethernetaggregation
IP Routing
Lightpath (sub-λ)
Ethernet VLAN
Network capability Service
Layer 0
Layer 1
Layer 2
Layer 3
Figure 4: Services and capabilities in the hybrid network
For each capability on the left-hand side of the model, the usage by the layers above it and the usage by the service depicted on the right can be expressed similarly. In fact, the layer above can be modeled as a ‘customer’ using the same service which is also provided to ‘real’ customers. The following lists the capabilities as shown in the model, and the logical units to measure the usage of these capabilities.
Layer 0: fibers and wavelengths The logical unit of measure of capacity at the lowest layer of an optical system is the actual fiber transporting the optical signal. A fiber offers a capability to transport a number of lambda’s, depending on the WDM equipment used. Fibers are usually used in pairs, but as there are also bidirectional WDM systems using a single fiber, the basic unit should be a single fiber. Fibers are usually static, and are provisioned manually. A fiber may be provided to a customer as a dark fiber service, or it can be used as a capability to support an optical transport service. At the optical level, the WDM system provides wavelengths, or lambda’s, between two points. Lambda’s are usually fairly static, providing a fixed route between endpoints or network elements. However, the hybrid network may also support lambda switching, making end-to-end lambda’s more dynamic. The logical unit of measure at this level is the lambda, which depending on the quality of the fibers and optical equipment may support 2.5 Gbit/s, 10Gbit/s, or some other maximum throughput. A static or dynamic lambda can be provided to a customer as a lightpath service, allowing the customer to create a transport path at 2.5 Gigabit or more, or it can be used as a capability to support TDM optical switching.
Layer 1: optical switching Based on a lambda, the network may use Sonet framing to create one or more TDM based paths across the network. Using digital crossconnects, these paths can be provisioned and re-routed as needed; they
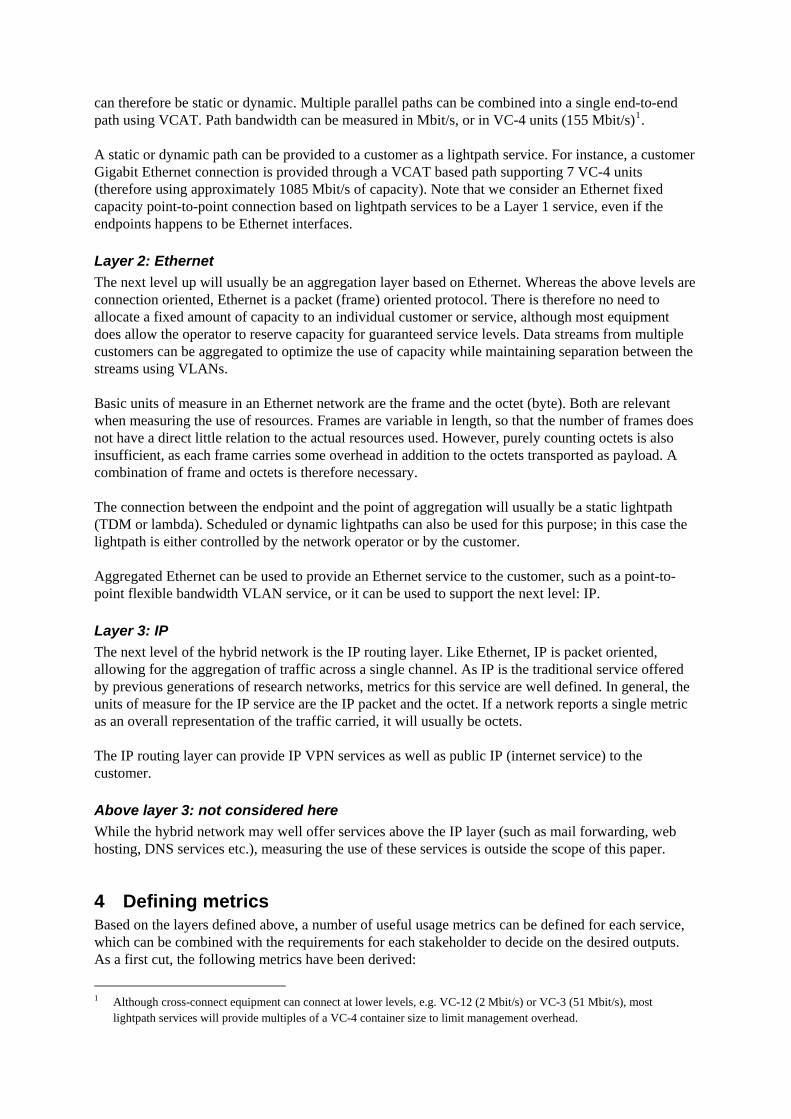
can therefore be static or dynamic. Multiple parallel paths can be combined into a single end-to-end path using VCAT. Path bandwidth can be measured in Mbit/s, or in VC-4 units (155 Mbit/s)1. A static or dynamic path can be provided to a customer as a lightpath service. For instance, a customer Gigabit Ethernet connection is provided through a VCAT based path supporting 7 VC-4 units (therefore using approximately 1085 Mbit/s of capacity). Note that we consider an Ethernet fixed capacity point-to-point connection based on lightpath services to be a Layer 1 service, even if the endpoints happens to be Ethernet interfaces.
Layer 2: Ethernet The next level up will usually be an aggregation layer based on Ethernet. Whereas the above levels are connection oriented, Ethernet is a packet (frame) oriented protocol. There is therefore no need to allocate a fixed amount of capacity to an individual customer or service, although most equipment does allow the operator to reserve capacity for guaranteed service levels. Data streams from multiple customers can be aggregated to optimize the use of capacity while maintaining separation between the streams using VLANs. Basic units of measure in an Ethernet network are the frame and the octet (byte). Both are relevant when measuring the use of resources. Frames are variable in length, so that the number of frames does not have a direct little relation to the actual resources used. However, purely counting octets is also insufficient, as each frame carries some overhead in addition to the octets transported as payload. A combination of frame and octets is therefore necessary. The connection between the endpoint and the point of aggregation will usually be a static lightpath (TDM or lambda). Scheduled or dynamic lightpaths can also be used for this purpose; in this case the lightpath is either controlled by the network operator or by the customer. Aggregated Ethernet can be used to provide an Ethernet service to the customer, such as a point-to-point flexible bandwidth VLAN service, or it can be used to support the next level: IP.
Layer 3: IP The next level of the hybrid network is the IP routing layer. Like Ethernet, IP is packet oriented, allowing for the aggregation of traffic across a single channel. As IP is the traditional service offered by previous generations of research networks, metrics for this service are well defined. In general, the units of measure for the IP service are the IP packet and the octet. If a network reports a single metric as an overall representation of the traffic carried, it will usually be octets. The IP routing layer can provide IP VPN services as well as public IP (internet service) to the customer.
Above layer 3: not considered here While the hybrid network may well offer services above the IP layer (such as mail forwarding, web hosting, DNS services etc.), measuring the use of these services is outside the scope of this paper.
4 Defining metrics Based on the layers defined above, a number of useful usage metrics can be defined for each service, which can be combined with the requirements for each stakeholder to decide on the desired outputs. As a first cut, the following metrics have been derived:
1 Although cross-connect equipment can connect at lower levels, e.g. VC-12 (2 Mbit/s) or VC-3 (51 Mbit/s), most
lightpath services will provide multiples of a VC-4 container size to limit management overhead.

Layer 0: fiber and lambda Dark fiber provided as a service: - Number of dark fiber runs connected; - Total kilometers of dark fiber runs; - Amount of data transported / month2 Fiber as a network capability: - Number of fiber runs connected to customers; - Total length of cable and fiber across the network. Static lambda lightpath service: - Number of lambda lighpaths provided; - Total bandwidth of lambda lighpaths in use based on endpoint interfaces; - Amount of data transported / month Scheduled and dynamic lambda lightpath services: - Number of interfaces capable of using lambda service; - Total bandwidth of endpoint interfaces; - Total bandwidth x hours of use product per month; - Number of requests for lightpath set-up/tear-down per month; - Blocking probability (failed requests as percentage of all requests); - Amount of data transported / month Layer 1: Static TDM based lightpath service: - Number of lighpaths provided; - Total bandwidth of lighpaths provided; - Amount of data transported / month Scheduled and dynamic Sonet framed lightpath services: - Number of interfaces capable of using TDM lightpath service; - Total bandwidth of endpoint interfaces; - Total bandwidth x hours of use product per month; - Number of requests for lightpath set-up/tear-down per month; - Blocking probability (failed requests as percentage of all requests); - Amount of data transported / month Layer 2: Ethernet VLAN services: - Number of interfaces; - Total transport capacity provided to interfaces (size of lightpath connected to interface); if the
interface uses a dynamic lightpath, the bandwidth x hours product per month for that lightpath; - Total octets transported / month; - Number of drops / month. Layer 3: IP services: - Number of interfaces; - Total transport capacity provided to interfaces (size of lightpath connected to interface); if the
interface uses a dynamic lightpath, the bandwidth x hours product per month for that lightpath;
2 The amount of data transported at the layers 0 and 1 is outside the network operator’s control, but is relevant as a metric

- Total octets transported / month, by IP version and unicast/multicast service; - Peak and average packet loss.
5 Applying the potential metrics to stakeholder requirements From the requirements discussed earlier, it is clear that there is a certain hierarchy in the requirements for usage metrics. At the top, the general public and policy makers require simple metrics at the highest aggregation level; at the next level the connected organizations need some more detail; and at the lowest level, the network operator needs detailed metrics for individual services, devices, and links. Figure 5 illustrates this concept:
General public andpolicy makers
Connectedorganizations
Networkoperator
Figure 5: Differences in complexity, by stakeholder group
General public and policy makers This stakeholder group is interested in the value of the network in terms of services provided. Therefore, metrics related to this value are more relevant to this group than the internals of the network. However, sometimes internal metrics can speak to the imagination. For instance, the number of kilometers of fiber is an interesting metric to the public, even though it is internal to the network. The value of a service to the end users can be expressed either in terms of the capacity provided, or in terms of capacity actually used by the end users. While this latter measure may be more interesting, it is largely outside of the NREN’s control, and therefore less representative of the value provided. The final set of metrics provided to this stakeholder group will have to be limited to a small set, composed from the potential metrics listed above. A balance has to be found between the essential differences that exist between service and metrics as listed, and the requirement for a small set of simple metrics. As mentioned, a composite metric based on a balanced score card does not fit the requirement that metrics have to be easy to explain, even if such a composite may well provide the fairest possible picture of the services provided. The most relevant composite metric is the total number of bytes (octets) transported across the network, regardless of the type of service used. Although the network costs involved in providing the services may differ, this total gives a clear picture of the use made of the network as a whole. For the
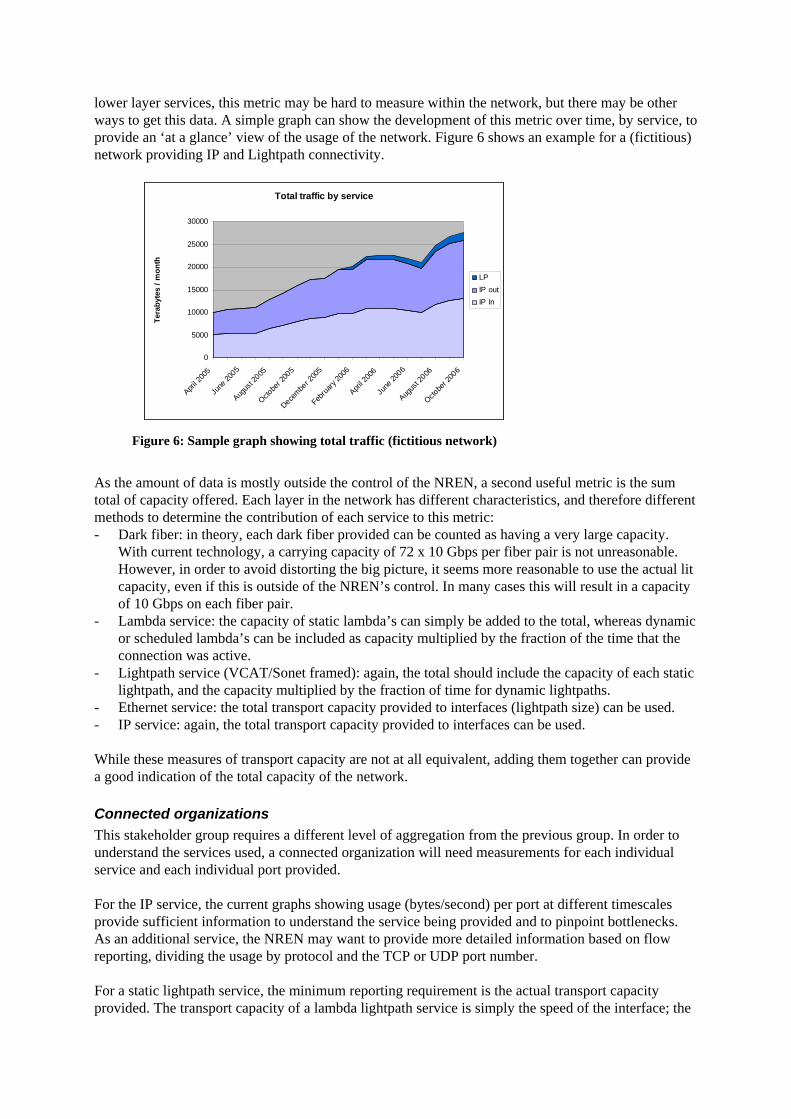
lower layer services, this metric may be hard to measure within the network, but there may be other ways to get this data. A simple graph can show the development of this metric over time, by service, to provide an ‘at a glance’ view of the usage of the network. Figure 6 shows an example for a (fictitious) network providing IP and Lightpath connectivity.
Total traffic by service
0
5000
10000
15000
20000
25000
30000
April 2
005
June
2005
Augus
t 2005
Octobe
r 200
5
Decembe
r 200
5
Februa
ry 20
06
April 2
006
June
2006
Augus
t 2006
Octobe
r 200
6
Tera
byte
s / m
onth
LPIP outIP In
Figure 6: Sample graph showing total traffic (fictitious network)
As the amount of data is mostly outside the control of the NREN, a second useful metric is the sum total of capacity offered. Each layer in the network has different characteristics, and therefore different methods to determine the contribution of each service to this metric: - Dark fiber: in theory, each dark fiber provided can be counted as having a very large capacity.
With current technology, a carrying capacity of 72 x 10 Gbps per fiber pair is not unreasonable. However, in order to avoid distorting the big picture, it seems more reasonable to use the actual lit capacity, even if this is outside of the NREN’s control. In many cases this will result in a capacity of 10 Gbps on each fiber pair.
- Lambda service: the capacity of static lambda’s can simply be added to the total, whereas dynamic or scheduled lambda’s can be included as capacity multiplied by the fraction of the time that the connection was active.
- Lightpath service (VCAT/Sonet framed): again, the total should include the capacity of each static lightpath, and the capacity multiplied by the fraction of time for dynamic lightpaths.
- Ethernet service: the total transport capacity provided to interfaces (lightpath size) can be used. - IP service: again, the total transport capacity provided to interfaces can be used. While these measures of transport capacity are not at all equivalent, adding them together can provide a good indication of the total capacity of the network.
Connected organizations This stakeholder group requires a different level of aggregation from the previous group. In order to understand the services used, a connected organization will need measurements for each individual service and each individual port provided. For the IP service, the current graphs showing usage (bytes/second) per port at different timescales provide sufficient information to understand the service being provided and to pinpoint bottlenecks. As an additional service, the NREN may want to provide more detailed information based on flow reporting, dividing the usage by protocol and the TCP or UDP port number. For a static lightpath service, the minimum reporting requirement is the actual transport capacity provided. The transport capacity of a lambda lightpath service is simply the speed of the interface; the

transport capacity of a sub-lambda lightpath may be lower than the interface bandwidth. For instance, the network can provide lightpaths of various capacities to a Gigabit Ethernet interface. For a dynamic or scheduled lightpath service, the reporting requirements are more elaborate. For the static part of the connection (the transport capacity up to the first network element that provides lightpath switching), the organization will need to know the transport capacity; for the lightpath service behind it, the organization will need reporting on the actual use of the service. At the least this should include: - Hours of use x bandwidth product; - Number of lightpath setup attempts, and success ratio; - If the setup mechanism allows other results than success or failure, such as a delayed setup or a
smaller capacity than requested, number of attempts that resulted in partial success and the average delay or the average capacity reduction;
For both static and dynamic services, the organization may also wish to receive measurements on the actual data transported (total octets in various timeframes).
Network operator: accounting and charging; planning and design Accounting and charging: In order to understand the cost of services provided, the network operator will need to know the cost, capacity, and usage of each capability at each layer, as described in the model (see Figure 4). To achieve this, the entire set of metrics listed in chapter 4 will have to be collected, with the exception of actual data transported at layers 0 and 1. There is no need to collect the data at small time intervals; for the purpose of accounting and charging, monthly reports on all these metrics should be sufficient. For each capability in the network, the corresponding costs per actual unit of use can be deduced from the cost of the network elements involved, the cost of the lower layer capabilities required, and the use of the capability. Internal use by the higher layers in the network and direct use by a connected organization can be treated identically. Planning and design: For network planning purposes, it is essential to understand the usage of the network at each level of the network, for each device and each link. These can be derived from the same metrics described above, but at more granular timescales. However, there is also a need for end-to-end traffic data at a detailed level, in order to decide on topology changes in the network. This data can be expressed with the same metrics as at the link level. A lot of work has been done regarding end-to-end measurements at the IP level, usually based on flows ( [7] ). At a high enough level of aggregation, IP flows can be modeled in a similar way to telephony traffic. The results can be used for network capacity engineering using the Erlang model, although there are some limitations in this approach, caused by the different nature of IP flows ( [8] , [9] ). For lightpaths the situation is less clear. The Erlang model does not apply, at least not in the foreseeable future, as is explained in the next chapter. There is no easy way to establish the capacity required in the network from the number and duration of dynamic lightpath requests, as the pattern of use is as yet unpredictable. The operator will therefore have to measure the actual utilization grade of resources within the network over time, and start expanding the network long before any blocking occurs. The alternative

is to measure the actual blocking probability to drive capacity engineering, but this implies accepting a certain amount of blocking. Depending on the growth rate and the delivery time for additional capacity, this may or may not be acceptable to the NREN. As long as the number of users and the number of different applications remains limited, the only way for the NREN to forecast usage of switched lightpaths services will be to talk to the users, and understand their plans with regard to the service. Only with large numbers does it make sense to forecast future use from current trends.
6 Why the Erlang model does not work for lightpaths Scheduled or dynamic lightpaths can be considered as a connection oriented service, comparable in some ways to traditional telephony. Useful metrics for the telephony world are well known: usage is expressed in Erlangs, and the number of Erlangs on a link has a direct relation to the capacity needed to achieve a given quality level in terms of blocking probability. In essence, the number of Erlangs is the average number of circuits in use over a given time interval, assuming a standard stochastic distribution of arrival times and call durations. Given the traffic intensity in Erlangs and the capacity available, the blocking probability can be calculated through a relatively simple formula:
∑=
=
=Ci
i
X
C
b
XE
CE
P
0 !
!
Where Pb is the blocking probability, C is the capacity (number of circuits), and E is the traffic in Erlangs. The Erlang model can be adapted for the use in data networks, for instance by modeling flows across an IP network as individual connections [7] . However, the standard Erlang model has a number of limitations that reduce its usefulness for scheduled and dynamic lightpaths, at least for the time being. This is because the model is based on a number of assumptions which can not be expected to apply in this case. Specifically, for the Erlang B formula to apply: - Each connection must use the same capacity (e.g. one trunk line); - Arrival times between requests for connections must follow a Poisson distribution; - Hold times for connections must follow an inverse exponential distribution. To start with, lightpaths do not necessarily all use the same capacity. However, it is possible to rework the Erlang formula to represent connections with different capacity, if the distribution is known. More importantly, the arrival and hold times will probably not follow the same distribution curves as their telephony counterparts. The Poisson distribution of arrival times in the telephony world does not arise by conscious intent; instead, it is the result of a large number of independent callers, calling for a large number of different reasons. Only for such large numbers does the model hold3. In contrast, the dynamic services provided by the NREN’s will not achieve large numbers for some time to come, and the reasons to use lightpaths will not vary sufficiently. For instance, if a significant portion of lightpath users want to use the service to run remote backups, whatever pattern of use is
3 In principle, the Poisson distribution results from an infinite number of completely independent sources.

reasonable for a backup application (start at 20:00, or at midnight; run for several hours) will strongly skew the distribution. Scheduled lightpaths will be even further away from the standard distribution: if a researcher has to schedule an experiment a day in advance, he is far more likely to request a starting time of 8:00 or 9:00 than a starting time of 8:37. The distribution of arrival times can therefore be expected to contain large peaks at round times. Similarly, the duration of a scheduled lightpath is more likely to be a round number of hours than some value in between. Only when applications start requesting lightpaths on a more autonomous basis, is this bias likely to disappear. After all, applications are less likely than humans to have a preference for round numbers. If the Erlang model does not hold, and the distribution of lightpath requests can not be modeled as a stochastic function, there is no formula available to correlate blocking probability, the amount of traffic, and capacity. However, it is still possible to measure each of these independently, and establish criteria for capacity upgrades based on desired blocking probability levels.
7 Conclusions / next steps This paper examines the need for metrics in the hybrid network environment. It does not comment on the availability of the metrics described, or the tools needed to extract these metrics from the network. As a next step, an investigation is needed to determine whether the network equipment can actually provide these metrics, and how the data can be collected and integrated. If the network can not provide the data, alternatives will have to be investigated. For instance, measurement probes could provide additional data. It may also be possible to include data provided by the connected organizations from their equipment, and to deduce some of the data through extrapolation of other data.
Literature: [1] S. Ramamurthy, L. Sahasrabuddhe, and B. Mukherjee: ”Survivable WDM Mesh Networks”, in Journal of Lightwave
Technology, vol. 21, no. 4, April 2003 [2] Son-Hong Ngo, Xiaohong Jiang and Susumu Horiguchi: “Adaptive routing and wavelength assignment using ant-
based algorithm”, in IEEE Networks Proceedings, November 2004 [3] Gangxiang Shen, W.D. Grover: “Automatic Lightpath Service Provisioning with an Adaptive Protected Working
Capacity Envelope based on p-Cycles”, in DRCN 2005 Proceedings, October 2005 [4] Jung-Tsung Tsai and Cheng-Huang Lien: “A Lightpath Allocation Strategy for Fair Routing in WDM Networks”, in
Journal of the Chinese Institute of Engineers, September 2003 [5] Eric He, Xi Wang, Venkatram Vishwanath, Jason Leigh: “AR-PIN/PDC: Flexible Advance Reservation of
Intradomain and Interdomain Lightpaths”, Globecom 2006, November 2006 [6] “Traffic Modeling and Resource Allocation in Call Centers”, Diagnostic Strategies
(http://www.diagnosticstrategies.com/traffic_modeling.htm) [7] F. Afanasievy, W. Dalyz, A. Petrovy, and A. Sukhov: “Flow-based analysis of Internet traffic”, in Russian Edition of
Network Computing, 2003 [8] V. Erramilli, Mark Crovella, and Nina Taft: “An Independent-Connection Model for Traffic Matrices”, in 6th ACM
SIGCOMM on Internet measurement Proceedings, October 2006 [9] A. Mansy and C. Dovrolis: “The Mythical Traffic Matrix”; in Workshop on Internet Routing Evolution and Design
(WIRED), October 2006

Glossary The following definitions are used within this paper: Lightpath: In some publications, the term lightpath is used to denote any form of wide area connection with a large, guaranteed bandwidth and predictable latency. This definition makes some sense from a user point of view, but for any technical discussion, a more narrow definition is necessary. This paper will follow the SURFnet terminology, in which a lightpath is either an entire lambda across an optical network, or an end-to-end service over a next-gen SONET-framed infrastructure supporting GFP-F and VCAT. At this time lambda services are used to provide 10 Gbit/s connectivity while the GFP/VCAT paths are used for smaller bandwidth such as 1 Gbit/s. In either case, the lightpath provides a dedicated path to the connected endpoints. Scheduled lightpath: a user-controlled lightpath service where requests to change essential aspects of the service are submitted well in advance (e.g. an hour or more before the change is needed), and the use of the lightpath is fairly static (e.g. using the same topology and bandwidth for several hours or longer). Dynamic lightpath: a user-controlled lightpath where requests for changes are expected to be satisfied in a time-scale ranging from milliseconds to minutes.