Embed Size (px)
Citation preview

Agrekon, Vol 43, No 1 (March 2004) Leaver
MEASURING THE SUPPLY RESPONSE FUNCTION OF TOBACCO IN ZIMBABWE R Leaver1 Abstract This paper presents an estimate of the price elasticity of supply for tobacco output in Zimbabwe using an adapted Nerlovian model. The results indicate a short-run elasticity of +0.34 and a long-run elasticity of +0.81, suggesting that tobacco farmers are highly unresponsive to price changes. These estimates are similar to those obtained for tobacco in supply response studies conducted in other developing African countries. 1. INTRODUCTION The tobacco control literature is unanimous about the detrimental effects of smoking on human health. For example, the World Bank (1999) notes that by 2030, tobacco will account for approximately 10 million deaths per year. This will make it the single biggest cause of death worldwide. Solutions to the epidemic have generally focussed on reducing the demand for tobacco products. It has been shown that the most effective way to reduce demand is through price increases on cigarettes. This is achieved by increasing the tax rate on cigarettes, which has the further advantage of generating additional revenue for government (World Bank, 1999). However, little attention has been paid to the effects that these measures will have on the supply side, despite the fact that microeconomic theory predicts that a reduction in demand will lead to a lower equilibrium price for a given level of tobacco output. The difficulty with many demand side approaches is that they ignore the impact on the farmers whose livelihoods depend on tobacco. Tobacco is of primary importance to the Zimbabwean economy, making it worthwhile to investigate tobacco farmers’ production decisions. Whilst a handful of studies have analysed the supply elasticity of tobacco in Nigeria, Malawi and Tanzania (Askari & Cummings, 1977; Mshomba, 1989), there are no recent studies from Zimbabwe.
1 Researcher on the Provide Project, Western Cape Department of Agriculture, and Postgraduate Student, School of Economics, University of Cape Town.
113
Agrekon, Vol 43, No 1 (March 2004) Leaver The first objective of this article is to estimate supply response in the Zimbabwean tobacco sector. Specifically, the study covers the period 1938-2000, and estimates the supply elasticities of tobacco using an adapted Nerlovian model. The research was enabled by reliable and current data that were available from the Zimbabwe Tobacco Association, giving the opportunity to quantify Zimbabwe tobacco growers’ supply response in reaction to changes in the price of tobacco. A second objective of the article is to develop a framework upon which further investigations of the tobacco industry can be based. For example, the international tobacco industry is negatively affected by anti-tobacco legislation, especially in the developed economies, raising the question of economic development in economies that are dependent on the production of tobacco. The intention of this continued research will be to evaluate possible policy interventions. It will also enable an analysis of the effects of Zimbabwe’s current political disturbances on the tobacco supply response to be conducted once sufficient data are available. 2. THE ZIMBABWEAN AGRICULTURAL SECTOR In 1997 President Mugabe announced a controversial programme of land redistribution in Zimbabwe, throwing the economy into disarray. Approximately 1,500 white-owned commercial farms, comprising almost half of Zimbabwe’s total commercial farmland, were designated for seizure without compensation, and divided amongst landless people. In February 2000 Zimbabweans claiming to be veterans of the country’s war of independence began violently occupying white-owned farms just weeks before elections were due to be held. ZANU narrowly won the elections, amidst allegations of corruption and intimidation. By April 2001 more than 1,700 farms had been invaded and occupied by supporters of Mr Mugabe, and more than 70% of all farms, about 2,800 in total, had been listed by the government for compulsory acquisition. Squatters forcibly prevented farmers from planting crops, causing many farms to go out of business. A total of 260 tobacco producing farms had been occupied by July 2001, resulting in a 10,000 hectare reduction in area planted to tobacco (Zimbabwe Tobacco Association, 2001). Total production has dropped from 230m kg in 2000 to 120m kg in 2003 (African Farming and Food Processing, 2003:28). In more normal times, the agricultural sector plays a central role in Zimbabwe’s economy, accounting for almost 10% of gross domestic product and 44% of export earnings in the late 1990s. In addition, agriculture is the largest employer, with large-scale commercial farms employing 29% of the
114

Agrekon, Vol 43, No 1 (March 2004) Leaver total formal sector work force. Given the goals of ensuring food security, increasing export earnings and raising the standards of living in rural areas, the agricultural sector is crucial to sustained growth and development (Mudhara et al, 1997).
National Land 17%
Resettlement Areas
9%
Communal Areas 42%
Small-scale Commercial
Areas4%
Large-scale Commercial
Areas28%
Source: Commercial Farmers Union, 2001. Figure 1: Distribution of total land area in Zimbabwe, 1996 Zimbabwe has a dualistic agricultural sector, consisting of both large-scale commercial and smallholder farmers (Mudhara et al, 1997). Figure 1 shows the distribution of land between these sectors in 1996. The smallholder farming sector includes approximately 8,500 small-scale commercial farms, 800,000 communal farms and 50,000 families who are accommodated in resettlement areas. The smallholder farming sector consists mostly of poor, subsistence farmers who lack access to modern farming methods. Tobacco contributes the greatest proportion to the total value of agricultural output. Whilst the large-scale commercial farming sector consisted of about 4 500 farms prior to the land invasions, the bulk of Zimbabwe’s agricultural production and national income was generated by this sector. Large-scale commercial farmers were relatively prosperous, which enabled them to invest in highly mechanised farming techniques and irrigation systems. In addition, the majority of the commercial farms are situated in the most fertile areas of the country. These factors have resulted in large-scale commercial farmers
115

Agrekon, Vol 43, No 1 (March 2004) Leaver being more resistant to external shocks, such as drought, than smallholder farmers (Taylor, 1999). Zimbabwe (Commercial Farmers Union, 2001). Figure 2 illustrates the percentage that each commodity added to the total value of Zimbabwe’s agricultural output in 2000. Tobacco (39.9%), beef (10.5%), and maize (8.5%) are the three main agricultural commodities produced.
Poultry4.9%
Coffee1.8%
Tea2.8%
Soyabean2.6%
Ostriches0.5%
Cotton1.9%
Maize8.5%
Paprika1.7%
Wheat4.7%
Pigs0.6%
Barley0.7%
Dairy4.0%
Wildlife0.3%
Sugar7.0%
Tobacco39.9%
Beef10.5%
Horticulture6.8%
Source: Commercial Farmers Union, 2001. Figure 2: Percentage contribution to total value of agricultural output Zimbabwe is one of the world’s top three producers of high-quality flue-cured Virginia leaf tobacco, along with the United States and Brazil. Some 3% of arable land is under tobacco. Due to its labour intensity, tobacco production accounts for a third of people employed in the agricultural sector, making it the single largest employer of labour in the economy (Zimbabwe Tobacco Association, 2001). Tobacco is also Zimbabwe’s most important contributor to foreign exchange earnings, accounting for more than a quarter of total exports. The importance of tobacco to the Zimbabwean economy is further illustrated by the fact that it contributed 8.2% to gross domestic product in 2000. Table 1 illustrates the contribution of tobacco to total exports and gross domestic product (GDP) in Zimbabwe’s economy over the past six years.
116

Agrekon, Vol 43, No 1 (March 2004) Leaver Table 1: Tobacco’s contribution to the Zimbabwean economy
Year Percent of Total Exports Percent of GDP 1995 25 8.5 1996 33 9.9 1997 26 7.2 1998 26 8.4 1999 32 9.9 2000 28 8.2
Source: Zimbabwe Tobacco Association, 2001.
Almost all of Zimbabwe’s tobacco is exported, with most going to the European Union, particularly Germany, the United Kingdom and France. Other large importers are Russia, the Far East, and China. It is interesting to note that Africa (as a continent) is the fourth largest importer, accounting for almost 9% of Zimbabwe’s tobacco exports. The quantity of tobacco imported by Africa doubled in the first six months of 2001, from its level of 3,376.6 tonnes in 2000 (Tobacco Industry and Marketing Board, 2001). 3. RECENT DEVELOPMENTS IN THE TOBACCO SECTOR
Zimbabwe has a long history of political instability, a factor known to have a negative impact on agricultural production (Mamingi, 1997). Figure 3 shows the total volume of tobacco produced in Zimbabwe for the period 1938-2000. Yield has shown a relatively steady increase since 1938. However, the structural breaks that occur in output are attributable to a combination of political instability and unfavourable weather patterns.
0
50000
100000
150000
200000
250000
1938
1941
1944
1947
1950
1953
1956
1959
1962
1965
1968
1971
1974
1977
1980
1983
1986
1989
1992
1995
1998
2001
F
Time (Years)
Out
put (
tons
)
Source: Zimbabwe Tobacco Association, 2001.
Figure 3: Total Zimbabwean tobacco output: 1938-2000
117

Agrekon, Vol 43, No 1 (March 2004) Leaver In 1965 Ian Smith, the leader of what was then Rhodesia, announced the Unilateral Declaration of Independence (UDI), severing ties with Britain. In 1969, after the United Nations had imposed sanctions, Rhodesia declared itself a republic. A black nationalist party, the Zimbabwe African National Union (ZANU), sought to overthrow the colonial government by launching guerrilla attacks throughout the 1970s. In 1979 the regime attempted to compromise by introducing a new constitution that allowed limited black majority rule with political safeguards for whites. After elections that year, a moderate black leader, Bishop Abel Muzorewa, took office as Prime Minister. However, ZANU did not accept his appointment, and in 1980 the Rhodesian government signed the Lancaster House agreement for majority rule. ZANU won a decisive victory in elections held that year, and Robert Mugabe was installed as Prime Minister (Time Magazine online, 2001).
The impact of UDI and the associated political unrest is evident from the 65% decrease in tobacco output between 1965 and 1970. Total exports decreased because of sanctions. The tobacco crop remained stagnant at relatively low levels until 1975 when it gradually began increasing again. However, the signing of the Lancaster House agreement and the ZANU victory in the 1980 elections caused another sudden decrease in tobacco output between 1980 and 1982. This time the drop was explained by a combination of decreased confidence and the flight of the white population who still dominated commercial farming and hence tobacco production.
Land reform, specifically the redistribution of white-owned land to landless black peasants, was promised by the ZANU government but was delayed in order to smooth the transition to majority rule. Unresolved political conflict in South Africa and the civil war in Mozambique threatened the stability of the new state. In anger at ZANU’s support for the African National Congress (ANC) and the Mozambican government, South Africa blocked the export of Zimbabwean products through South African ports. This had a crippling effect on the Zimbabwean economy (Time Magazine online, 2001).
During the 1980s there was also much unrest within Zimbabwe’s borders. Opposition movements began to question the validity of the 1980 elections and corruption scandals rocked Mugabe’s government. Landless peasants grew increasingly anxious as land reform programmes failed to be implemented. In the 1990s Zimbabwe agreed to implement a structural adjustment programme, designed to move the country from a state-controlled economy to a free-market economy, in exchange for economic assistance from the World Bank and the IMF. The economic crisis began to abate, and in 1996 Mugabe was re-elected as President (Time Magazine online, 2001).
118

Agrekon, Vol 43, No 1 (March 2004) Leaver Figure 3 shows that the tobacco crop increased sharply from 1991-1993 after displaying moderate growth since 1982. In the 1990s total output was about a third higher than in the 1970s and 1980s. This dramatic increase was due to farmers’ increased confidence in the Zimbabwean economy following government’s agreement to implement the World Bank structural adjustment programme.
As previously stated, weather patterns also exert a significant influence on agricultural production. These irregular weather patterns negatively affect agricultural output by interfering with the harvesting, planting or growth of crops (Mamingi, 1997). The past decade has been characterised by both severe drought and floods. Lower than average rainfall was experienced between 1990 and 1995, which caused the fall in tobacco output between 1994 and 1995 (Commercial Farmers Union, 2001). Heavy rains were experienced in the 1998 and 1999 season, with severe flooding occurring in 2000.
Figure 4 shows real Zimbabwean tobacco prices for the period 1938-2000, deflated using the Zimbabwean consumer price index with a base year of 1990. The data show a marked decrease in real tobacco price between 1946 and 1970, when the price dropped from 8.4 Zimbabwe cents per kilogram to 2.6 cents per kilogram. Since 1971, the tobacco price has displayed an upward trend, with a peak of 9.4 Zimbabwe cents per kilogram being achieved in 1991. Tobacco prices have been extremely volatile since 1986, partly due to variations in the quality of the tobacco produced.
0
1
2
3
4
5
6
7
8
9
10
1938
1940
1942
1944
1946
1948
1950
1952
1954
1956
1958
1960
1962
1964
1966
1968
1970
1972
1974
1976
1978
1980
1982
1984
1986
1988
1990
1992
1994
1996
1998
2000
Time (Years)
Pric
e (Z
c pe
r kg
)
Source: Zimbabwe Tobacco Association, 2001. Figure 4: Zimbabwean tobacco price from 1938-2000 (Real Zc’s/kg)
119

Agrekon, Vol 43, No 1 (March 2004) Leaver 4. THE NERLOVIAN MODEL Of all the econometric models used to estimate agricultural supply response, the Nerlovian model is considered one of the most influential and successful, judged by the large number of studies, which utilise this approach (Braulke, 1982). The Nerlovian model is a dynamic model, stating that output is a function of expected price, output (area) adjustment, and some exogenous variables. According to Gujarati (1995), a model is described as dynamic if the time path of the dependent variable is explained by its previous values. The reduced form of the Nerlovian model is an autoregressive model because it includes lagged values of the dependent variable (output) among its explanatory variables. The simplest form of the Nerlovian model for an annual crop consists of the following three equations (Askari & Cummings, 1977): A*t = α0 + α1P*t + α2Zt + ut (1) P*t = P*t-1 + β(Pt-1 – P*t-1) (2) At = At-1 + γ(A*t – At-1) (3) Where:
At = actual area under cultivation at time t, A*t = desired area under cultivation at time t, Pt = actual price at time t, P*t = expected price at time t, Zt = other observed, exogenous factors affecting supply at time t,
and β and γ are termed the expectation and adjustment coefficients respectively.
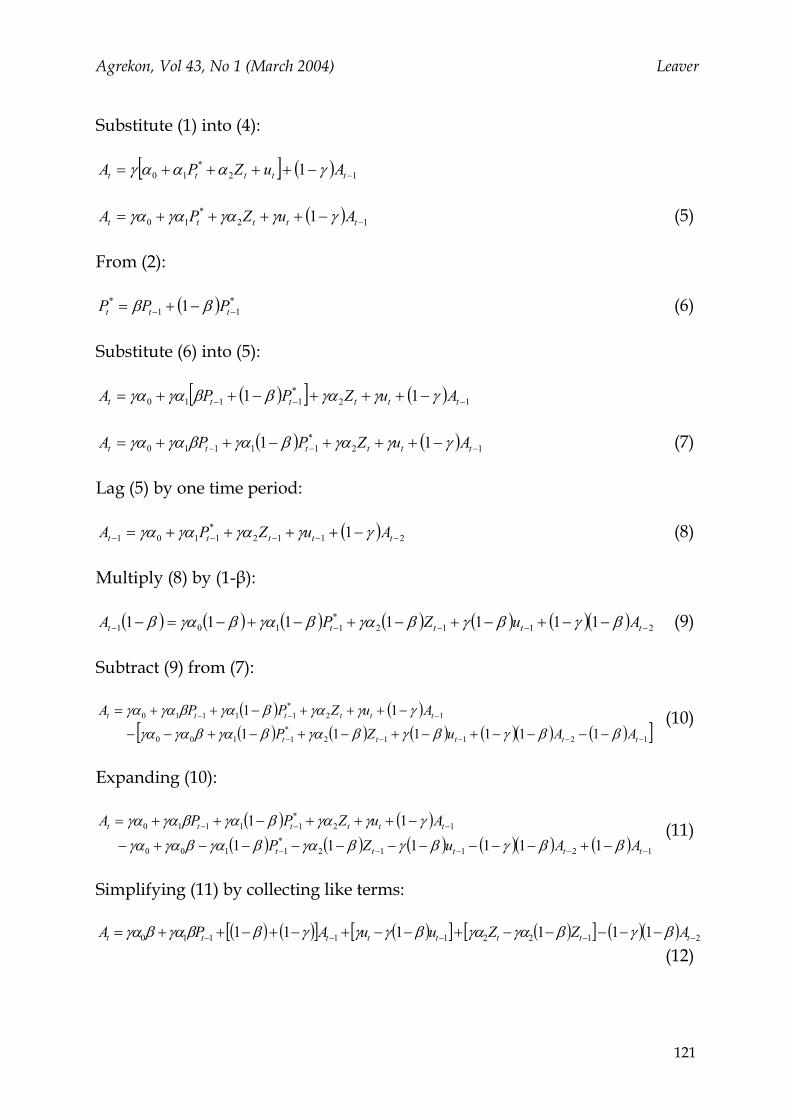
In order to estimate the supply response using the Nerlovian model, it is necessary to eliminate the unobservable variables associated with expected price and desired output from equations (1) to (3) (Braulke, 1982). By eliminating these variables, the estimating or “reduced form” Nerlovian equation is achieved. The entire process necessary to arrive at the reduced form equation is only partially stated in the literature (Nerlove, 1958), and for this reason it is included in this article.
Given the original three Nerlovian equations, from (3):
( ) 1* 1 −−+= ttt AAA γγ (4)
120
Agrekon, Vol 43, No 1 (March 2004) Leaver Substitute (1) into (4):
[ ] ( ) 12*
10 1 −−++++= ttttt AuZPA γαααγ
( ) 12*
10 1 −−++++= ttttt AuZPA γγγαγαγα (5) From (2):
( ) *11
* 1 −− −+= ttt PPP ββ (6) Substitute (6) into (5):
( )[ ] ( ) 12*
1110 11 −−− −+++−++= tttttt AuZPPA γγγαββγαγα
( ) ( ) 12*
11110 11 −−− −+++−++= tttttt AuZPPA γγγαβγαβγαγα (7) Lag (5) by one time period:
( ) 2112*
1101 1 −−−−− −++++= ttttt AuZPA γγγαγαγα (8) Multiply (8) by (1-β):
( ) ( ) ( ) ( ) ( ) ( )( ) 2112*
1101 1111111 −−−−− −−+−+−+−+−=− ttttt AuZPA βγβγβγαβγαβγαβ (9) Subtract (9) from (7):
( ) ( )( ) ( ) ( ) ( )( ) ( )[ ]12112
*1100
12*
11110
111111
11
−−−−−
−−−
−−−−+−+−+−+−−
−+++−++=
ttttt
tttttt
AAuZPAuZPPA
ββγβγβγαβγαβγαγα
γγγαβγαβγαγα (10)
Expanding (10):
( ) ( )( ) ( ) ( ) ( )( ) ( ) 12112
*1100
12*
11110
111111
11
−−−−−
−−−
−+−−−−−−−−−+−
−+++−++=
ttttt
tttttt
AAuZPAuZPPA
ββγβγβγαβγαβγαγα
γγγαβγαβγαγα (11)
Simplifying (11) by collecting like terms:
( ) ( )[ ] ( )[ ] ( )[ ] ( )( ) 212211110 111111 −−−−− −−−−−+−−+−+−++= tttttttt AZZuuAPA βγβγαγαβγγγββγαβγα (12)
121

Agrekon, Vol 43, No 1 (March 2004) Leaver Which gives the reduced form equation:
ttttttt vZbZbAbAbPbbA ++++++= −−−− 1542312110 (13) where:
bo = α0βγ, b1 = α1βγ, b2 = (1-β) + (1-γ), b3 = -(1-β)(1-γ), b4 = γα2, b5 = -γα2(1-β), vt = γ(ut – (1-β) ut-1)
The short-run price elasticity is calculated from: (14)
APb1=ε
The long-run price elasticity is calculated from (Braulke, 1982): (15) ε
AP
bbb
⋅−−
=32
1
1 where P and A are the historical means of prices and output respectively. 4.1 Specifying price One of the initial decisions confronting the researcher is how to measure output price. In the original model, Nerlove phrases actual prices in terms of those currently obtainable in the market, whilst expected prices are described in terms of past market prices (Askari & Cummings, 1977). Thus Nerlove hypothesises that price expectations are formed as follows: P*t = P*t-1 + β(Pt-1 – P*t-1) (16) such that β, the coefficient of expectation, is 0<β≤1. This is known as the adaptive expectations model, and states that economic agents revise their price expectations each period by a fraction β of the difference between the previous periods actual price and the previous periods expected price (Gujarati, 1995). Thus individuals are assumed to take past price experience into account when forming their price expectations.
122
Agrekon, Vol 43, No 1 (March 2004) Leaver However, the above formulation of price expectations has been criticised for being inadequate (Gujarati, 1995). According to the rational expectations hypothesis, individuals use all currently available and relevant information in forming price expectations, and do not rely purely on past price experience. Thus the use of the Nerlovian adaptive expectations model to describe the formation of price expectations may be criticised for being too simplistic. One of the most important factors relating to the output price specification is in choosing the relevant deflator (Mamingi, 1997). The output price may be deflated by the consumer price index, the producer price index, or an index of the prices of competitive crops. Using the nominal output price does not make economic sense if inflation is high, since farmers will be interested in the actual purchasing power of their money and as a result will respond to changes in real output prices rather than changes in nominal prices. The output price and deflator that are eventually chosen must be relevant to the farmers’ decisions that are being examined. However, when analysing the supply response in a developing country such as Zimbabwe, the choice of deflator may be limited by a lack of reliable data. 4.2 Specifying quantity There is disagreement in the literature on whether output should be measured as acreage under cultivation, production or yield per unit area, or total production in terms of weight or tonnage produced (Mshomba, 1989). Askari & Cummings (1977) assert that the relationship between expected prices and farmers’ decisions is best expressed in terms of the acreage planted because this is how farmers translate their price expectations into action. However, by using acreage planted, the inherent assumption is that farmers can only increase their output in response to price changes by utilising more land. This is incorrect, since farmers could also increase output by farming their land more intensively. A further reason why acreage planted may not be the correct measure of output is that farmers may have a limited area of land available for the cultivation of crops. In this situation, since the area of land is given, the farmer cannot increase the area of cultivated land in response to his price expectations. The use of production per unit area as a measure of output is flawed in that it assumes that farmers will only respond to a price increase by producing more intensively, thereby causing production per hectare to increase. This measure overlooks the possibility that increasing prices may instead cause a decline in
123

Agrekon, Vol 43, No 1 (March 2004) Leaver the average yield per hectare because of marginal land of an inferior quality being cultivated. The best measure of output appears to be the use of the actual produce weight because it acknowledges that farmers may respond to price incentives by using either more intensive or more extensive farming techniques. An additional factor in favour of the use of this particular measure is that data on tonnage produced is readily available. 4.3 Specifying Z The variable Z is included in the model to capture the effect of any relevant non-market factor affecting output (Askari & Cummings, 1977). The idea of shifts in production due to technical reasons is well understood in the production economics literature. Flinn & Musgrave (1967), for example, raise it in the context of shifts in production due to water stress, while Ritson (1980) discusses shifts in agricultural supply due to technological advancements. A survey of the relevant literature shows that the two most common shift variables are weather, usually measured by rainfall, and a time trend (Mamingi, 1997). A common error in many Nerlovian models is that the rainfall variable is included in a linear form (Mamingi, 1997). This is incorrect since eventually there can be too much rain, or flooding, and this will result in reductions to, rather than increases in, output. Thus rainfall could be included as a dummy variable, with periods of optimal rainfall taking a value of 1, and periods of above or below average rainfall being allocated a value of 0. According to Askari & Cummings (1977), the inclusion of a time trend variable instead of specific variables is justified if there is a lack of data or if there is multicollinearity among variables. In this case, the time trend variable would act as a proxy for improvements in technology and other farming methods over time. However, Mamingi (1997) warns that omitted variables should only be captured by the use of a time trend variable as a last resort, since the whole point of the model is to determine the impact of specific variables. 4.4 Estimating the tobacco supply response A modified form of the Nerlovian model is used in this study to prevent various problems that arise from the statistical estimation of the original Nerlovian model. Alterations of this type are well documented in the
124
Agrekon, Vol 43, No 1 (March 2004) Leaver agricultural supply response literature (cf Sharma, 1992, who uses a partial adjustment model only, excluding the price expectation process, and Askari & Cummings (1977) for a list of other studies that impose restrictions on the traditional Nerlovian model). The estimation of the Nerlovian model may result in residuals that violate the assumption of normality of the error terms. This is a simplifying assumption of the classical normal linear regression model, and must be satisfied for the method of ordinary least squares to be the best linear unbiased estimator. To ensure normality of the residuals, the estimating equation used in this study is expressed in logarithmic form. The transformation is justified because it ensures that the errors are both homoskedastic and normally distributed (Maddala, 2001). An additional advantage of using the logarithmic form is that the coefficient of the price variable can be directly interpreted as the short-run supply elasticity. Four shift variables that affect tobacco output are included in the model. The first is a dummy variable for annual average rainfall. Tobacco requires rainfall of 600 to 800 mm/year. Annual average rainfall of more than 800 mm/year has a negative impact on tobacco output since it interferes with the growth, harvesting and drying of the tobacco. In addition, tobacco requires a large amount of sunlight, which may not be available if annual rainfall exceeds 800 millimetres. In years of drought, where annual average rainfall of less than 450 millimetres is recorded, tobacco output may also be negatively affected (Zimbabwe Tobacco Association, 2001). The dummy variable takes the value of 0 in years with moderate rainfall of between 450 to 800 mm/year and a value of 1 otherwise. Due to the fact that tobacco is grown between October to March, and heavy rains early in the season affect yield negatively, the rainfall dummy variable is lagged by one period. This means, for example, that the 1998 crop, which includes tobacco grown during both October to December 1997 and from January to March 1998, is affected by the 1997 rains. The second shift variable is a dummy variable to capture the effect of sales quotas imposed on Zimbabwean tobacco farmers during the years 1967-1973, 1976-1977, and 1981-1983 (Townsend & Thirtle, 1997). The quota dummy variable takes the value of 1 in years in which a sales quota applies, and 0 otherwise. The third and fourth shift variables are a simple time trend and a quadratic time trend variable respectively. The time trend variables are frequently included in agricultural supply response studies to capture the effect of technology changes (cf Sharma, 1992 and Pandey et al, 1982), but they also capture any unspecified non-technological effects.
125

Agrekon, Vol 43, No 1 (March 2004) Leaver Data on the Zimbabwean consumer price index for the period 1938-2000 were obtained and converted into a common series with a base year of 1990. The tobacco prices were then deflated using this consumer price index. The supply response equation is expressed as: LOUTPUTt = b0 + b1LREALPRICEt-1 + b2LOUTPUTt-1 + b3LOUTPUTt-2 + b4QUOTA + b5RAINt-1 + b6TIME + b7TIME2 + Ut (17) where:
LOUTPUTt = log of total tobacco output produced in year t, and measured in tonnes;
LREALPRICEt-1 = log of the real tobacco price, expressed in Zimbabwe cents per kilogram;
LOUTPUTt-n = log of total tobacco output lagged by n years;
QUOTA = dummy variable for years with a sales quota (1 for the years 1967-1973, 1976- 1977, and 1981-1983, and 0 in all other years);
RAINt-1 = dummy variable for rainfall (1 for years with rainfall below 450 millimetres or above 800 millimetres, 0 otherwise);
TIME = simple time trend (t=0 for 1938 to t=62 for 2000);
TIME2 = quadratic time trend (t=0 for 1938 to t=3844 for 2000);
Ut = error term. The short-run supply elasticity is measured by b1, and the long-run supply elasticity is measured by b1/(1-b2-b3), as derived in Section 4.3. 5. ESTIMATION AND RESULTS OF THE SUPPLY RESPONSE EQUATION 5.1 Importance and significance of variables The logarithmic form of the Nerlovian model was estimated in E-views® using ordinary least squares. The regression results for the period from 1938-2000 are presented in Table 2. The signs of all the coefficients are as predicted in theory. The results show that price lagged one period, output lagged both one and two periods, and the simple time trend all exert a positive influence on tobacco production. The sales quota dummy, rainfall dummy and quadratic time trend variable exert a negative influence on tobacco output. The negative coefficient of the quadratic time trend variable implies that
126
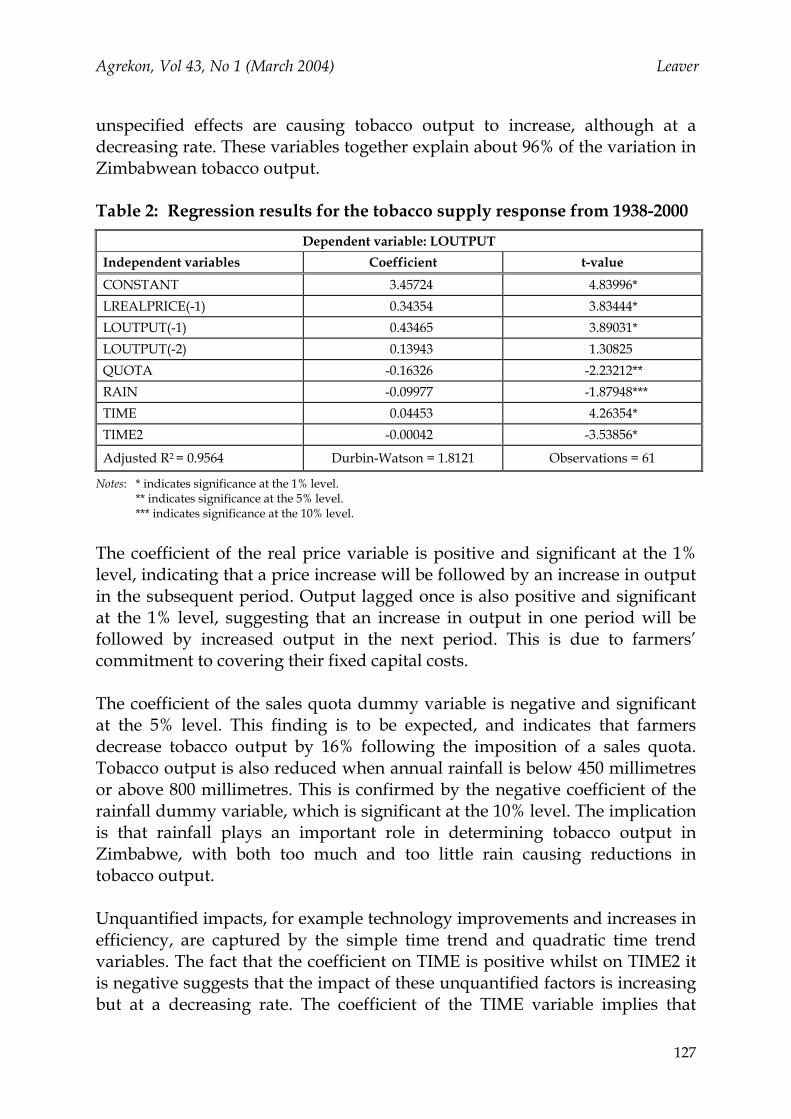
Agrekon, Vol 43, No 1 (March 2004) Leaver unspecified effects are causing tobacco output to increase, although at a decreasing rate. These variables together explain about 96% of the variation in Zimbabwean tobacco output. Table 2: Regression results for the tobacco supply response from 1938-2000
Dependent variable: LOUTPUT Independent variables Coefficient t-value CONSTANT 3.45724 4.83996* LREALPRICE(-1) 0.34354 3.83444* LOUTPUT(-1) 0.43465 3.89031* LOUTPUT(-2) 0.13943 1.30825 QUOTA -0.16326 -2.23212** RAIN -0.09977 -1.87948*** TIME 0.04453 4.26354* TIME2 -0.00042 -3.53856*
Adjusted R2 = 0.9564 Durbin-Watson = 1.8121 Observations = 61
Notes: * indicates significance at the 1% level. ** indicates significance at the 5% level. *** indicates significance at the 10% level.
The coefficient of the real price variable is positive and significant at the 1% level, indicating that a price increase will be followed by an increase in output in the subsequent period. Output lagged once is also positive and significant at the 1% level, suggesting that an increase in output in one period will be followed by increased output in the next period. This is due to farmers’ commitment to covering their fixed capital costs. The coefficient of the sales quota dummy variable is negative and significant at the 5% level. This finding is to be expected, and indicates that farmers decrease tobacco output by 16% following the imposition of a sales quota. Tobacco output is also reduced when annual rainfall is below 450 millimetres or above 800 millimetres. This is confirmed by the negative coefficient of the rainfall dummy variable, which is significant at the 10% level. The implication is that rainfall plays an important role in determining tobacco output in Zimbabwe, with both too much and too little rain causing reductions in tobacco output. Unquantified impacts, for example technology improvements and increases in efficiency, are captured by the simple time trend and quadratic time trend variables. The fact that the coefficient on TIME is positive whilst on TIME2 it is negative suggests that the impact of these unquantified factors is increasing but at a decreasing rate. The coefficient of the TIME variable implies that
127
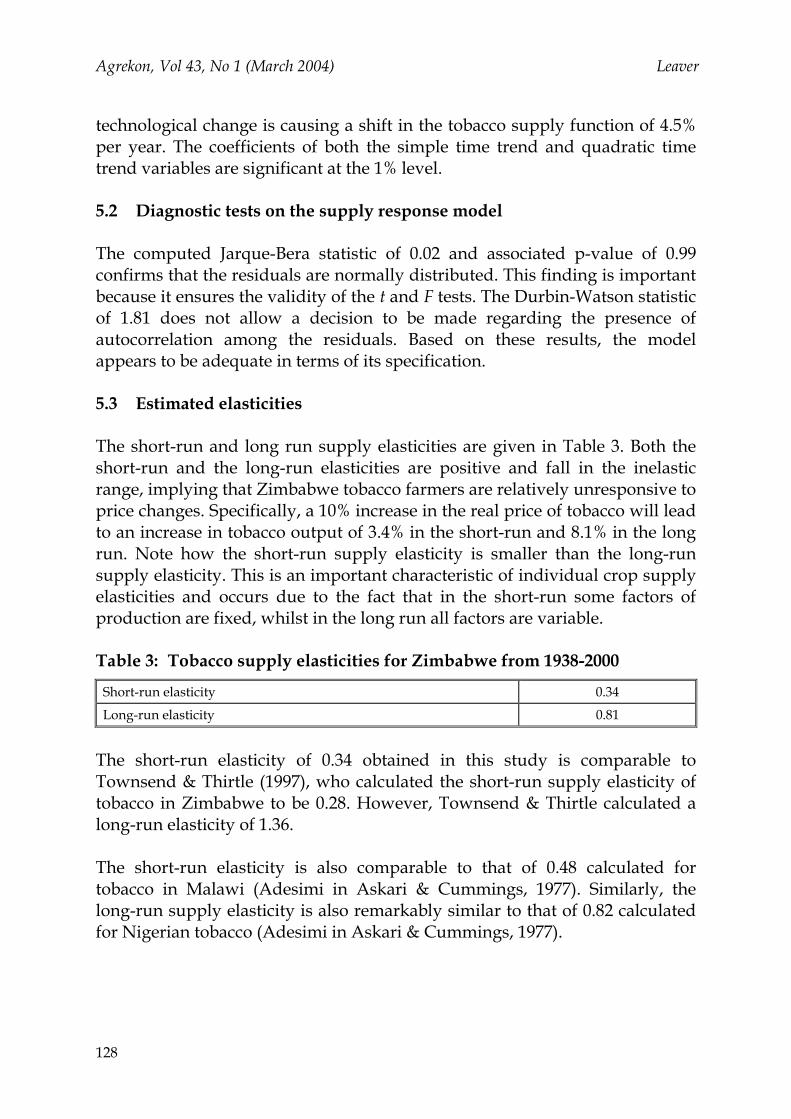
Agrekon, Vol 43, No 1 (March 2004) Leaver technological change is causing a shift in the tobacco supply function of 4.5% per year. The coefficients of both the simple time trend and quadratic time trend variables are significant at the 1% level. 5.2 Diagnostic tests on the supply response model The computed Jarque-Bera statistic of 0.02 and associated p-value of 0.99 confirms that the residuals are normally distributed. This finding is important because it ensures the validity of the t and F tests. The Durbin-Watson statistic of 1.81 does not allow a decision to be made regarding the presence of autocorrelation among the residuals. Based on these results, the model appears to be adequate in terms of its specification. 5.3 Estimated elasticities The short-run and long run supply elasticities are given in Table 3. Both the short-run and the long-run elasticities are positive and fall in the inelastic range, implying that Zimbabwe tobacco farmers are relatively unresponsive to price changes. Specifically, a 10% increase in the real price of tobacco will lead to an increase in tobacco output of 3.4% in the short-run and 8.1% in the long run. Note how the short-run supply elasticity is smaller than the long-run supply elasticity. This is an important characteristic of individual crop supply elasticities and occurs due to the fact that in the short-run some factors of production are fixed, whilst in the long run all factors are variable. Table 3: Tobacco supply elasticities for Zimbabwe from 1938-2000
Short-run elasticity 0.34
Long-run elasticity 0.81
The short-run elasticity of 0.34 obtained in this study is comparable to Townsend & Thirtle (1997), who calculated the short-run supply elasticity of tobacco in Zimbabwe to be 0.28. However, Townsend & Thirtle calculated a long-run elasticity of 1.36. The short-run elasticity is also comparable to that of 0.48 calculated for tobacco in Malawi (Adesimi in Askari & Cummings, 1977). Similarly, the long-run supply elasticity is also remarkably similar to that of 0.82 calculated for Nigerian tobacco (Adesimi in Askari & Cummings, 1977).
128
Agrekon, Vol 43, No 1 (March 2004) Leaver 6. CONCLUSIONS The objective of this article was to estimate the supply elasticities of Zimbabwean tobacco using the Nerlovian model. Both the short-run and long run supply elasticity fell in the inelastic range, indicating that Zimbabwean tobacco farmers are relatively unresponsive to output prices. Specifically, the short-run elasticity was 0.34 and the long-run elasticity 0.81. This finding quantifies the extent of the domination of the tobacco industry in the Zimbabwean economy and raises interesting research issues such as the likelihood of policy intervention changing the structure of the Zimbabwean economy. The high fixed capital costs of infrastructure necessary for tobacco production is a reason why Zimbabwean tobacco farmers are so unresponsive to price. High capital costs translate into large opportunity costs associated with giving up tobacco production, thereby further entrenching the production of a harmful product even under adverse conditions. A further reason why Zimbabwean farmers find tobacco such an attractive crop is because it is 6.5 times more profitable than other alternative crops. In addition, it is non-perishable and can be stored easily. What emerges from this article is that Zimbabwean tobacco farmers will keep growing tobacco, even with significant price decreases, because they perceive no other viable alternative. This clearly begs the developmental issue of how the first world can meet their objective of tobacco control whilst helping African nations such as Zimbabwe to find their feet in a global economy which does not run on tobacco. REFERENCES AFRICAN FARMING AND FOOD PROCESSING (2003). July/August. ASKARI H & CUMMINGS JT (1977). Estimating agricultural supply response with the Nerlove model: A survey. International Economic Review 18(2):257-292. BRAULKE M (1982). A note on the Nerlove model of agricultural supply response. International Economic Review 23(1):241-246. COMMERCIAL FARMERS UNION (2001). Personal electronic communication. FLINN JC & MUSGRAVE WF (1967). Development and analysis of input-output relations for irrigation water. The Australian Journal of Agricultural Economics 11(1):25-42.
129

Agrekon, Vol 43, No 1 (March 2004) Leaver GUJARATI DN (1995). Basic econometrics. 3rd Edition, McGraw-Hill, New York, USA. MADDALA GS (2001). Introduction to econometrics. 3rd Edition, John Wiley and Sons Ltd, Sussex, United Kingdom. MAMINGI N (1997). The impact of prices and macroeconomic policies on agricultural supply: a synthesis of available results. Agricultural Economics 16:17-34. MSHOMBA RE (1989). Price elasticity of supply of Tanzania’s major export crops. Eastern Africa Economic Review 5(1):9-23. MUDHARA M, ANANDAJAYASEKERAM P, MARTELLA D, MAZHANGARA E & MURATA M (1997). Impact assessment of soybean research and the enabling environment in Zimbabwe: 1965-2000. Zimbabwe Ministry of Agriculture, Department of Research and Specialist Services. NERLOVE M (1958). The dynamics of supply: Estimation of farmers’ response to price. The Johns Hopkins Press, Baltimore, United States of America. PANDEY S, PIGGOTT RR & MACAULAY TG (1982). The elasticity of aggregate Australian supply: Estimates and policy implications. Australian Journal of Agricultural Economics 26(3):202-219. RITSON C (1980). Agricultural economics: Principles and policy. Student Edition, William Collins Sons and Co. Ltd, London, United Kingdom. SHARMA KL (1992). Aggregate farm supply response in Kenya. Eastern Africa Economic Review 8(2):92-101. TAYLOR SD (1999). Business and politics in Zimbabwe’s commercial agriculture sector. African Economic History 27:177-215. TOBACCO INDUSTRY AND MARKETING BOARD (2001). Online statistics. Online, available at http://www.timb.co.zw. TIME MAGAZINE (2001). Zimbabwe time trail. Online, available at http://www.time.com/time/europe/timetrails/zimbabwe. TOWNSEND R & THIRTLE C (1997). Dynamic acreage response: An error correction model for maize and tobacco in Zimbabwe. International Association of
130

Agrekon, Vol 43, No 1 (March 2004) Leaver Agricultural Economists Occasional Paper No 7, Ashgate, Aldershot, United Kingdom. WORLD BANK (1999). Curbing the epidemic: Governments and the economics of tobacco control. The World Bank, Washington, DC. ZIMBABWE TOBACCO ASSOCIATION (2001). Online, available at http://www.zta.co.zw.
131