Embed Size (px)
Citation preview

14-8-2009
1
Measuring the Subjective U X iUser eXperience
By Drs. M.C. Kaptein PDeng.
Eindhoven University of Technology / Philips Research / Stanford [email protected]
These handouts are subject to change prior to the tutorial. Please contactThese handouts are subject to change prior to the tutorial. Please contactM.C. Kaptein for the latest version.
About the presenter
• Drs. Maurits Kaptein PdEng:• BSc. Psychology (University of Tilburg – NL)• Msc Economic psychology (University of Tilburg NL)• Msc. Economic psychology (University of Tilburg – NL)
• Professional doctorate in Engineering: User System Interaction (Eindhoven University of Technology)
• Researcher @ Vodafone Research• Research Development Manager @ De Vos & Jansen Marketing
research
• Research Scientist @ Philips Research• PhD candidate Eindhoven University of Technology / Stanford
University
PAGE 18/14/2009/ Industrial Design

14-8-2009
2
Aim of the tutorial
1. Get acquainted with the psychology terminology of designing and validating questionnaires
2. Have a thorough overview of the process of designing a questionnaire
3. Understand reliability and validity4. Learn how to phrase items and design questionnaires5. Learn about different sampling methods6. Get acquainted with statistical techniques to validate
questionnaires
/ Industrial Design PAGE 28/14/2009
Overview of this tutorial
1. The full design process2 Questionnaire design2. Questionnaire design
1. Item construction2. Question wording3. Survey construction4. Pretesting
3. Theory of reliability and validity4. Sampling5. Statistical validation
1 C l ti1. Correlations2. Cronbach’s Alpha3. Factor analysis
/ Industrial Design PAGE 38/14/2009

14-8-2009
3
Hypothesis driven research
1. Think through your research questions and objectives before you write questionsj y q
2. Prepare an analysis plan before you write questions3. Ask yourself, in relation to points #1 and #2 above,
if each question on your list is necessary? Even if the data would be ‘interesting’ it has to ultimately be used in analysis to make the cut!
/ Industrial Design PAGE 48/14/2009
Theoretical background
Core concepts of questionnaire design
/ Industrial Design PAGE 58/14/2009

14-8-2009
4
The design process
Questionnaire design (1) Questionnaire testing (2) Usage
Hypothetical construct
Variables
Items
Item wording
Questionnaire layout
Pretesting
SamplingN = 50 + 5*M
Correlations / reliability
Factor analysis
Replicating, validating
Using your questionnaire
/ Industrial Design PAGE 68/14/2009
Items 2 < N < 20
IterateIterate
Hypothetical construct
Definition1 U bilit
Practical HCI examples
A hypothetical construct is an identifier for a collection of attitudes or behaviors relating to underlying
features or causes
1. Usability2. Social connectedness3. Social presence4. Fun5. Engagement6. System intelligence7. Social intelligence8. User intelligence (IQ)
/ Industrial Design PAGE 78/14/2009

14-8-2009
5
Indentifying (latent) variables
Definition1 L kill
IQ examples
A latent variable is one of the attitudes or behaviors which together
form a hypothetical construct.
1. Language skill2. Shape reckognition3. Logic4. Mathematical ability5. Creativity
/ Industrial Design PAGE 88/14/2009
Operationalizing items
Definition1 1 3 9 21 63 X
Mathematical ability
Operationalizing items relates to the translation of variables into items
presented to the user.
1. 1,3,9,21,63, Xa2. 1,9,2,8,3,7, Xb3. 112, 2112, 122112, 11222112, Xc
/ Industrial Design PAGE 98/14/2009
Xa = 198; Xb = 4; Xc = 21322112

14-8-2009
6
Hypothetical construct
Overview
IQ
VariablesLanguage Logic Maths
If peter is a dog
A relates to B as C relates..
Operationalized itemsPleasecomplete the
/ Industrial Design PAGE 1014-8-2009
1, 3, 9, 21, 63 1, 9, 2, 8, 3, 7dog..
Pleasecomplete the
Pleasecomplete the
Generating an item pool
1. Determine the constructs you want to measuremeasure.
2. Find its variables1. In literature2. Trough qualitative sessions (focus groups)
3. Generate items1 From literature1. From literature2. From qualitative session (brainstorms)
/ Industrial Design PAGE 118/14/2009

14-8-2009
7
Designing your own
From constructing items to pretesting
/ Industrial Design PAGE 128/14/2009
The design process
Questionnaire design (1) Questionnaire testing (2) Usage
Hypothetical construct
Variables
Items
Item wording
Questionnaire layout
Pretesting
SamplingN = 50 + 5*M
Correlations / reliability
Factor analysis
Replicating, validating
Using your questionnaire
/ Industrial Design PAGE 138/14/2009
Items 2 < N < 20
IterateIterate

14-8-2009
8
Main steps after generating your item pool
1. Write the introduction to your questionnaire2. Evaluate the content of each item3. Evaluate Inability or unwillingness to answer4. Critically asses question wording5. Determine the order of questions6. Determine form and layout7. Determine method of administring8. Pretest your questionnaire9. Iterate
/ Industrial Design PAGE 148/14/2009
Create the introduction
1. Fully inform participants about the research1. Who conducts the research?2. Why is it conducted?3. What is the aim?4. What is the length?5. What will the data be used for?
2. Obtain informed consent3. Understand your target population
1 Adapt your language1. Adapt your language4. Put screening questions up front
1. Use dummy questions when the topic is sensitive
/ Industrial Design PAGE 158/14/2009

14-8-2009
9
Introduction example
Topic of the study
Process
Length
Data usage
/ Industrial Design PAGE 168/14/2009
Consent
Contact
Evaluate the contect of each question
1. For each question, determine if the question is neccesaryis neccesary
2. Do not use double barreled question3. Use familiar wording and spelling – adapt to
the target group4. Can the respondent remember?5. Can the respondent articulate?
/ Industrial Design PAGE 178/14/2009

14-8-2009
10
Identify unwillingness or inability to answer
1. Minimize the effort required of participants2. Is the context of the questions clear and q
appropriate3. Make a request for information seem
legitimate4. In case of sensitive information:
1. Place items at the end 2. Preface with a ‘common’ statment3 Ask questions in 3rd person3. Ask questions in 3rd person4. Hide questions in between others5. Provide response categories6. Use randomized techniques
/ Industrial Design PAGE 188/14/2009
Question wording
1. Define the issue in Who, What, When, Where, and what way (how)
2 U di d2. Use ordinary words3. Avoid ambiguous words4. Avoid leading questions5. Avoid implicit alternatives that are not expressed in
the options1. Exclusive and exhaustive categories
6. Avoid implicit assumptionsp p7. Don’t make respondents compute8. Use both positive as well as negative statements
/ Industrial Design PAGE 198/14/2009

14-8-2009
11
Bad examples 1: Double barreled questions
Bad Better
Did you enjoy using our application, and would you buy it?
Did you enjoy using our application?
Would you buy this application?
/ Industrial Design PAGE 208/14/2009
Bad examples 2: Leading questions
Bad Better
Smart people generally do not watch a lot of television. Do you watch a lot
of television?
Do you watch television?
How many hours a week do you spend watching television?
/ Industrial Design PAGE 218/14/2009
14-8-2009
12
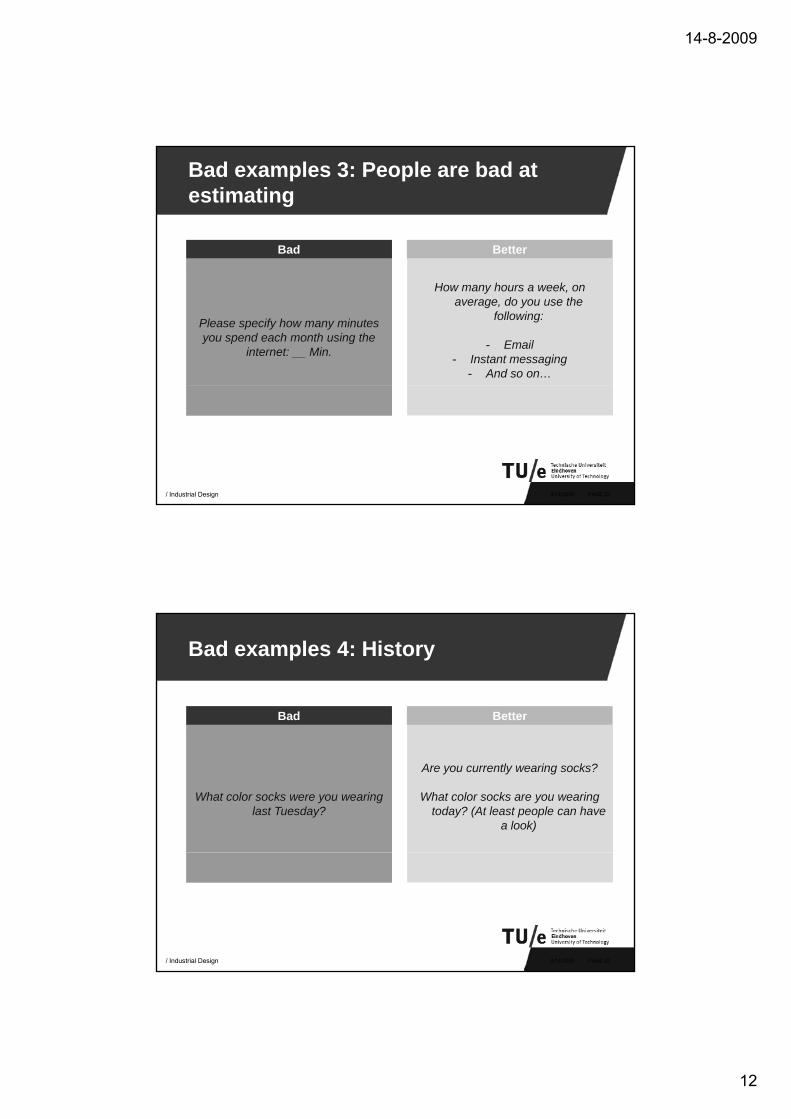
Bad examples 3: People are bad at estimating
Bad Better
Please specify how many minutes you spend each month using the
internet: __ Min.
How many hours a week, on average, do you use the
following:
- Email- Instant messaging
- And so on…
/ Industrial Design PAGE 228/14/2009
Bad examples 4: History
Bad Better
What color socks were you wearing last Tuesday?
Are you currently wearing socks?
What color socks are you wearing today? (At least people can have
a look)
/ Industrial Design PAGE 238/14/2009

14-8-2009
13
Bad examples 5: Jargon
Bad Better
Using the system made me feel more socially connected to my social
network:
Agree _ _ _ _ _ _ Disagree
I felt closer to my friends by using the system:
Disagree Agree
0 0 0 0 0
/ Industrial Design PAGE 248/14/2009
Question order
1. Make the opening questions simple2 Qualifying questions should be in the beginning2. Qualifying questions should be in the beginning3. End with identification questions4. Put difficult questions at the end5. From general to specific6. From recent to old7 G it b t i7. Group items by topic8. Make branching transparant
/ Industrial Design PAGE 258/14/2009

14-8-2009
14
Layout
/ Industrial Design PAGE 2614-8-2009
Layout checklist
Number all questionsUse large clear type, don’t crowdMake use of white spaceMake answer categories clearMake answer categories clearConsistent placementSmall to largeGroup related topicsDon’t split questions across pagesDistinguish directions from questions
/ Industrial Design PAGE 278/14/2009

14-8-2009
15
Layout checklist
1. Number all questions2 Use large clear type don’t crowd2. Use large clear type, don t crowd3. Make use of white space4. Make answer categories clear
1. Consistent placement2. Small to large
5. Group related topicsp p6. Don’t split questions across pages7. Distinguish directions from questions
/ Industrial Design PAGE 288/14/2009
Answer categories
• For likert type scales:• Even or odd?Even or odd?• Labeling?• Number of options?• “Don’t know”?• Pictorials?
/ Industrial Design PAGE 298/14/2009

14-8-2009
16
Methods of administering questionnaires
• Paper and pencilPersonal interviews• Personal interviews
• CAPI• CATI• CAWI• Mobile phonesp
/ Industrial Design PAGE 308/14/2009
Pretesting your questionnaire
• Always pretest!Test all aspects of the questionnaire• Test all aspects of the questionnaire
• Test with the target group• Test in the target medium• Talk to your participants• Re-test after modifications: Iterate• Do not use the data from your pretest.
/ Industrial Design PAGE 318/14/2009

14-8-2009
17
A nice questionnaire?
What to do with this?
Minimal intro
Logical categories?
No white space
/ Industrial Design PAGE 328/14/2009
Inconsistend placement
Reliability and Validity
Evaluating a questionnaire
/ Industrial Design PAGE 338/14/2009

14-8-2009
18
Reliability
• The degree to which measurements are
• Reliable: Measuring kilograms using a calibrated scale
consistent and do not contain errors
• Score of a participant = Score of the overall mean + effects of
• Unreliable: Measuring length using a flexible cord
belonging to a group + error
/ Industrial Design PAGE 348/14/2009
Common error: Regression towards the mean.
• We perform an experiment to test our
i t ti th
• We perform an experiment to test our
di th inew interactive math education system:• We select the worst 20%
of the a classroom –Their average math score is 3.2 out of 10.
• We have them use our system for 1 week.
new dice throwing training programm.• We select people that
throw a 1 or a 2. Their mean dice score is 1.5.
• We have them train for a week
• The average dicey• The average math score
is now 4.5 out of 10.
• The average dice throwing score is now 3.5
/ Industrial Design PAGE 358/14/2009

14-8-2009
19
Validity
• The extend to which a procedure
• Valid: Measuring kilograms using a calibrated scale.
a procedure measures what it intends to measure
• Does the IQ test really measure
• Invalid: Measuring kilograms using a ruler.
really measure “intelligence”
/ Industrial Design PAGE 368/14/2009
Construct and content validity
Construct validity:
?Do our variables properly represent the hypothetical construct?
Is IQ really a combination of Math, Logic, and Language?
Content validity:
Do our items really measure the intended variable?Do our items really measure the intended variable?
Is 1,3,9,21,63, .. A good reflection of mathematical ability?
/ Industrial Design PAGE 378/14/2009

14-8-2009
20
Other types of validity
• Internal validity: Does the experimental setup indeed manipulate what is intended?indeed manipulate what is intended?− No confounds?− No alternative interpretations?
• External validity: Can the findings be generalized?− Ecological validity− Temporal validity
• Face validity?
/ Industrial Design PAGE 388/14/2009
Research methods and validity
• Experiments− Great control over
• Correlational studies− Limited control overGreat control over
confounding variables− Out of context
• High internal validity• Low external validity
Limited control over confounding variables
− In context• Low internal validity• High external validity
/ Industrial Design PAGE 398/14/2009
14-8-2009
21
Recapp
• We have covered:• From construct to item• From construct to item• Item generation• Questionnaire generation• Pretesting• Theoretical evaluation based on reliability and
validityy
/ Industrial Design PAGE 408/14/2009
Measuring the Subjective U X i t 2User eXperience – part 2
A quantitative approach.
/ Industrial Design PAGE 418/14/2009

14-8-2009
22
The design process
Questionnaire design (1) Questionnaire testing (2) Usage
Hypotheticalconstruct
Variables
Items
Item wording
Questionnaire layout
Pretesting
SamplingN = 50 + 5*M
Correlations / reliability
Factor analysis
Replicating, validating
Using yourquestionnaire
/ Industrial Design PAGE 4214-8-2009
Items 2 < N < 20
IterateIterate
Sampling respondents
So, who should fill out your questionnaire
/ Industrial Design PAGE 4314-8-2009

14-8-2009
23
Designing your sample
• Define the populationDetermine the sampling frame• Determine the sampling frame
• Select a sampling technique• Determine sample size• Get those people
/ Industrial Design PAGE 448/14/2009
Sample size
• Sample size considerations:• Pretest 2 < N 20• Pretest 2 < N 20• Quantitative evaluation:− N > 300− N = 50 + 5*m− Rules of thumb
/ Industrial Design PAGE 458/14/2009

14-8-2009
24
Different sampling techniques
• Non probability sampling• Convenience samplingConvenience sampling• Judgemental Sampling• Quota Sampling• Snowball Sampling
• Probability sampling• Simple Random Sampling
S t ti S li
/ Industrial Design PAGE 468/14/2009
• Systematic Sampling• Stratisfied Sampling• Cluster Sampling
Statistical analysis
We now have a lot of numbers – so what do we do with those
/ Industrial Design PAGE 4714-8-2009

14-8-2009
25
The design process
Questionnaire design (1) Questionnaire testing (2) Usage
Hypotheticalconstruct
Variables
Items
Item wording
Questionnaire layout
Pretesting
SamplingN = 50 + 5*M
Correlations / reliability
Factor analysis
Replicating, validating
Using yourquestionnaire
/ Industrial Design PAGE 4814-8-2009
Items 2 < N < 20
IterateIterate
Correlation – Pearson product moment
• The statistic is defined as the sum of the products of the standard scores of the two measures divided bythe standard scores of the two measures divided by the degrees of freedom. Based on a sample of paired data (Xi, Yi), the sample Pearson correlation coefficient can be calculated as:
/ Industrial Design PAGE 4914-8-2009

14-8-2009
26
Correlations by the eye
Var 1 Var 2 Var 3 Var 4 Var 5pp 1 1 5 1 3 7pp 2 2 4 2 2 12pppp 3 3 3 3 3 17pp 4 2 4 2 4 12pp 5 3 3 3 3 17pp 6 3 3 3 2 17pp 7 4 2 4 3 22pp 8 5 1 5 4 27pp 9 4 2 4 3 22pp 10 5 1 5 2 27
/ Industrial Design PAGE 5014-8-2009
1 2 3 4 51 x -1 1 0 12 -1 x -1 0 -13 1 -1 x 0 14 0 0 0 x 05 1 -1 1 0 x
Scatter plots
/ Industrial Design PAGE 5114-8-2009

14-8-2009
27
Correlations in SPSS
/ Industrial Design PAGE 5214-8-2009
Correlations are lineair
/ Industrial Design PAGE 5314-8-2009

14-8-2009
28
Reliability analysis
/ Industrial Design PAGE 5414-8-2009
Types of reliability analysis
• Scale reliability• Internal consistency based on correlationy
• Split-half reliability• Correlation between similar forms
• Test retest reliability• Correlation between test en second test
• Inter-Rater reliability• Correlation between multiple raters
/ Industrial Design PAGE 5514-8-2009

14-8-2009
29
Scale reliability: Practical usage
• When you know which construct you are measuring• When you are only measuring 1 constructWhen you are only measuring 1 construct• When dependent variable is of interval or ratio level• When sample size is sufficient
• N = 50+5m (m = number of items)• N > 300
• CAUTION: Cronbachs Alpha is very dependent on the number of items: Ask the same question 20 times and you are bound to get high values.
/ Industrial Design PAGE 568/14/2009
Scale reliability
/ Industrial Design PAGE 5714-8-2009

14-8-2009
30
Scale reliability
/ Industrial Design PAGE 5814-8-2009
Scale reliability correlation matrix
Inter-Item Correlation Matrix
1,000 -,565 ,631 ,670-,565 1,000 -,807 -,678
631 - 807 1 000 662
Var 1Var 2Var 3
Var 1 Var 2 Var 3 Var 3
/ Industrial Design PAGE 5914-8-2009
,631 -,807 1,000 ,662,670 -,678 ,662 1,000
Var 3Var 3

14-8-2009
31
Scale reliability SPSS output
Reliability Statistics
Cronbach'sAlpha Based
on
-,071 -,061 4
Cronbach'sAlphaa
StandardizedItemsa N of Items
The value is negative due to a negative averagecovariance among items. This violates reliability modelassumptions. You may want to check item codings.
a.
Item-Total Statistics
12,1667 4,144 ,641 ,512 -1,747aVar 1
Scale Mean ifItem Deleted
ScaleVariance if
Item Deleted
CorrectedItem-TotalCorrelation
SquaredMultiple
Correlation
Cronbach'sAlpha if Item
Deleted
/ Industrial Design PAGE 6014-8-2009
, , , , ,13,1000 20,093 -,786 ,689 ,84712,7000 4,769 ,329 ,701 -1,036a
13,2333 4,668 ,551 ,585 -1,410a
Var 2Var 3Var 3
The value is negative due to a negative average covariance among items. Thisviolates reliability model assumptions. You may want to check item codings.
a.
How to mirror items
For N point scale
Xi_mirrored = (N+1) - Xi
/ Industrial Design PAGE 6114-8-2009

14-8-2009
32
After mirroring
I I C l i M iInter-Item Correlation Matrix
1,000 ,631 ,670 ,565,631 1,000 ,662 ,807,670 ,662 1,000 ,678,565 ,807 ,678 1,000
Var 1Var 3Var 4Var 2 Mirror
Var 1 Var 3 Var 4 Var 2 Mirror
/ Industrial Design PAGE 6214-8-2009
New scale reliability outputReliability Statistics
Cronbach'sAlpha Based
on
,889 ,890 4
Cronbach'sAlpha
StandardizedItems N of Items
Item-Total Statistics
V 1
Scale Mean ifItem Deleted
ScaleVariance if
Item Deleted
CorrectedItem-TotalCorrelation
SquaredMultiple
Correlation
Cronbach'sAlpha if Item
Deleted
/ Industrial Design PAGE 6314-8-2009
12,2333 21,771 ,689 ,512 ,88212,7667 18,323 ,806 ,701 ,84013,3000 21,183 ,757 ,585 ,85913,1000 20,093 ,786 ,689 ,847
Var 1Var 3Var 4Var 2 Mirror

14-8-2009
33
Split half reliability
• Internal consistency reliability• Correlation between two sets of items measuring theCorrelation between two sets of items measuring the
same hypothetical construct
• High correlation means high internal consistency
/ Industrial Design PAGE 648/14/2009
Test-retest reliability
• Test stability over time• If I measure your EQ now, it should not be totallyIf I measure your EQ now, it should not be totally
different next week
• Correlation between test scores administered in multiple points over time
/ Industrial Design PAGE 6514-8-2009

14-8-2009
34
Inter-Rater reliability
• Consistency (homogeneity) between raters• Observation studiesObservation studies
• Number of similar ratings
• High correlation means reliable scoring system.
/ Industrial Design PAGE 6614-8-2009
Factor analysis
If we want to do just a little bit more..
/ Industrial Design PAGE 6714-8-2009

14-8-2009
35
What is factor analysis
• Method of “restructuring” a large number of items into a more feasible small set of factors.
• For Data Reduction: Principal Component Analysis• For Structure Detection: Principal Axis Factoring• Two questions:
• How many components (factors) are needed to t th i bl ?represent the variables?
• What do these components represent?"
/ Industrial Design PAGE 6814-8-2009
Confirmatory verus Exploratory
• Confirmatory factor analysis:• Confirms the hypothesized structure of the itemsConfirms the hypothesized structure of the items• Used when underlying variables and constructs are
well defined.
• Exploratory factor analysis:• Explore possible relations and factor structures
U d i l d l t f l ll d fi d• Used in early development for less well defined variables and constructs.
/ Industrial Design PAGE 698/14/2009

14-8-2009
36
Steps to perfoming factor analysis
• Determine items• Use your generated item set
• Get sufficient N• Minimum 100• Minimum 300• 50 + 5*m
• Determine number of factors• Scree plot, Eigenvalues, Explained variance
• Rotate the factor solution for a simpler structureRotate the factor solution for a simpler structure• Varimax, Oblimin
• Compute factor scores• Regression
/ Industrial Design PAGE 708/14/2009
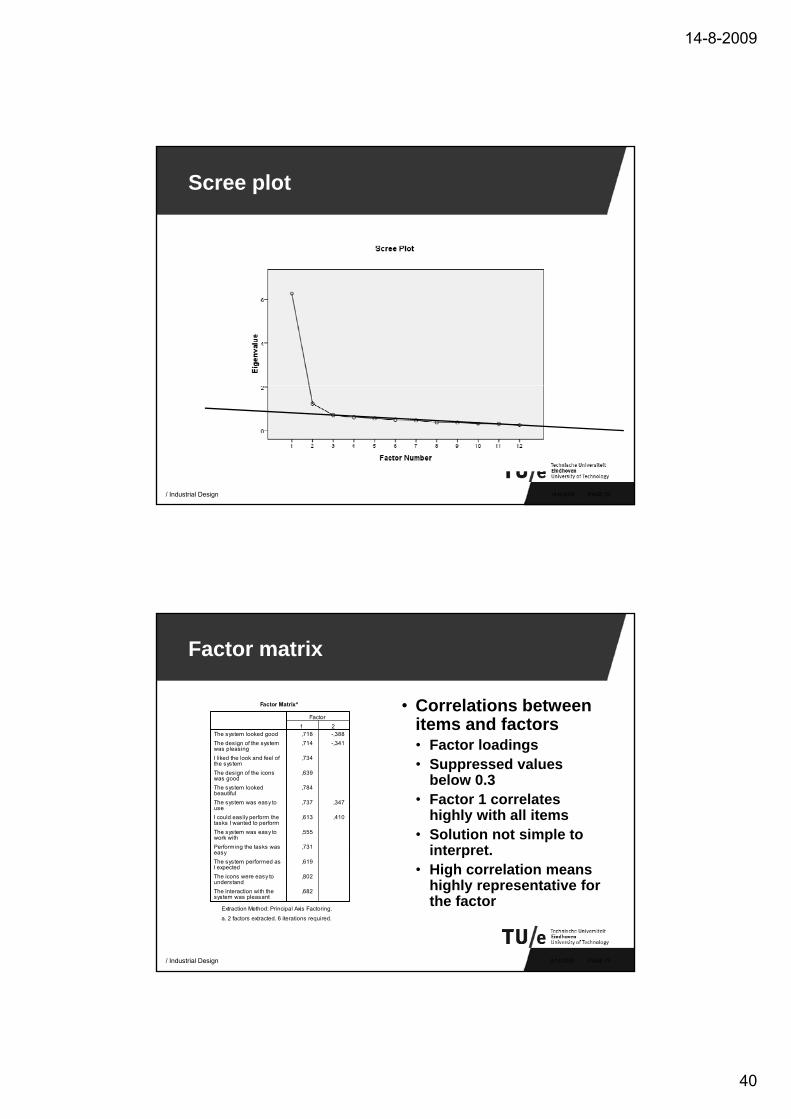
Example: Our items
1. The system looked good2. The design of the system was pleasing3. I liked the look and feel of the systemy4. The design of the icons was good5. The system looked beautiful6. The system was easy to use7. I could easily perform the tasks I wanted to perform8. The system was easy to work with9. Performing the tasks was easy10.The system performed as I expected11.The icons were easy to understand12 Th i t ti ith th t l t
/ Industrial Design PAGE 718/14/2009
12.The interaction with the system was pleasant
All on a 5-point scale (Totally disagree, totally agree) (N=1428)

14-8-2009
37
Principal axis factoring SPSS
/ Industrial Design PAGE 7214-8-2009
PAF SPSS 2
/ Industrial Design PAGE 7314-8-2009

14-8-2009
38
PAF SPSS 3
/ Industrial Design PAGE 7414-8-2009
KMO and Bartlett’s test
• KMO• Index magnitude of
b d l tiobserved correlations versus partial correlations
• > 0.8
• Barlett’s• Test of correlation of the
variablesvariables• Should be significant:
Sig. < 0.05
/ Industrial Design PAGE 758/14/2009

14-8-2009
39
Communalities
• CommunalityMeasures the percent• Measures the percent of variance in a given variable explained by all the factors jointly.
• Example:− Factor solution explains
the system “looking d” ll b tgood” very well, but
poorly explains the “perfomed as expected” item
/ Industrial Design PAGE 768/14/2009
Total variance explained
• Variance in the items explained by the factors• Cumulative > 60%• If Eigenvalue < 1 – Factor explains less variance than
individual item
/ Industrial Design PAGE 778/14/2009
14-8-2009
40
Scree plot
/ Industrial Design PAGE 7814-8-2009
Factor matrix
• Correlations between items and factors• Factor loadings• Suppressed values
below 0.3• Factor 1 correlates
highly with all items• Solution not simple to
interpretinterpret.• High correlation means
highly representative for the factor
/ Industrial Design PAGE 798/14/2009

14-8-2009
41
Rotation
• To create a simpler to interpret factor solutions one can “rotate” the original factor solution. • Changes factor loadings• Eigenvalues / explained variance remains the same
• Varimax• Ortogonal rotation• No correlations between factors
• Oblimin• Factors can be correlated• Realistic
/ Industrial Design PAGE 808/14/2009
Oblimin rotation
• Factor loadings after rotatingrotating• Factor one: design of the
system• Factor two: Ease of use
• Use highest correlations to name the factorsto name the factors
• Correlation factors: 0.6
/ Industrial Design PAGE 818/14/2009

14-8-2009
42
Recapp
What did we talk about?
/ Industrial Design PAGE 828/14/2009
The design process
Questionnaire design (1) Questionnaire testing (2) Usage
Hypothetical construct
Variables
Items
Item wording
Questionnaire layout
Pretesting
SamplingN = 50 + 5*M
Correlations / reliability
Factor analysis
Replicating, validating
Using your questionnaire
/ Industrial Design PAGE 838/14/2009
Items 2 < N < 20
IterateIterate

14-8-2009
43
Measuring the Subjective U X iUser eXperience
End of tutorial
For contact: [email protected]
/ Industrial Design PAGE 848/14/2009
![· OECD Guidelines on Measuring Subjective Well-being-:HSTCQE=V^V[Y]: OECD Guidelines on Measuring Subjective Well-being Being able to measure people’s quality of life is fundament](https://img.pdfslide.us/doc/110x75/5fc5165b47cddc37eb740caf/oecd-guidelines-on-measuring-subjective-well-being-hstcqevvy-oecd-guidelines.jpg)


![Guidelines OECD Guidelines on Measuring Subjective Well-being€¦ · OECD Guidelines on Measuring Subjective Well-being-:HSTCQE=V^V[Y]: OECD Guidelines on Measuring Subjective Well-being](https://img.pdfslide.us/doc/110x75/600dac959ab70e25e9371c99/guidelines-oecd-guidelines-on-measuring-subjective-well-oecd-guidelines-on-measuring.jpg)