Embed Size (px)
Citation preview

SAS Forum KL 2015_ Muzalwana Abd Talib
Measuring the quality of public payment counter service: A
statistical approach
Muzalwana Abdul Talib
Department of Applied Statistics, Faculty of Economics and Administration
SAS Forum KL 2015_ Muzalwana Abd Talib
Outline
• Introduction
• Problem Statement
• Methodology • Software: SAS JMP Pro
• Results & Findings
• Discussion & Conclusion
• Q&A

SAS Forum KL 2015_ Muzalwana Abd Talib
“The measurement of service quality is an elusive and abstract construct that is difficult to define and measure..”
(Cronin & Taylor, 1992) “Service quality is perceived by customers, comparison of
what the consumers feel service firms should offer with perceptions on performance of firms providing the services”
(GrÖnroos, 1984; Lovelock & Writz, 2011)
Introduction

SAS Forum KL 2015_ Muzalwana Abd Talib
Parasuraman et al (1985,1988)
“Service quality is perceived by customers, comparison of what the consumers feel service firms should offer with perceptions on performance of firms providing the services”
Service Quality Measurement
SERVQUAL Model - Tangibility, reliability, responsiveness, assurance & empathy
Haywood-Farmer (1988)
Service provider need to translate customer requirement into detailed
process specifications.

SAS Forum KL 2015_ Muzalwana Abd Talib
Research Problem 1. Lack of information on customer satisfaction to further improve
the service quality at payment counter. 2. Which aspect of counter service that need quality improvement
is unknown. 3. Performance level of front-line staff is unknown
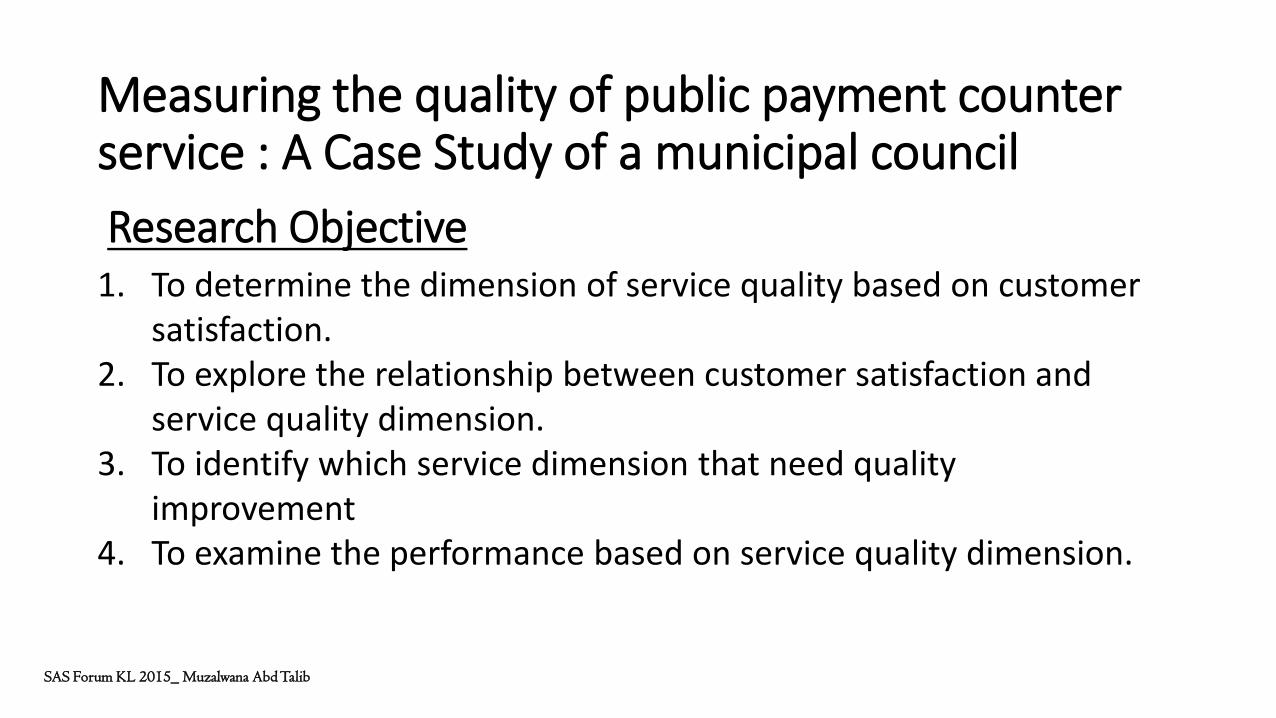
Measuring the quality of public payment counter service : A Case Study of a municipal council
SAS Forum KL 2015_ Muzalwana Abd Talib
Research Objective 1. To determine the dimension of service quality based on customer
satisfaction. 2. To explore the relationship between customer satisfaction and
service quality dimension. 3. To identify which service dimension that need quality
improvement 4. To examine the performance based on service quality dimension.
Measuring the quality of public payment counter service : A Case Study of a municipal council
SAS Forum KL 2015_ Muzalwana Abd Talib
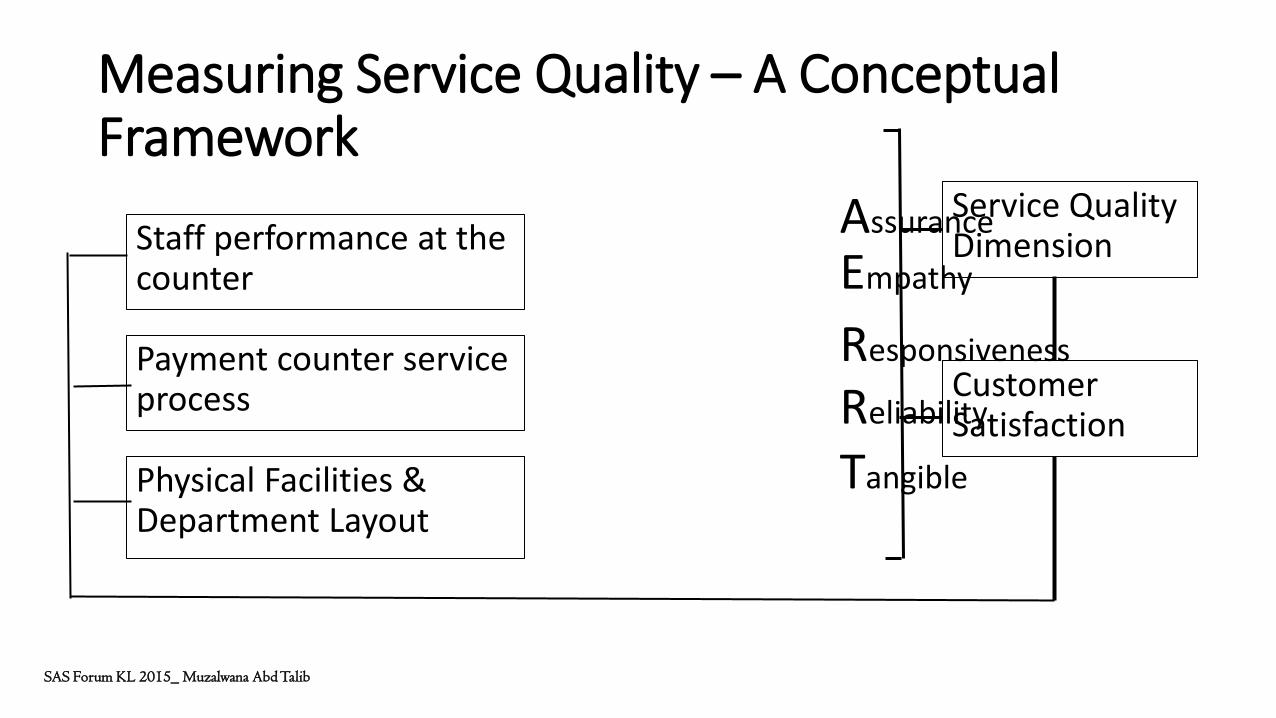
Staff performance at the counter
Payment counter service process
Physical Facilities & Department Layout
Measuring Service Quality – A Conceptual Framework
Assurance
Empathy
Responsiveness
Reliability
Tangible
Service Quality Dimension
Customer Satisfaction
SAS Forum KL 2015_ Muzalwana Abd Talib
Measuring the quality of public payment counter service : A Case Study of a municipal council
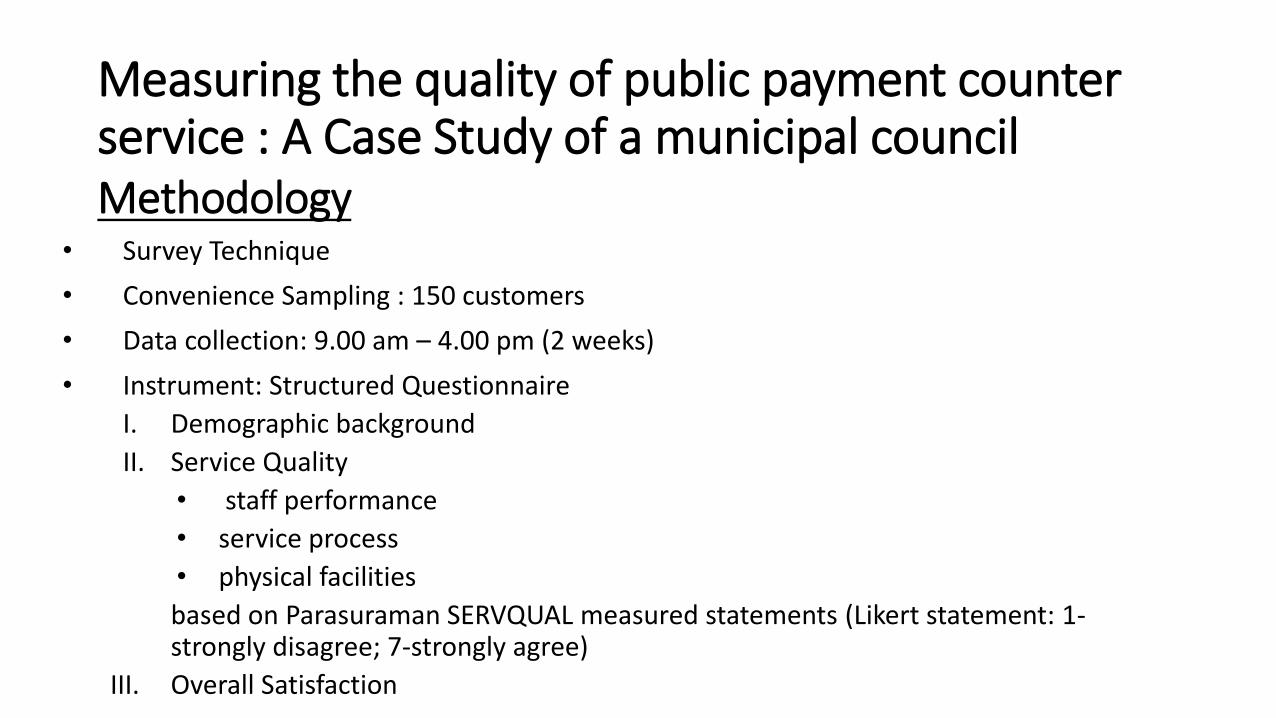
• Survey Technique
• Convenience Sampling : 150 customers
• Data collection: 9.00 am – 4.00 pm (2 weeks)
• Instrument: Structured Questionnaire
I. Demographic background
II. Service Quality
• staff performance
• service process
• physical facilities
based on Parasuraman SERVQUAL measured statements (Likert statement: 1-strongly disagree; 7-strongly agree)
III. Overall Satisfaction
Methodology

SAS Forum KL 2015_ Muzalwana Abd Talib
Methodology
Measuring the quality of public payment counter service : A Case Study of a municipal council
Research Objective Statistical technique
1. To determine the dimension of service quality based on customer satisfaction.
2. To explore the relationship between customer satisfaction and service quality dimension.
3. To identify which service dimension that need quality improvement
4. To examine the performance based on service quality dimension
Factor Analysis
Hypothesis testing ,
Pareto Analysis
Control Chart

SAS Forum KL 2015_ Muzalwana Abd Talib
Demographic Profile
28%
21.3%
20%
11.3%
11.3%
8.1%
85.3%
14.7%
79
58
13

SAS Forum KL 2015_ Muzalwana Abd Talib
Service Dimension Mean (µ) / Average
Values
Associated to OVERALL
SATISFACTION?
RELIABILITY 5.7492 Yes
TANGIBILITY 6.1819 Yes
EMPATHY 5.4838 Yes
Results: Research Objective 1 & 2
*µ ≥ 4 : Indicates satisfaction

SAS Forum KL 2015_ Muzalwana Abd Talib
• Reliability dimension based on the extent to which the payment counter can provide credible services.
• Tangibles cues are physical characteristic of service such as seats are in good conditions, well function air conditions and presentable staff appearance are customer when evaluating service quality.
• Empathy are of concern are the aspect of delivering service in good manner such as providing good hospitality, good rapports and concerns about customers’ welfare.
3 Service Quality Dimensions identified
Results: Research Objective 1 & 2
SAS Forum KL 2015_ Muzalwana Abd Talib
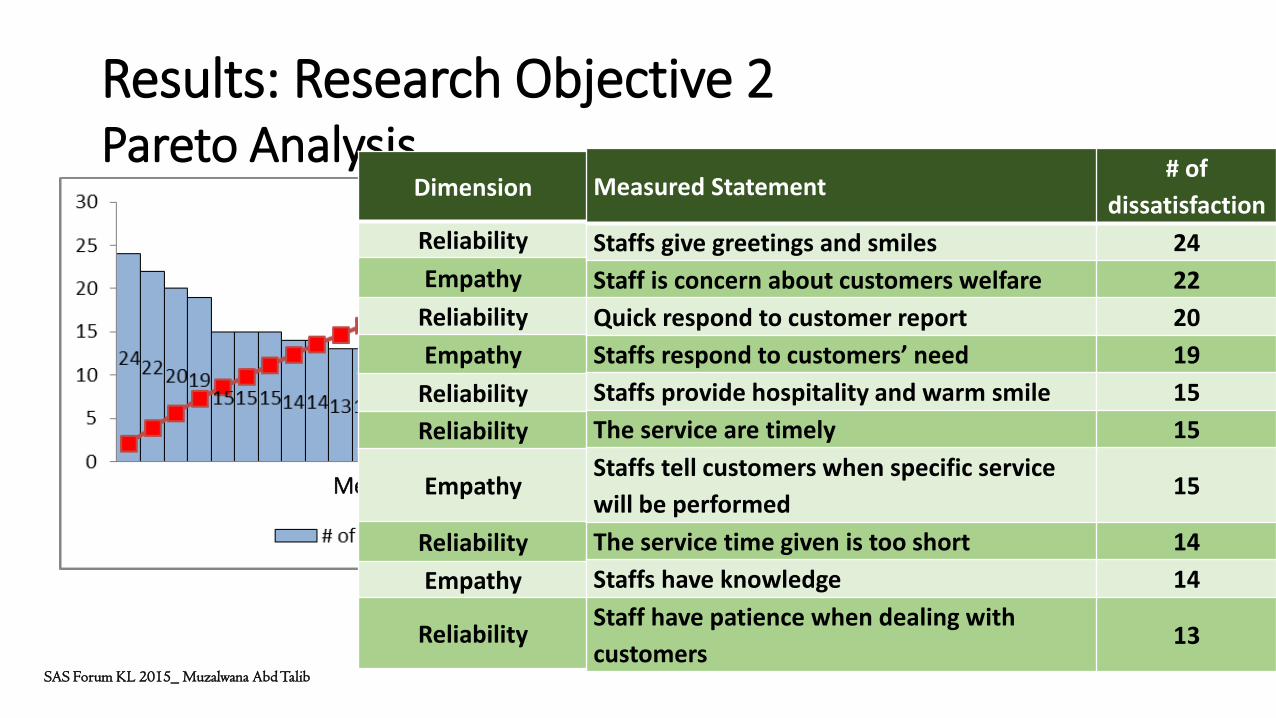
Pareto Analysis
Measured statements
Dimension
Reliability
Empathy
Reliability
Empathy
Reliability
Reliability
Empathy
Reliability
Empathy
Reliability
Measured Statement # of
dissatisfaction
Staffs give greetings and smiles 24
Staff is concern about customers welfare 22
Quick respond to customer report 20
Staffs respond to customers’ need 19
Staffs provide hospitality and warm smile 15
The service are timely 15
Staffs tell customers when specific service
will be performed 15
The service time given is too short 14
Staffs have knowledge 14
Staff have patience when dealing with
customers 13
Results: Research Objective 2

SAS Forum KL 2015_ Muzalwana Abd Talib
No of sample No of sample
PHASE 1 (RETROSPECTIVE PHASE): Paramater Estimation Stage
PHASE 2 (PROSPECTIVE PHASE): Actual Quality Monitoring Stage
Out of
Statistical
Control
Results: Research Objective 3 Control Chart: Reliability Dimension

SAS Forum KL 2015_ Muzalwana Abd Talib
No of sample No of sample
PHASE 1 (RETROSPECTIVE PHASE): Paramater Estimation Stage PHASE 2 (PROSPECTIVE PHASE): Actual Quality
Monitoring Stage
Out of
Statistical
Control
Results: Research Objective 3 Control Chart: Tangbility Dimension
SAS Forum KL 2015_ Muzalwana Abd Talib
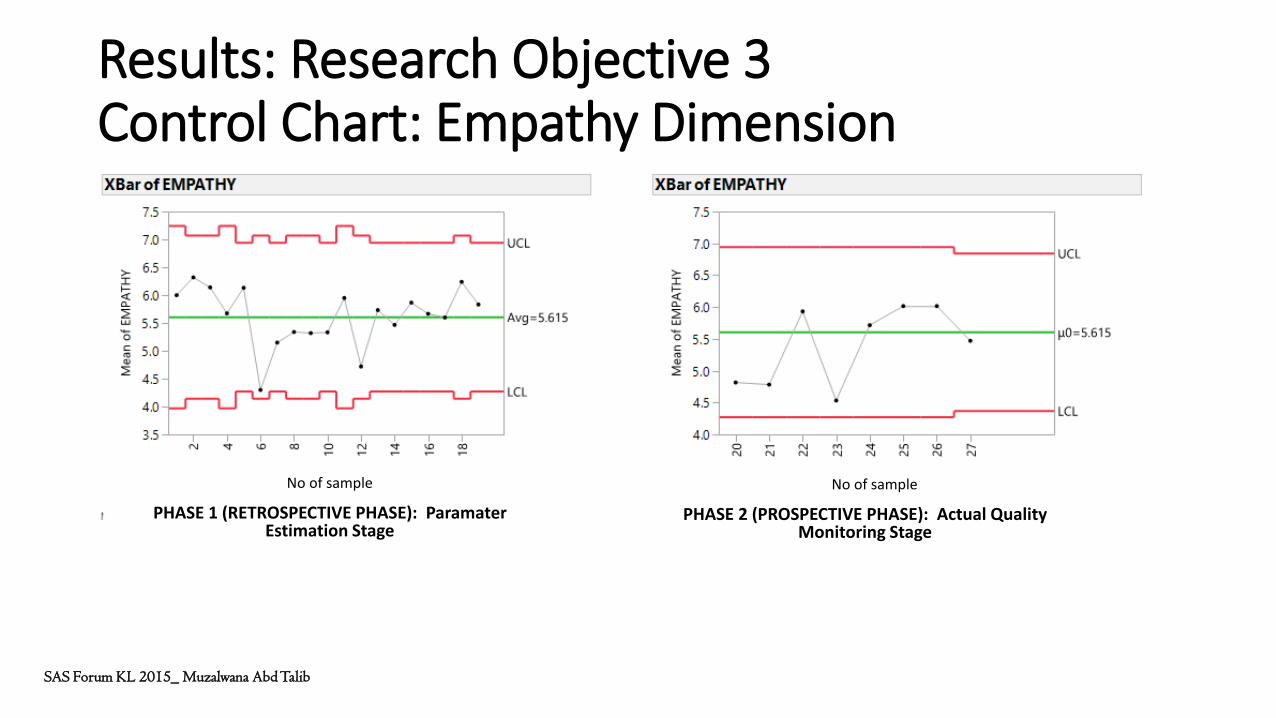
No of sample No of sample
PHASE 1 (RETROSPECTIVE PHASE): Paramater Estimation Stage
PHASE 2 (PROSPECTIVE PHASE): Actual Quality Monitoring Stage
Results: Research Objective 3 Control Chart: Empathy Dimension
SAS Forum KL 2015_ Muzalwana Abd Talib
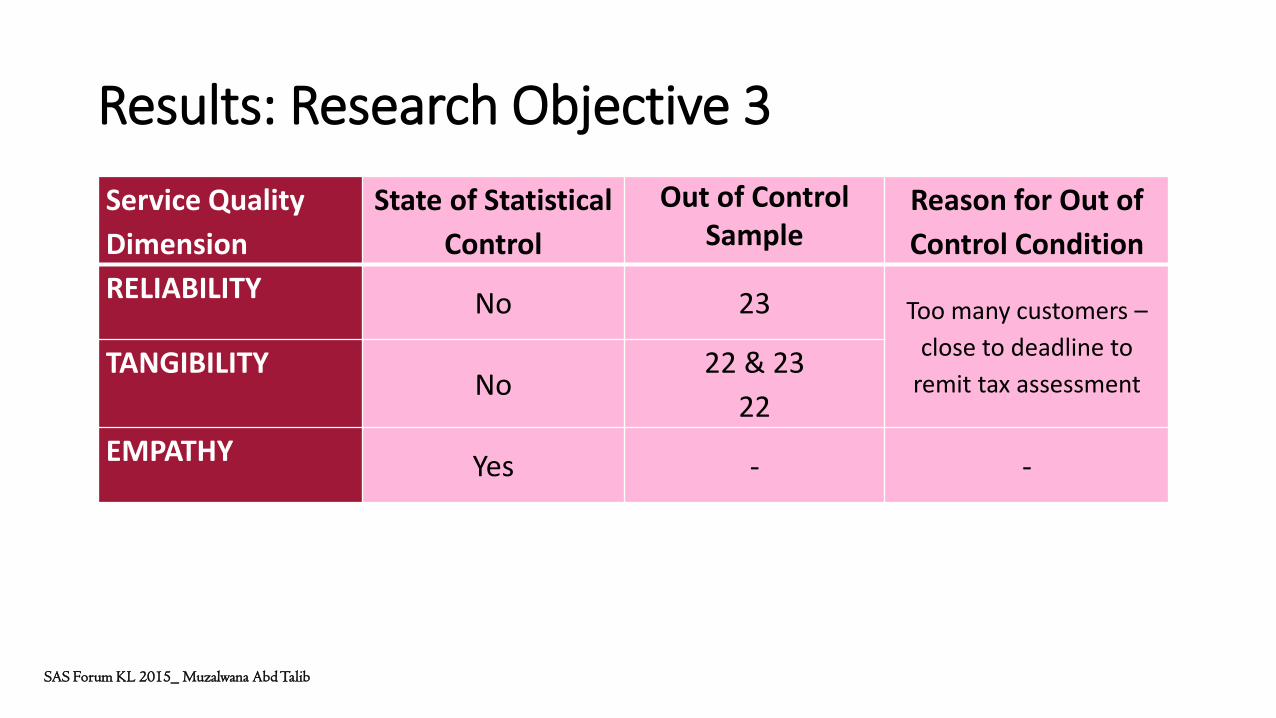
Service Quality
Dimension
State of Statistical
Control
Out of Control Sample
Reason for Out of
Control Condition
RELIABILITY No 23 Too many customers –
close to deadline to
remit tax assessment TANGIBILITY
No 22 & 23
22
EMPATHY Yes - -
Results: Research Objective 3

SAS Forum KL 2015_ Muzalwana Abd Talib
Multivariate Control Chart
No of sample

SAS Forum KL 2015_ Muzalwana Abd Talib
• This study utilizes two statistical process control (SPC) tools, Pareto analysis and control charts to measure the quality of service provided based on three service dimensions identified (Reliability, Tangibility, Empathy)
• The application of SPC tools like Pareto Analysis and control charts in this study, have successfully shed light into the specific dimension of the counter service that need quality improvement.
• Control charts also enable us to identify the point of time when quality is out of control for further investigation and future improvement.
Discussion & Conclusion – Service Quality at the Municipal Council

SAS Forum KL 2015_ Muzalwana Abd Talib
• Other than measuring customer satisfaction on quality of front line service and its processes, measurements on number of errors, waiting time and delays also can be used effectively to measure service quality.
• For continuous improvement of service processes, the
implementation of SPC should receive larger consideration in service industry and investigated further by quality practitioners.
Discussion & Conclusion – Service Quality at the Municipal Council
SAS Forum KL 2015_ Muzalwana Abd Talib
Acknowledgement
This study is based on a research work by Nur Juliana
Abdul Shukor, a Master of Applied Statistics student.
Thank you.