Embed Size (px)
Citation preview
1
Measuring the development of professional competence among teachers Wim van de Grift and Marieke van der Wal
Abstract
In this article we report our investigations on the development of a reliable and valid observation instrument to measure the pedagogical and didactic behaviour of teachers. The observation instrument consists of a number of aspects which have been proven to effect pupils’ achievements in studies on school effectiveness. In total, 1319 teachers in primary education from the Netherlands, Belgium, Germany, Slowakia, Croatia and Scotland were observed by inspectors of education, who were especially trained for this research. Using item response analysis, we investigated whether the data fit the assumptions of the Rasch model. We found that 24 items of the observation instrument form a reliable en valid observation instrument according to the psychometric fit indices of the Rasch model. The instrument is reliable and valid for men and women and for teachers with little and many years of experience. The instrument is also reliable and valid within countries, but should be used carefully in international comparative studies.
2
1. Introduction .............................................................................................................. 3 2. Theoretical framework............................................................................................. 3
Observing classroom practice ..................................................................................... 4 The dimension of classroom practice ......................................................................... 4
3. Research design ........................................................................................................ 4 Sample ........................................................................................................................ 5
4. Psychometric quality ................................................................................................ 5 Content validity .......................................................................................................... 5 Interrater reliability ..................................................................................................... 6 Homogeneity .............................................................................................................. 7 The Rasch model ........................................................................................................ 7 Item calibration ........................................................................................................... 8 Parallelism of item characteristic curves ................... Error! Bookmark not defined. Unidimensionality and local stochastic independence ............................................. 12
5. Teacher skills .......................................................................................................... 13 Average scores in different countries ....................................................................... 13
6. Teacher skills and professional experience .......................................................... 13 The starting level ...................................................................................................... 14 The first five years .................................................................................................... 14 Ten years’ experience ............................................................................................... 15 Levelling off ............................................................................................................. 15 Decline ...................................................................................................................... 15
7. Conclusion ............................................................................................................... 15 Psychometric qualities .............................................................................................. 15 Theory on the development of teacher competence ................................................. 16
8. Discussion ................................................................................................................ 17 Item parameters in the ‘classroom organization’ domain ......................................... 17 Differences between countries .................................................................................. 17 Cross-sectional studies ............................................................................................. 19
Literatuur .................................................................................................................... 20 Appendices. LESSON OBSERVATION FORM for evaluating the quality of learning and teaching ................................................................................................. 25 Over de auteurs ........................................................................................................... 28 Abstract ......................................................................................................................... 1 Tabellen ....................................................................................................................... 29
3
1. Introduction
What is the quality of classroom practice in primary schools? Does a teacher’s classroom practice differ in accordance with the number of years’ teaching experience they have? Does the quality of classroom practice differ between teachers in the Netherlands and other European countries? We cannot answer these questions satisfactorily unless we have access to a large volume of observational data collected by means of a research tool that meets the fundamental requirements of reliability and validity. In this article we report on the construction of an observational instrument that satisfies the requirements of the dichotomous Rasch model. Based on a limited sample of over 400 teachers from Lower Saxony, we then discuss the relationship between teaching skills and the number of years’ experience in the teaching profession.
2. Theoretical framework
The fact that intelligence and the social environment are hugely important for pupil performance has been exhaustively proven (see for example Coleman et al., 1966). Nevertheless, primary school teachers are able to influence about 15-25% of the differences in pupil performance (Bosker & Witziers, 1996; Brandsma & Knuver, 1989; Roeleveld, 2003; Wijnstra, Ouwens, & Béguin, 2003; Houtveen & Van de Grift, 2007a; 2007b). It is in this percentage range that we find the professional discretion of teachers, which is not always fully utilized. Some teachers fail to achieve even half of the average learning gains for their pupils, while others manage to achieve double the average learning gains (Houtveen, Mijs, Vernooij, Van de Grift & Koekebacker, 2003). Learning gains, or added value for pupils, are at the heart of a teacher’s job. More than forty years of research into teacher and school effectiveness shows that a range of teacher interventions have a positive effect on pupil performance and learning gains. These interventions can be grouped as follows: Sufficient opportunities for learning. A safe and stimulating learning environment. Efficient classroom management. Clear, structured instruction. Involving all pupils in the lesson. Adapting teaching to pupil differences. Teaching pupils how to learn. Monitoring achievement. Special measures for pupils at risk of lagging behind. For reviews, see Purkey & Smith, 1983; Levine & Lezotte, 1990, 1995; Walberg & Haertel, 1992; Scheerens, 1989; 1992; Creemers, 1991; 1994; Ellis & Worthington, 1994; Cotton, 1995; Sammons, Hillam & Mortimore, 1995; Scheerens & Bosker, 1997; Scheerens, Seidel, Witziers, Hendriks & Doornekamp, 2005.
4
Observing classroom practice
These interventions that have proven effective have been used to construct a host of research instruments for observing and evaluating the quality of classroom practice (Flanders, 1961, 1970; Stallings & Kaskowitz, 1974; Tricket & Moos, 1974; Stallings et al., 1979; Capie et al., 1980; Florida Coalition for the Development of a Performance Measurement System, 1983; Stringfield et al., 1985; Veenman et al., 1986; Evertson, 1987; Slavin, 1987; Virgilio, 1987; Anderson et al.; 1989; Evertson & Burry, 1989; Virgilio & Teddlie, 1989; Teddlie et al., 1990; Schaffer & Nesselrodt, 1992; Postlethwaite & Ross, 1992; Booij et al., 1995; Ofsted, 1995; Houtveen & Overmars, 1996; Van de Grift & Lam, 1998; The Netherlands Education Inspectorate, 1998; Houtveen et al., 1999a; Van de Grift, 2007; 2009; Creemers & Kyriakides, 2009). These observational and evaluation instruments differ in quality and in how they are operationalized. Some have ‘borrowed’ items from other instruments. Some were originally designed for teacher training, others for research purposes. Those of Van de Grift (2007; 2009), Anderson et al. (1989) and Postlethwaite & Ross (1992) are also used in international comparative studies.
The dimension of classroom practice
Research has been carried out in the Netherlands and Cyprus using observational tools based on the above teacher interventions that have been shown during more than 40 years of research to correlate with pupil performance. These studies show that effective teacher interventions have a sequential level of difficulty. Some interventions are more difficult than others, and teachers who implement more difficult (i.e. more complex) interventions are shown – apart from chance deviations – to also implement easier, less complex, interventions (Van de Grift & Lam, 1998; Kyriakides, Creemers & Antoniou, 2009). A picture emerges of a dimension of classroom practice that begins with ensuring a safe and stimulating learning environment, progresses to the efficient organization of the lesson, and then to clear, structured instruction. Higher levels are lesson intensification and pupil activation, and tailoring teaching to pupil differences. This leads us to assume that teachers progress during their teaching career from mastering very basic skills, such as ensuring a learning environment that is safe and stimulating for pupils, organizing a lesson efficiently and providing clear and structured instruction, to more complex skills, such as intensifying the lesson, tailoring teaching to pupil differences and teaching their pupils thinking and learning strategies. The present study was designed to develop an observational instrument that can test this assumption about the development of classroom practice skills during a teacher’s career.
3. Research design
The purpose of the study was to construct an observational tool that will evaluate the quality of a teacher’s classroom practice and that will satisfy the stringent
5
psychometric requirements of the Rasch model. This tool is used to check whether classroom practice does indeed contain a gradation that moves successively from ensuring a safe and stimulating learning environment, to the efficient organization of a lesson, to clear and structured instruction, and finally to intensifying the lesson and effectively adapting teaching to pupil differences.
Sample
For the purposes of the study, observations were carried out in Croatia, the Netherlands, Lower Saxony (Germany), Scotland (United Kingdom), Slovakia and Flanders (Belgium). They were conducted by education inspectors with large, representative samples of schools in the Netherlands (N=332), Lower Saxony (N=286), Slovakia (N=324) and Flanders (N=240). In the Netherlands, a simple random sample of schools was drawn from the population. In Lower Saxony, Slovakia and Flanders, the aselectivity of the samples was guaranteed through a procedure described by the education inspectorates in question as ‘just the next school to visit’. The sample size in the Netherlands, Lower Saxony, Slovakia and Flanders yielded a sample accuracy of approximately 5%. In Scotland and Croatia, we worked with smaller samples of 94 and 43 schools respectively. The population average for these two countries was estimated with a lesser degree of accuracy (>10%). In all 1319 schools, the observations were carried out during a single school year among teachers of classes in which the pupils were about 9 years old.
4. Psychometric quality
Content validity
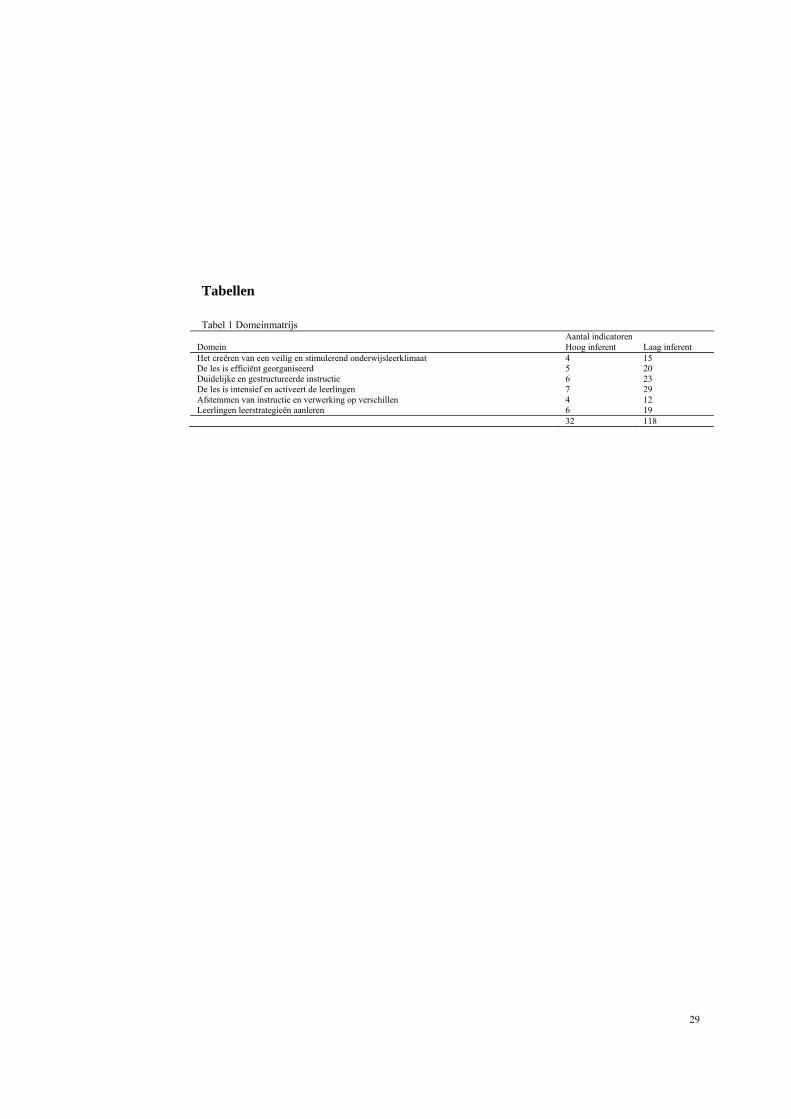
The study of the above reviews of the learning effects of classroom practice yielded a large item pool of 115 different low-inference items and 32 high-inference items. The 115 low-inference items could be organized into the 32 high-inference items, which in turn could be organized into six domains. Table 1 Domains of the observational instrument
Number of indicators Domains high-inference low-inference Creating a safe and stimulating classroom climate 4 15 Efficient organisation of the lessons 5 20 Clear and structured instruction 6 23 Activating pupils 7 29 Differentiation in struction and assignments 4 12 Teaching thinking and learning strategies 6 19 32 118
With observational instruments, the big advantage of low-inference items is that they allow different raters to fairly quickly arrive at the same assessment for an item. The
6
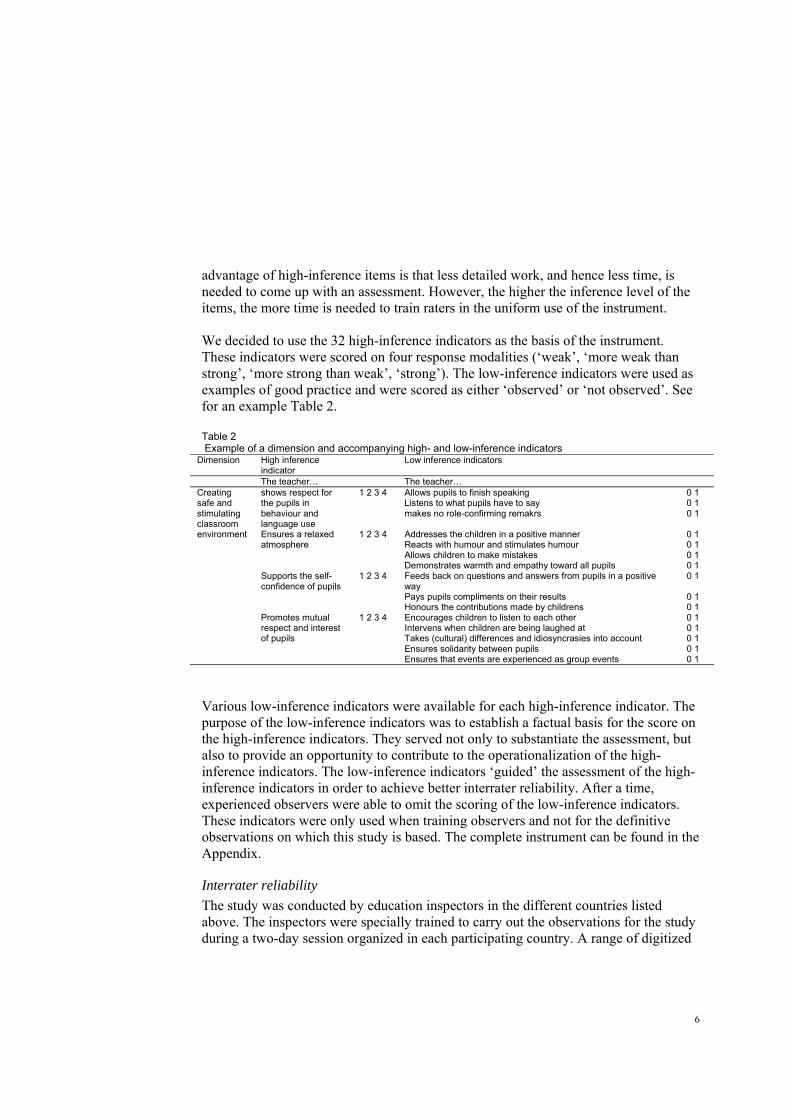
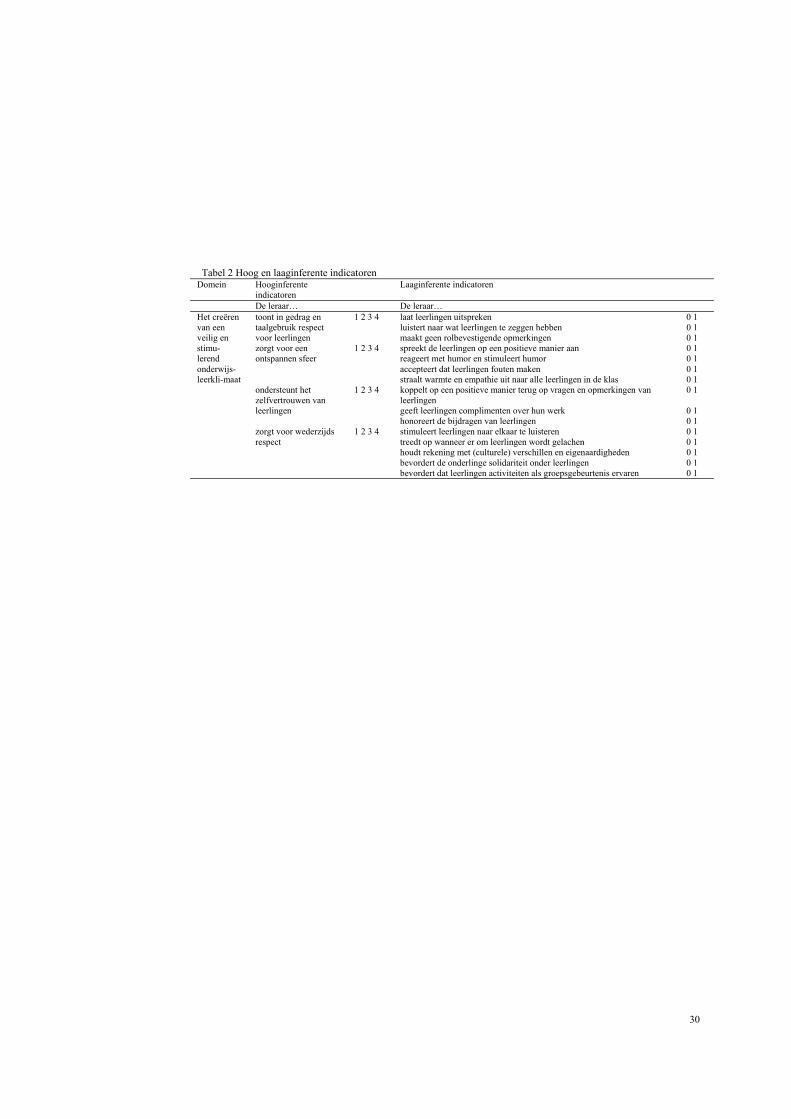
advantage of high-inference items is that less detailed work, and hence less time, is needed to come up with an assessment. However, the higher the inference level of the items, the more time is needed to train raters in the uniform use of the instrument. We decided to use the 32 high-inference indicators as the basis of the instrument. These indicators were scored on four response modalities (‘weak’, ‘more weak than strong’, ‘more strong than weak’, ‘strong’). The low-inference indicators were used as examples of good practice and were scored as either ‘observed’ or ‘not observed’. See for an example Table 2. Table 2 Example of a dimension and accompanying high- and low-inference indicators
Dimension High inference indicator
Low inference indicators
The teacher… The teacher… Creating safe and stimulating classroom environment
shows respect for the pupils in behaviour and language use
1 2 3 4 Allows pupils to finish speaking 0 1 Listens to what pupils have to say 0 1 makes no role-confirming remakrs 0 1
Ensures a relaxed atmosphere
1 2 3 4 Addresses the children in a positive manner 0 1 Reacts with humour and stimulates humour 0 1 Allows children to make mistakes 0 1 Demonstrates warmth and empathy toward all pupils 0 1
Supports the self-confidence of pupils
1 2 3 4 Feeds back on questions and answers from pupils in a positive way
0 1
Pays pupils compliments on their results 0 1 Honours the contributions made by childrens 0 1
Promotes mutual respect and interest of pupils
1 2 3 4 Encourages children to listen to each other 0 1 Intervens when children are being laughed at 0 1 Takes (cultural) differences and idiosyncrasies into account 0 1 Ensures solidarity between pupils 0 1 Ensures that events are experienced as group events 0 1
Various low-inference indicators were available for each high-inference indicator. The purpose of the low-inference indicators was to establish a factual basis for the score on the high-inference indicators. They served not only to substantiate the assessment, but also to provide an opportunity to contribute to the operationalization of the high-inference indicators. The low-inference indicators ‘guided’ the assessment of the high-inference indicators in order to achieve better interrater reliability. After a time, experienced observers were able to omit the scoring of the low-inference indicators. These indicators were only used when training observers and not for the definitive observations on which this study is based. The complete instrument can be found in the Appendix.
Interrater reliability
The study was conducted by education inspectors in the different countries listed above. The inspectors were specially trained to carry out the observations for the study during a two-day session organized in each participating country. A range of digitized
7
lessons were used in the training sessions. Training continued until the inspectors achieved a consensus level of at least 80% in their assessments. The consensus scores for the vast majority of inspectors ranged between 85% and 95%. Inspectors who were unable to satisfy the criterion of 80% were not invited to take part in the study.
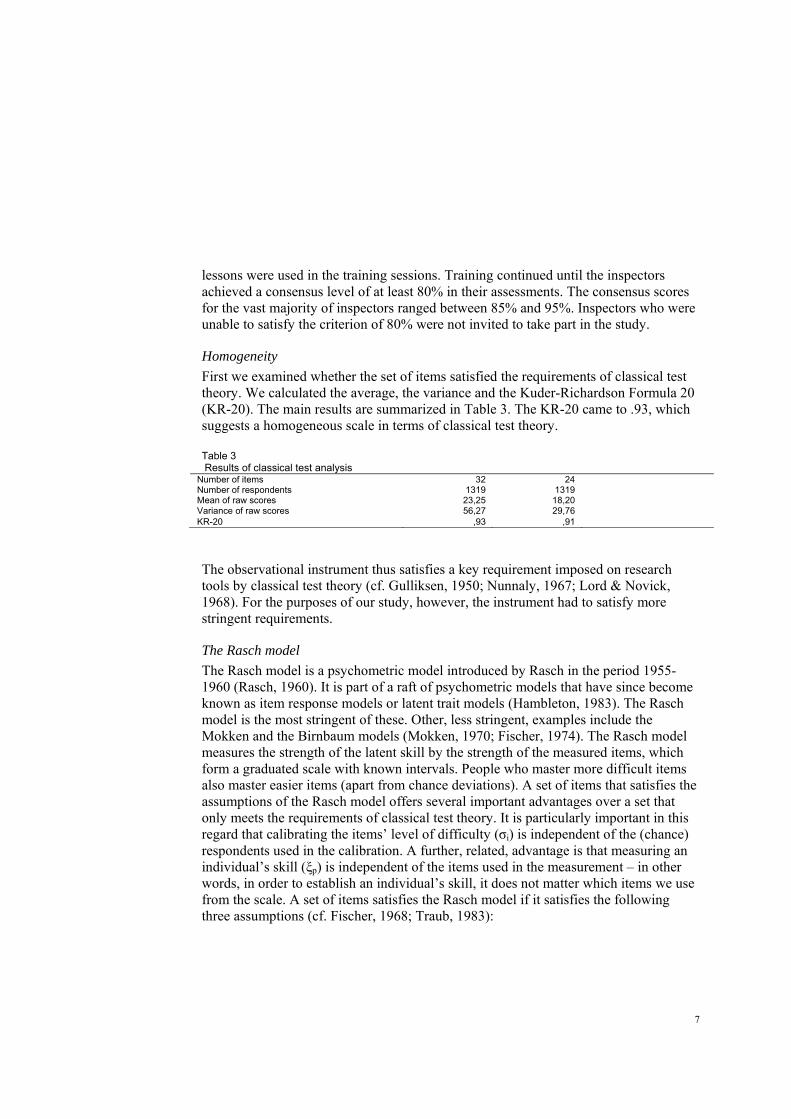
Homogeneity
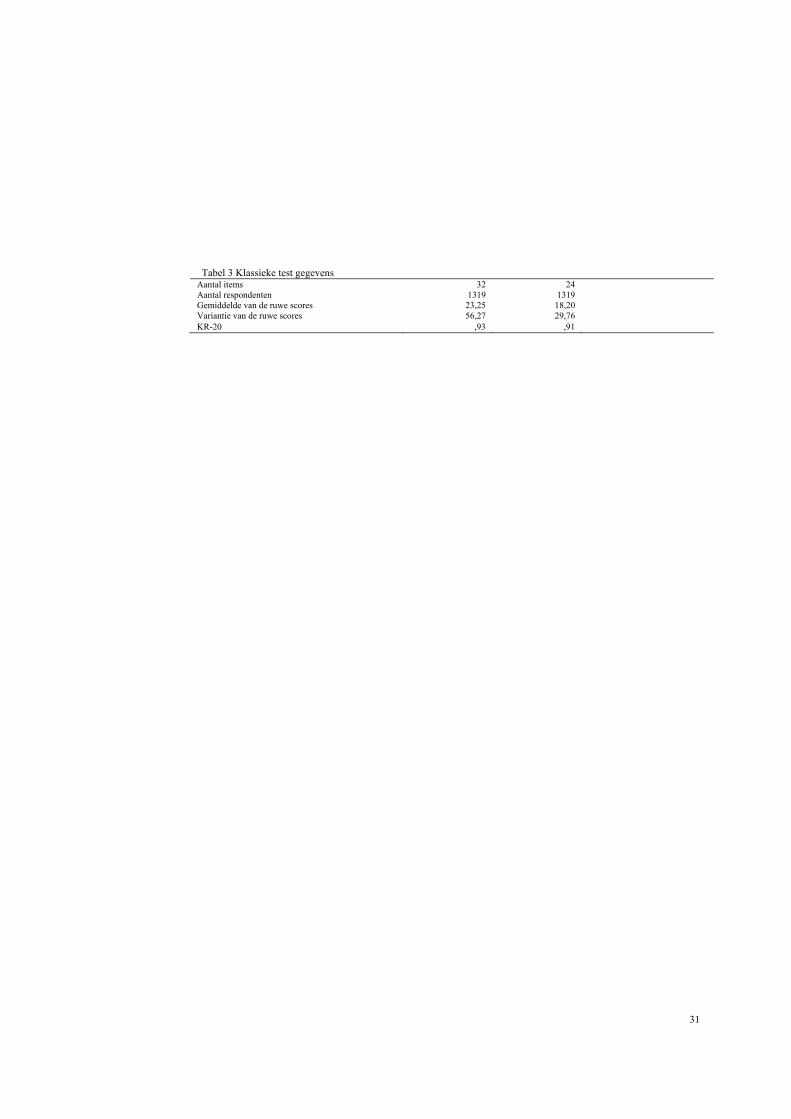
First we examined whether the set of items satisfied the requirements of classical test theory. We calculated the average, the variance and the Kuder-Richardson Formula 20 (KR-20). The main results are summarized in Table 3. The KR-20 came to .93, which suggests a homogeneous scale in terms of classical test theory. Table 3 Results of classical test analysis
Number of items 32 24 Number of respondents 1319 1319 Mean of raw scores 23,25 18,20 Variance of raw scores 56,27 29,76 KR-20 ,93 ,91
The observational instrument thus satisfies a key requirement imposed on research tools by classical test theory (cf. Gulliksen, 1950; Nunnaly, 1967; Lord & Novick, 1968). For the purposes of our study, however, the instrument had to satisfy more stringent requirements.
The Rasch model
The Rasch model is a psychometric model introduced by Rasch in the period 1955-1960 (Rasch, 1960). It is part of a raft of psychometric models that have since become known as item response models or latent trait models (Hambleton, 1983). The Rasch model is the most stringent of these. Other, less stringent, examples include the Mokken and the Birnbaum models (Mokken, 1970; Fischer, 1974). The Rasch model measures the strength of the latent skill by the strength of the measured items, which form a graduated scale with known intervals. People who master more difficult items also master easier items (apart from chance deviations). A set of items that satisfies the assumptions of the Rasch model offers several important advantages over a set that only meets the requirements of classical test theory. It is particularly important in this regard that calibrating the items’ level of difficulty (σi) is independent of the (chance) respondents used in the calibration. A further, related, advantage is that measuring an individual’s skill (ξp) is independent of the items used in the measurement – in other words, in order to establish an individual’s skill, it does not matter which items we use from the scale. A set of items satisfies the Rasch model if it satisfies the following three assumptions (cf. Fischer, 1968; Traub, 1983):
8
1. the assumption of parallelism of the item characteristic curves:1 the items in a Rasch scale must have the same discriminatory power.
2. the assumption of unidimensionality: together, the items must measure one and the same latent skill in a homogeneous way.
3. the assumption of local stochastic independence: the response to one item may not influence the response to another, except for an influence that can be explained by the latent variable that is the measurement objective of the set of items.
Item calibration
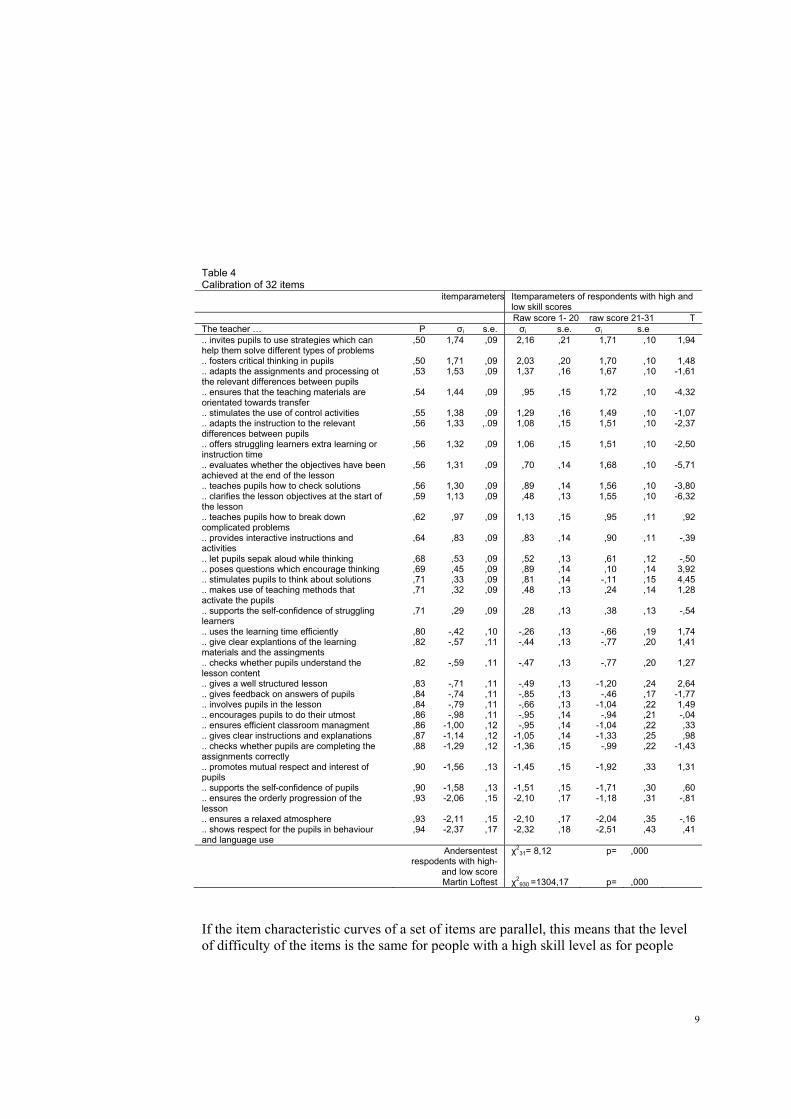
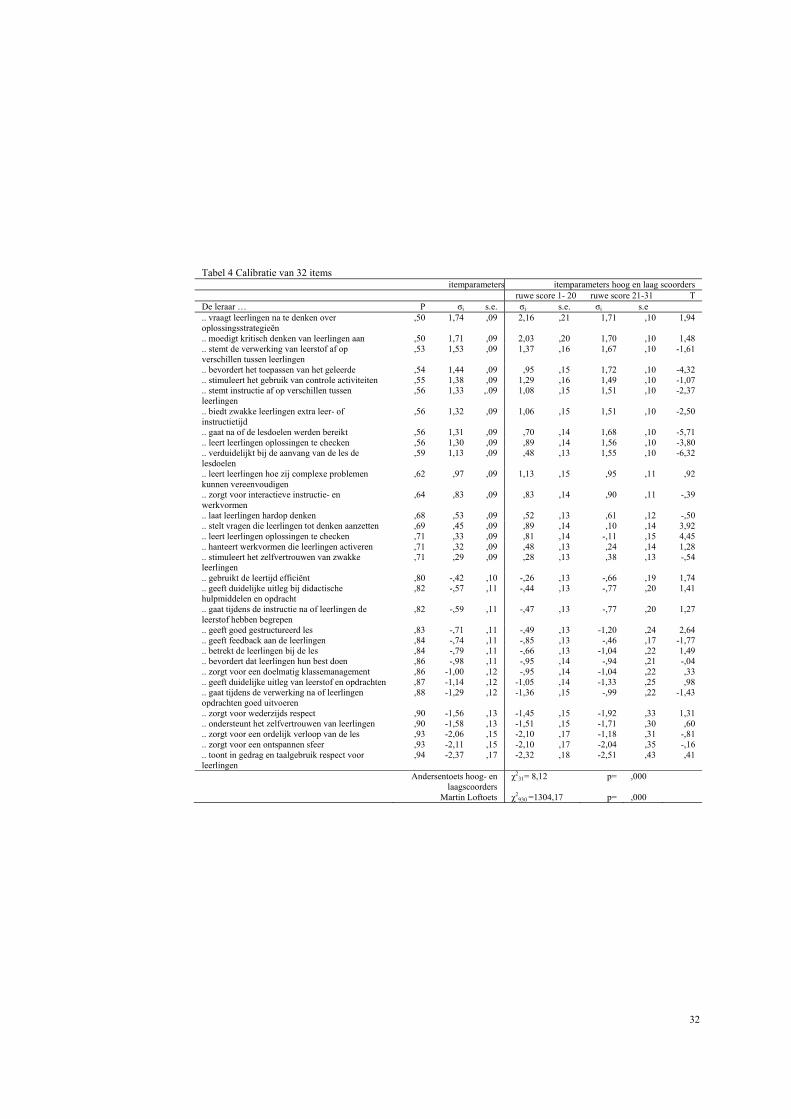
The first step was to calibrate the 32 high-inference indicators, from this point forward called items. Various techniques can be used for this purpose (Fischer, 1974; Wright & Stone, 1979; Gustafsson, 1979; Verhelst, 1992). We opted for the one recommended by Gustafsson, which is implemented in the PML computer program (Gustafsson, 1977; 1979; Molenaar, 1981). This technique is more accurate than the one recommended by Wright and Stone (1979). The technique Gustafsson recommends is the same as that of Fischer (1974) and gives the same calibration results as the OPLM program (Verhelst, 1992). Table 4 shows the results of the calibration.
Parallelism of item characteristic curves
It is important for the fit of the Rasch model that the level of difficulty of the items (σi) is independent of the group of respondents used in the calibration. One way to test this is to check whether the item characteristic curves of a set of items are parallel. Given the nature of statistical tests, we can never actually demonstrate that the item characteristic curves of items are parallel. We can, however, carry out a number of tests that present a reasonable case for parallelism.
1 The following formula is used to describe the item characteristic curve: Pi(ξp) = (e(ξ
p – σ
i) ) / (1 + (e(ξ
p – σ
i) )), whereby ξp is the skill of person p and σi is the level of difficulty of item i; e is the
natural constant 2.71828.
9
Table 4 Calibration of 32 items itemparameters Itemparameters of respondents with high and
low skill scores Raw score 1- 20 raw score 21-31 T The teacher … P σi s.e. σi s.e. σi s.e .. invites pupils to use strategies which can help them solve different types of problems
,50 1,74 ,09 2,16 ,21 1,71 ,10 1,94
.. fosters critical thinking in pupils ,50 1,71 ,09 2,03 ,20 1,70 ,10 1,48
.. adapts the assignments and processing ot the relevant differences between pupils
,53 1,53 ,09 1,37 ,16 1,67 ,10 -1,61
.. ensures that the teaching materials are orientated towards transfer
,54 1,44 ,09 ,95 ,15 1,72 ,10 -4,32
.. stimulates the use of control activities ,55 1,38 ,09 1,29 ,16 1,49 ,10 -1,07
.. adapts the instruction to the relevant differences between pupils
,56 1,33 ,.09 1,08 ,15 1,51 ,10 -2,37
.. offers struggling learners extra learning or instruction time
,56 1,32 ,09 1,06 ,15 1,51 ,10 -2,50
.. evaluates whether the objectives have been achieved at the end of the lesson
,56 1,31 ,09 ,70 ,14 1,68 ,10 -5,71
.. teaches pupils how to check solutions ,56 1,30 ,09 ,89 ,14 1,56 ,10 -3,80
.. clarifies the lesson objectives at the start of the lesson
,59 1,13 ,09 ,48 ,13 1,55 ,10 -6,32
.. teaches pupils how to break down complicated problems
,62 ,97 ,09 1,13 ,15 ,95 ,11 ,92
.. provides interactive instructions and activities
,64 ,83 ,09 ,83 ,14 ,90 ,11 -,39
.. let pupils sepak aloud while thinking ,68 ,53 ,09 ,52 ,13 ,61 ,12 -,50
.. poses questions which encourage thinking ,69 ,45 ,09 ,89 ,14 ,10 ,14 3,92
.. stimulates pupils to think about solutions ,71 ,33 ,09 ,81 ,14 -,11 ,15 4,45
.. makes use of teaching methods that activate the pupils
,71 ,32 ,09 ,48 ,13 ,24 ,14 1,28
.. supports the self-confidence of struggling learners
,71 ,29 ,09 ,28 ,13 ,38 ,13 -,54
.. uses the learning time efficiently ,80 -,42 ,10 -,26 ,13 -,66 ,19 1,74
.. give clear explantions of the learning materials and the assingments
,82 -,57 ,11 -,44 ,13 -,77 ,20 1,41
.. checks whether pupils understand the lesson content
,82 -,59 ,11 -,47 ,13 -,77 ,20 1,27
.. gives a well structured lesson ,83 -,71 ,11 -,49 ,13 -1,20 ,24 2,64
.. gives feedback on answers of pupils ,84 -,74 ,11 -,85 ,13 -,46 ,17 -1,77
.. involves pupils in the lesson ,84 -,79 ,11 -,66 ,13 -1,04 ,22 1,49
.. encourages pupils to do their utmost ,86 -,98 ,11 -,95 ,14 -,94 ,21 -,04
.. ensures efficient classroom managment ,86 -1,00 ,12 -,95 ,14 -1,04 ,22 ,33
.. gives clear instructions and explanations ,87 -1,14 ,12 -1,05 ,14 -1,33 ,25 ,98
.. checks whether pupils are completing the assignments correctly
,88 -1,29 ,12 -1,36 ,15 -,99 ,22 -1,43
.. promotes mutual respect and interest of pupils
,90 -1,56 ,13 -1,45 ,15 -1,92 ,33 1,31
.. supports the self-confidence of pupils ,90 -1,58 ,13 -1,51 ,15 -1,71 ,30 ,60
.. ensures the orderly progression of the lesson
,93 -2,06 ,15 -2,10 ,17 -1,18 ,31 -,81
.. ensures a relaxed atmosphere ,93 -2,11 ,15 -2,10 ,17 -2,04 ,35 -,16
.. shows respect for the pupils in behaviour and language use
,94 -2,37 ,17 -2,32 ,18 -2,51 ,43 ,41
Andersentest respodents with high-
and low score
χ231= 8,12 p= ,000
Martin Loftest χ2930 =1304,17 p= ,000
If the item characteristic curves of a set of items are parallel, this means that the level of difficulty of the items is the same for people with a high skill level as for people
10
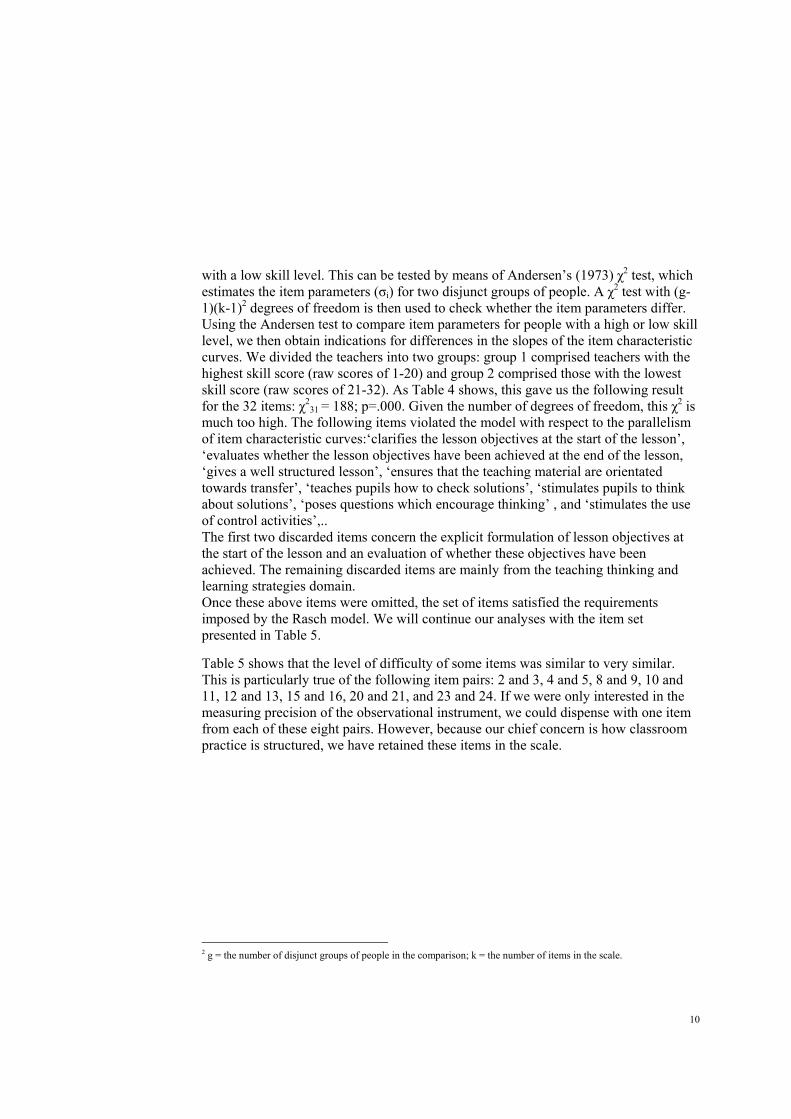
with a low skill level. This can be tested by means of Andersen’s (1973) χ2 test, which estimates the item parameters (σi) for two disjunct groups of people. A χ2 test with (g-1)(k-1)2 degrees of freedom is then used to check whether the item parameters differ. Using the Andersen test to compare item parameters for people with a high or low skill level, we then obtain indications for differences in the slopes of the item characteristic curves. We divided the teachers into two groups: group 1 comprised teachers with the highest skill score (raw scores of 1-20) and group 2 comprised those with the lowest skill score (raw scores of 21-32). As Table 4 shows, this gave us the following result for the 32 items: χ2
31 = 188; p=.000. Given the number of degrees of freedom, this χ2 is much too high. The following items violated the model with respect to the parallelism of item characteristic curves:‘clarifies the lesson objectives at the start of the lesson’, ‘evaluates whether the lesson objectives have been achieved at the end of the lesson, ‘gives a well structured lesson’, ‘ensures that the teaching material are orientated towards transfer’, ‘teaches pupils how to check solutions’, ‘stimulates pupils to think about solutions’, ‘poses questions which encourage thinking’ , and ‘stimulates the use of control activities’,.. The first two discarded items concern the explicit formulation of lesson objectives at the start of the lesson and an evaluation of whether these objectives have been achieved. The remaining discarded items are mainly from the teaching thinking and learning strategies domain. Once these above items were omitted, the set of items satisfied the requirements imposed by the Rasch model. We will continue our analyses with the item set presented in Table 5.
Table 5 shows that the level of difficulty of some items was similar to very similar. This is particularly true of the following item pairs: 2 and 3, 4 and 5, 8 and 9, 10 and 11, 12 and 13, 15 and 16, 20 and 21, and 23 and 24. If we were only interested in the measuring precision of the observational instrument, we could dispense with one item from each of these eight pairs. However, because our chief concern is how classroom practice is structured, we have retained these items in the scale.
2 g = the number of disjunct groups of people in the comparison; k = the number of items in the scale.
11
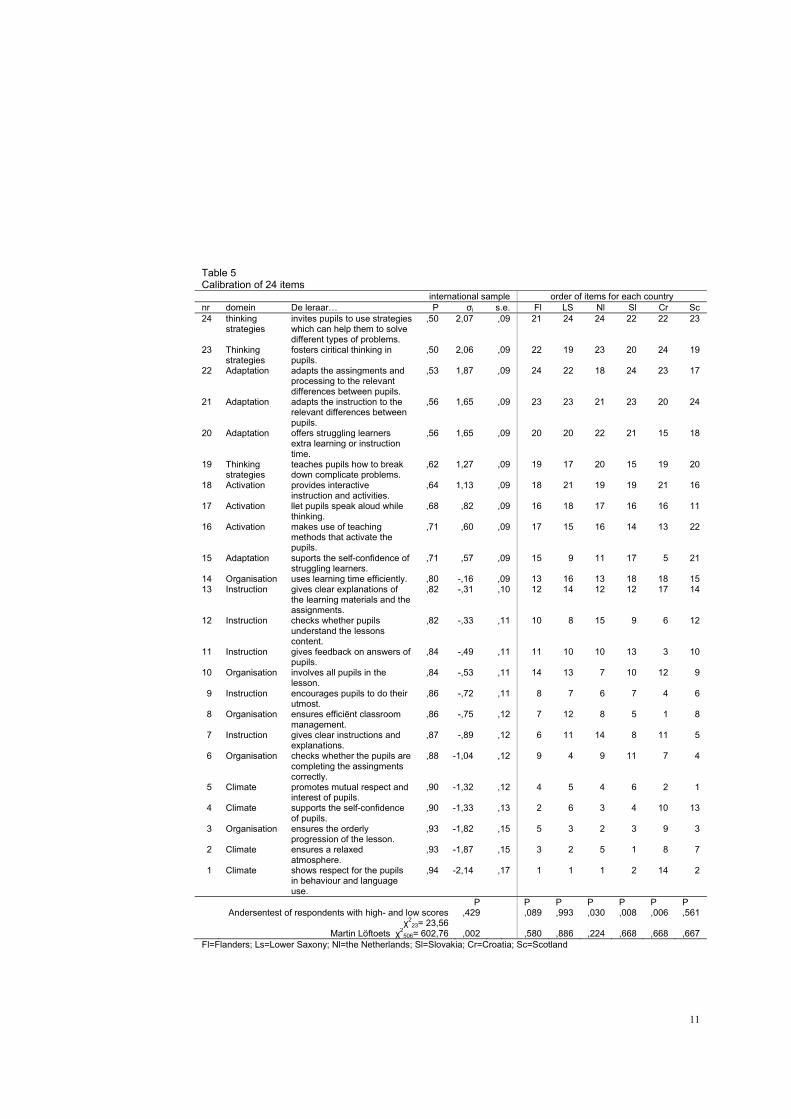
Table 5 Calibration of 24 items international sample order of items for each country nr domein De leraar… P σi s.e. Fl LS Nl Sl Cr Sc 24 thinking
strategies invites pupils to use strategies which can help them to solve different types of problems.
,50 2,07 ,09 21 24 24 22 22 23
23 Thinking strategies
fosters ciritical thinking in pupils.
,50 2,06 ,09 22 19 23 20 24 19
22 Adaptation adapts the assingments and processing to the relevant differences between pupils.
,53 1,87 ,09 24 22 18 24 23 17
21 Adaptation adapts the instruction to the relevant differences between pupils.
,56 1,65 ,09 23 23 21 23 20 24
20 Adaptation offers struggling learners extra learning or instruction time.
,56 1,65 ,09 20 20 22 21 15 18
19 Thinking strategies
teaches pupils how to break down complicate problems.
,62 1,27 ,09 19 17 20 15 19 20
18 Activation provides interactive instruction and activities.
,64 1,13 ,09 18 21 19 19 21 16
17 Activation llet pupils speak aloud while thinking.
,68 ,82 ,09 16 18 17 16 16 11
16 Activation makes use of teaching methods that activate the pupils.
,71 ,60 ,09 17 15 16 14 13 22
15 Adaptation suports the self-confidence of struggling learners.
,71 ,57 ,09 15 9 11 17 5 21
14 Organisation uses learning time efficiently. ,80 -,16 ,09 13 16 13 18 18 15 13 Instruction gives clear explanations of
the learning materials and the assignments.
,82 -,31 ,10 12 14 12 12 17 14
12 Instruction checks whether pupils understand the lessons content.
,82 -,33 ,11 10 8 15 9 6 12
11 Instruction gives feedback on answers of pupils.
,84 -,49 ,11 11 10 10 13 3 10
10 Organisation involves all pupils in the lesson.
,84 -,53 ,11 14 13 7 10 12 9
9 Instruction encourages pupils to do their utmost.
,86 -,72 ,11 8 7 6 7 4 6
8 Organisation ensures efficiënt classroom management.
,86 -,75 ,12 7 12 8 5 1 8
7 Instruction gives clear instructions and explanations.
,87 -,89 ,12 6 11 14 8 11 5
6 Organisation checks whether the pupils are completing the assingments correctly.
,88 -1,04 ,12 9 4 9 11 7 4
5 Climate promotes mutual respect and interest of pupils.
,90 -1,32 ,12 4 5 4 6 2 1
4 Climate supports the self-confidence of pupils.
,90 -1,33 ,13 2 6 3 4 10 13
3 Organisation ensures the orderly progression of the lesson.
,93 -1,82 ,15 5 3 2 3 9 3
2 Climate ensures a relaxed atmosphere.
,93 -1,87 ,15 3 2 5 1 8 7
1 Climate shows respect for the pupils in behaviour and language use.
,94 -2,14 ,17 1 1 1 2 14 2
P P P P P P P Andersentest of respondents with high- and low scores
χ223= 23,56
,429 ,089 ,993 ,030 ,008 ,006 ,561
Martin Löftoets χ2506= 602,76 ,002 ,580 ,886 ,224 ,668 ,668 ,667
Fl=Flanders; Ls=Lower Saxony; Nl=the Netherlands; Sl=Slovakia; Cr=Croatia; Sc=Scotland

12
Unidimensionality and local stochastic independence
The assumption of unidimensionality means that, together, the items must measure one and the same latent skill in a homogeneous way. The assumption of local stochastic independence means that the response to one item may not influence the response to another, except for an influence that can be explained by the latent variable that is the measurement objective of the set of items. Local stochastic independence is in fact the result of a scale that is unidimensional. This means that we can content ourselves with an examination of unidimensionality (Lord & Novick, 1968). Strictly speaking, we can never prove that a scale is in fact unidimensional. We can only check whether the assumption of unidimensionality is violated by one or more factors (Traub, 1983). In this study, we did this by checking whether the skill parameters (σi) varied for different subgroups of respondents, namely male and female teachers, teachers with a lot or little experience, and teachers from different countries. For this purpose we once again used Andersen’s χ2 test. The results are presented in Table 6. We can ascertain that the unidimensionality of the scale is not violated by the sex or experience of the teachers, but that their nationality does violate unidimensionality. Table 6 Unidimensionality
χ2 Degrees of freedom P Gender 22,71 23 ,478 Work experience 32,22 23 ,096 Country 680,26 115 ,000
Table 5 shows that the violation of the unidimensionality requirement is caused in part by the fact that different items change places in the dimension. It also tells us that we cannot rule out the fact that the same set of items in each country individually might be an effective scale that satisfies the assumption of parallelism of the item characteristic curves. For some countries, the p-values of the Andersen test and the Martin Löf test are even higher than in the international sample. The reason why so many items change sequence is that the level of difficulty of some items is similar or very similar. Eight items have a level of difficulty that is close or very close to that of eight other items (2 and 3, 4 and 5, 8 and 9, 10 and 11, 12 and 13, 15 and 16, and 20 and 21). Most of the other violations can be found in the middle of the scale. In particular, it is the items in the ‘Efficient organisation of the lesson’ domain that cause the violations. Table 5 also shows clearly that creating a safe and stimulating learning environment is an easy competence domain for teachers in all countries and that differentiating in instruction and assignments between pupils and teaching them thinking and learning strategies is a difficult competence domain. We can also conclude that the boundaries between the competence domains of ‘safe and stimulating learning environment’, ‘efficient lesson organization’, ‘clear and structured instruction’, ‘activating pupils’, ‘adaptation to pupil differences’ and ‘teaching thinking and learning strategies’ are not

13
absolute but flow smoothly into one another. Finally, we see differences between countries in the sequencing of items according to level of difficulty. In the discussion we will return at length to the differences and similarities between the countries and to the implications of this for the application of the instrument in comparative studies.
5. Teacher skills
The next step was to estimate the skills (ξp) that went with the raw scores (number of ‘good’ scores). The results are shown in Table 7. Table 7 Raw score and estimate skill of pedagogical didactical behaviour of teachers
Raw score Estimated competence (ξp) s.e. Percentage of respondents Cumulative percentage
0 <-3,78 - 0,4 0,4 1 -3,78 1,05 0,4 0,8 2 -3,00 ,77 0,2 1,0 3 -2,49 ,66 0,7 1,7 4 -2,10 ,59 0,9 2,6 5 -1,77 ,55 0,4 3,0 6 -1,48 ,53 1,1 4,1 7 -1,22 ,51 1,2 5,3 8 -,97 ,50 1,6 6,9 9 -,72 ,49 2,0 8,9
10 -,49 ,48 2,3 11,2 11 -,26 ,48 3,5 14,7 12 -,03 ,48 3,9 18,6 13 ,21 ,48 3,6 22,2 14 ,44 ,49 3,8 25,9 15 ,69 ,50 4,6 30,5 16 ,94 ,51 4,7 35,2 17 1,20 ,52 5,0 40,2 18 1,48 ,54 5,3 45,4 19 1,79 ,57 6,1 51,5 20 2,13 ,61 7,3 58,9 21 2,53 ,67 7,7 66,5 22 3,04 ,78 8,2 74,8 23 3,84 1,05 8,1 82,8 24 >3,84 - 17,2 100,0
Mean raw score competence significant difference with international mean (* = p ≤ ,001
International 17,9 1,78 the Netherlands 20,2 2,50 * Lower Saxony 15,6 1,05 * Flanders 17,0 1,43 * Slovakia 17,5 1,71 (Scotland) 21,0 2,88 * (Croatia) 19,2 2,21
Average scores in different countries
Table 7 presents an overview of the average scores in the participating countries.
6. Teacher skills and professional experience
In the cross-sectional study, we only used the sample of 402 German teachers to investigate whether there was a correlation between the number of years’ teaching
14
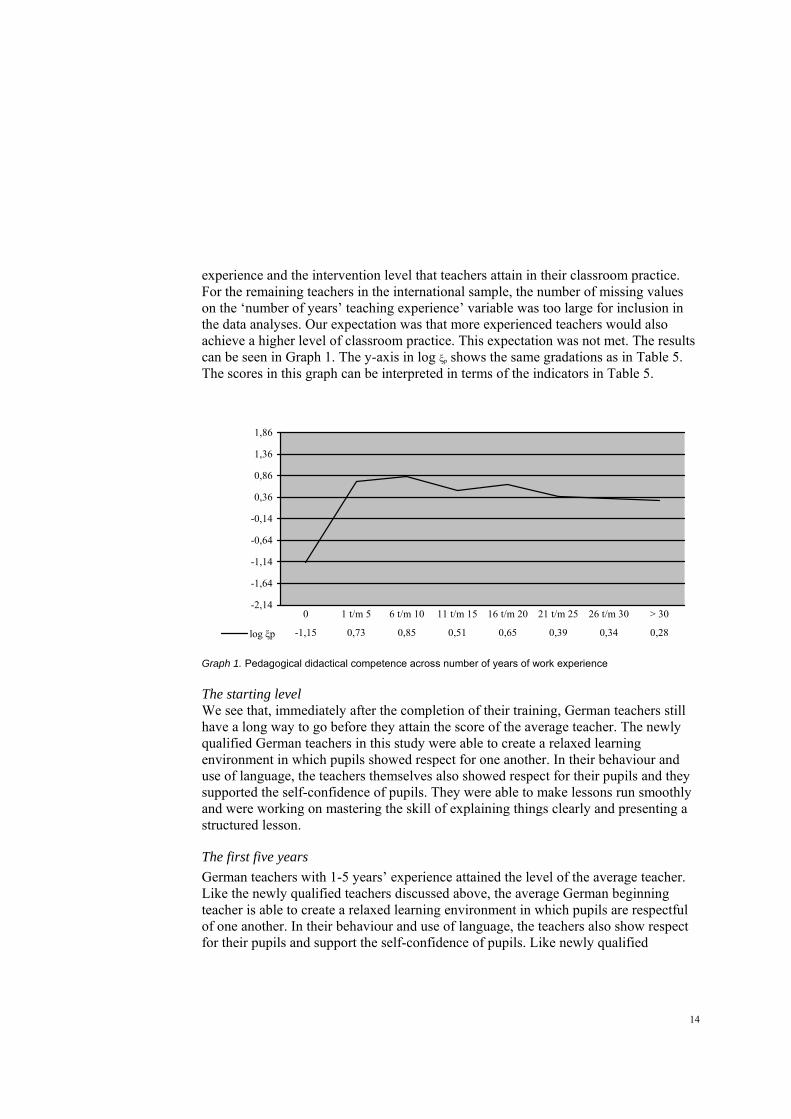
experience and the intervention level that teachers attain in their classroom practice. For the remaining teachers in the international sample, the number of missing values on the ‘number of years’ teaching experience’ variable was too large for inclusion in the data analyses. Our expectation was that more experienced teachers would also achieve a higher level of classroom practice. This expectation was not met. The results can be seen in Graph 1. The y-axis in log ξp shows the same gradations as in Table 5. The scores in this graph can be interpreted in terms of the indicators in Table 5.
-2,14
-1,64
-1,14
-0,64
-0,14
0,36
0,86
1,36
1,86
log ξp -1,15 0,73 0,85 0,51 0,65 0,39 0,34 0,28
0 1 t/m 5 6 t/m 10 11 t/m 15 16 t/m 20 21 t/m 25 26 t/m 30 > 30
Graph 1. Pedagogical didactical competence across number of years of work experience
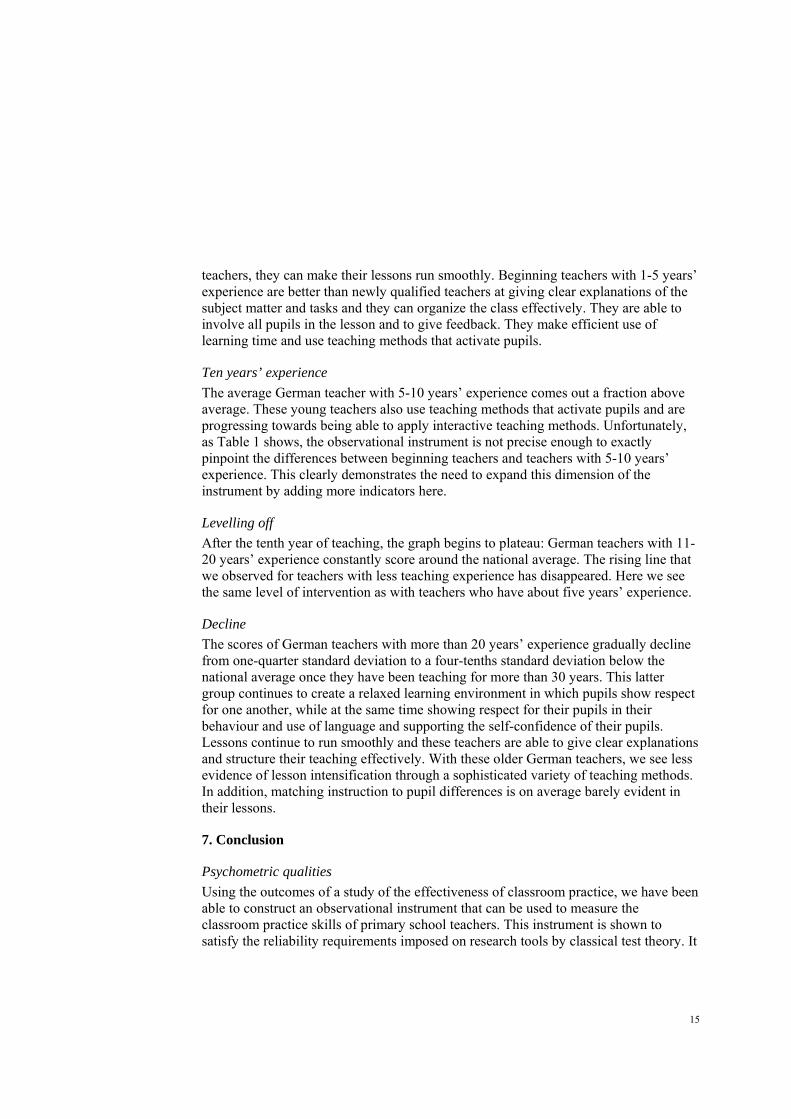
The starting level We see that, immediately after the completion of their training, German teachers still have a long way to go before they attain the score of the average teacher. The newly qualified German teachers in this study were able to create a relaxed learning environment in which pupils showed respect for one another. In their behaviour and use of language, the teachers themselves also showed respect for their pupils and they supported the self-confidence of pupils. They were able to make lessons run smoothly and were working on mastering the skill of explaining things clearly and presenting a structured lesson.
The first five years
German teachers with 1-5 years’ experience attained the level of the average teacher. Like the newly qualified teachers discussed above, the average German beginning teacher is able to create a relaxed learning environment in which pupils are respectful of one another. In their behaviour and use of language, the teachers also show respect for their pupils and support the self-confidence of pupils. Like newly qualified
15
teachers, they can make their lessons run smoothly. Beginning teachers with 1-5 years’ experience are better than newly qualified teachers at giving clear explanations of the subject matter and tasks and they can organize the class effectively. They are able to involve all pupils in the lesson and to give feedback. They make efficient use of learning time and use teaching methods that activate pupils.
Ten years’ experience
The average German teacher with 5-10 years’ experience comes out a fraction above average. These young teachers also use teaching methods that activate pupils and are progressing towards being able to apply interactive teaching methods. Unfortunately, as Table 1 shows, the observational instrument is not precise enough to exactly pinpoint the differences between beginning teachers and teachers with 5-10 years’ experience. This clearly demonstrates the need to expand this dimension of the instrument by adding more indicators here.
Levelling off
After the tenth year of teaching, the graph begins to plateau: German teachers with 11-20 years’ experience constantly score around the national average. The rising line that we observed for teachers with less teaching experience has disappeared. Here we see the same level of intervention as with teachers who have about five years’ experience.
Decline
The scores of German teachers with more than 20 years’ experience gradually decline from one-quarter standard deviation to a four-tenths standard deviation below the national average once they have been teaching for more than 30 years. This latter group continues to create a relaxed learning environment in which pupils show respect for one another, while at the same time showing respect for their pupils in their behaviour and use of language and supporting the self-confidence of their pupils. Lessons continue to run smoothly and these teachers are able to give clear explanations and structure their teaching effectively. With these older German teachers, we see less evidence of lesson intensification through a sophisticated variety of teaching methods. In addition, matching instruction to pupil differences is on average barely evident in their lessons.
7. Conclusion
Psychometric qualities
Using the outcomes of a study of the effectiveness of classroom practice, we have been able to construct an observational instrument that can be used to measure the classroom practice skills of primary school teachers. This instrument is shown to satisfy the reliability requirements imposed on research tools by classical test theory. It
16
also satisfies key psychometric requirements imposed by the Rasch model on such instruments. The item characteristic curves of the individual items are parallel and the requirement of unidimensionality is not violated by differences in sex and years of experience. These findings mean that the instrument can validly be deployed for the observation of both male and female teachers, as well as for teachers with varying degrees of teaching experience (e.g. both beginning and experienced teachers). However, the item parameters were not invariant for teachers across the different countries. This means that although the observational instrument can be validly deployed for comparing the teaching skills of teachers within countries, it cannot be used to compare teacher skills between countries. For example, if teachers from Flanders, Lower Saxony, the Netherlands and Slovakia have a score of .82, the invariance of the item parameters between the countries means that the Flemish, Dutch and Slovakian teachers with this score activate their pupils, for instance, by having them think aloud in class, but this does not apply to Lower Saxon teachers with the same score .82. In other words, the significance of the score can vary for the different countries.
Theory on the development of teacher competence
The studies of Van de Grift & Lam (1998) and Kyriakides, Creemers & Antoniou (2009) have highlighted a dimension of classroom practice that starts with ensuring a safe, stimulating learning environment, progresses to efficient lesson organization and is followed by clear and structured instruction. Higher levels include intensification of the lesson, activating pupils and adapting instruction to pupil differences. Table 5 shows clearly that the items in the ‘ensuring a safe and stimulating environment’ domain constitute an easy competence domain, while those in the domains of ‘adapting instruction to pupil differences’ and ‘teaching pupils thinking and learning strategies’ are difficult competence domains. Between these two domains we find the items in the domains of ‘efficient lesson organization’, ‘clear and structured instruction’ and ‘intensifying the lesson and activating pupils’. This is consistent with the findings of Van de Grift & Lam (1998) and Kyriakides, Creemers & Antoniou (2009). We can also conclude that the boundaries between the competence domains of learning environment, lesson organization, instruction, activating pupils, adapting teaching to pupil differences and thinking and learning strategies are not absolute, but that they easily merge. The structure evident in the scale lends support to the idea that successful implementation of certain less complex teaching skills is a precondition for being able to implement more difficult or complex skills. Teachers who cannot engender a safe and stimulating environment for their pupils will experience difficulty efficiently organizing a lesson or presenting a clear, structured lesson. Teachers who fail to organize a lesson efficiently or to give a clear, structured lesson will not succeed in
17
intensifying the lesson or in activating pupils. The ability to activate pupils is in turn a precondition for being able to match teaching to pupil differences and to train pupils in thinking and learning strategies. Thus we see a theoretical structure in a teacher’s classroom practice, which tells us something about the sequence in which we can train future teachers in the requisite skills. It also tells us something about the zone of proximal development of teachers with a particular score. Teachers whose score does not exceed the level of efficient lesson organization and clear and structured instruction would benefit more from in-service training in intensifying the lesson and activating pupils than from proceeding straight to adapting teaching to pupil differences or teaching pupils thinking and learning strategies.
8. Discussion
Item parameters in the ‘classroom organization’ domain
Generally speaking, we have been able to ascertain that related items (i.e. items from the same domain) have a similar level of difficulty. Items in the ‘lesson organization’ domain are an exception here (these are: item 3 ‘ensures the orderly progression of the lesson’; item 8 ‘ensures efficient classroom management’; item 10 ‘involves all pupils in the lesson’ and item 14 ‘uses learning time efficiently’). Here we see that the levels of difficulty are further apart and are distributed more widely across the scale. A possible explanation for this relatively large distribution is that management or organization-related teaching behaviour is supported by different skills that increase in level of difficulty. It may well be that the smooth running of the lesson is a skill that people acquire to some degree of their own accord and apply intuitively or as a useful strategy. If we continue this line of reasoning, then ensuring effective classroom management presupposes an acquired awareness about exercising leadership in the classroom by, among other things, establishing contact with pupils and accepting that it is the teacher’s role to assume and to take leadership. The efficient use of learning time presupposes not only accepting this role, but also a certain degree of teaching skill, which makes it a more complex organizational task. Further research is needed to show whether this reasoning is tenable.
Differences between countries
We concluded above that the differences between countries with regard to level of difficulty of the items were so great that the validity test showed a negative result. But this is not quite the full picture. For example, there are a number of reasons to suggest that these differences are perhaps not as big or significant as the data analysis would lead us to believe. Firstly, we have established that for several items the difference in level of difficulty was small to very small. For example, the difference between ‘The teacher invites pupils to use strategies which can help them solve different types of problems’ and ‘The teacher fosters critical thinking in pupils’ is one-hundredth. This difference is
18
negligible, given the standard error. If the differences in level of difficulty are so small, there is a very high probability that the unidimensionality requirement will be violated. (This is also an important explanation for the sometimes weak outcomes of the Martin Löf test.) These violations are irrelevant in methodological terms. Secondly, we can say that violations are less relevant if the two items concern closely related aspects of classroom practice. This is the case in the above example, where both items come from the ‘teaching thinking and learning strategies’ domain. Thirdly, it strikes us that if we look at item content, we see a similar sequencing in levels of difficulty in all countries individually, as we also found in analyses that examined all countries jointly. On the one hand, this result could be anticipated in the light of the theory and the results of the analyses of the sample as a whole. On the other hand, it is worth mentioning because of the hypothetical possibility that one or more countries deviates sharply from this international sequencing, thereby giving rise to the negative Andersen test. This has proven to be most definitely not the case. Fourthly, in order to put into perspective the differences in the item parameters of the different countries, we can say the following: in terms of the Rasch model, a score showing a particular skill level means that the teacher in question has mastered the skill level of items with a lower item parameter. For teachers with a high skill score, it does not matter in the least whether items of a lower skill level than theirs have a somewhat lower or higher position on the scale in another country, so long as the teachers master these items. Lastly, if we do nevertheless wish to make international comparisons on the basis of this observation scale, we can always add different interpretations per country to the average scores obtained in each country. We have so far presented the benefits of the instrument; there are of course also limitations. There are relevant differences between the item parameters of the different countries that give rise to the negative result of the unidimensionality study for countries and for which we can suggest no conclusive explanation on the basis of the empirical data of this study. We will mention a number of salient differences in the item parameters. Most of the differences that really matter are found in the middle part of the scale. Flemish teachers clearly find it easier to give a clear explanation of the subject matter and tasks, while teachers in Lower Saxony find it easier to check whether the pupils are in fact carrying out the right tasks while processing but more difficult to implement efficient classroom management. For Dutch teachers, it is obviously easier to involve all pupils in the lesson and to stimulate the self-confidence of struggling learners but more difficult to check while teaching whether pupils have understood the subject matter. Slovakian teachers can more easily give a clear explanation of the subject matter and teach pupils how to simplify complex problems. We cannot at all rule out that these differences in item parameters correlate with inter-country differences in the approach to classroom practice, in educational culture, or in teacher training. In order to improve the observational instrument to increase its
19
validity, and hence usability, for international comparative research, more research is needed that will shed light on the causes of differences in teacher skills between countries. The key question is: Are differences in the level of difficulty of teaching skills caused by different educational cultures?
Cross-sectional studies
It is tempting to interpret the cross-sectional data in graph 1 longitudinally, but for various reasons this would not be methodological sound. We are dealing with a sample of no more than 402 German primary school teachers. Four hundred may be a large number for an observation study, but the eight age groups here, and this is what everything hinges on, range in size from 17 to 90 teachers. We should also realize that each ‘years of experience’ category contains a different group of teachers, who were trained and who began their teaching careers at different times. These generational differences may bring with them significant differences in professional skills, views, customs and the like. We also need to be aware that at different times in an individual’s teaching career different events occur that may have quite different repercussions for one particular age group and perhaps none at all for another. We must therefore be cautious in our interpretation of this data. This is not to say, however, that we cannot derive from this study of German teachers several working hypotheses and questions for further research. The first group of questions and working hypotheses relates to the starting level of recently qualified teachers. A key question is as follows: Is the entry level of the teachers who have just completed teacher training in the Netherlands, Flanders, and so on as low as in our limited study of German primary school teachers? The newly qualified German teachers in this study were able to create a relaxed learning environment in which pupils showed respect for one another. In their own behaviour and use of language, the teachers also demonstrated respect for their pupils and they supported pupil self-confidence. Their lessons ran smoothly but they were not yet fully accomplished at providing clear explanations and structured lessons. Because we currently have access to little data beyond that of our own teacher training programme, it is essential that a systematic study be made of the starting level of Dutch, Flemish etc. teachers. A second group of questions and working hypotheses concerns the issue of teachers in their first few years of teaching. Although this has been a subject of research for many years (Tabachnick, 1980; Corcoran, 1981; Vonk, 1982; Créton & Wubbels, 1984; Veenman, 1984; De Jonge & De Muijnck, 2002; Van Kregten & Moerkamp, 2004; Houtveen, Versloot & Groenen, 2006), there are still many unanswered questions, especially with respect to the skills of beginning teachers. German teachers with 5 to 10 years’ experience demonstrated a conspicuously high level of professional

20
competence. The question then is: Do young teachers at the start of their career undergo a spectacular rate of development? Or is this extraordinary effect the result of so many beginning teachers leaving the profession in the first five years, with only the good ones remaining? In the Netherlands, for example, about one quarter of new teachers leave the profession during the first five years (De Jonge & De Muijnck, 2002; OCW, WIO, 2003; Van Kregten & Moerkamp, 2004). A third group of working hypotheses and questions relates to teachers with 11 to 20 years’ experience. Does the level of Dutch and other teachers transcend that of German teachers, which does not go beyond the most basic skills? The level of intervention for German teachers with 11 to 20 years’ experience does not exceed a focus on a safe and stimulating learning environment, a well-organized lesson, and clear, structured instruction. Why do they not progress towards intensive feedback and interaction with their pupils and the ability to effectively tailor their instruction to pupil differences? Does teacher development in Dutch secondary education stagnate after more than 20 years’ experience, as it does among German primary school teachers? The fourth group of questions and hypotheses concerns older teachers. We have seen that the scores of German primary school teachers with more than 20 years’ experience gradually decline in relation to the national average. This starts with a drop of one-quarter standard deviation and ultimately reaches a four-tenths standard deviation below the national average once teachers have been teaching for more than 30 years. Does this phenomenon also occur in other countries?
References
Andersen, E.B. (1973) A goodness of fit test for the Rasch model. Psychometrika 38,1. Anderson, L.M., Evertson, C.M. & Brophy, J.E. (1979). An experimental study of
effective teaching in first grade groups. Elementary School Journal, 79 (1), 193-223.
Booij, N., Houtveen, A.A.M. & Overmars, A.M. (1995). Instructie bij Begrijpend Lezen. [Reading comprehension instruction] Utrecht: ISOR.
Bosker, R.J. & Witziers, B. (1996). The magnitude of school effects, or: Does it really matter which school a student attends? Paper presented at the annual meeting of the American Educational Research Association, New York.
Brandsma, H.P. & Knuver, J.W.M. (1989). Effects of school and classroom characteristics on pupil progress in language and arithmetic's. International Journal of Educational Research, 13, 777-788.
Capie, W., Johnson, C.E., Anderson, S.J., Ellett, C. and Okey, LR. (1980). Teacher performance assessment instruments. Athens, GA: University of Georgia.
Cotton, K. (1995). Effective schooling practices: a research synthesis. Portland, OR: Northwest Regional Educational Laboratory.
21
Corcoran, E. (1981). Transition shock: teacher’s paradox. Journal of Teacher Education, 32(3), 19-23.
Creemers, B.P.M. & Reynolds, D. (eds.) (2000). School effectiveness and school improvement. Lisse: Swets & Zeitlinger.
Creemers, B.P.M. (1991). Effectieve instructie. [Effective Instruction]. Den Haag: SVO.
Creemers, B.P.M. (1994). The effective classroom. London: Cassell. Creton, H.A. & Wubbels, T. (1984). Ordeproblemen bij beginnende leraren. Utrecht:
Uitgeverij W.C.C. De Jonge, J.F.M. & Muijnck, J.A. de (2002). Waarom leraren de sector verlaten.
Onderzoek naar de uitstroom in het primair en secundair onderwijs. Zoetermeer: EIM.
Evertson, C. (1987). Classroom observation record: observation record for project STAR. Nashville, TN: Vanderbilt University.
Evertson, C. & Burry, J. (1989). Capturing classroom context: the observation instrument as lens for assessment. Journal of Personnel Evaluation in Education, 2, 297-320.
Florida Coalition for the Development of a Performance Measurement System (1983). Domain: Knowledge base of the Florida performance measuremen system. Tallahassee, FL: Office of teacher education, certification and in-service staff development.
Fischer, 1968; 1974 (second edition) Einfürung in die Theorie psychologischer Tests. Verlag Hans Huber, Bern, Stuttgart, Wien.
Flanders, N. (1970). Analyzing teaching behavior. Reading, MA: Addison-Wesley. Flanders, N.A. (1961). Interaction analysis: a technique for quantifying teacher
influence. Minneapolis, MN:University of Minnesota, College of Education, Bureau of Educational Research.
Florida Coalition for the Development of a Performance Measurement System (1983). Domains: knowledge base of the Florida performance measurement system. Tallahassee, FL: Office of Teacher Education, Certification and In-service Staff Development.
Gustafsson, J.-E. (1977) The Rasch model for dichotomous items: theory, ap[plications anmd a computerprogram. Göteborg: Institute of Education, University of Göteborg.
Gustafsson, J.-E. (1979) Testing and obtaining fit of data to the Rasch model. Göteborg: Institute of Education, University of Göteborg.
Hambleton, R.K. (Ed.) (1983). Applications of item response theory. Vancouver, B.C.: Educational Research Institute of British Columbia.
Houtveen, A.A.M., & Van de Grift, W.J.C.M. (2007). Effects of metacognitive strategy instruction and instruction time on reading comprehension. School. Effectiveness and School Improvement, 18 (2), 173-190.
22
Houtveen, A.A.M., & Van de Grift, W.J.C.M. (2007). Reading instruction for struggling learners. Journal of Education for Students Placed At Risk, 12 (4), 405-424.
Houtveen, A.A.M., Mijs, D., Vernooy, K., Van de Grift, W.J.C.M., & Koekebacker, E. (2003). Risicoleerlingen bij technisch lezen. [Pupils at risk. Evaluation of the technical reading and handling of diverse needs programme] Utrecht: ISOR.
Houtveen, A.A.M., Booij, N., De Jong R. & Van de Grift, W.J.C.M. (1999). Adaptive instruction and pupil achievement. School Effectiveness and School Improvement, 10 (2), 172-192.
Houtveen, A.A.M., & Overmars, A.M. (1996). Instructie bij rekenen en wiskunde [Instruction in mathematics education] Utrecht: ISOR.
Houtveen, Versloot & Groenen (2006). De begeleiding van startende leraren; in het voortgezet onderwijs en in het basisonderwijs. Den Haag: Sectorbestuur Onderwijsarbeidsmarkt (SBO).
Inspectie van het Onderwijs [Inspectorate of Education] (1997). Integral school supervision in primary education. Utrecht: Inspectie van het Onderwijs.
Kyriakides, L., Creemers, B.P.M. & Antoniou, P. (2009), Teacher behaviour and student outcomes: suggestions for research on teacher training and professional development. Teaching and Teacher Education, 25(1), 12-23.
Lord, F.M. & Novick, R.M. (1968) Statistical theories of mental test scores. Massachusets: Addison-Wesley Publ. Comp.
Levine, D.U. & L.W. Lezotte (1990). Unusually effective schools: a review and analysis of research and practice. Madison, WI: The Center for Effective Schools Research and Development.
Levine, D.U. & L.W. Lezotte (1995). Effective schools research. In J.A. Banks & C.A.M. Banks (Eds). Handbook of research on multicultural Education (pp. 525-547). New York, NY: Macmillan.
Mokken, R.J. (1971). A theory and procedure of scale analysis. Paris/The Hague: Mouton.
Molenaar, I.W. (1981). Programmabeschrijving van PML (versie 3.1) voor het Rasch model. [Program discription of PML version 3.1 for the Rasch model] Groningen: Heymans Bulletins Psychologische Geschriften. RU Groningen.
OCW (2003). Werken in het onderwijs(WIO-2003.) ’s-Gravenhage: OCW Ofsted (1995). Guidance on the inspection of nursery & primary schools. London:
HMSO. Postlethwaite, T.N., & Ross, K.N. (1992) Effective schools in reading. The Hague:
IEA. Purkey, S.L., & Smith, M.S. (1983). Effective schools: a review. Elementary School
Journal, 83 (4), 427-452. Rasch, G. (1960). Probabilistic models for some intelligence and attainment tests.
Copenhagen: Danmarks Paedagogiske Institute.

23
Rasch, G. (1966). An item analysis which takes individual differences into account. The British Journal for Mathematical and Statitistical Psychology, 19, 1.
Roeleveld, J. (2003). Herkomstkenmerken en begintoets. Secundaire analyses op het PRIMA-cohort onderzoek.[Social economical characteristics of students and testing] Amsterdam: SCO Kohnstamm Instituut.
Sammons, P. Hillman, J. & Mortimore, P. (1995). Key characteristics of effective schools: a review of school effectiveness research. London: Office for Standards in Education.
Schaffer, E.C. & Nesselrodt, P.S. (1992). The development and testing of the special strategies observation system. Paper presented at the AERA Meeting, San Francisco, CA, 21-23 April.
Scheerens, J. (1989). Wat maakt scholen effectief? ‘s-Gravenhage: Instituut voor Onderzoek van het Onderwijs SVO.
Scheerens, J. (1992). Effective schooling: research, theory and practice. London: Cassell.
Scheerens, J. & Bosker, R. (1997). The foundations of educational effectiveness. Oxford: Pergamon.
Scheerens, J., Seidel, T., Witziers, B., Hendriks, M., & Doornekamp, G. (2005). Positioning and validating the supervision framework. Enschede: University of Twente.
Slavin, R.E. (1987). Ability grouping and achievement in elementary schools. Review of Educational Research, 57, 293-336.
Stallings, J. & Kaskowitz, D. (1974). Follow-through classroom observation evaluation (1972-1973). Menlo Park, CA: SRI International.
Stallings, J., Needels, M.& Stayrook, N. (1979). How to change the process of teaching basic reading skills in secondary schools. Menlo Park, CA: SRI International.
Stringfield, S., Teddlie, C. & Suarez, S. (1985). Classroom interaction in effective and ineffective schools: preliminary results from phase HI of the Louisiana School Effectiveness Study. Journal of Classroom Interaction, 20, 31-37.
Tabachnick, B.R. (1980). Intern-teacher roles: illusions, disillusions, and reality. Journal of Education, 162(1), 122-137.
Tabachnick, B., Popkewitz, T. & Zeichner, K.M. (1979-1980). Teacher education and the professional perspectives of student teachers. Interchange, (10), 12-29.
Teddlie, C., I. Virgilio & J. Oescher (1990). Development and validation of the Virgilio Teachers Behavior Instrument. Educational and Psychological Measurement 50,421-430.
Traub, R.E. (1983). A priori considerations in chossing an item response model. In: R.K. Hambleton (Ed.) Applications of item response theory. Vancouver, B.C.: Educational Research Institute of British Columbia.
Tricket, E. J. & Moos, R. H. (1974). The Classroom environment scale (CES). Palo Alto, CA: Consulting Psychologists Press, Inc.
24
Van de Grift, W. & J.F. Lam (1998). Het didactisch handelen in het basisonderwijs. [Instruction in primary education.] Tijdschrift voor Onderwijsresearch 23(3), 224-241.
Van de Grift, W. (2007). Quality of teaching in four European countries: a review of the literature and application of an assessment instrument Educational Research, 49(2), 127-152.
Van de Grift, W. (2009). International Comparative Analysis of Learning and Teaching in Math Lessons in Several European Countries. Utrecht: The Netherlands Inspectorate of Education.
Van Kregten, A. & Moerkamp, T. (2004). Startende leraren in het buitenland. Den Haag: SBO.
Veenman, S. (1984). Perceived problems of beginning teachers. Review of Educational Research. 54(2), 143-178.
Veenman, S., Lem, P., Voeten, B., Winkelmolen, B. & H. Lassche (1986). Onderwijs in combinatieklassen. [Education in multi-graded classrooms.] 's-Gravenhage: SVO.
Verhelst, N.D. (1992) Het eenparameter logistisch model (OPLM) [the one parameter logistic model]. Arnhem: Cito.
Virgilio, I. (1987). An examination of the relationships among school effectiveness in elementary and junior high schools. Doctoral dissertation, University of New Orleans.
Virgilio, I. & Teddlie, C. (1989). Technical Manual for the Virgilio Teacher Behavior Inventory. Unpublished manuscript, University of Orleans.
Vonk, J.H.C. (1982). Opleiding en praktijk. Amsterdam: VU-boekhandel/uitgeverij. Walberg, H.J. & Haertel, G.D. (1992). Educational psychology’s first century. Journal
of Educational Psychology, 84 (1), 6-19. Wijnstra, J., Ouwens, M., & Béguin, A. (2003). De toegevoegde waarde van de
basisschool. [Added value of schools in elementary education]. Arnhem: CITOgroep.
Wright, B.D. & Stone, M.H. (1979). Best test design, Rasch measurement. Chicago: MESA press.
25
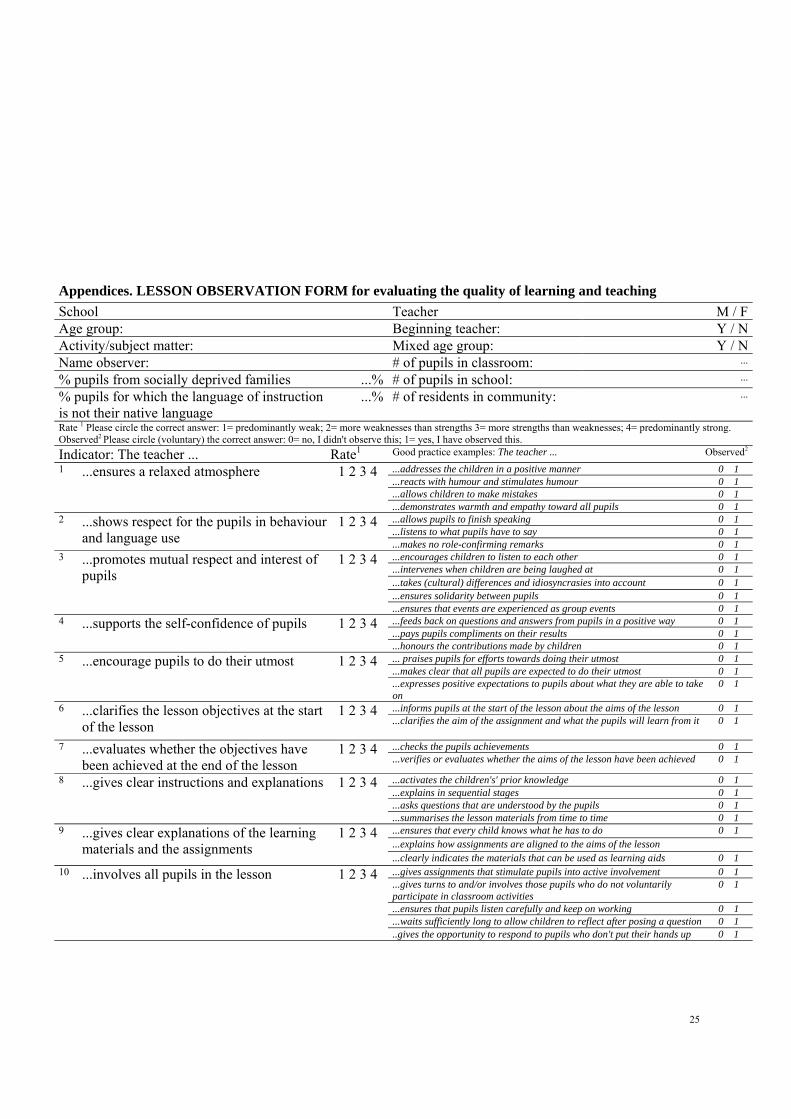
Appendices. LESSON OBSERVATION FORM for evaluating the quality of learning and teaching
School Teacher M / FAge group: Beginning teacher: Y / NActivity/subject matter: Mixed age group: Y / NName observer: # of pupils in classroom: ...
% pupils from socially deprived families ...% # of pupils in school: ...
% pupils for which the language of instruction is not their native language
...% # of residents in community: ...
Rate 1 Please circle the correct answer: 1= predominantly weak; 2= more weaknesses than strengths 3= more strengths than weaknesses; 4= predominantly strong. Observed2 Please circle (voluntary) the correct answer: 0= no, I didn't observe this; 1= yes, I have observed this.
Indicator: The teacher ... Rate1 Good practice examples: The teacher ... Observed2
1 ...ensures a relaxed atmosphere 1 2 3 4 ...addresses the children in a positive manner 0 1 ...reacts with humour and stimulates humour 0 1 ...allows children to make mistakes 0 1 ...demonstrates warmth and empathy toward all pupils 0 1
2 ...shows respect for the pupils in behaviour and language use
1 2 3 4 ...allows pupils to finish speaking 0 1 ...listens to what pupils have to say 0 1 ...makes no role-confirming remarks 0 1
3 ...promotes mutual respect and interest of pupils
1 2 3 4 ...encourages children to listen to each other 0 1 ...intervenes when children are being laughed at 0 1 ...takes (cultural) differences and idiosyncrasies into account 0 1 ...ensures solidarity between pupils 0 1 ...ensures that events are experienced as group events 0 1
4 ...supports the self-confidence of pupils 1 2 3 4 ...feeds back on questions and answers from pupils in a positive way 0 1 ...pays pupils compliments on their results 0 1 ...honours the contributions made by children 0 1
5 ...encourage pupils to do their utmost 1 2 3 4 ... praises pupils for efforts towards doing their utmost 0 1 ...makes clear that all pupils are expected to do their utmost 0 1 ...expresses positive expectations to pupils about what they are able to take on
0 1
6 ...clarifies the lesson objectives at the start of the lesson
1 2 3 4 ...informs pupils at the start of the lesson about the aims of the lesson 0 1 ...clarifies the aim of the assignment and what the pupils will learn from it 0 1
7 ...evaluates whether the objectives have been achieved at the end of the lesson
1 2 3 4 ...checks the pupils achievements 0 1 ...verifies or evaluates whether the aims of the lesson have been achieved 0 1
8 ...gives clear instructions and explanations 1 2 3 4 ...activates the children's' prior knowledge 0 1 ...explains in sequential stages 0 1 ...asks questions that are understood by the pupils 0 1 ...summarises the lesson materials from time to time 0 1
9 ...gives clear explanations of the learning materials and the assignments
1 2 3 4 ...ensures that every child knows what he has to do 0 1 ...explains how assignments are aligned to the aims of the lesson ...clearly indicates the materials that can be used as learning aids 0 1
10 ...involves all pupils in the lesson 1 2 3 4 ...gives assignments that stimulate pupils into active involvement 0 1 ...gives turns to and/or involves those pupils who do not voluntarily participate in classroom activities
0 1
...ensures that pupils listen carefully and keep on working 0 1
...waits sufficiently long to allow children to reflect after posing a question 0 1
..gives the opportunity to respond to pupils who don't put their hands up 0 1
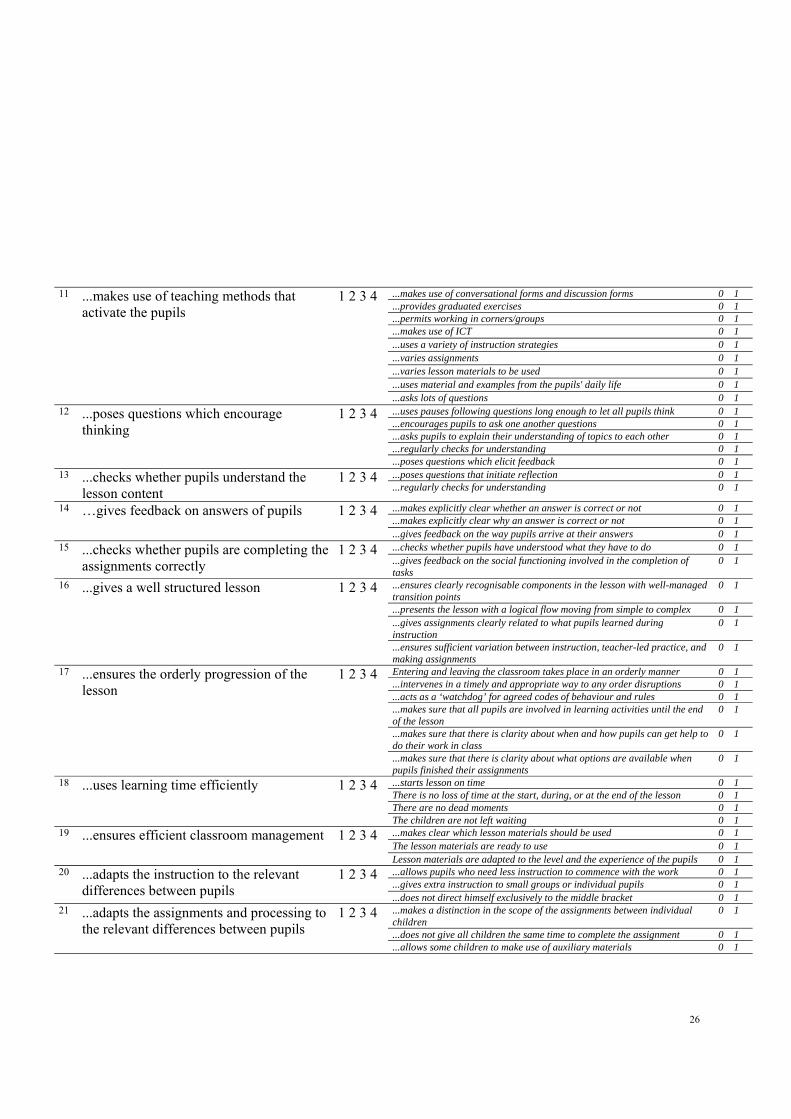
26
11 ...makes use of teaching methods that
activate the pupils 1 2 3 4 ...makes use of conversational forms and discussion forms 0 1
...provides graduated exercises 0 1
...permits working in corners/groups 0 1
...makes use of ICT 0 1
...uses a variety of instruction strategies 0 1
...varies assignments 0 1
...varies lesson materials to be used 0 1
...uses material and examples from the pupils' daily life 0 1
...asks lots of questions 0 1 12 ...poses questions which encourage
thinking 1 2 3 4 ...uses pauses following questions long enough to let all pupils think 0 1
...encourages pupils to ask one another questions 0 1
...asks pupils to explain their understanding of topics to each other 0 1
...regularly checks for understanding 0 1
...poses questions which elicit feedback 0 1 13 ...checks whether pupils understand the
lesson content 1 2 3 4 ...poses questions that initiate reflection 0 1
...regularly checks for understanding 0 1
14 …gives feedback on answers of pupils 1 2 3 4 ...makes explicitly clear whether an answer is correct or not 0 1 ...makes explicitly clear why an answer is correct or not 0 1 ...gives feedback on the way pupils arrive at their answers 0 1
15 ...checks whether pupils are completing the assignments correctly
1 2 3 4 ...checks whether pupils have understood what they have to do 0 1 ...gives feedback on the social functioning involved in the completion of tasks
0 1
16 ...gives a well structured lesson 1 2 3 4 ...ensures clearly recognisable components in the lesson with well-managed transition points
0 1
...presents the lesson with a logical flow moving from simple to complex 0 1
...gives assignments clearly related to what pupils learned during instruction
0 1
...ensures sufficient variation between instruction, teacher-led practice, and making assignments
0 1
17 ...ensures the orderly progression of the lesson
1 2 3 4 Entering and leaving the classroom takes place in an orderly manner 0 1 ...intervenes in a timely and appropriate way to any order disruptions 0 1 ...acts as a ‘watchdog’ for agreed codes of behaviour and rules 0 1 ...makes sure that all pupils are involved in learning activities until the end of the lesson
0 1
...makes sure that there is clarity about when and how pupils can get help to do their work in class
0 1
...makes sure that there is clarity about what options are available when pupils finished their assignments
0 1
18 ...uses learning time efficiently 1 2 3 4 ...starts lesson on time 0 1 There is no loss of time at the start, during, or at the end of the lesson 0 1 There are no dead moments 0 1 The children are not left waiting 0 1
19 ...ensures efficient classroom management 1 2 3 4 ...makes clear which lesson materials should be used 0 1 The lesson materials are ready to use 0 1 Lesson materials are adapted to the level and the experience of the pupils 0 1
20 ...adapts the instruction to the relevant differences between pupils
1 2 3 4 ...allows pupils who need less instruction to commence with the work 0 1 ...gives extra instruction to small groups or individual pupils 0 1 ...does not direct himself exclusively to the middle bracket 0 1
21 ...adapts the assignments and processing to the relevant differences between pupils
1 2 3 4 ...makes a distinction in the scope of the assignments between individual children
0 1
...does not give all children the same time to complete the assignment 0 1
...allows some children to make use of auxiliary materials 0 1
27
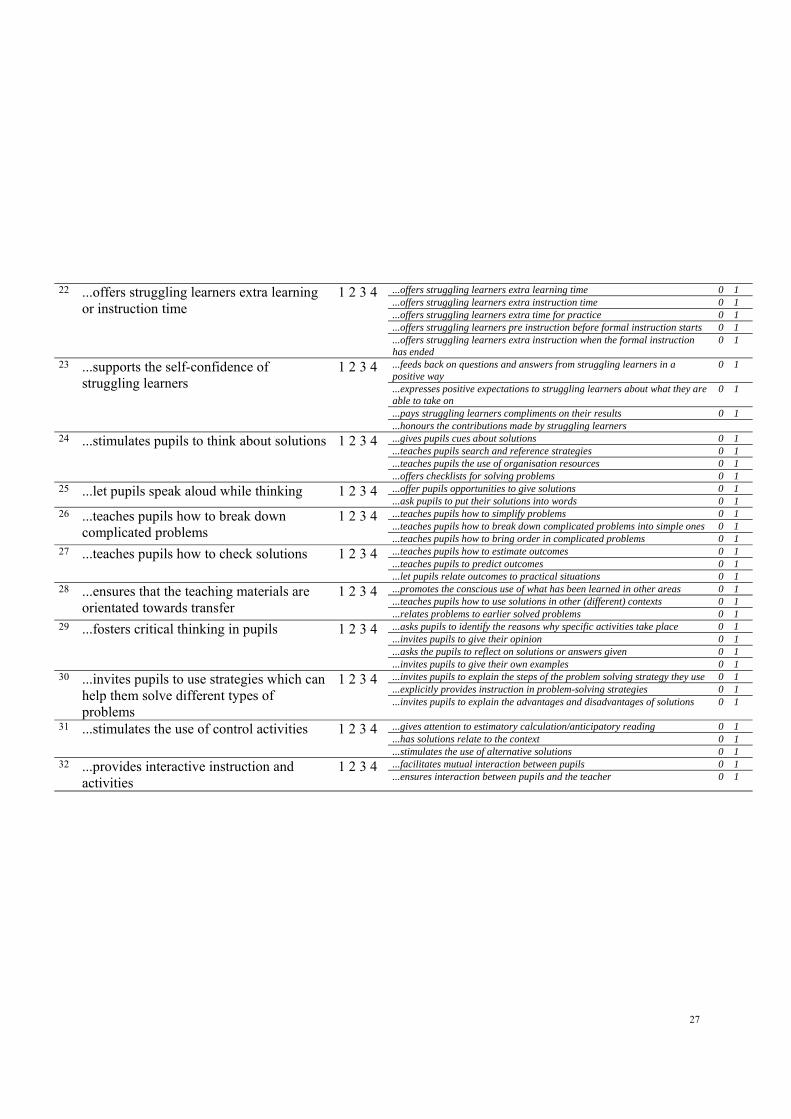
22 ...offers struggling learners extra learning
or instruction time 1 2 3 4 ...offers struggling learners extra learning time 0 1
...offers struggling learners extra instruction time 0 1
...offers struggling learners extra time for practice 0 1
...offers struggling learners pre instruction before formal instruction starts 0 1
...offers struggling learners extra instruction when the formal instruction has ended
0 1
23 ...supports the self-confidence of struggling learners
1 2 3 4 ...feeds back on questions and answers from struggling learners in a positive way
0 1
...expresses positive expectations to struggling learners about what they are able to take on
0 1
...pays struggling learners compliments on their results 0 1
...honours the contributions made by struggling learners 24 ...stimulates pupils to think about solutions 1 2 3 4 ...gives pupils cues about solutions 0 1
...teaches pupils search and reference strategies 0 1
...teaches pupils the use of organisation resources 0 1
...offers checklists for solving problems 0 1 25 ...let pupils speak aloud while thinking 1 2 3 4 ...offer pupils opportunities to give solutions 0 1
...ask pupils to put their solutions into words 0 1 26 ...teaches pupils how to break down
complicated problems 1 2 3 4 ...teaches pupils how to simplify problems 0 1
...teaches pupils how to break down complicated problems into simple ones 0 1
...teaches pupils how to bring order in complicated problems 0 1 27 ...teaches pupils how to check solutions
1 2 3 4
...teaches pupils how to estimate outcomes 0 1
...teaches pupils to predict outcomes 0 1
...let pupils relate outcomes to practical situations 0 1 28 ...ensures that the teaching materials are
orientated towards transfer 1 2 3 4 ...promotes the conscious use of what has been learned in other areas 0 1
...teaches pupils how to use solutions in other (different) contexts 0 1
...relates problems to earlier solved problems 0 1 29 ...fosters critical thinking in pupils 1 2 3 4 ...asks pupils to identify the reasons why specific activities take place 0 1
...invites pupils to give their opinion 0 1
...asks the pupils to reflect on solutions or answers given 0 1
...invites pupils to give their own examples 0 1 30 ...invites pupils to use strategies which can
help them solve different types of problems
1 2 3 4 ...invites pupils to explain the steps of the problem solving strategy they use 0 1 ...explicitly provides instruction in problem-solving strategies 0 1 ...invites pupils to explain the advantages and disadvantages of solutions 0 1
31 ...stimulates the use of control activities 1 2 3 4 ...gives attention to estimatory calculation/anticipatory reading 0 1 ...has solutions relate to the context 0 1 ...stimulates the use of alternative solutions 0 1
32 ...provides interactive instruction and activities
1 2 3 4 ...facilitates mutual interaction between pupils 0 1 ...ensures interaction between pupils and the teacher 0 1

28
About the authors
Wim van de Grift is professor of education and head of the institute of teacher education, University of Groningen, Landleven 1, 9747 AD Groningen, [email protected] Marieke van der Wal is teacher trainer in the school subject Social Science and researcher at the institute of teacher education, University of Groningen, Landleven 1, 9747 AD Groningen, [email protected].
29
Tabellen
Tabel 1 Domeinmatrijs
Aantal indicatoren Domein Hoog inferent Laag inferent Het creëren van een veilig en stimulerend onderwijsleerklimaat 4 15 De les is efficiënt georganiseerd 5 20 Duidelijke en gestructureerde instructie 6 23 De les is intensief en activeert de leerlingen 7 29 Afstemmen van instructie en verwerking op verschillen 4 12 Leerlingen leerstrategieën aanleren 6 19 32 118
30
Tabel 2 Hoog en laaginferente indicatoren Domein Hooginferente
indicatoren Laaginferente indicatoren
De leraar… De leraar… Het creëren van een veilig en stimu-lerend onderwijs- leerkli-maat
toont in gedrag en taalgebruik respect voor leerlingen
1 2 3 4 laat leerlingen uitspreken 0 1 luistert naar wat leerlingen te zeggen hebben 0 1 maakt geen rolbevestigende opmerkingen 0 1
zorgt voor een ontspannen sfeer
1 2 3 4 spreekt de leerlingen op een positieve manier aan 0 1 reageert met humor en stimuleert humor 0 1 accepteert dat leerlingen fouten maken 0 1 straalt warmte en empathie uit naar alle leerlingen in de klas 0 1
ondersteunt het zelfvertrouwen van leerlingen
1 2 3 4 koppelt op een positieve manier terug op vragen en opmerkingen van leerlingen
0 1
geeft leerlingen complimenten over hun werk 0 1 honoreert de bijdragen van leerlingen 0 1
zorgt voor wederzijds respect
1 2 3 4 stimuleert leerlingen naar elkaar te luisteren 0 1 treedt op wanneer er om leerlingen wordt gelachen 0 1 houdt rekening met (culturele) verschillen en eigenaardigheden 0 1 bevordert de onderlinge solidariteit onder leerlingen 0 1 bevordert dat leerlingen activiteiten als groepsgebeurtenis ervaren 0 1
31
Tabel 3 Klassieke test gegevens Aantal items 32 24 Aantal respondenten 1319 1319 Gemiddelde van de ruwe scores 23,25 18,20 Variantie van de ruwe scores 56,27 29,76 KR-20 ,93 ,91
32
Tabel 4 Calibratie van 32 items itemparameters itemparameters hoog en laag scoorders ruwe score 1- 20 ruwe score 21-31 T De leraar … P σi s.e. σi s.e. σi s.e .. vraagt leerlingen na te denken over oplossingsstrategieën
,50 1,74 ,09 2,16 ,21 1,71 ,10 1,94
.. moedigt kritisch denken van leerlingen aan ,50 1,71 ,09 2,03 ,20 1,70 ,10 1,48
.. stemt de verwerking van leerstof af op verschillen tussen leerlingen
,53 1,53 ,09 1,37 ,16 1,67 ,10 -1,61
.. bevordert het toepassen van het geleerde ,54 1,44 ,09 ,95 ,15 1,72 ,10 -4,32
.. stimuleert het gebruik van controle activiteiten ,55 1,38 ,09 1,29 ,16 1,49 ,10 -1,07
.. stemt instructie af op verschillen tussen leerlingen
,56 1,33 ,.09 1,08 ,15 1,51 ,10 -2,37
.. biedt zwakke leerlingen extra leer- of instructietijd
,56 1,32 ,09 1,06 ,15 1,51 ,10 -2,50
.. gaat na of de lesdoelen werden bereikt ,56 1,31 ,09 ,70 ,14 1,68 ,10 -5,71
.. leert leerlingen oplossingen te checken ,56 1,30 ,09 ,89 ,14 1,56 ,10 -3,80
.. verduidelijkt bij de aanvang van de les de lesdoelen
,59 1,13 ,09 ,48 ,13 1,55 ,10 -6,32
.. leert leerlingen hoe zij complexe problemen kunnen vereenvoudigen
,62 ,97 ,09 1,13 ,15 ,95 ,11 ,92
.. zorgt voor interactieve instructie- en werkvormen
,64 ,83 ,09 ,83 ,14 ,90 ,11 -,39
.. laat leerlingen hardop denken ,68 ,53 ,09 ,52 ,13 ,61 ,12 -,50
.. stelt vragen die leerlingen tot denken aanzetten ,69 ,45 ,09 ,89 ,14 ,10 ,14 3,92
.. leert leerlingen oplossingen te checken ,71 ,33 ,09 ,81 ,14 -,11 ,15 4,45
.. hanteert werkvormen die leerlingen activeren ,71 ,32 ,09 ,48 ,13 ,24 ,14 1,28
.. stimuleert het zelfvertrouwen van zwakke leerlingen
,71 ,29 ,09 ,28 ,13 ,38 ,13 -,54
.. gebruikt de leertijd efficiënt ,80 -,42 ,10 -,26 ,13 -,66 ,19 1,74
.. geeft duidelijke uitleg bij didactische hulpmiddelen en opdracht
,82 -,57 ,11 -,44 ,13 -,77 ,20 1,41
.. gaat tijdens de instructie na of leerlingen de leerstof hebben begrepen
,82 -,59 ,11 -,47 ,13 -,77 ,20 1,27
.. geeft goed gestructureerd les ,83 -,71 ,11 -,49 ,13 -1,20 ,24 2,64
.. geeft feedback aan de leerlingen ,84 -,74 ,11 -,85 ,13 -,46 ,17 -1,77
.. betrekt de leerlingen bij de les ,84 -,79 ,11 -,66 ,13 -1,04 ,22 1,49
.. bevordert dat leerlingen hun best doen ,86 -,98 ,11 -,95 ,14 -,94 ,21 -,04
.. zorgt voor een doelmatig klassemanagement ,86 -1,00 ,12 -,95 ,14 -1,04 ,22 ,33
.. geeft duidelijke uitleg van leerstof en opdrachten ,87 -1,14 ,12 -1,05 ,14 -1,33 ,25 ,98
.. gaat tijdens de verwerking na of leerlingen opdrachten goed uitvoeren
,88 -1,29 ,12 -1,36 ,15 -,99 ,22 -1,43
.. zorgt voor wederzijds respect ,90 -1,56 ,13 -1,45 ,15 -1,92 ,33 1,31
.. ondersteunt het zelfvertrouwen van leerlingen ,90 -1,58 ,13 -1,51 ,15 -1,71 ,30 ,60
.. zorgt voor een ordelijk verloop van de les ,93 -2,06 ,15 -2,10 ,17 -1,18 ,31 -,81
.. zorgt voor een ontspannen sfeer ,93 -2,11 ,15 -2,10 ,17 -2,04 ,35 -,16
.. toont in gedrag en taalgebruik respect voor leerlingen
,94 -2,37 ,17 -2,32 ,18 -2,51 ,43 ,41
Andersentoets hoog- en laagscoorders
χ231= 8,12 p= ,000
Martin Loftoets χ2930 =1304,17 p= ,000

[email protected] BaoRasch 18-11-2010 33
Tabel 5 Calibratie van 24 items internationale
steekproef itemvolgorde per land
nr domein De leraar… P σi s.e. Vl Ns Nl Sl Kr Sc 24 leerstrategie vraagt leerlingen na te denken
over oplossingsstrategieën ,50 2,07 ,09 21 24 24 22 22 23
23 leerstrategie moedigt kritisch denken van leerlingen aan
,50 2,06 ,09 22 19 23 20 24 19
22 afstemmen stemt verwerking van leerstof af op verschillen tussen leerlingen
,53 1,87 ,09 24 22 18 24 23 17
21 afstemmen stemt instructie af op verschillen tussen leerlingen
,56 1,65 ,09 23 23 21 23 20 24
20 afstemmen biedt zwakke leerlingen extra leer- of instructietijd
,56 1,65 ,09 20 20 22 21 15 18
19 leerstrategie leert leerlingen hoe zij complexe problemen kunnen vereenvoudigen
,62 1,27 ,09 19 17 20 15 19 20
18 activeren zorgt voor interactieve instructie- en werkvormen
,64 1,13 ,09 18 21 19 19 21 16
17 activeren laat leerlingen hardop denken ,68 ,82 ,09 16 18 17 16 16 11 16 activeren hanteert werkvormen die
leerlingen activeren ,71 ,60 ,09 17 15 16 14 13 22
15 afstemmen stimuleert het zelfvertrouwen van zwakke leerlingen
,71 ,57 ,09 15 9 11 17 5 21
14 organisatie gebruikt de leertijd efficiënt ,80 -,16 ,09 13 16 13 18 18 15 13 instructie geeft duidelijke uitleg van het
gebruik van didactische hulpmiddelen en opdrachten
,82 -,31 ,10 12 14 12 12 17 14
12 instructie gaat tijdens de instructie na of leerlingen de leerstof hebben begrepen
,82 -,33 ,11 10 8 15 9 6 12
11 instructie geeft feedback aan de leerlingen ,84 -,49 ,11 11 10 10 13 3 10 10 organisatie betrekt alle leerlingen bij de les ,84 -,53 ,11 14 13 7 10 12 9
9 instructie bevordert dat leerlingen hun best doen
,86 -,72 ,11 8 7 6 7 4 6
8 organisatie zorgt voor een doelmatig klasmanagement
,86 -,75 ,12 7 12 8 5 1 8
7 instructie geeft duidelijke uitleg van leerstof en opdrachten
,87 -,89 ,12 6 11 14 8 11 5
6 organisatie gaat tijdens de verwerking na of leerlingen de opdrachten op een juiste manier uitvoeren
,88 -1,04 ,12 9 4 9 11 7 4
5 klimaat zorgt voor wederzijds respect ,90 -1,32 ,12 4 5 4 6 2 1 4 klimaat ondersteunt het zelfvertrouwen
van leerlingen ,90 -1,33 ,13 2 6 3 4 10 13
3 organisatie zorgt voor een ordelijk verloop van de les
,93 -1,82 ,15 5 3 2 3 9 3
2 klimaat zorgt voor een ontspannen sfeer ,93 -1,87 ,15 3 2 5 1 8 7 1 klimaat toont in gedrag en taalgebruik
respect voor leerlingen ,94 -2,14 ,17 1 1 1 2 14 2
P P P P P P P Andersentoets hoog- en laagscoorders χ2
23= 23,56 ,429 ,089 ,993 ,030 ,008 ,006 ,561 Martin Löftoets χ2
506= 602,76 ,002 ,580 ,886 ,224 ,668 ,668 ,667

[email protected] BaoRasch 18-11-2010 34
Tabel 6 Unidimensionaliteit χ2 Degrees of freedom P
Sekse 22,71 23 ,478 Ervaring 32,22 23 ,096 Land 680,26 115 ,000
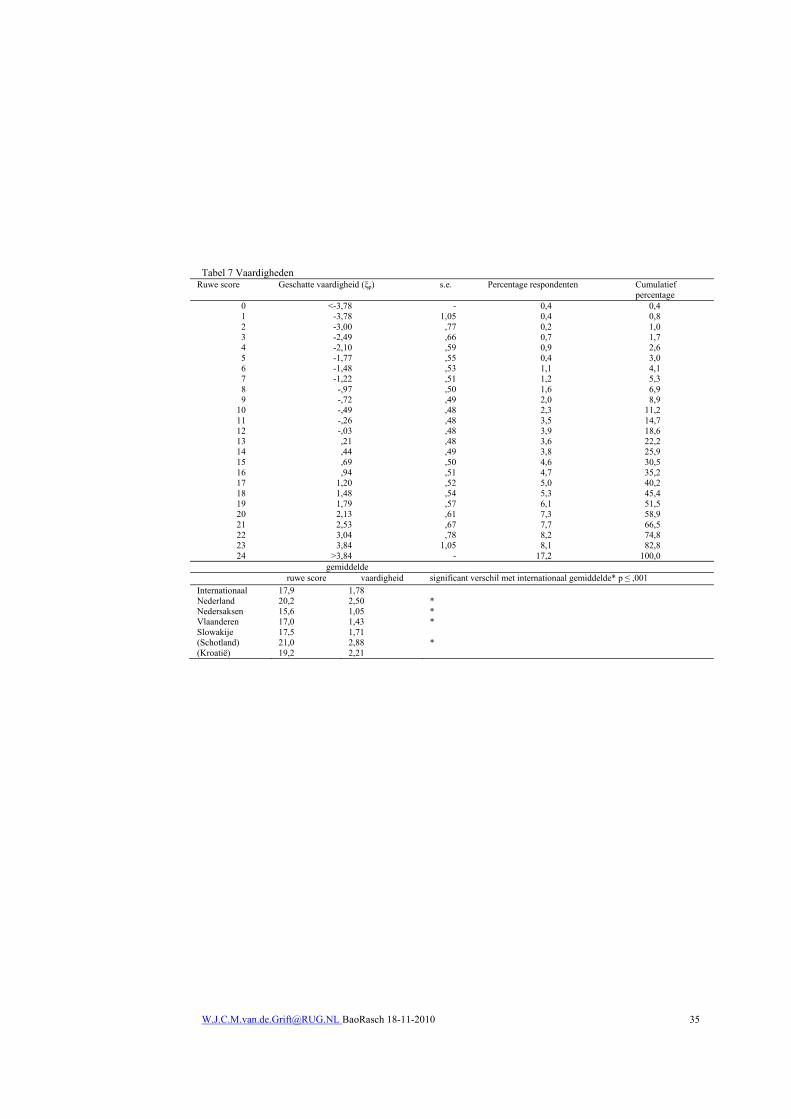
[email protected] BaoRasch 18-11-2010 35
Tabel 7 Vaardigheden Ruwe score Geschatte vaardigheid (ξp) s.e. Percentage respondenten Cumulatief
percentage 0 <-3,78 - 0,4 0,4 1 -3,78 1,05 0,4 0,8 2 -3,00 ,77 0,2 1,0 3 -2,49 ,66 0,7 1,7 4 -2,10 ,59 0,9 2,6 5 -1,77 ,55 0,4 3,0 6 -1,48 ,53 1,1 4,1 7 -1,22 ,51 1,2 5,3 8 -,97 ,50 1,6 6,9 9 -,72 ,49 2,0 8,9
10 -,49 ,48 2,3 11,2 11 -,26 ,48 3,5 14,7 12 -,03 ,48 3,9 18,6 13 ,21 ,48 3,6 22,2 14 ,44 ,49 3,8 25,9 15 ,69 ,50 4,6 30,5 16 ,94 ,51 4,7 35,2 17 1,20 ,52 5,0 40,2 18 1,48 ,54 5,3 45,4 19 1,79 ,57 6,1 51,5 20 2,13 ,61 7,3 58,9 21 2,53 ,67 7,7 66,5 22 3,04 ,78 8,2 74,8 23 3,84 1,05 8,1 82,8 24 >3,84 - 17,2 100,0
gemiddelde ruwe score vaardigheid significant verschil met internationaal gemiddelde* p ≤ ,001
Internationaal 17,9 1,78 Nederland 20,2 2,50 * Nedersaksen 15,6 1,05 * Vlaanderen 17,0 1,43 * Slowakije 17,5 1,71 (Schotland) 21,0 2,88 * (Kroatië) 19,2 2,21
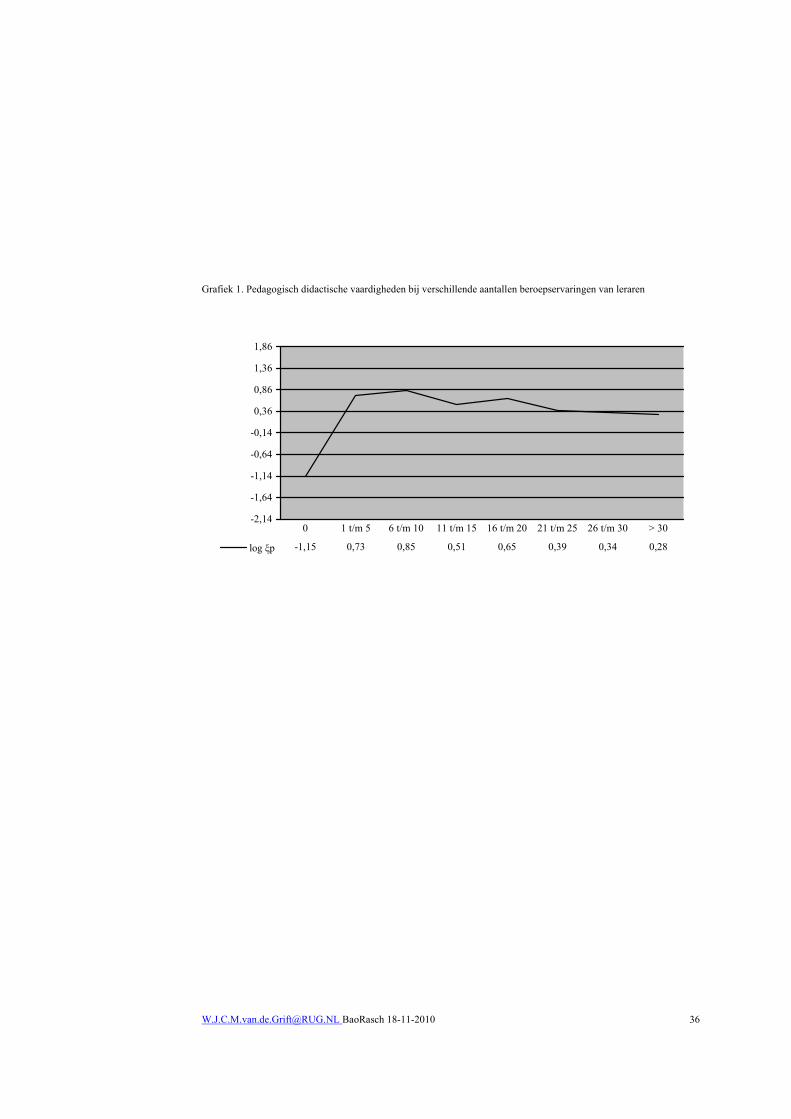
[email protected] BaoRasch 18-11-2010 36
Grafiek 1. Pedagogisch didactische vaardigheden bij verschillende aantallen beroepservaringen van leraren
-2,14
-1,64
-1,14
-0,64
-0,14
0,36
0,86
1,36
1,86
log ξp -1,15 0,73 0,85 0,51 0,65 0,39 0,34 0,28
0 1 t/m 5 6 t/m 10 11 t/m 15 16 t/m 20 21 t/m 25 26 t/m 30 > 30