Embed Size (px)
Citation preview

Measuring the Cost of Low Measuring the Cost of Low Quality Data with The Quality Data with The ValueTreeValueTree™™
Presented byAlden B. Davis
MyValueTree.comAvon, CT
1-860-748-3780

Agenda
Purpose: • Introduce The ValueTree™ as a possible tool for measuring the cost of poor
data quality• Connect our data quality to business financials• Create the insight required to determine if this approach addresses your
requirements
Products:1. Know The ValueTree™
2. Common perspective on data quality and its impact3. Possibility: measuring the cost of poor quality data and contributing to
increases in the business’ value

AD’s Beliefs
• The financial performance of a business is the resultant of organizational assumptions, processes, systems and structure.
• Most people cannot connect their daily activities and decisions to an income statement and balance sheet.
• “Value” means how much something is worth, and we are either building or destroying institutional value every day through our actions.
• People have trouble visualizing their material flow in businesses that flow data as the product.
• Facilities and Maintenance Departments are to manufacturing what IT is to banking; IT puts in all the business infrastructure and maintains it.
• Lean, 6-s , BPM, CI in the hands of a skilled person directly drives improvement in value; it destroys value in the hands of a charlatan.
• The topic of data quality and process control is increasing in visibility and importance within the banking community; the company’s “data paradigm” is being challenged.

What is the Value Tree?
Financial model of the business on one page– Visually oriented– Interactive– Easily understood by people
Financial tool for developing business context– Interrelationships of various dollar flows– Drivers of business decisions
Financial “range-finder”– Target identification– Target selection
Financial-world de-mystifier Financial guidepost helping answer the essence
question...“Is the institution increasing its value (how much its worth) or destroying its value?”

Stock PriceReturn On Invested Capital
-50%
0%
50%
100%
150%
200%
Q1 95 Q2 95 Q3 95 Q4 95 Q1 96 Q2 96 Q3 96 Q4 96 Q1 97 Q2 97 Q3 97 Q4 97
Ret
urn
on C
apita
l (%
) Dell
Gateway
200
400
600
800
1,000
1,200
1,400
1,600
1,800
2,000
Q1 95 Q2 95 Q3 95 Q4 95 Q1 96 Q2 96 Q3 96 Q4 96 Q1 97 Q2 97 Q3 97 Q4 97
Dell
Gateway
What determines a firm’s worth?
The same relationship seems to exist at Dell and Gateway; strong ROIC, strong stock price.
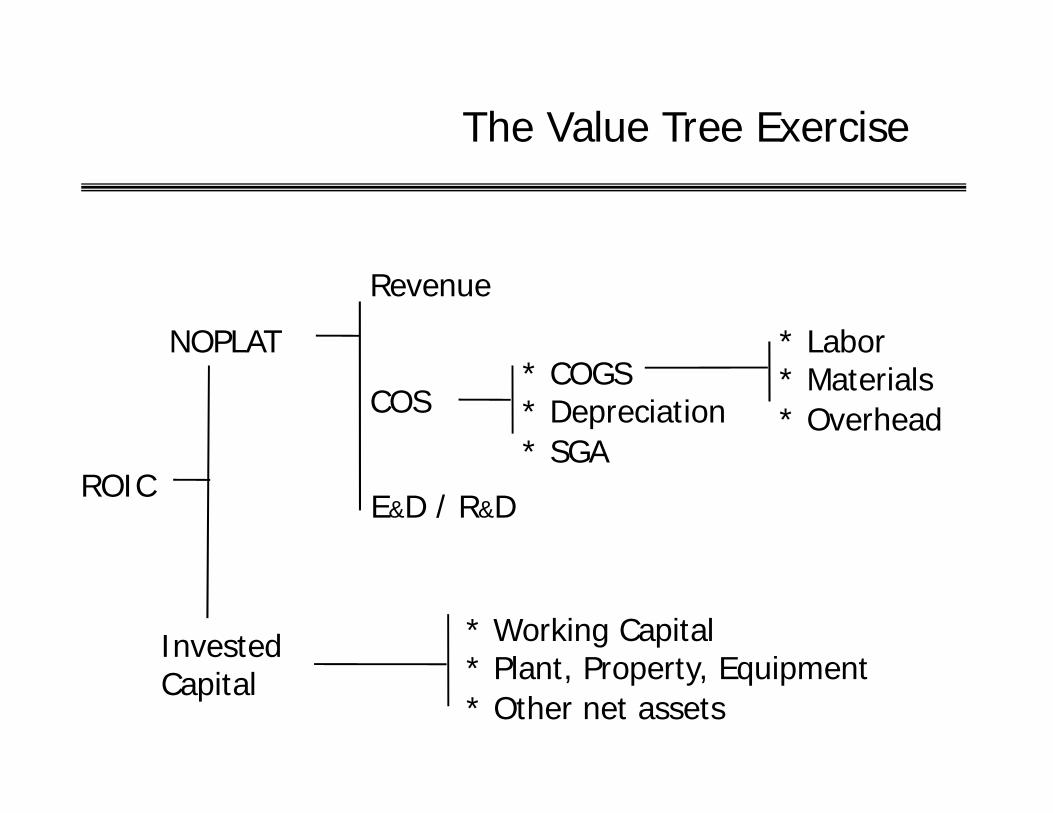
The Value Tree Exercise
* Working Capital* Plant, Property, Equipment* Other net assets
ROIC
NOPLAT
InvestedCapital
* Labor* Materials* Overhead
* COGS* Depreciation* SGA
Revenue
COS
E&D / R&D

input
System Paradigming
Units invoicedUnits invoicedUnits invoiced Customer Generation
$ sold FlowTaktCycle Time S.M.E.D.
%-Load Chart Walking DistanceConverting Indirect to Direct Visual Control
Direct Hourly 10 People Work Design/Std. Work Maintaining a Healthy WorkforceIndirect hourly 1 People Explorations of I.R.Direct Salary 0 People B.P.M.Indirect salary 2 PeoplePayroll added costs 1.4 rate
(benefits, EDU asst.) Wkr. Comp. Std. WorkWorkers Comp 10000 reserved Risk AssessmentContract Employees 1 People Free-Markets
PartnerUnits Invoiceable 50 units Supply Chain Mgmt. Leverage
L.T.A.
Set -up 100 hours S.M.E.D.Shop Consumables 20 pcs 5-SMaintenance/ Repair 1 hrs T.P.M.Office Supplies 0 $Utilities 10000 kilo-hrsWater 10000 gals Waste-Chain-Mgmt., Visual Mgmt., Process DefinitionFuel 500 galsDurable Tooling pcsOvertime Premium 50 hrs %-Load ChartNon Product Material $ Cellular FlowWarehousing 5000 sqft KanbanServices 1500 $ P.O.U. Poke-YokeTaxes/Insurance 8000 $ Process Cert.Scrap 10000 $ SPCTravel 6000 $ QCPCMeetings & Confer. 5000 $ 5-Why'sTele/communication 2000 $Rent /leases 5000 sqft Red Tag, KanbanConsultants 15000 total $Soft ware 500 $ Poke-YokeAllocations 50000 Sq.ft. or ? Process Cert.Rework-Repeat 500 hrs SPCEH&S: Supplies 1000 $ QCPC Waste removal 5000 $ 5-Why's Permits 2500 $ EHS Kaizen, Risk Assessment Fines 0 $Computer 3000 $Factory 175000 $Office 0 $
Value-Tree Roots
Defining the futureProduct Commercialization CycleOrder-to-Cash Sales Force Automation

The Value Tree Exercise
* Working Capital* Plant, Property, Equipment* Other net assets
ROIC
NOPLAT
InvestedCapital
* Labor* Materials* Overhead
* COGS* Depreciation* SGA
Revenue
COS
E&D / R&D

Benchmark Only Against World Class!
Copyright, 2006, Ransom Research, Inc.

Thoughts from Citi
• Operational Risk*– Risk of loss resulting from inadequate or failed internal processes, systems,
human factors or external events• Reputation risk• Franchise risk
– Operational Risk Management Process• Identify and assess key operational risks• Establish key risk indicators• Produce a comprehensive operational risk report• Prioritize and assure adequate resources to actively improve the operational risk
environment and mitigate emerging risks
– 140 countries and 50% revenue from outside U.S.– “We are a bank…accept deposits, commit capital, lend, transact for customers
and live up to the highest standards of trust and integrity.”
* Excerpts from 2009 Annual Report

Thoughts continued
• Core business– Global transaction services– Securities and banking– Regional consumer banking
• Global reach draws 95% of Fortune 500 and 85% of global Fortune 1000
• Aspirations:– “A client of Citi anywhere is a client of Citi everywhere”– Be the digital bank of the future
• 200 million accounts at 140 locations globally and 265,300 full time people– ISO20022 (formally 15022) upcoming financial data model standard
• Cost pressures, increased transaction volumes, Sarbox and BaselII

Calibrating the Situation
• 4 Pillars of Risk• Aspects of Data Quality• Data Scenarios• Data Quality Root Causes• Reporting: data flows• Data Impacts• Data and Marketing

Man
aged
Ope
ratio
nal R
isk
Con
sist
ently
def
ined
ris
k
Pro
cess
Ana
lysi
s
Foc
used
Res
pons
ibili
ty
“Four pillars of risk-related cost improvement”Barent W. Wemple, “Bankers Magazine”

Aspects of Data Quality
Accuracycorrect depiction of reality
Auditabilitydata is linked to originating event
Timelinessexpectation of linkage between event and reflection in the data
Completenessrecorddatabase
Consistencymultiple databases showing the same reality
* www.executionmih.com/data-quality/accuracy-consistency-audit.php

Data Scenarios
Timeliness Data Type Data Class Data Need
Real time Batch process Financial Non-
financial Transaction Analytic Historical Immediate Use
High Priority ü ü ü üTolerant ü ü ü ü
KYC ü ü ü ü

Data Quality Root Causes
1. Expansion into new markets2. Merger/acquisition3. Urgent reporting requirements requiring work-arounds4. Home grown databases5. Multiple versions of databases running on different platforms6. Application evolution7. System workarounds, using alternative fields for data entry, ie “comments”
8. Legacy systems9. Fast tracking process re-engineering changes10. Time decay of data11. Lack of data standards/data warehouse/meta data12. Careless data entry13. No business data ownership for quality
* www.executionmih.com/data-quality/accuracy-consistency-audit.php
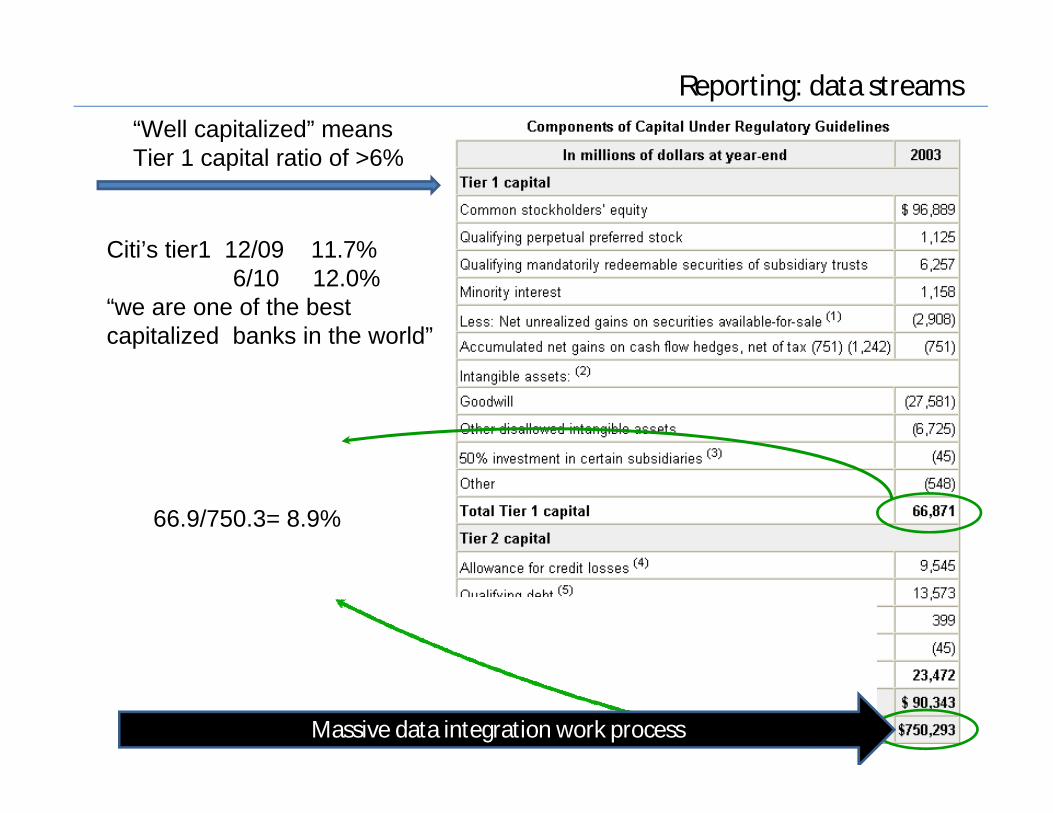
Reporting: data streams“Well capitalized” meansTier 1 capital ratio of >6%
66.9/750.3= 8.9%
Citi’s tier1 12/09 11.7%6/10 12.0%
“we are one of the best capitalized banks in the world”
Massive data integration work process

Data Impacts
• Asset liability management • Liquidity management and contingency funding planning • Financial institution analysis used to prepare for CAMELS ratings [Capital
adequacy, Asset quality, Management, Earnings, Liquidity, Sensitivity to market risk] from regulatory oversight bodies like the Federal Reserve (the Fed), the Office of the Comptroller of the Currency (OTC), and the Federal Deposit Insurance Corporation (FDIC)
• Exploding data volumes, data complexity, questionable quality, and its many sources drive complexity in accessing, transforming, cleansing and integrating data from mainframe, midrange, tape, cloud computing, and third-party service providers and trading partners.
• Multiple data formats must be managed—structured, semistructured, and unstructured datatypes, such as SWIFT, NACHA, IFX, FpML, and FxML. Standards like MISMO can be very costly and difficult to manage when changes are occurring all the time.
• Ensuring data quality is necessary to comply with a variety of regulations. CAMELS, for example, emphasizes the completeness, conformity, consistency, accuracy, and deduplication history of data that goes into reporting. As a result, data lineage and reliable audit trails are necessary.

Data Impacts
• Calculating total capital required to cover losses from risk such as credit or market depends on the statistical approach as well as data accuracy
• Unreconciled trades in fx operations age into accounting errors and can eventually create charges against earnings
• Dependent on data– Risk management
• Capital reserves– Under or over estimated
– Compliance• Reporting
– Customer relationship management• Targeting services
– Marketing• Sales

Data ImpactsS
take
hold
er p
erce
ptio
n
Business Performance
Poor
Contractioncycle
Strong
Negative
PositiveGrowthcycle
QuestionableLong-term
viability
QuestionableLong-term
viability
BoardsEmployees and contractorsCustomersShareholders Investment communityGovernmentsRegulatorsSuppliersMediaUnionsNon-government organizationsIndustry groups and associationsLocal / regional communities

PoorQualityData
PoorlyManagedRisk
Credit
Interest rates
Sovereignty
Fx
Hazards
Operational risk
“Reducing the likelihood of undesirable outcomes.”

Data and Marketing
• Informatica creates quality index at Banco Popular– 23 data variables
• Name, date of birth, education level, occupational code, transaction information
– Data classified• Mandatory
– Compliance
• Necessary– Business requirements
• Ideal– Marketing
» PFM: personal financial management to see the spending habits of customers
customers16 new
Contactable16,500
Correct Phone32,000
Initial List45,000
Vs.Transactions with
high accuracyrates

Research Shows*
A study of more than 1,700 banks from 63 countries, conducted by AIM Software and Vienna University, sponsored by Reuters shows the following:
• 1 out of 10 institutions employ more than 50 people for reference data
• 54% regard workflow management as a major data management objective
• 52% regard event reporting as a major data management objective
• “financial institutions realize that they are facing serious operational risk and huge potential losses in this area.”
* www.dmstudy.info/2005

Bad Data Quality Impact*
1. Bad data quality leads to Internal Operational Inefficiencies1. Turnbacks and escapes i.e. stop payment on faulty checks, recalled credit
cards on wrong addresses2. Customer Retention impacts
1. Wrong billing or statement leading to loss of confidence and trust2. Customer complaints leading to attrition
3. Customer acquisition impacts1. Undelivered mail leading to failed mailer campaigns2. Mailed products returned due to errors in names3. Dissatisfied sales and distribution people from incorrect compensation
4. Operational effectiveness1. Tracking status of delivered products2. Errors in delivered products
5. Reputation impacts1. Media exposure from loss of confidential information2. Major product recall
* www.executionmih.com/data-quality/accuracy-consistency-audit.php

Bad Data Quality Impact
6. Shareholder impacts1. Faulty financial statements and low audit ratings could lead to loss of
confidence by the investing community7. Regulatory impact
1. Faulty submissions leading to legal exposure2. Lawsuits by shareholders or customers
8. Decision impact1. Quality of decision depends on quality of data. Bad data leads to
misinformed or under-informed decisions9. Business management impact
1. Lack of data, or inaccurate data on key performance indicators misguides performance management

ROIC
* Working Capital
* Plant, Property, Equipment
* Other net assets
InvestedCapital
NOPLAT
Revenue
COS
* COGS
* Depreciation
* SGA
* Materials
* Overhead
* Labor
Business management impact
Operational effectiveness
Customer Retention impacts
Customer acquisition impacts
Regulatory impact
Reputation impacts
Decision impact
Operational Efficiency Impact: analysis, investigation, corrective action, IT fixes, continued monitoring
Shareholder impacts
for Targeting Bad Data Quality
Accrual
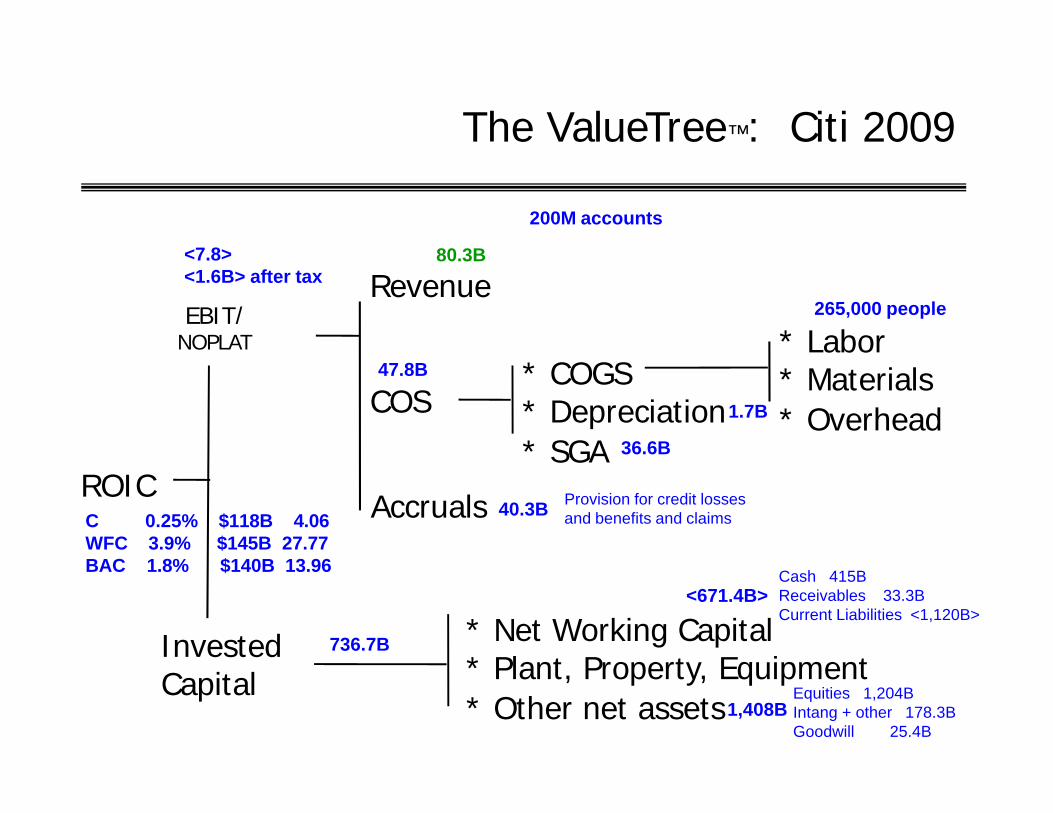
The ValueTree™: Citi 2009
* Net Working Capital* Plant, Property, Equipment* Other net assets
ROIC
EBIT/NOPLAT
InvestedCapital
* Labor* Materials* Overhead
* COGS* Depreciation* SGA
Revenue
COS
Accruals
<7.8><1.6B> after tax
80.3B
C 0.25% $118B 4.06WFC 3.9% $145B 27.77BAC 1.8% $140B 13.96
736.7B
1.7B
36.6B
<671.4B>
1,408B
Cash 415BReceivables 33.3BCurrent Liabilities <1,120B>
Equities 1,204BIntang + other 178.3BGoodwill 25.4B
47.8B
40.3B
265,000 people
200M accounts
Provision for credit lossesand benefits and claims