Embed Size (px)
Citation preview
Measuring Technical Efficiency in the Canadian P&C Insurance Industry
Using DEAGilles Bernier, Ph.D., Industrial-
Alliance Insurance Chair, Laval University, Quebec City
Komlan Sedzro, Ph.D., University of Quebec at Montréal
WRIA Meeting, Las Vegas, January 4, 2004.
Outline of Presentation
• Introduction• Purpose• Literature Review: Efficiency Measurement Concepts• Efficiency in Canadian P&C Insurance: Prior Studies• Estimating Efficiency with DEA: A basic example • Data• Measures of Outputs/Inputs and their Prices• Results• Implications of Results• Limitations of Study
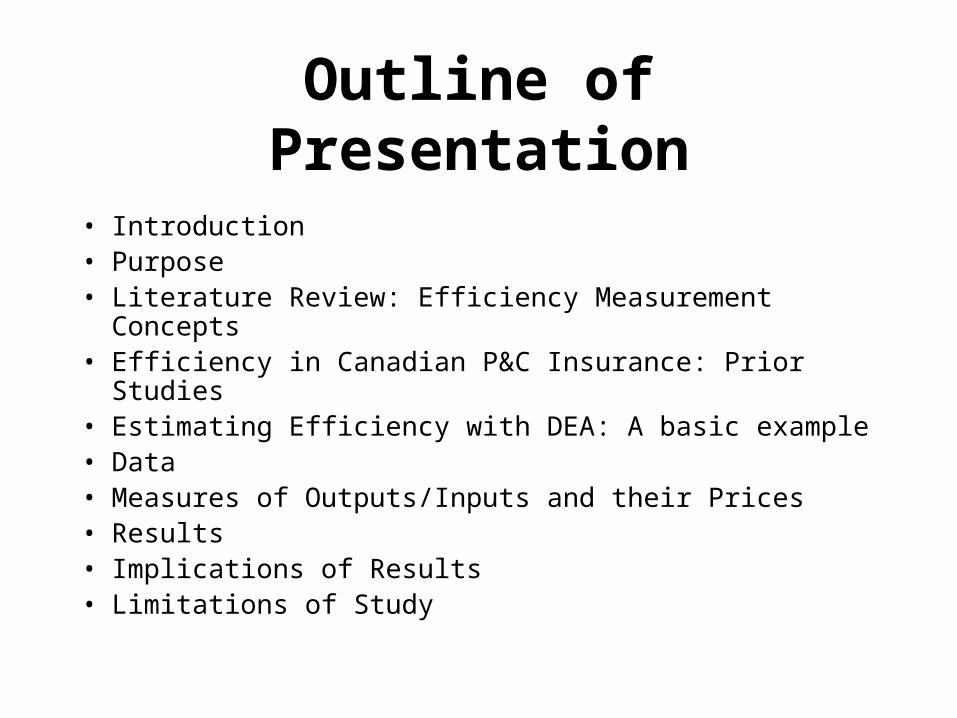
Introduction The Canadian P/C Market
• 2.53% of the world market (7th)• Currently, 198 companies are monitored for financial
soundness by OSFI (93 Canadian, 105 Foreign).• P/C is a less concentrated market than L/H:
– Specific regional markets or specific product lines.• Top 5 MS in 2001: 34% (CGU Group Canada, ING
Canada, Co-operators Group, Royal & Sun Alliance, Economical Ins.Group)
• Broker Co’s still have a dominant MS of 67% in 2001 (24% for Direct Writers and 9% for Reinsurers only)

Purpose
• Our goal is to rely on frontier methodologies to measure firm performance relative to “best practice” frontiers derived from firms operating in the Canadian P&C industry (benchmarking).
• Using the technique called DEA to estimate cost efficiency frontiers, we hope to be able to answer to the following research questions:– Are P&C Insurers Operating in Canada Technically
Efficient? – What can be said about the degree of « Scale
Economies » in the Canadian P&C Industry?
Literature Review Efficiency Measurement
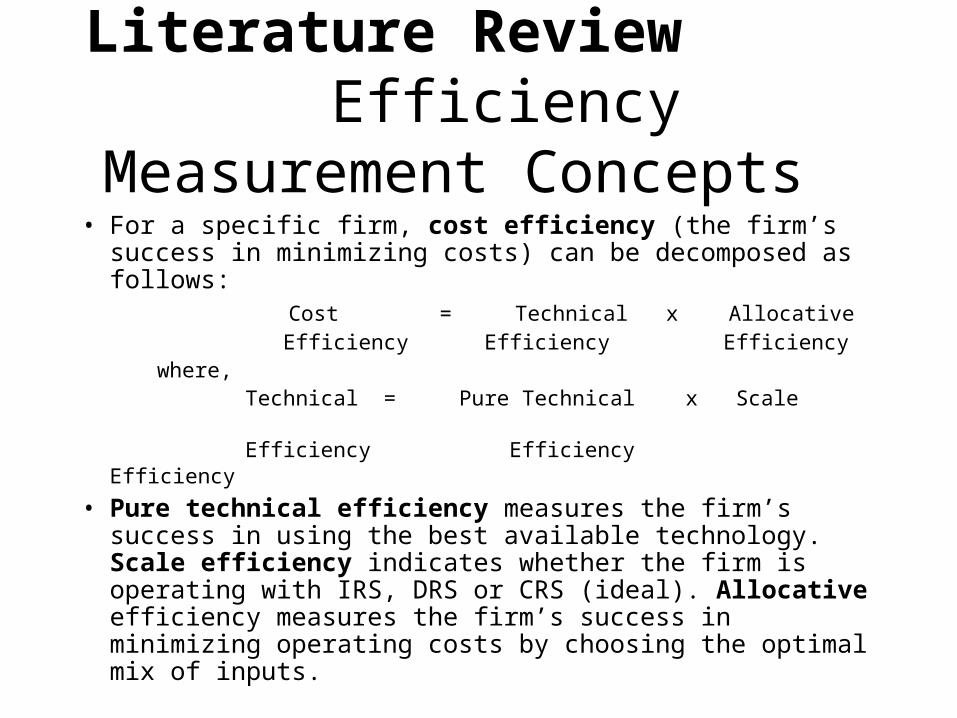
Concepts • For a specific firm, cost efficiency (the firm’s success in
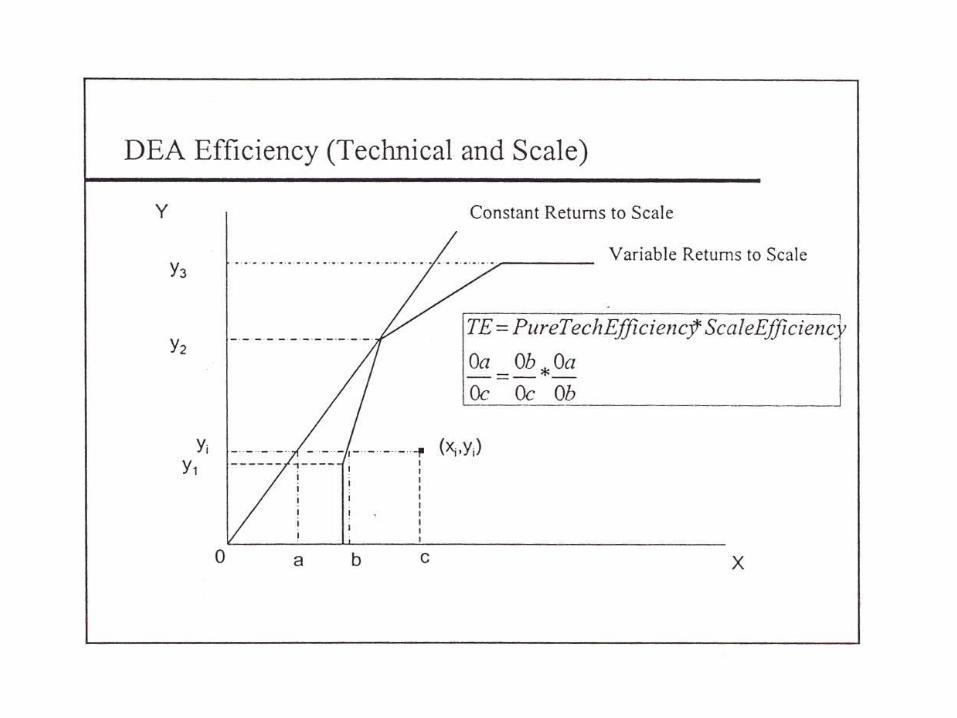
minimizing costs) can be decomposed as follows: Cost = Technical x Allocative Efficiency Efficiency Efficiency where, Technical = Pure Technical x Scale
Efficiency Efficiency Efficiency • Pure technical efficiency measures the firm’s success in
using the best available technology. Scale efficiency indicates whether the firm is operating with IRS, DRS or CRS (ideal). Allocative efficiency measures the firm’s success in minimizing operating costs by choosing the optimal mix of inputs.
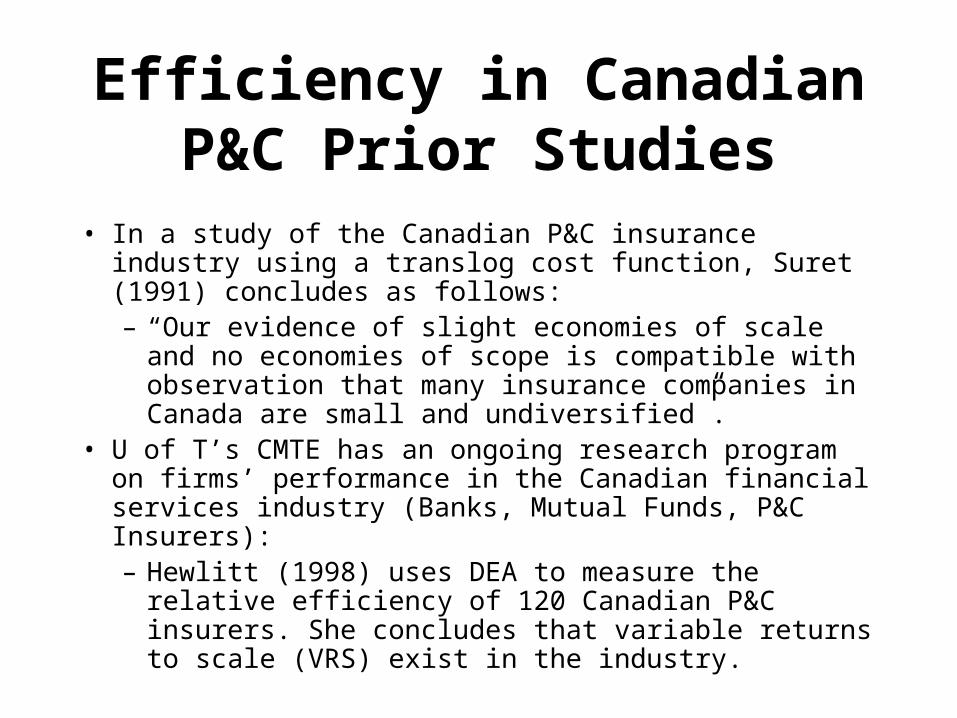
Efficiency in Canadian P&C Prior Studies
• In a study of the Canadian P&C insurance industry using a translog cost function, Suret (1991) concludes as follows: – “Our evidence of slight economies of scale and no
economies of scope is compatible with observation that many insurance companies in Canada are small and undiversified”.
• U of T’s CMTE has an ongoing research program on firms’ performance in the Canadian financial services industry (Banks, Mutual Funds, P&C Insurers):– Hewlitt (1998) uses DEA to measure the relative
efficiency of 120 Canadian P&C insurers. She concludes that variable returns to scale (VRS) exist in the industry.
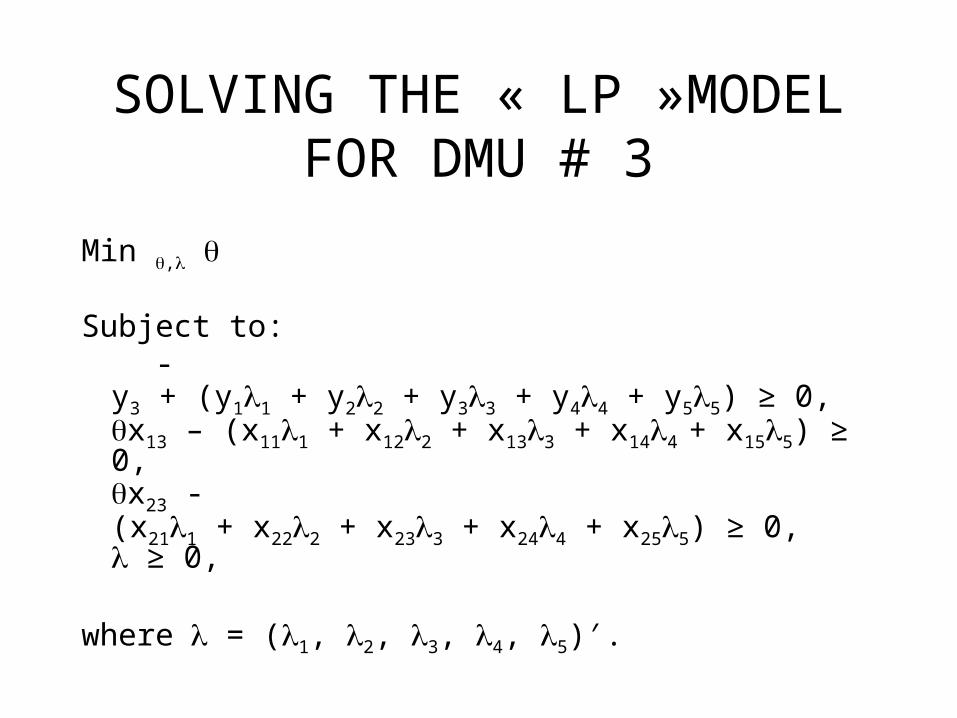
SOLVING THE « LP »MODEL FOR DMU # 3
Min ,
Subject to: -y3 + (y11 + y22 + y33 + y44 + y55) ≥ 0,
x13 – (x111 + x122 + x133 + x144 + x155) ≥ 0,x23 - (x211 + x222 + x233 + x244 + x255) ≥ 0, ≥ 0,
where = (1, 2, 3, 4, 5)′.
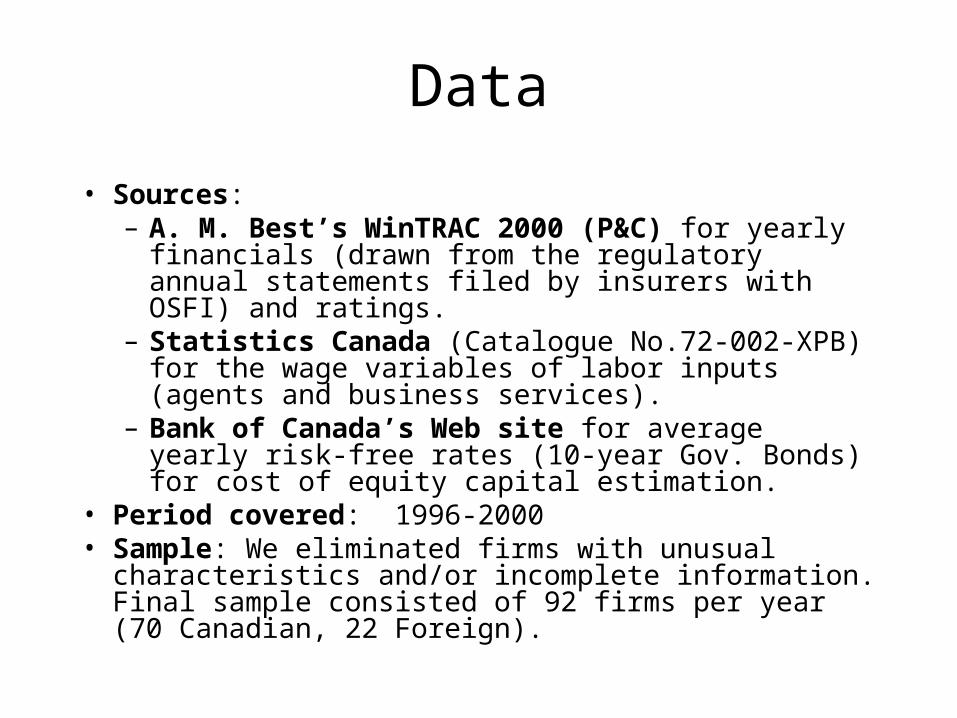
Data
• Sources: – A. M. Best’s WinTRAC 2000 (P&C) for yearly
financials (drawn from the regulatory annual statements filed by insurers with OSFI) and ratings.
– Statistics Canada (Catalogue No.72-002-XPB) for the wage variables of labor inputs (agents and business services).
– Bank of Canada’s Web site for average yearly risk-free rates (10-year Gov. Bonds) for cost of equity capital estimation.
• Period covered: 1996-2000• Sample: We eliminated firms with unusual characteristics
and/or incomplete information. Final sample consisted of 92 firms per year (70 Canadian, 22 Foreign).
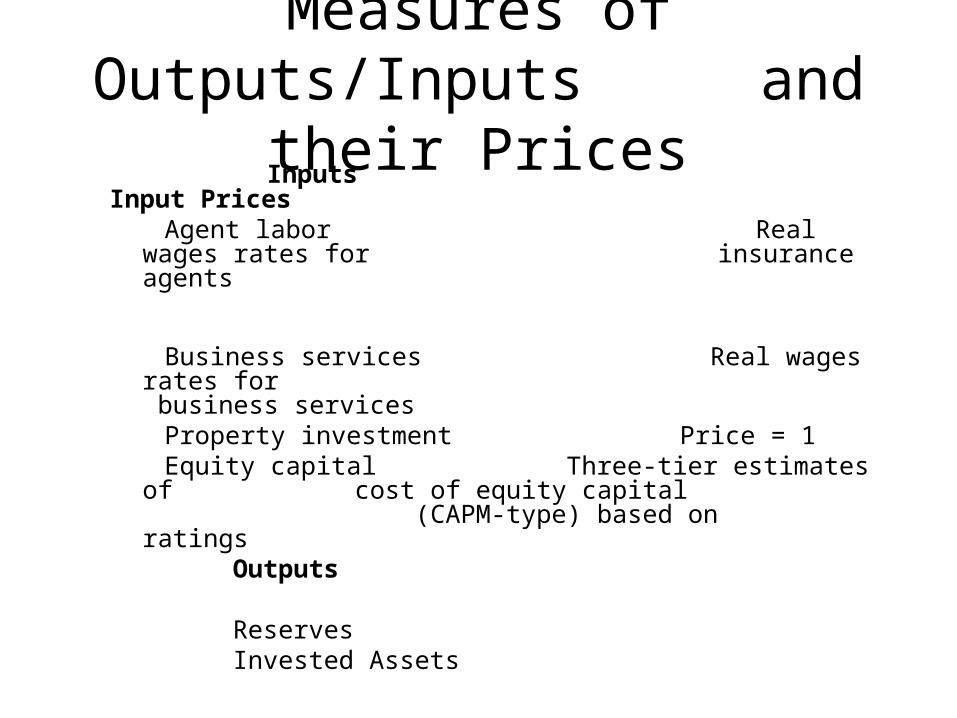
Measures of Outputs/Inputs and their Prices
Inputs Input Prices Agent labor Real wages rates for
insurance agents
Business services Real wages rates for business services
Property investment Price = 1 Equity capital Three-tier estimates of
cost of equity capital (CAPM-type) based on ratings
Outputs Reserves Invested Assets
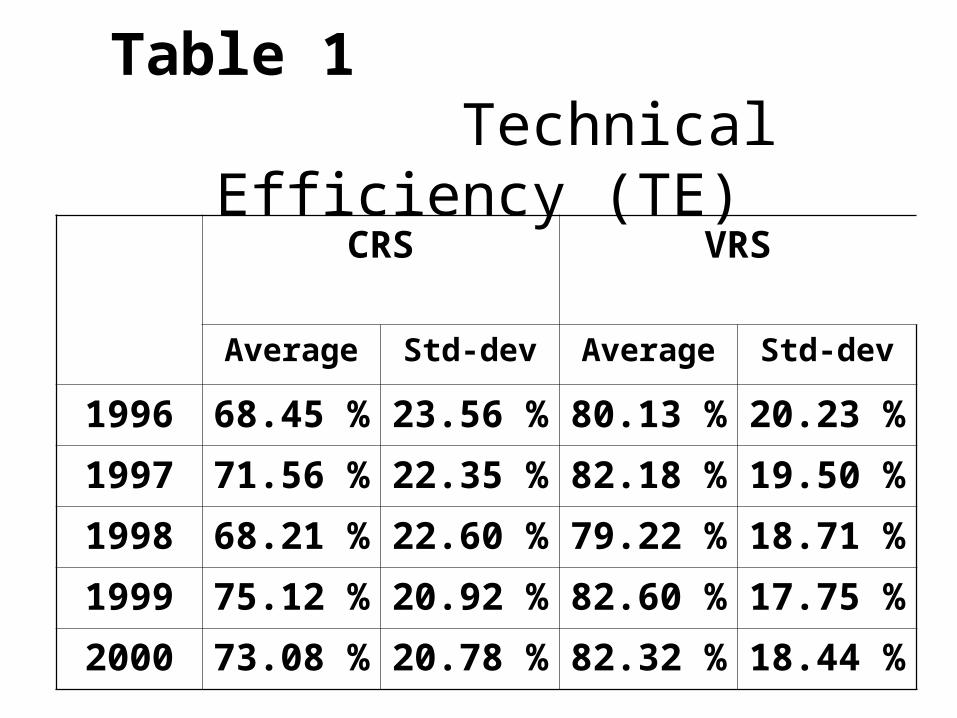
Table 1 Technical Efficiency (TE)
CRS VRS
Average Std-dev Average Std-dev
1996 68.45 % 23.56 % 80.13 % 20.23 %
1997 71.56 % 22.35 % 82.18 % 19.50 %
1998 68.21 % 22.60 % 79.22 % 18.71 %
1999 75.12 % 20.92 % 82.60 % 17.75 %
2000 73.08 % 20.78 % 82.32 % 18.44 %
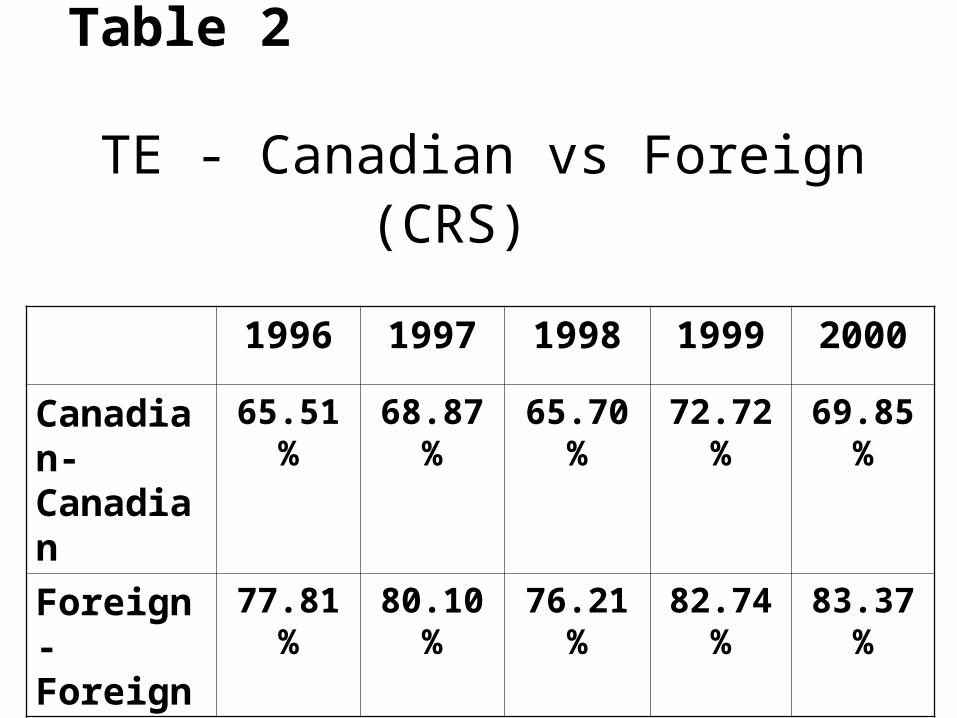
Table 2 TE - Canadian vs Foreign (CRS)
1996 1997 1998 1999 2000
Canadian-Canadian
65.51 % 68.87 % 65.70 % 72.72 % 69.85 %
Foreign-Foreign
77.81 % 80.10 % 76.21 % 82.74 % 83.37 %
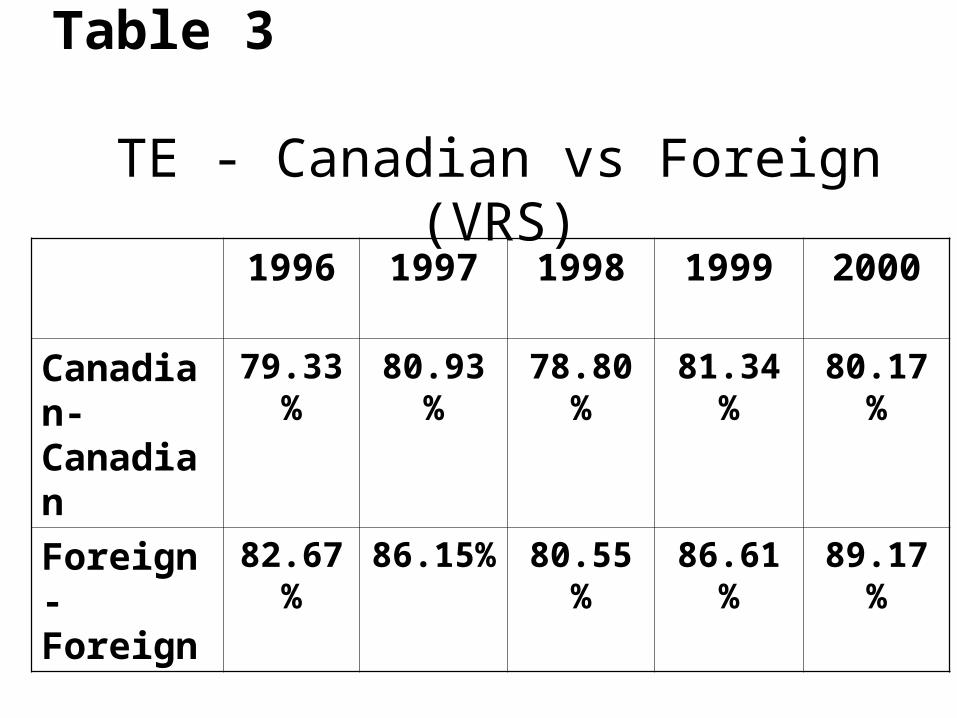
Table 3 TE - Canadian vs Foreign (VRS)
1996 1997 1998 1999 2000
Canadian-Canadian
79.33% 80.93 % 78.80 % 81.34 % 80.17 %
Foreign-Foreign
82.67% 86.15% 80.55 % 86.61 % 89.17 %
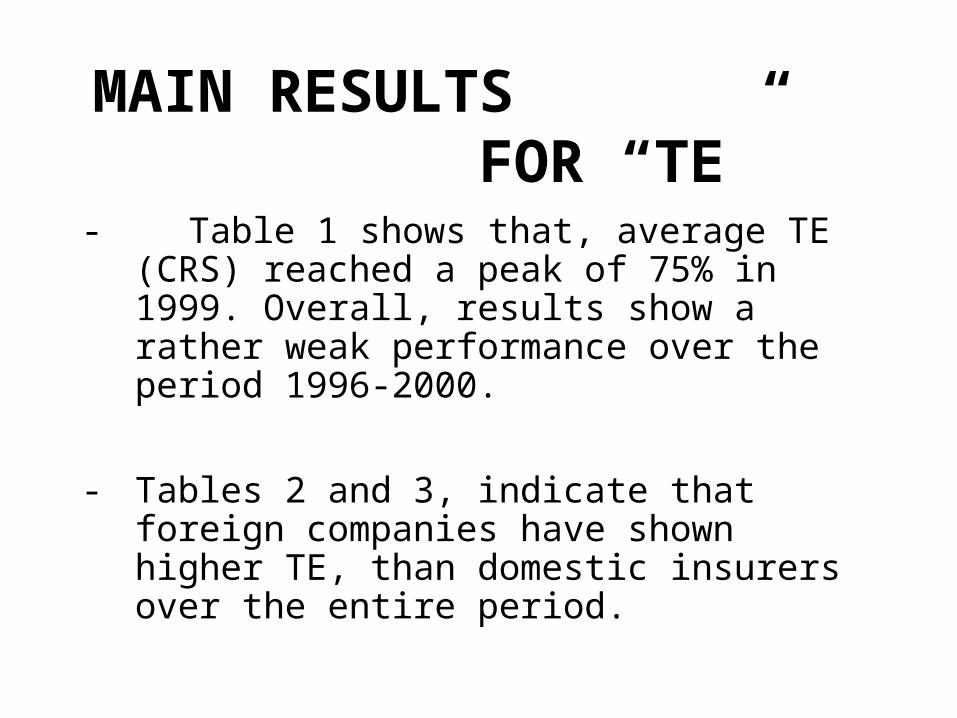
MAIN RESULTS FOR “TE”
- Table 1 shows that, average TE (CRS) reached a peak of 75% in 1999. Overall, results show a rather weak performance over the period 1996-2000.
- Tables 2 and 3, indicate that foreign companies have shown higher TE, than domestic insurers over the entire period.
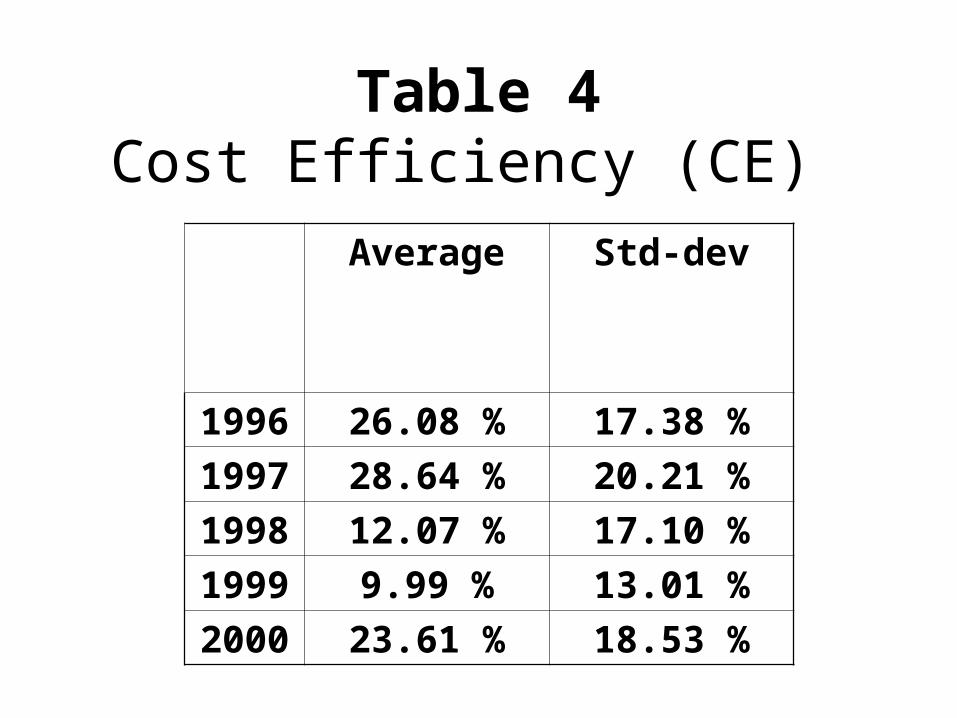
Table 4Cost Efficiency (CE)
Average Std-dev
1996 26.08 % 17.38 %
1997 28.64 % 20.21 %
1998 12.07 % 17.10 %
1999 9.99 % 13.01 %
2000 23.61 % 18.53 %
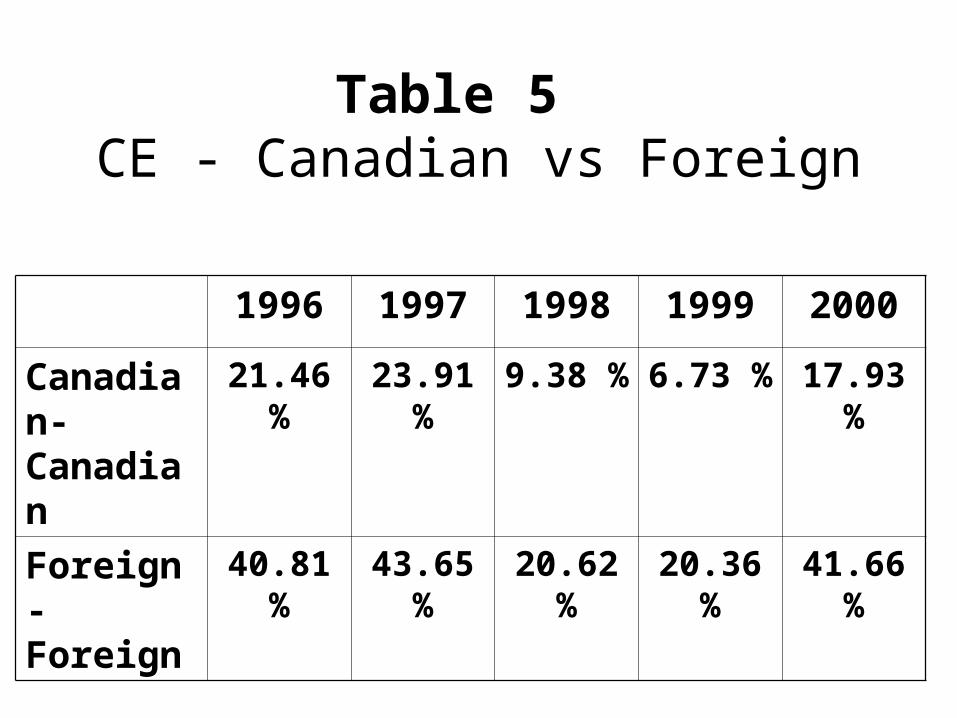
Table 5 CE - Canadian vs Foreign
1996 1997 1998 1999 2000
Canadian-Canadian
21.46 % 23.91 % 9.38 % 6.73 % 17.93 %
Foreign-Foreign
40.81 % 43.65 % 20.62 % 20.36 % 41.66 %
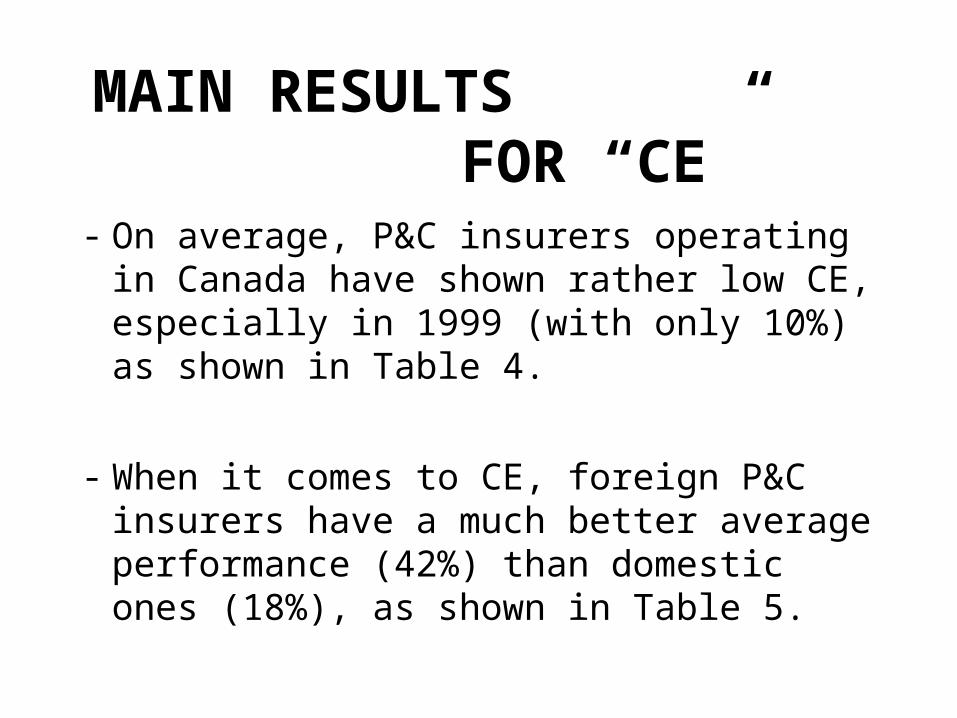
MAIN RESULTS FOR “CE”
- On average, P&C insurers operating in Canada have shown rather low CE, especially in 1999 (with only 10%) as shown in Table 4.
- When it comes to CE, foreign P&C insurers have a much better average performance (42%) than domestic ones (18%), as shown in Table 5.
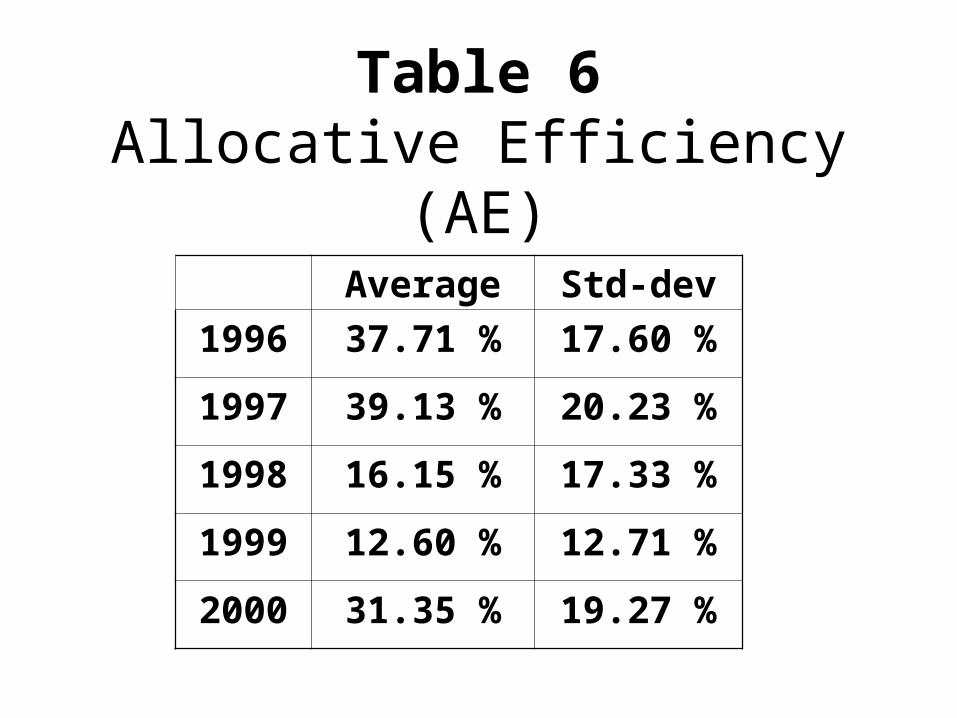
Table 6Allocative Efficiency (AE)
Average Std-dev
1996 37.71 % 17.60 %
1997 39.13 % 20.23 %
1998 16.15 % 17.33 %
1999 12.60 % 12.71 %
2000 31.35 % 19.27 %
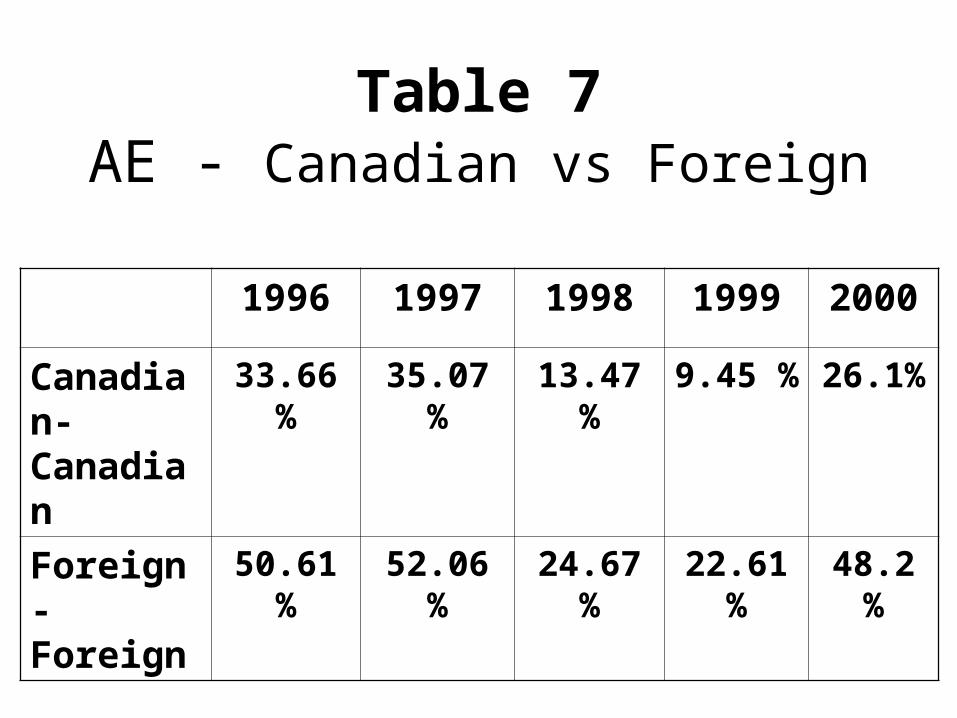
Table 7AE - Canadian vs Foreign
1996 1997 1998 1999 2000
Canadian-Canadian
33.66 % 35.07 % 13.47 % 9.45 % 26.1%
Foreign-Foreign
50.61 % 52.06 % 24.67 % 22.61 % 48.2 %
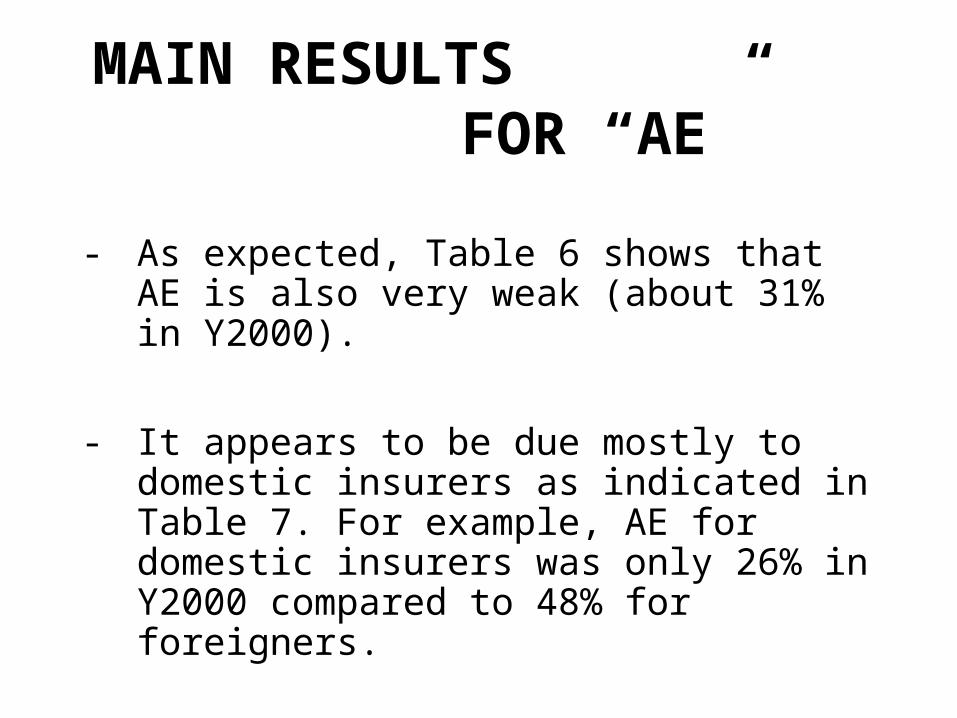
MAIN RESULTS FOR “AE”
- As expected, Table 6 shows that AE is also very weak (about 31% in Y2000).
- It appears to be due mostly to domestic insurers as indicated in Table 7. For example, AE for domestic insurers was only 26% in Y2000 compared to 48% for foreigners.
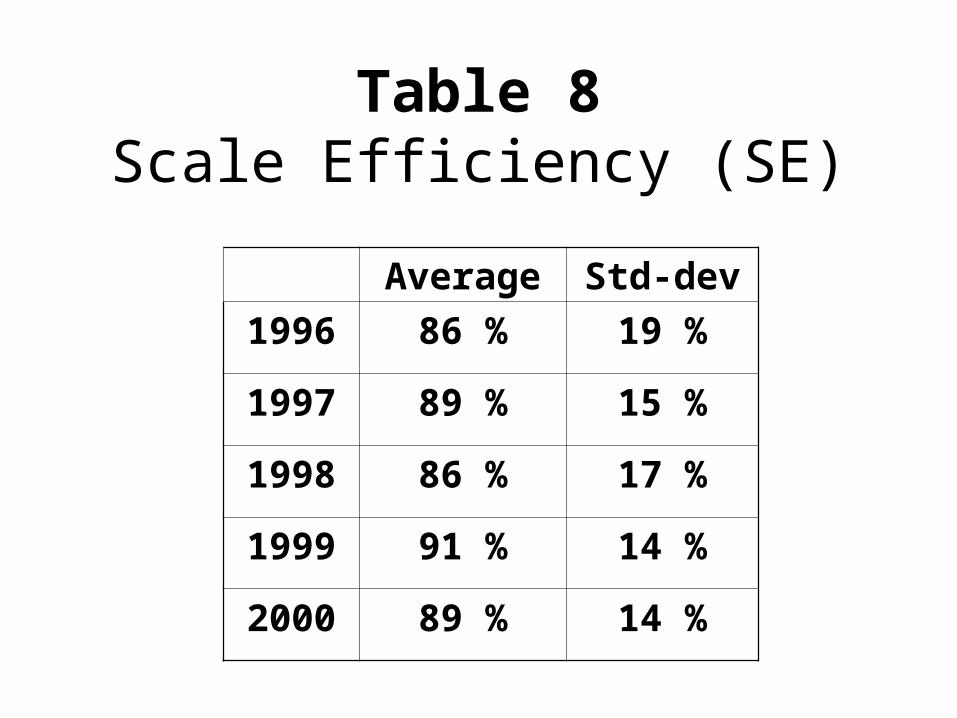
Table 8Scale Efficiency (SE)
Average Std-dev
1996 86 % 19 %
1997 89 % 15 %
1998 86 % 17 %
1999 91 % 14 %
2000 89 % 14 %
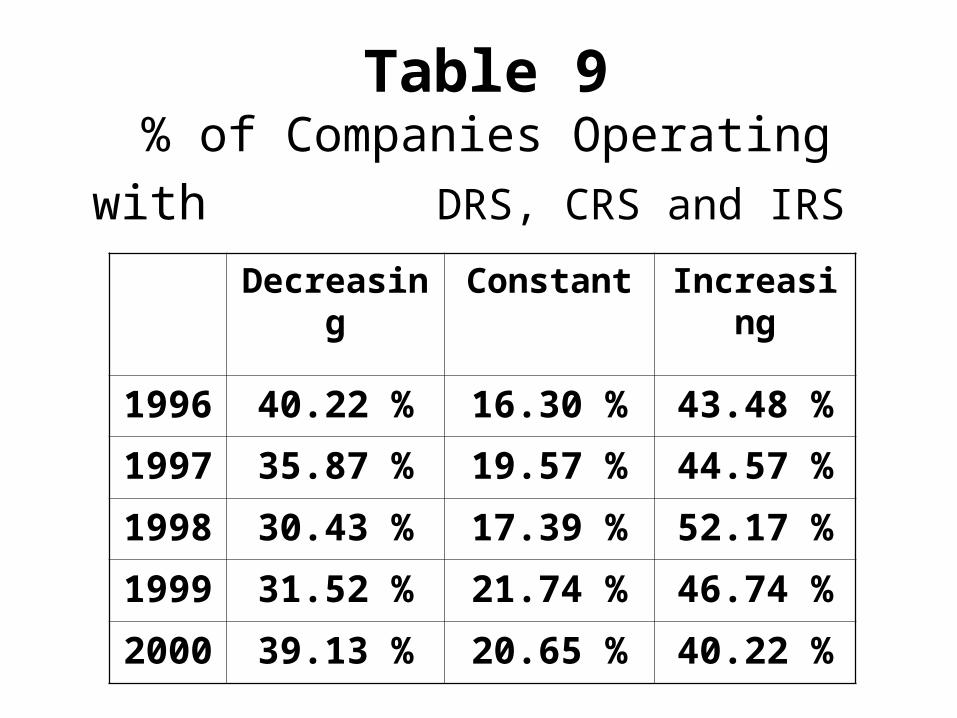
Table 9% of Companies Operating with
DRS, CRS and IRS Decreasing Constant Increasing
1996 40.22 % 16.30 % 43.48 %
1997 35.87 % 19.57 % 44.57 %
1998 30.43 % 17.39 % 52.17 %
1999 31.52 % 21.74 % 46.74 %
2000 39.13 % 20.65 % 40.22 %
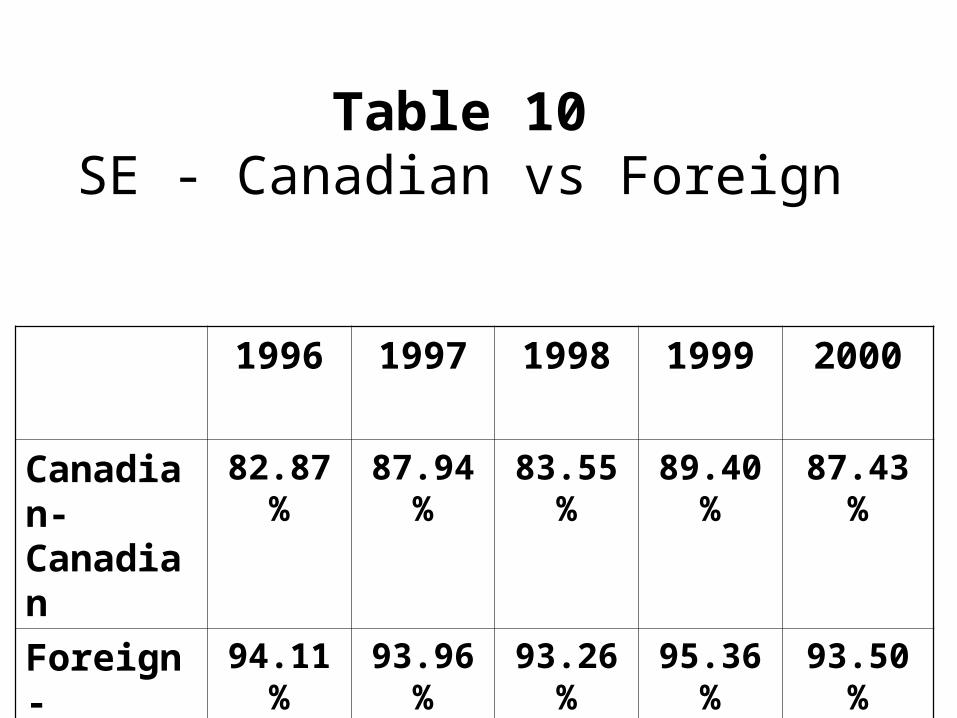
Table 10SE - Canadian vs Foreign
1996 1997 1998 1999 2000
Canadian-Canadian
82.87 % 87.94 % 83.55 % 89.40 % 87.43 %
Foreign-Foreign
94.11 % 93.96 % 93.26 % 95.36 % 93.50 %
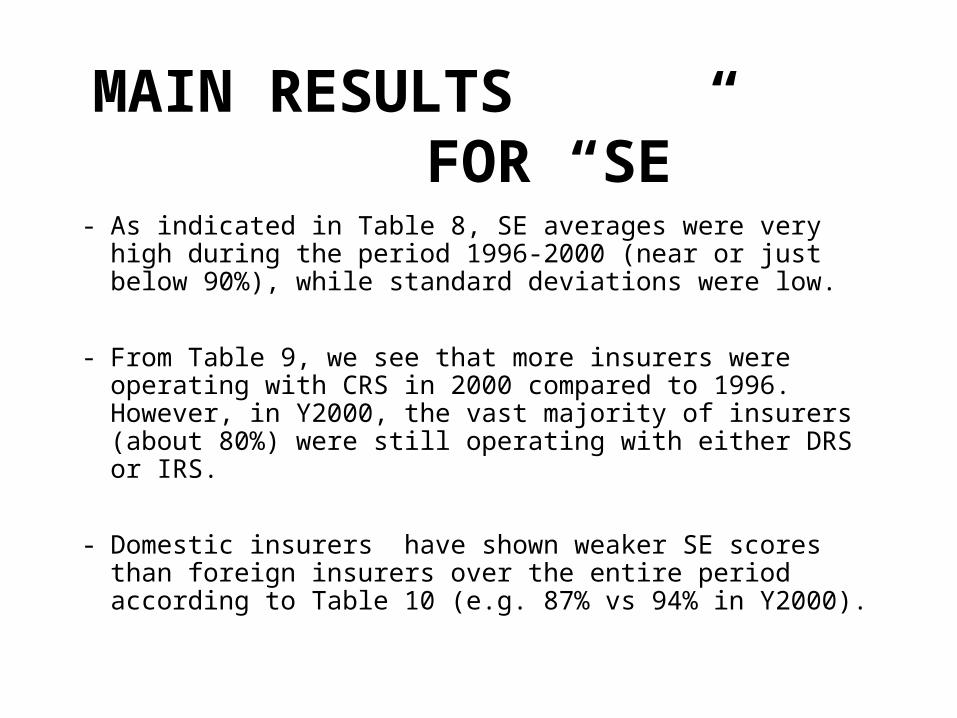
MAIN RESULTS FOR “SE”
- As indicated in Table 8, SE averages were very high during the period 1996-2000 (near or just below 90%), while standard deviations were low.
- From Table 9, we see that more insurers were operating with CRS in 2000 compared to 1996. However, in Y2000, the vast majority of insurers (about 80%) were still operating with either DRS or IRS.
- Domestic insurers have shown weaker SE scores than foreign insurers over the entire period according to Table 10 (e.g. 87% vs 94% in Y2000).
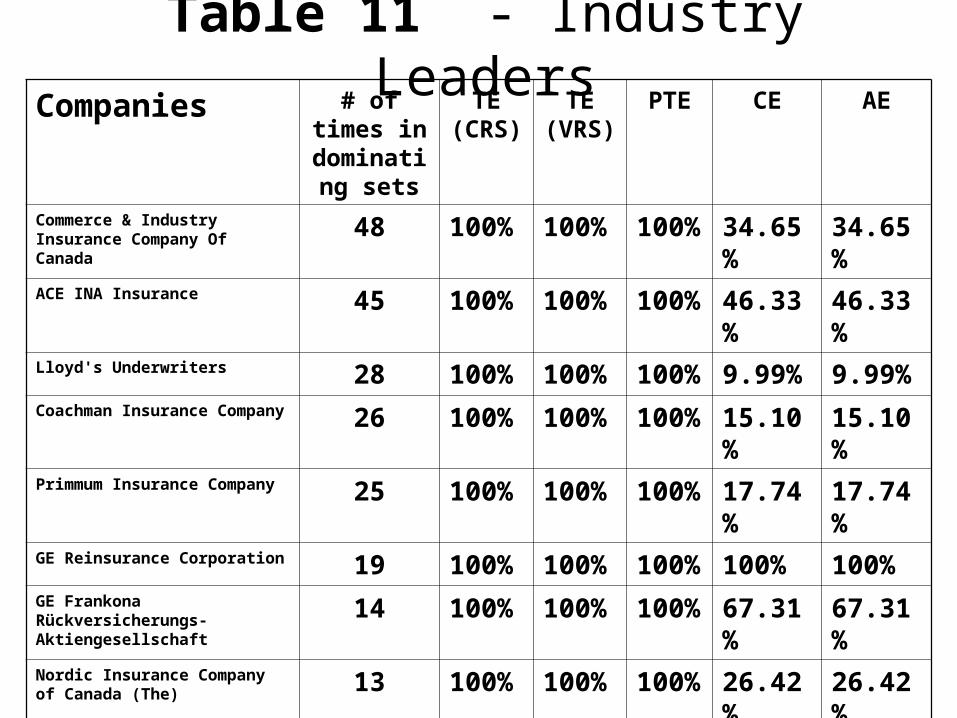
Table 11 - Industry LeadersCompanies # of times
in dominating
sets
TE (CRS)
TE (VRS)
PTE CE AE
Commerce & Industry Insurance Company Of Canada 48 100% 100% 100% 34.65% 34.65%
ACE INA Insurance 45 100% 100% 100% 46.33% 46.33%
Lloyd's Underwriters 28 100% 100% 100% 9.99% 9.99%Coachman Insurance Company 26 100% 100% 100% 15.10% 15.10%Primmum Insurance Company 25 100% 100% 100% 17.74% 17.74%GE Reinsurance Corporation 19 100% 100% 100% 100% 100%GE Frankona Rückversicherungs-Aktiengesellschaft
14 100% 100% 100% 67.31% 67.31%
Nordic Insurance Company of Canada (The) 13 100% 100% 100% 26.42% 26.42%
NAC Reinsurance Corporation 8 100% 100% 100% 26.70% 26.70%American Home Assurance Company (Canadian Branch) 6 100% 100% 100% 62.39% 62.39%
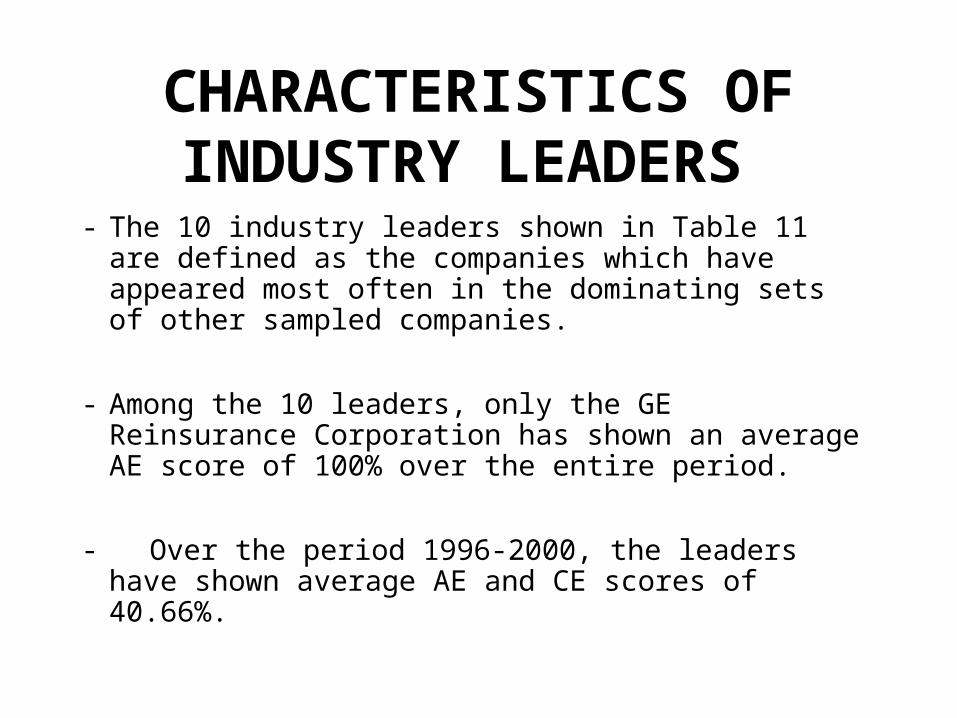
CHARACTERISTICS OF INDUSTRY LEADERS
- The 10 industry leaders shown in Table 11 are defined as the companies which have appeared most often in the dominating sets of other sampled companies.
- Among the 10 leaders, only the GE Reinsurance Corporation has shown an average AE score of 100% over the entire period.
- Over the period 1996-2000, the leaders have shown average AE and CE scores of 40.66%.
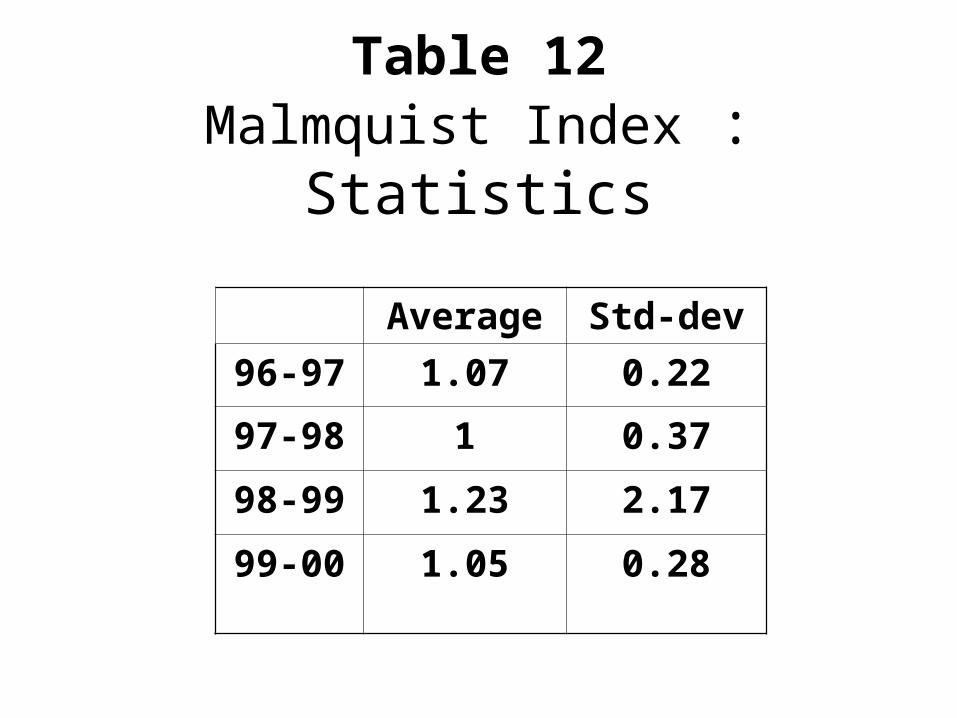
Table 12Malmquist Index : Statistics
Average Std-dev
96-97 1.07 0.22
97-98 1 0.37
98-99 1.23 2.17
99-00 1.05 0.28
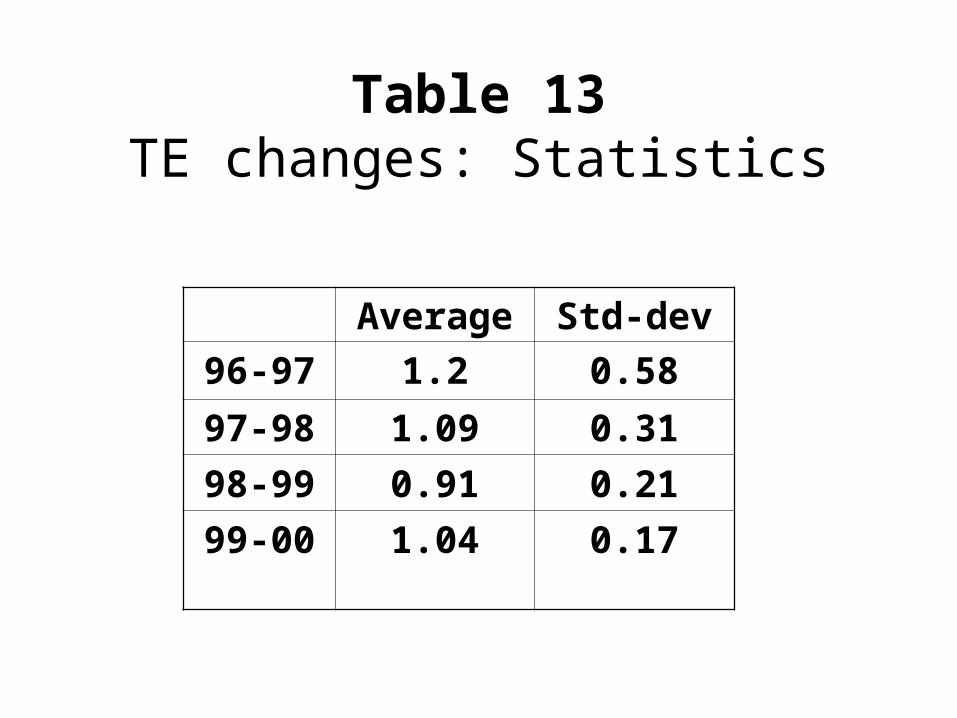
Table 13TE changes: Statistics
Average Std-dev
96-97 1.2 0.58
97-98 1.09 0.31
98-99 0.91 0.21
99-00 1.04 0.17
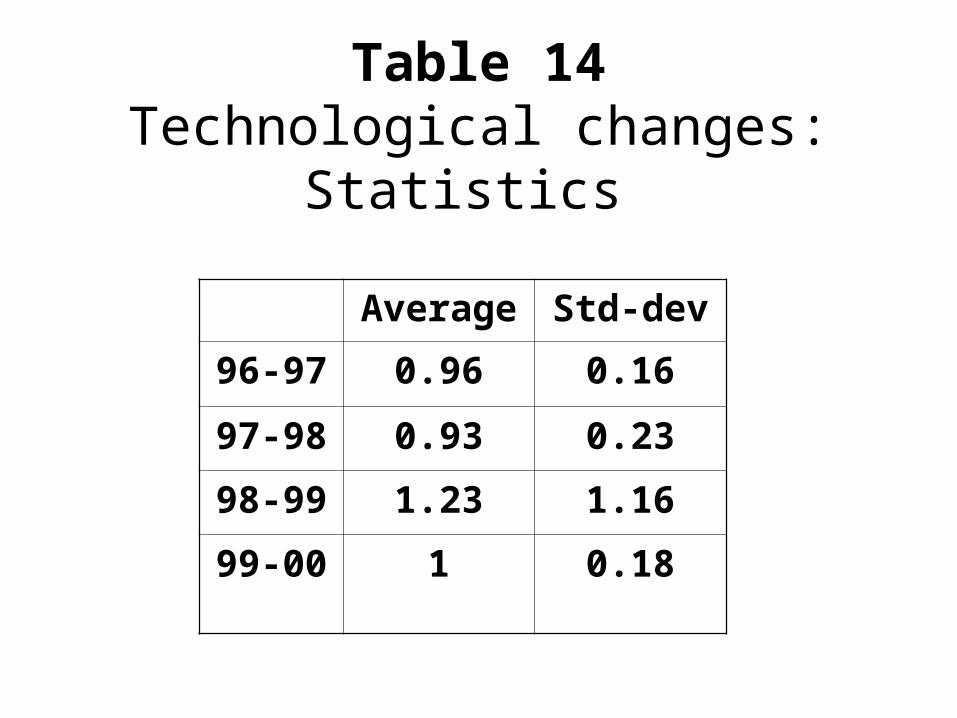
Table 14Technological changes: Statistics
Average Std-dev
96-97 0.96 0.16
97-98 0.93 0.23
98-99 1.23 1.16
99-00 1 0.18
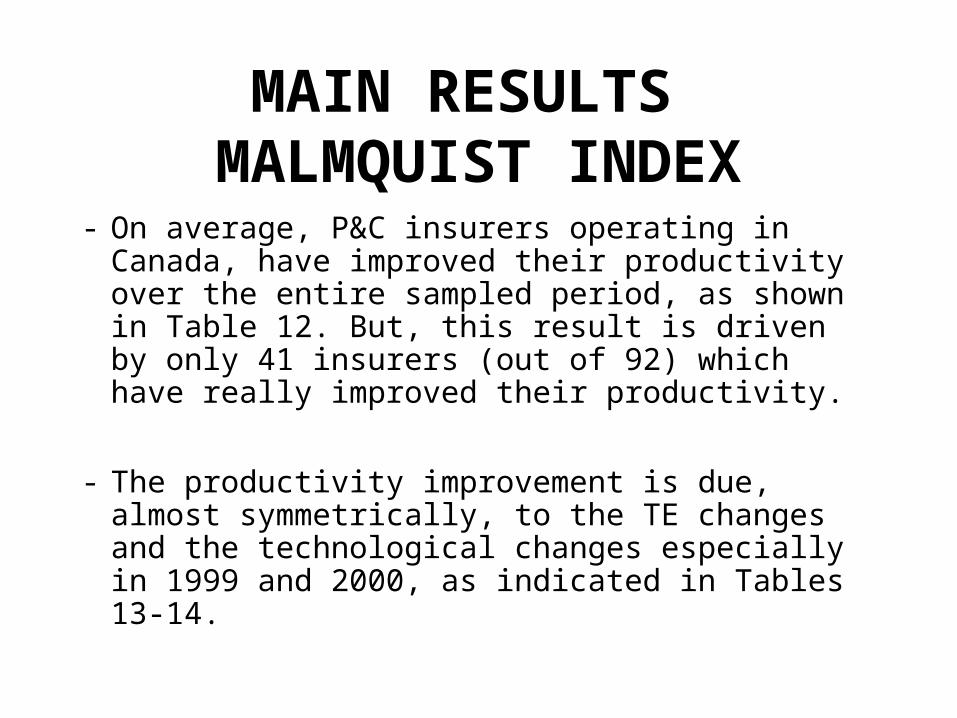
MAIN RESULTS MALMQUIST INDEX
- On average, P&C insurers operating in Canada, have improved their productivity over the entire sampled period, as shown in Table 12. But, this result is driven by only 41 insurers (out of 92) which have really improved their productivity.
- The productivity improvement is due, almost symmetrically, to the TE changes and the technological changes especially in 1999 and 2000, as indicated in Tables 13-14.
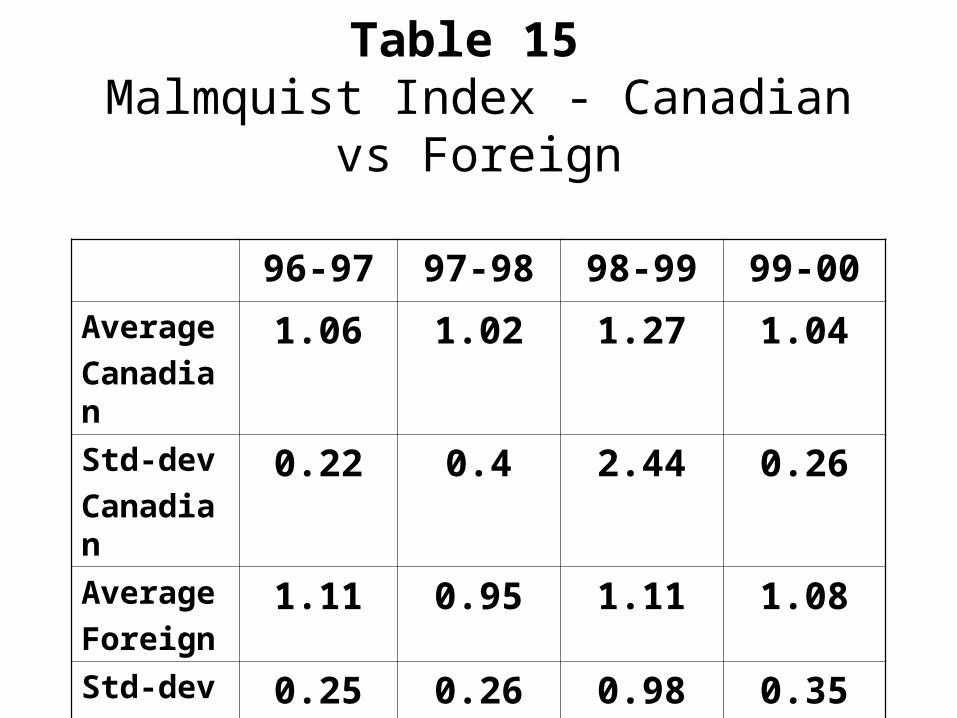
Table 15 Malmquist Index - Canadian vs Foreign
96-97 97-98 98-99 99-00
Average
Canadian1.06 1.02 1.27 1.04
Std-dev
Canadian0.22 0.4 2.44 0.26
Average
Foreign1.11 0.95 1.11 1.08
Std-dev
Foreign0.25 0.26 0.98 0.35
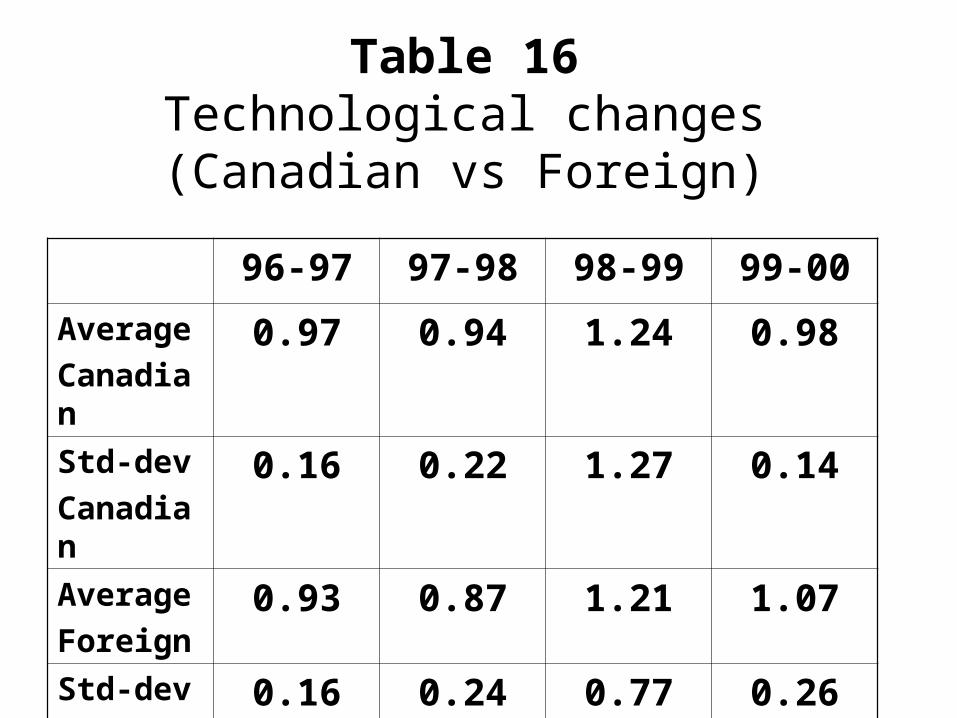
Table 16 Technological changes (Canadian vs Foreign)
96-97 97-98 98-99 99-00
Average
Canadian0.97 0.94 1.24 0.98
Std-dev
Canadian0.16 0.22 1.27 0.14
Average
Foreign0.93 0.87 1.21 1.07
Std-dev
Foreign0.16 0.24 0.77 0.26
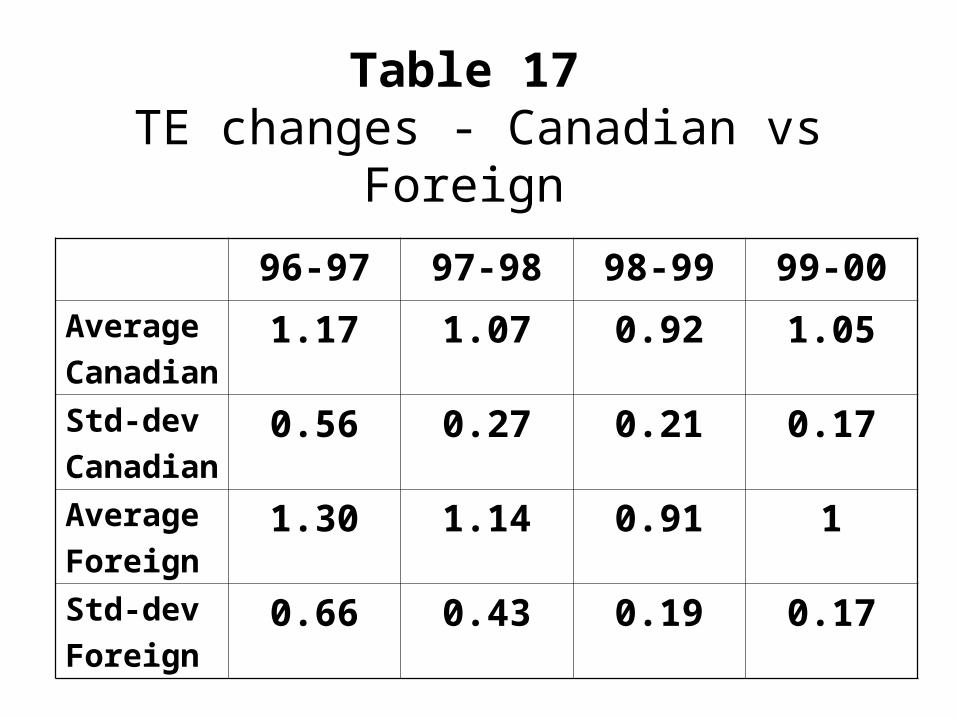
Table 17 TE changes - Canadian vs Foreign
96-97 97-98 98-99 99-00
Average
Canadian1.17 1.07 0.92 1.05
Std-dev
Canadian0.56 0.27 0.21 0.17
Average
Foreign1.30 1.14 0.91 1
Std-dev
Foreign0.66 0.43 0.19 0.17
MAIN RESULTS MALMQUIST INDEX
• According to Table 15, it appears that the productivity improvements were about similar for domestic and foreign insurers. However, results for domestic insurers show a greater standard deviation in 1999.
• According to Tables 16-17, these productivity improvements seem to be due mostly to TE changes rather than technological changes. That seems to be even more so in the case of domestic insurers.
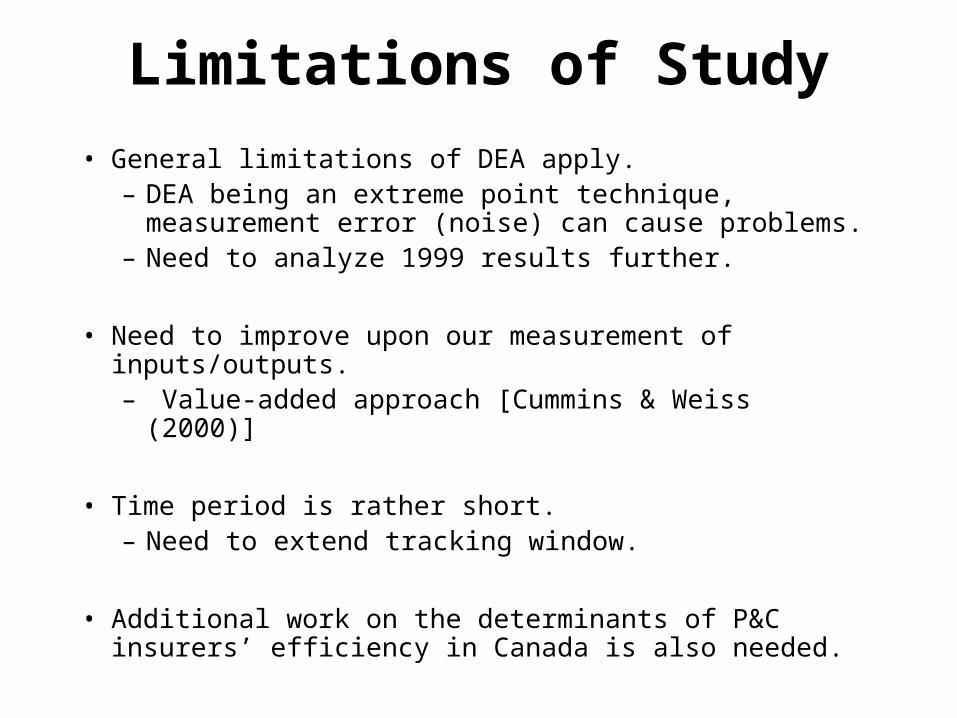
Limitations of Study
• General limitations of DEA apply.– DEA being an extreme point technique, measurement
error (noise) can cause problems.– Need to analyze 1999 results further.
• Need to improve upon our measurement of inputs/outputs.– Value-added approach [Cummins & Weiss (2000)]
• Time period is rather short. – Need to extend tracking window.
• Additional work on the determinants of P&C insurers’ efficiency in Canada is also needed.