Embed Size (px)
Citation preview
1
Measuring T-cell immunity in HIV vaccine clinical trials: PBMC and ELISPOT
assay proficiency concordance in laboratories from 3 continents
Mark J Boaz1*
, Peter Hayes2*
, Tony Tarragona2, Laura Seamons
2, Andrew Cooper
2,
Josephine Birungi3, Paul Kitandwe
3, Aloysius Semaganda
3, Pontiano Kaleebu
3,
Gwynneth Stevens1, Omu Anzala
4, Bashir Farah
4, Simon Ogola
4, Jackton Indangasi
4,
Patrick Mhlanga5, Melanie Van Eeden
5, Madhuri Thakar
6, Ashwini Pujari
6, Shadri
Mishra6, Nilu Goonetilleke
7, Stephen Moore
7, Abdul Mahmoud
7, Pattabiraman
Sathyamoorthy8, Jayashri Mahalingam
8, Paranji R Narayanan
8, Vadakkuppattu D
Ramanathan8, Josephine H Cox
1**, Len Dally
9, Dilbinder K Gill
2 and Jill Gilmour
2
*MJB and PH contributed equally to the work. MB: currently at Sanofi Pasteur,
Swiftwater, PA
1. International AIDS Vaccine Initiative (IAVI), New York, USA.
2. IAVI Core Laboratory, Imperial College, London, UK
3. Uganda Virus Research Institute (UVRI), Entebbe, Uganda
4. Kenya Aids Vaccine Initiative (KAVI), Nairobi, Kenya
5. Contract Laboratory Services (CLS), Johannesburg , South Africa
6. National Aids Research Institute (NARI), Pune, India
7. Centre for Clinical Vaccinology and Tropical Medicine (CVTM), University of
Oxford, Oxford, UK
8. Tuberculosis Research Centre (TRC), Chennai, India
9. The EMMES Corporation, Rockville, MD
ACCEPTED
Copyright © 2008, American Society for Microbiology and/or the Listed Authors/Institutions. All Rights Reserved.Clin. Vaccine Immunol. doi:10.1128/CVI.00326-08 CVI Accepts, published online ahead of print on 17 December 2008
on August 26, 2018 by guest
http://cvi.asm.org/
Dow
nloaded from

2
** Corresponding author. Mailing address: IAVI, 1600 Gude Drive, Rockville, MD
20850. Phone: 301 251 8360, FAX: 301 424 3120 [email protected]
ACCEPTED
on August 26, 2018 by guest
http://cvi.asm.org/
Dow
nloaded from

3
ABSTRACT
The interferon-gamma (IFN-γ) ELISPOT assay is used routinely to evaluate the potency
of HIV and other vaccine candidates. In order to compare candidates and pool data across
multiple trial laboratories, validated standardized methods must be applied across
laboratories. Proficiency panels are a key part of a comprehensive quality assurance
program to monitor inter- and intra-laboratory as well as assay performance over time.
Seven IAVI-sponsored trial sites participated in the proficiency panels. At each
laboratory two operators independently processed identical panels containing frozen
peripheral blood mononuclear cell (PBMC) samples from different donors using four
blinded stimuli. PBMC recovery and viability after overnight rest and IFN-γ ELISPOT
assay performance were assessed. All sites demonstrated good performance in PBMC
thawing and resting: median recovery (78%) and viability (95%). The laboratories were
able to detect similar antigen-specific T cell responses ranging from 50 to >3000 spot
forming cells per million PBMC. An approximate range of a half log across operators
within or across sites was seen when comparing antigen specific responses. Consistently
low background responses were seen in all laboratories. This proficiency panel
demonstrates the ability of seven laboratories, located across three continents, to process
PBMC samples and to rank volunteers with differential magnitudes of IFN-γ ELISPOT
responses. This panel also illustrates the ability to standardize the IFN-γ ELISPOT assay
across multiple laboratories when common training, reagents such as FCS and standard
operating procedures are adopted. These results are encouraging for laboratories that are
using cell-based immunology assays to test HIV and other vaccines.
ACCEPTED
on August 26, 2018 by guest
http://cvi.asm.org/
Dow
nloaded from

4
1
INTRODUCTION 2
3
Most HIV vaccines currently in development aim to induce cellular immune responses 4
since these have been shown to temporally correlate with containment of virus in infected 5
individuals and more significantly, have been shown to be crucial in suppression of virus 6
in the rhesus macaque model (2, 13, 15, 25) . The ability to measure and quantitate 7
cellular immune responses has been facilitated through the development of ELISPOT and 8
flow cytometry assays which determine the number of antigen specific cells through 9
surrogate markers of effector function such as cytokine production or degranulation of 10
lytic granules (1, 8, 23, 29), and are more quantitative and less labor intensive than 11
traditional assays which detect T-cell responses, such as 51
Cr release and 12
lymphoproliferation assays (19). The interferon-gamma (IFN-γ) ELISPOT assay is a 13
primary assay employed to measure vaccine immunogenicity in HIV vaccine clinical 14
trials, in addition to trials in the cancer, malaria and TB vaccine fields (23, 30, 31). 15
Although data on the performance of the IFN-γ ELISPOT assay across multiple 16
laboratories both within and across continents is critical to the generation of standardized 17
data on vaccine immunopotency (14), little published data exists. The IFN-γ ELISPOT 18
assay results can demonstrate whether the vaccine is able to induce a range of immune 19
responses in a particular population, therefore justifying further development. The value 20
of standardized methods for determining vaccine immunopotency should not be 21
diminished in spite of recent disappointing data from an HIV vaccine trial in which 22
advancement to a phase IIb trial was based partly on IFN-γ ELISPOT data from phase I-23
ACCEPTED
on August 26, 2018 by guest
http://cvi.asm.org/
Dow
nloaded from

5
II clinical trials (6, 26). Future modifications to the IFN-γ ELISPOT assay may increase 1
its relevance to efficacy testing, or it may correlate to more elaborate assays that yield 2
critical effector function such as inhibition of viral replication (9, 24). The International 3
AIDS Vaccine Initiative (IAVI), in collaboration with local partners, has developed Good 4
Clinical Laboratory Practices (GCLP) compliant clinical trial laboratories at trial units 5
across Europe, Africa and India. These GCLP compliant laboratories can be used for 6
comparative assessment of HIV vaccine candidates developed by IAVI and other 7
organizations and partners, for example with the Division of AIDS (NIH, Bethesda, MD), 8
and biotechnology firms, to facilitate the development of an HIV vaccine (10, 22). As 9
part of the ongoing assessment of laboratory performance and assay comparability, IFN-10
γ ELISPOT proficiency panels are regularly conducted at the IAVI-sponsored 11
laboratories. Such proficiency panels have also been conducted among laboratories from 12
different organizations within the HIV vaccine field and have recently been implemented 13
at laboratories working within the Cancer Vaccine Consortium (3, 4, 11). In contrast to 14
published data, the present study demonstrate that when following standardized training 15
and validated assay methods, the results for the IFN-γ ELISPOT assay and the associated 16
handling of test material are notable and highly concordant between laboratories. These 17
data hold promise for the HIV vaccine field as a whole, and also for the cancer, malaria 18
and TB cell based vaccines. It is possible that comparable data can be obtained across 19
multi-centre trials and continents, facilitating concordant and, if warranted, accelerated 20
vaccine development. 21
22
23
ACCEPTED
on August 26, 2018 by guest
http://cvi.asm.org/
Dow
nloaded from

6
1
MATERIALS AND METHODS 2
Participating laboratories. The following laboratories are currently participating or 3
have previously participated in IAVI sponsored HIV vaccine trials: 1) IAVI Core 4
Laboratory London (IAVI Core), Imperial College, London, UK, 2) Centre for Clinical 5
Vaccinology and Tropical Medicine (CVTM, hereafter identified as “Oxford”), Oxford 6
University, Oxford, UK. 3) Kenyan AIDS Vaccine Initiative (KAVI), University of 7
Nairobi, Nairobi Kenya, 4) Ugandan Virus Research Institute (UVRI), Entebbe, Uganda, 8
5) Contract Laboratory Services (CLS), Witwatersrand University, Johannesburg, South 9
Africa 6) National AIDS Research Institute (NARI), Pune, India, and 7) Tuberculosis 10
Research Centre (TRC), Chennai, India. 11
Training of laboratories. Prior to commencing studies, whether with an existing 12
laboratory and staff, or with a newly built laboratory and new staff, the laboratory team 13
enters the IAVI Core Laboratory training program. In brief, laboratory teams attend a 14
two-day basic training course on GCLP, followed by up to two weeks of in-depth training 15
in IAVI Standard Operating Procedures (SOPs), which include isolation, counting and 16
freezing of PBMC, and the ELISPOT assay itself, among other things (28). A laboratory 17
training manual is implemented and, after review, each technician is required to 18
successfully complete a written test. Further training is then provided at the on-site 19
laboratory by an IAVI technician who covers the same procedures described in the 20
manual, after which the site team is required to complete both a qualifying test for PBMC 21
isolation and freezing, and separately an IFN-γ ELISPOT qualifying test. Finally, 22
successful laboratory teams receive a technical audit of laboratory assays every 6 months, 23
ACCEPTED
on August 26, 2018 by guest
http://cvi.asm.org/
Dow
nloaded from

7
and are enrolled in an ongoing QC program whereby PBMC proficiency is reviewed 1
monthly and ELISPOT proficiency is reviewed using the negative and positive control 2
data generated in ongoing clinical trials. The laboratories are also enrolled in a GCLP 3
accreditation program (28). 4
Proficiency Panel design. One to two proficiency panels (PP) are distributed every year. 5
To date, four proficiency panels have been submitted to a number of laboratories and data 6
from the first three panels have been evaluated (Table 1). In brief, the panel consists of 7
duplicate frozen PBMC that are thawed and stimulated with blinded stimuli consisting of 8
mock, a mixture of 32 flu, Epstein Barr virus (EBV) and Cytomegalovirus (CMV) 9
peptides (CEF), a pool of CMV pp65 15-mer peptides, and phytohemaglutinin (PHA, 10
Sigma Poole, Dorset, UK). The CEF peptides are a panel of 32 8-10aa peptides covering 11
epitopes from influenza, EBV and CMV designed to cover diverse MHC class I 12
genotypes, responses are detected in approximately 70% of healthy individuals in Africa, 13
Europe and the US (5, 20) and data not shown. The CEF and CMV peptides were 14
synthesized to 90% purity (Anaspec Inc. CA). Two operators each performed thawing 15
and, for panels 1 and 2, repeat testing on two occasions, with results submitted to an 16
independent statistician for evaluation. IAVI SOPs and proficiency panel work 17
instructions were followed, and all procedures were performed under GCLP conditions, 18
as previously described. 19
PBMC specimen handling. PBMC were obtained from healthy HIV seronegative 20
donors through the UK National Blood Transfusion service (NBTS, Colindale, UK) for 21
PP1 (n=6) and PP2 (n=3) and from the South African Blood Transfusion Service (n=8) 22
under a local ethics approved blood drawing protocol for PP3. The 17 PBMC samples 23
ACCEPTED
on August 26, 2018 by guest
http://cvi.asm.org/
Dow
nloaded from

8
came from 17 different donors. All PBMC were isolated, counted and frozen following 1
IAVI SOPs. The PBMC were isolated using ficoll and density gradient centrifugation and 2
counted with an automated cell counter. Three counters were used; the Coulter Z1, 3
(Beckman Coulter, UK); the Vi-CELL (Beckman Coulter, UK) and the Guava Personal 4
Cell Analysis (PCA) system (Guava Technologies, Hayward, CA). Viability was 5
assessed by haemocytometer and trypan blue for counts by the Z1 counter. Samples were 6
frozen at 10 million viable PBMC per vial using a rate controlled freezer (Kryo 560-16 7
model, Planer, UK). PBMC were stored in vapour phase liquid nitrogen and shipment to 8
participating laboratories performed using temperature-monitored cryogenic shippers 9
(Taylor Wharton CX500, Jencons, UK). Following receipt, the PBMC continued to be 10
stored in vapour phase liquid nitrogen until use. Prior to use, the PBMC were thawed by 11
warming in a waterbath at 37°C until one small ice crystal remained, then washed in 12
RPMI 20% FCS, and rested overnight in RPMI 20% FCS at 1.5 to 2 million PBMC/ml at 13
37°C and 5% CO2. The following morning viable cells were counted and placed into the 14
ELISPOT assay. All PBMC counts, recoveries and viabilities were recorded on batch 15
records. 16
ELISPOT assay. The IFN-γ ELISPOT assay was performed as described previously 17
(22). In brief, 96 well Multiscreen HTS IP plates (MSIP4510, Millipore, UK) were 18
incubated overnight with 10µg/ml of clone 1-D1K mouse anti-human IFN-γ monoclonal 19
antibody (MABTECH, Sweden). The next day, after washing and blocking with RPMI 20
10% FCS (R10), the PBMC were plated at 2x10⁵ viable PBMC per well and stimulated in 21
quadruplicate according to the ELISPOT templates provided. Blinded stimuli included 22
mock (R10 with DMSO to give final concentration in well of 0.45% DMSO) to control 23
ACCEPTED
on August 26, 2018 by guest
http://cvi.asm.org/
Dow
nloaded from

9
for DMSO included in the peptide stimuli, CEF and CMV peptides at 1.5µg/ml and PHA 1
at 10µg/ml (Sigma Poole, Dorset, UK). Following overnight incubation at 37°C and 5% 2
CO2, production of IFN-γ was assessed by addition of 100µl of 1µg/ml filtered 3
biotinylated clone 7-B6-1 mouse-anti human IFN- γ antibody (MABTECH, Sweden) for 4
2-4 hours, addition of ABC peroxidase-avidin-biotin complex (Vector Laboratories, 5
Burlingame, CA) for 1 hour and development with filtered AEC substrate solution 6
(Vector Laboratories, Burlingame, CA ) for 4 minutes. Plates were read using an 7
automated AID ELISPOT reader (AutoImmun Diagnostika, Germany). The ELISPOT 8
data are expressed as spot forming cells (SFC) per million PBMC. 9
Statistical analysis. Analysis of recovery and viability of thawed PBMC, determination 10
of SFC per million PBMC, and coefficient of variation of results was performed by the 11
EMMES Corporation (Rockville, MD). The signed-rank test was used for paired 12
observations (e.g., between operators), and the Kruskal-Wallis test was used when 13
comparing multiple groups (e.g., between samples within each panel). Measures of 14
correlation are based on Spearman’s correlation coefficient. 15
16
RESULTS. 17
Recovery and viability of PBMCs. All PBMC were received at the participating 18
laboratories at a temperature of below -170oC. Two operators in each laboratory 19
independently recorded the total number of viable cells following thaw and overnight rest 20
in addition to the percent viability and the calculated recovery percentage (Figure 1). All 21
recordings were received except for 1 laboratory which did not provide viability data for 22
panels 1 and 2. The median value and range for recovery was 81.2% (46-163%) in the 23
ACCEPTED
on August 26, 2018 by guest
http://cvi.asm.org/
Dow
nloaded from

10
first panel, 96.3% (60-155%) in the second panel and 69.8% (35-170%) in the third 1
panel. 2
Between Donors. The Kruskal-Wallis test showed variability in recovery between 3
PBMC samples from different donors, and was significant in panels 1 (p=0.0005) and 3 4
(p=0.0013), and borderline in panel 2 (p=0.0657). This may relate to a natural variation 5
in the propensity of cells to freezing and thawing, or may relate to the large volume of 6
blood handled (approximately 200-500ml) when processing blood bank samples, leading 7
to an inaccurate count upon freezing. Data from the IAVI partner laboratory network 8
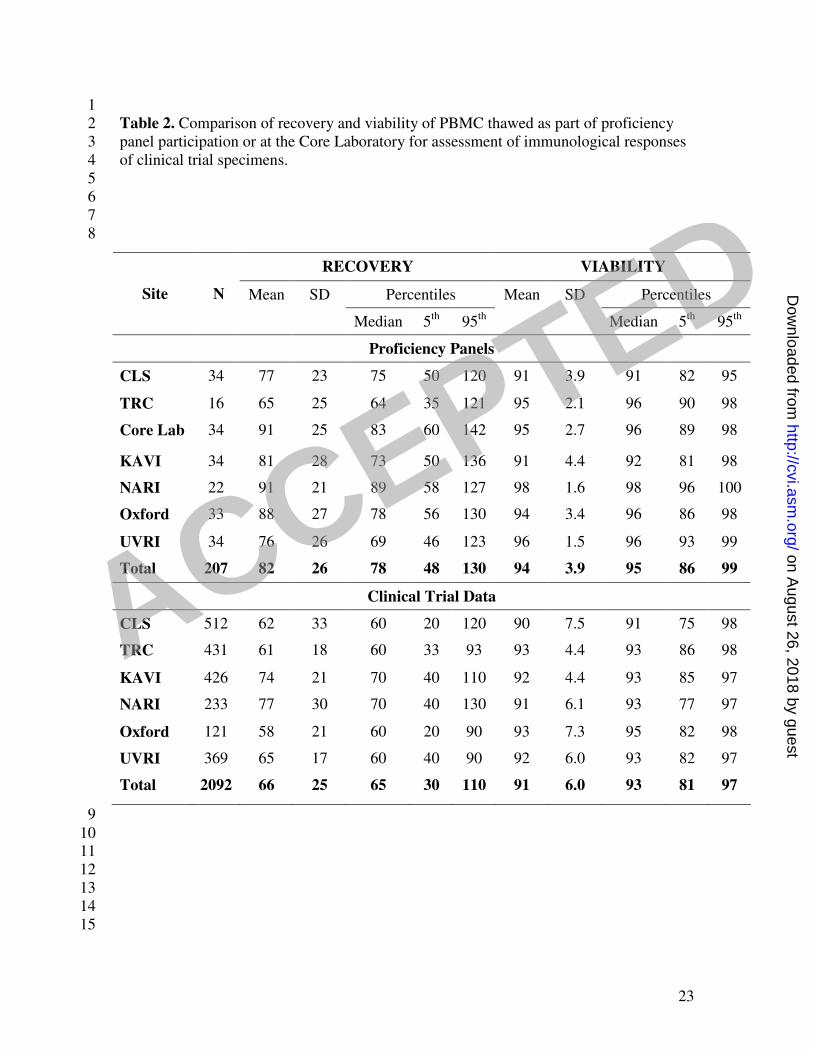
revealed a median recovery of 70% (median viability of 92%) from 992 clinical trial 9
samples frozen during 2006, of which the common blood draw volume was between 40-10
80 mls of blood (some of this data is shown in Table 2, see below). No difference was 11
seen between donors in the percentage viability (p>0.23 for each of the 3 panels), which 12
ranged from 80% to 100%, with medians of 95%, 96% and 95% for panels 1, 2 and 3, 13
respectively. 14
Between Sites. A significant difference was noted between sites in the total recovery of 15
viable cells (p-values 0.0005, 0.0079, <0.0001 in panels 1 to 3 respectively) and also the 16
viability of PBMC (0.0050, 0.0003, <0.0001, respectively), see Figure 1. This may relate 17
to the difference in counting methods employed at the sites (Table 1) since it has been 18
reported that the viability determined by automated counters is lower than by manual 19
count (12). 20
Between Operators. To compare operators at each site, the paired differences in 21
recovery and viability for each donor were tested using Wilcoxon’s signed rank test. 22
Recovery differed between operators at one lab from panel 1 (p=0.031) and at three labs 23
ACCEPTED
on August 26, 2018 by guest
http://cvi.asm.org/
Dow
nloaded from

11
from panel 3 (p=0.0156, 0.0078 and 0.0078). Percent viability differed between 1
operators at 2 labs from panel 1 (p=0.031 for both) and one lab from panel 3 (p=0.0156). 2
With samples from only 3 volunteers, panel 2 had very low statistical power and no 3
differences were observed between operators. 4
Correlation with ELISPOT responses. Overall, there was a statistically significant, 5
though not very strong correlation (20.5%, p=0.0067) between % viability and ELISPOT 6
magnitude of PHA responses. For the separate panels the correlations were inconsistent 7
in magnitude and direction, being –19% (p=0.201), 49% (p=0.006) and 29% (p=0.005), 8
respectively. Similarly, there was a weak, though statistically significant negative 9
correlation (-24.4%, p=0.0007) overall between recovery and ELISPOT magnitude of 10
CMV responses. Again the correlations were inconsistent, being 0% (p=1.0), -44% 11
(p=0.008) and -26% (p=0.012), respectively, for the 3 panels. No other correlations were 12
observed. 13
ELISPOT assay performance. Two operators per laboratory independently set up each 14
ELISPOT assay following the SOP and template instructions for adding the blinded 15
stimuli. Responses from each laboratory and donor sample to the different stimuli are 16
expressed per million PBMC and are shown in Figure 2. Mock (i.e., background or 17
medium) responses are the well counts, whereas CMV, CEF and PHA responses are well 18
counts after subtraction of mock. Only three (1%) of the 323 responses to mock were 19
above 55 SFC/106 cells, indicating an excessive background count that would result in an 20
assay failure and subsequent re-testing of the sample in current IAVI clinical trials. For 21
the current IAVI proficiency panel the mean background at the 7 sites ranges from 2.3 to 22
ACCEPTED
on August 26, 2018 by guest
http://cvi.asm.org/
Dow
nloaded from
12
13.6 SFC/106 PBMC and is 7.7 ± 15.2 (SD) overall. If the three specimens with >55 1
SFC/106 PBMC are excluded then the mean background is 6.6 ± 8.0 SFC/10
6 PBMC. 2
The CEF and CMV stimuli allow the assessment of concordance across laboratories in 3
magnitude of antigen specific responses from donor PBMC, and furthermore, for a given 4
definition of response classification (e.g., non-responder, responder), whether responses 5
from different laboratories would be classified equally. 6
The variation across laboratories in CEF responses from each donor sample is shown in 7
Figure 2B. In general the responses from each lab are similar, with a range of about half a 8
log for each sample. However, the figure also shows that any response classification (a 9
horizontal line drawn from any point on the y-axis) would result in at least one sample 10
falling into more than one category. In IAVI clinical trials the definition of positive CEF 11
is a response >38 SFC/106 cells based on multiple samples evaluated over time. With this 12
definition the data across laboratories shows 2 samples (#’s 4 and 13) with only negative 13
responses, 2 samples (#’s 11 and 14) with mostly negative responses, one sample with 14
mostly positive responses (# 9), and the remaining 12 samples with all positive responses. 15
From panel 1 the lowest CEF responses for 5 of the 6 samples were analysed by the same 16
operator. Further investigation revealed that the operator had previously only used fresh 17
PBMC for ELISPOT assays and had little experience of thawing PBMC. Revised 18
instructions and training on the use of cryopreserved PBMC were provided for the 19
subsequent panels. 20
The variation across laboratories in CMV pp65 responses from each donor sample is 21
shown in Figure 2C. Again, the range of responses is about half a log per sample (except 22
sample #4 from panel 1), showing the consistency in results across labs. If CMV positive 23
ACCEPTED
on August 26, 2018 by guest
http://cvi.asm.org/
Dow
nloaded from

13
responses are arbitrarily defined as those >50 SFC/106 cells, then the CMV results would 1
be categorized as 6 negative samples, 2 borderline responders (#’s 4 and 9), and 9 2
positive samples. 3
PHA responses are shown in Figure 2D. The majority are >1000 SFC/106 cells, as 4
expected, except for some panel 3 responses ≥450, and four panel 1 responses <108 5
SFC/106 cells. Three of the low panel 1 responses were measured by the same operator 6
who obtained 5 of the 6 lowest CEF responses. 7
ELISPOT assay variation with each panel. In IAVI trials a typical analysis of 8
ELISPOT data uses the mean count from replicate wells for each peptide on a plate. 9
Since the number of replicates is generally small (usually 3 or 4) the mean can easily be 10
influenced by extreme values. Thus, as one of the criteria for defining positive responses, 11
IAVI requires that the variation amongst the replicates be small relative to the mean. That 12
is the coefficient of variation (CV), defined as the standard deviation divided by the 13
mean, must not be greater than 70%. Since the three panels were conducted in sequence, 14
with an interval of 6 to 9 months between each one, we wanted to investigate whether 15
there was any change in the CV across quadruplicate wells. Typical examples are shown 16
in Figure 3. Clearly, as the mean spot counts increase, the CV decreases, and remains 17
below 70% (in general ≤30%) for counts greater than 50 SFC per 106 cells, and there is 18
little variation between the three panels. 19
Concordance between HIV-1 vaccine trial responses from two laboratories. The 20
conduct of ELISPOT proficiency panels is a critical tool for ensuring comparable 21
laboratory performance both within and across networks, and also for identifying and 22
troubleshooting reasons for differences, if they exist. When dealing with actual volunteer 23
ACCEPTED
on August 26, 2018 by guest
http://cvi.asm.org/
Dow
nloaded from

14
samples during a clinical trial, pressure on laboratory personnel may be increased through 1
prioritization of work, the time at which samples are drawn, or late changes to scheduled 2
visits. Table 2 shows the viability and recovery of PBMC thawed as part of the 3
proficiency panel participation (top panel, see also figure 1) or at the Core Laboratory for 4
assessment of immunological responses of clinical trial specimens (bottom panel). 5
Excellent recovery and viability was seen from the PBMC shipped to the sites or when 6
the sites shipped PBMC cryopreserved on site to the Core Laboratory. One vaccine trial 7
in which the same PBMC samples were tested both fresh following blood draw on-site at 8
KAVI in Nairobi and from frozen after shipment to the IAVI Core laboratory in London, 9
provided ideal data with which to compare and assess performance in real time under real 10
conditions (Bwayo, J et al in preparation). Trial donor PBMC responses assessed in the 11
two laboratories elicited concordant responses (Spearman’s correlation coefficients 12
ranged from 20% to 81% for 7 HIV peptide pools, p<.0001 for all but one), despite using 13
either freshly isolated or thawed cryopreserved PBMC, providing further assurance that 14
proficiency panel data are useful to indicate actual trial performance. These two 15
laboratories also had concordant results in the proficiency panels (Figures 2 and 3). 16
Figure 4 shows typical examples of IFN-γ ELISPOT responses to CEF and HIV peptide 17
pools used in the trial. There is a slight trend toward vaccine induced responses (HIV 18
peptide pools) scoring higher in the fresh than in the frozen, compared to CEF responses, 19
which likely represent memory T cell responses to childhood CMV and EBV exposure. 20
In addition, CEF response should be entirely CD8 restricted (8-10mer peptides) whereas 21
the responses to Env, Pol and Nef are mediated by both CD4 and CD8 T cell responses 22
(15-mer peptides). 23
ACCEPTED
on August 26, 2018 by guest
http://cvi.asm.org/
Dow
nloaded from

15
1
DISCUSSION 2
The IAVI Core and partner laboratories regularly participate in ELISPOT internal 3
proficiency panels and external quality assurance (EQA) panels, with the aim of 4
comparing their ability to process PBMC, determine CMV and CEF ELISPOT responses 5
in donor samples and to identify and rectify any technical issues. Using standardized 6
SOPs, equipment and instructions, in which the only difference was method of cell 7
counting, the 3 panels that have been conducted and analyzed to date yielded remarkably 8
concordant ELISPOT results. We have shown that IAVI partner laboratories are able, in 9
the majority of cases, to successfully categorise samples across a range of low, medium 10
and high spot counts, to achieve low backgrounds and to correctly identify non-11
responders. Cell viability and recovery were much tighter and the minimum recoveries 12
much higher than has previously been reported. These laboratories, with one exception, 13
had never done Elispot testing prior to its implementation to support IAVI funded clinical 14
trials. 15
These types of results have not been achieved in previous proficiency panels either 16
among laboratories across organizations in the HIV vaccine field or in other fields such 17
as cancer (4, 11). The ability to determine whether a response is either positive or 18
negative is critical when assessing vaccine immunopotency: i.e., the ability to induce an 19
immune response (6, 8). When multiple laboratories are able to categorise samples in a 20
consistent manner, comparative assessment and decision making between multiple 21
vaccine candidates becomes easier both across and within networks. The use of multiple 22
ACCEPTED
on August 26, 2018 by guest
http://cvi.asm.org/
Dow
nloaded from
16
laboratories will accelerate testing of vaccines and hence, vaccine development, and 1
furthermore, provide robust ELISPOT data capable of distinguishing different response 2
rates and magnitudes. The salient details that enable concordant performances across 3
seven laboratories based in three continents, an objective not achieved previously, are the 4
standardized methods employed and the operators’ familiarity with these methods (11). 5
This includes not only the methods and reagents used in the assay, but also the ELISPOT 6
reader model and settings which are critical for counting spots with the same morphology 7
(12). Methods of shipping, storage, thawing and overnight rest of PBMC have been 8
shown to affect measures of antigen sensitivity and assay performance (4, 7, 8, 17, 18, 9
27). Indeed, other panels have shown an improvement in sensitivity and general 10
performance when some of these factors are standardized in successive panels (11). 11
In addition to the standardized methods used, another significant difference between 12
performance in this panel versus other panels is the quality systems of participating 13
laboratories. All IAVI partner laboratories involved in the testing of IAVI or other 14
network sponsored HIV vaccines undergo carefully integrated training, operate in a 15
GCLP environment, and follow detailed SOPs that necessitate active interpretation of 16
results and recording of incubation times. These aspects result in a highly controlled 17
environment that may not be achieved in all laboratories. In support of this it is prudent 18
to highlight that operator variation, a well known factor in ELISPOT assay variability, 19
was not of note in these panels (12), although consistent differences in ELISPOT counts 20
were obtained from the 2 operators at one laboratory in panel 1 and another in panel 3 21
(data not shown). The backgrounds observed in the panels described in this study were 22
very low, with an overall mean of 6.6 SFC/106 (excluding three out of 323 samples which 23
ACCEPTED
on August 26, 2018 by guest
http://cvi.asm.org/
Dow
nloaded from

17
had >55 SFC/106) , whereas in other proficiency panels numerous laboratories produced 1
high backgrounds that clearly affect the determination of positive responses (11). A 2
possible explanation for high backgrounds may be the serum source. At IAVI, a 3
standardized fetal calf serum is purchased in large volume after pre-screening to ensure 4
both low background and antigen specific responses are supported. 5
Differences were noted across laboratories with respect to viable cell counts, even though 6
they were obtained from the same donor PBMC vials isolated from the same blood draw. 7
These differences were most likely due to the use of different automated counting 8
equipment, some of which performed integrated viable counts and some did not. The 9
number of laboratories per panel using each particular counter does not permit statistical 10
evaluation of this variable, though we note that the differing viable cell counts did not in 11
general correlate with the SFC values, indicating that perhaps differences in recovered 12
cells were related to disparity in numbers of PBMC cryopreserved per vial. In particular 13
cell counting should be standardized across laboratories and the use of automated 14
counters encouraged. The cell counting procedures on these automated counters can be 15
validated and operated under GCLP compliant procedures. We looked at the CV amongst 16
replicate wells as a measure of performance of those laboratories that participated in all 17
three consecutive panels. No marked decrease, or improvement, in CV was noted, 18
probably due to the optimized methods in use since the first panel was conducted. This is 19
supported by the values observed in the first panel, where 36 of the 38 (95%) of the CEF 20
and CMV ELISPOT counts in the range of 50-250 SFC had a CV below 50%, which is 21
low for a biological assay of low magnitude (16, 21). 22
ACCEPTED
on August 26, 2018 by guest
http://cvi.asm.org/
Dow
nloaded from

18
On review of the panel 1 data, it was revealed that one operator was inexperienced at 1
thawing frozen PBMC and encountered difficulties. As a result, improved instructions 2
relating to these aspects, often considered routine in most laboratories, were provided. In 3
the subsequent panels no difficulties with thawing were observed. 4
Regular independent QA testing is a key component of the quality systems required for 5
any test being conducted by IAVI sponsored GCLP compliant laboratories. Given that 6
there is no independent EQA program for ELISPOT assays at present, such as the UK 7
NEQAS CD4 program, the proficiency panel provides a step towards such assurances 8
within the IAVI program. In addition frozen samples from all clinical trials sites are 9
routinely shipped to the IAVI core laboratory in London for independent testing. There 10
remains a need across multiple programs for EQA panels. 11
The disappointing lack of efficacy of the Merck Adenovirus based HIV vaccine candidate 12
lead to a discussion concerning the utility of the IFN-γ ELISPOT assay (26). It is worth 13
noting that the performance and robustness of this assay continue to make it a valid assay 14
of T-cell vaccine immunopotency in early clinical development (6). This paper provides 15
encouraging evidence that when applied using standardized methods, the ELISPOT assay 16
is sensitive and discriminatory, and highly concordant results can be obtained across 17
laboratories located in three different continents. This is encouraging for multi-centre 18
vaccine trials across disciplines, and also for the comparable detection and discernment 19
of cellular immune responses of differential magnitude. 20
21
22
23
ACCEPTED
on August 26, 2018 by guest
http://cvi.asm.org/
Dow
nloaded from
19
Acknowledgments 1
This work was made possible with funding from the International AIDS Vaccine 2
Initiative, including funding from USAID Cooperative Agreement Number: GPO-A-00-3
06-00005-00. The contents of this manuscript are the responsibility of IAVI and do not 4
necessarily reflect the views of USAID or the US government. 5
We would like to also acknowledge N. Baskaran and T. Sekar from the TRC site. 6
ACCEPTED
on August 26, 2018 by guest
http://cvi.asm.org/
Dow
nloaded from

20
1
FIGURE LEGENDS 2
Figure 1. Recovery and Viability of PBMC in each proficiency panel. The two figures 3
demonstrate the recovery and viability of thawed rested PBMC for participating 4
laboratories in each panel. A) The recovery is indicated as a percentage of the viable 5
cells recovered as part of the number of viable thaws frozen. PBMC were cryopreserved 6
in aliquots of ten million PBMC, thus 6 million viable PBMC recovered would represent 7
60% recovery, B) Viability of total PBMC fraction following thaw and rest is indicated. 8
Each point represents a single thawed sample. Boxes represent the inter-quartile range 9
and median, whiskers extend to the largest observation within 1.5 times the inter-quartile 10
range. Laboratory names on the x-axis are identified in the materials and methods. 11
12
13
Figure 2. Laboratory ELISPOT SFC counts for each donor PBMC sample from panels 14
1-3 per specific stimuli. SFC for CEF, CMV and PHA are background subtracted and 15
presented per 1x10⁶ PBMC. A) Mock stimuli B) CEF C) CMV pp65 D) PHA. Each box 16
plot represents all results from a single donor. A single observation represents the mean 17
response from one lab and one operator. X-axis; PBMC ID number. 18
19
Figure 3. Coefficient of variation (%) between replicate wells is shown for two of the 20
laboratories that participated in all 3 panels, in relation to grouped ELISPOT SFC counts 21
for CEF, CMV and PHA. The dotted line represents 70% coefficient of variation. Counts 22
are background subtracted and presented per 1x10⁶ PBMC. Within each sub-group there 23
are up to 3 box-plots, representing, panels 1 to 3, respectively. 24
25
Figure 4. Background subtracted SFC from samples isolated from all post vaccination 26
time points assessed to HIV peptide pools during an HIV-1 vaccine trial. Freshly isolated 27
PBMC were used in Nairobi and responses (y-axis) correlated to thawed frozen PBMC in 28
the assay performed at the IAVI Core in London (x-axis). Spearman’s correlation 29
ACCEPTED
on August 26, 2018 by guest
http://cvi.asm.org/
Dow
nloaded from

21
coefficient (%) is also shown and is statistically significant for all peptide pools 1
(p<0.0001 for all except Pol B1 where p=0.0180). Regression lines were calculated only 2
on positive responses (i.e., background-subtracted response>0). 3
ACCEPTED
on August 26, 2018 by guest
http://cvi.asm.org/
Dow
nloaded from

22
Table 1: Design of proficiency panels 1-3 1
PP 1 PP 2 PP 3
Participating
laboratories
Core, Oxford, CLS,
KAVI, UVRI
Core, Oxford, CLS,
KAVI, UVRI, NARI
Core, Oxford, CLS, KAVI,
UVRI, NARI, TRC
# PBMC samples 6 3 8
Plate types 1 self-coated 1 pre-, 1 self-coated 1 pre-, 1 self-coated
Counting methods
employed*
Z1 Coulter counter (4 labs),
haemocytometer (1 lab)
Z1 Coulter counter (1 lab),
haemocytometer (1 lab),
Vi-CELL XR counter (3
labs)
Guava counter (1 lab)
Z1 Coulter counter (1 lab),
haemocytometer (1 lab),
Vi-CELL XR counter (4
labs)
Guava counter (1 lab)
Stimuli Mock, HIV peptides, CEF,
CMV, PHA
Mock, CEF, CMV, PHA Mock, CEF, CMV, PHA
• To obtain viable cell counts with the Z1 Coulter counter a haemocytometer and 2
trypan blue staining were also used. 3 ACCEPTED
on August 26, 2018 by guest
http://cvi.asm.org/
Dow
nloaded from
23
1
Table 2. Comparison of recovery and viability of PBMC thawed as part of proficiency 2
panel participation or at the Core Laboratory for assessment of immunological responses 3
of clinical trial specimens. 4
5
6
7
8
9
10 11
12
13
14
15
RECOVERY VIABILITY
Percentiles Percentiles Site N Mean SD
Median 5th
95th
Mean SD
Median 5th
95th
Proficiency Panels
CLS 34 77 23 75 50 120 91 3.9 91 82 95
TRC 16 65 25 64 35 121 95 2.1 96 90 98
Core Lab 34 91 25 83 60 142 95 2.7 96 89 98
KAVI 34 81 28 73 50 136 91 4.4 92 81 98
NARI 22 91 21 89 58 127 98 1.6 98 96 100
Oxford 33 88 27 78 56 130 94 3.4 96 86 98
UVRI 34 76 26 69 46 123 96 1.5 96 93 99
Total 207 82 26 78 48 130 94 3.9 95 86 99
Clinical Trial Data
CLS 512 62 33 60 20 120 90 7.5 91 75 98
TRC 431 61 18 60 33 93 93 4.4 93 86 98
KAVI 426 74 21 70 40 110 92 4.4 93 85 97
NARI 233 77 30 70 40 130 91 6.1 93 77 97
Oxford 121 58 21 60 20 90 93 7.3 95 82 98
UVRI 369 65 17 60 40 90 92 6.0 93 82 97
Total 2092 66 25 65 30 110 91 6.0 93 81 97
ACCEPTED
on August 26, 2018 by guest
http://cvi.asm.org/
Dow
nloaded from

24
1
REFERENCES 2
3
4
1. Betts, M., J. Casazza, and R. Koup. 2001. Monitoring HIV-specific CD8+ T 5
cell responses by intracellular cytokine production. Immunol Lett 79: p117-25. 6
2. Borrow, P., H. Lewicki, X. Wei, M. S. Horwitz, N. Peffer, H. Meyers, J. A. 7
Nelson, J. E. Gairin, B. H. Hahn, M. B. Oldstone, and G. M. Shaw. 1997. 8
Antiviral pressure exerted by HIV-1-specific cytotoxic T lymphocytes (CTLs) 9
during primary infection demonstrated by rapid selection of CTL escape virus 10
[see comments]. Nat Med 3:205-11. 11
3. Britten, C. M., S. Janetzki, S. H. van der Burg, C. Gouttefangeas, and A. 12
Hoos. 2008. Toward the harmonization of immune monitoring in clinical trials: 13
quo vadis? Cancer Immunol Immunother 57:285-8. 14
4. Cox, J. H., G. Ferrari, S. Kalams, W. Lopaczynski, N. Oden, M. P. D'Souza, 15
and E. C. S. Group. 2005. Results of an ELISPOT Proficiency Panel Conducted 16
in 11 Laboratories Participating in International Human Immunodeficiency Virus 17
Type 1 Vaccine trials. AIDS res Hum Retroviruses 21:68-81. 18
5. Currier, J., E. Kuta, E. Turk, L. Earhart, L. Loomis-Price, S. Janetzki, G. 19
Ferrari, D. Birx, and J. Cox. 2002. A panel of MHC class I restricted viral 20
peptides for use as a quality control for vaccine trial ELISPOT assays. J Immunol 21
Methods 260:157-72. 22
ACCEPTED
on August 26, 2018 by guest
http://cvi.asm.org/
Dow
nloaded from
25
6. D'Souza, M. P., and M. Altfeld. 2008. Measuring HIV Specific T Cell 1
Immunity: How Valid Are Current Assays? J Infect Dis 197:337-339. 2
7. Disis, M. L., C. Dela Rosa, V. Goodell, L. Y. Kuan, J. C. Chang, K. Kuus-3
Reichel, T. M. Clay, H. Kim Lyerly, S. Bhatia, S. A. Ghanekar, V. C. Maino, 4
and H. T. Maecker. 2005. Maximizing the retention of antigen specific 5
lymphocyte function after cryopreservation. J Immunol Methods 13:13-18. 6
8. Dubey, S., J. Clair, T. M. Fu, L. Guan, R. Long, R. Mogg, K. Anderson, K. B. 7
Collins, C. Gaunt, V. R. Fernandez, L. Zhu, L. Kierstead, S. Thaler, S. B. 8
Gupta, W. Straus, D. Mehrotra, T. W. Tobery, D. R. Casimiro, and J. W. 9
Shiver. 2007. Detection of HIV vaccine-induced cell-mediated immunity in HIV-10
seronegative clinical trial participants using an optimized and validated enzyme-11
linked immunospot assay. J Acquir Immune Defic Syndr 45:20-7. 12
9. Fauce, S. R., O. O. Yang, and R. B. Effros. 2007. Autologous CD4/CD8 co-13
culture assay: A physiologically-relevant composite measure of CD8(+) T 14
lymphocyte function in HIV-infected persons. J Immunol Methods 327:75-81. 15
10. Goonetilleke, N., S. Moore, L. Dally, N. Winstone, I. Cebere, A. Mahmoud, S. 16
Pinheiro, G. Gillespie, D. Brown, V. Loach, J. Roberts, A. Guimaraes-17
Walker, P. Hayes, K. Loughran, C. Smith, J. De Bont, C. Verlinde, D. Vooijs, 18
C. Schmidt, M. Boaz, J. Gilmour, P. Fast, L. Dorrell, T. Hanke, and A. J. 19
McMichael. 2006. Induction of Multifunctional Human Immunodeficiency Virus 20
Type 1 (HIV-1)-Specific T Cells Capable of Proliferation in Healthy Subjects by 21
Using a Prime-Boost Regimen of DNA- and Modified Vaccinia Virus Ankara-22
ACCEPTED
on August 26, 2018 by guest
http://cvi.asm.org/
Dow
nloaded from

26
Vectored Vaccines Expressing HIV-1 Gag Coupled to CD8+ T-Cell Epitopes. J. 1
Virol. 80:4717-4728. 2
11. Janetzki, S., K. S. Panageas, L. Ben-Porat, J. Boyer, C. M. Britten, T. M. 3
Clay, M. Kalos, H. T. Maecker, P. Romero, J. Yuan, W. M. Kast, and A. 4
Hoos. 2008. Results and harmonization guidelines from two large-scale 5
international Elispot proficiency panels conducted by the Cancer Vaccine 6
Consortium (CVC/SVI). Cancer Immunol Immunother 57:303-15. 7
12. Janetzki, S., S. Schaed, N. E. Blachere, L. Ben-Porat, A. N. Houghton, and K. 8
S. Panageas. 2004. Evaluation of Elispot assays: influence of method and 9
operator on variability of results. J Immunol Methods 291:175-83. 10
13. Jin, X., D. Bauer, S. Tuttleton, S. Lewin, A. Gettie, J. Blanchard, C. Irwin, J. 11
Safrit, J. Mittler, L. Weinberger, L. Kostrikis, L. Zhang, A. Perelson, and D. 12
Ho. 1999. Dramatic rise in plasma viremia after CD8(+) T cell depletion in 13
simian immunodeficiency virus-infected macaques. J Exp Med 189:991-8. 14
14. Klausner, R. D., A. S. Fauci, L. Corey, G. J. Nabel, H. Gayle, S. Berkley, B. 15
F. Haynes, D. Baltimore, C. Collins, R. G. Douglas, J. Esparza, D. P. Francis, 16
N. K. Ganguly, J. L. Gerberding, M. I. Johnston, M. D. Kazatchkine, A. J. 17
McMichael, M. W. Makgoba, G. Pantaleo, P. Piot, Y. Shao, E. Tramont, H. 18
Varmus, and J. N. Wasserheit. 2003. The Need for a Global HIV Vaccine 19
Enterprise. Science 300:2036-2039. 20
15. Koup, R. A., J. T. Safrit, Y. Cao, C. A. Andrews, G. McLeod, Borkwosky., C. 21
Farthing, and D. D. Ho. 1994. Temporal association of cellular immune 22
ACCEPTED
on August 26, 2018 by guest
http://cvi.asm.org/
Dow
nloaded from

27
responses with the initial viremia in primary human immunodeficiency virus type 1
1 syndrome. J. Virol. 68:4650-4655. 2
16. Maecker, H. T., J. Hassler, J. K. Payne, A. Summers, K. Comatas, M. 3
Ghanayem, M. A. Morse, T. M. Clay, H. K. Lyerly, S. Bhatia, S. A. 4
Ghanekar, V. C. Maino, C. Delarosa, and M. L. Disis. 2008. Precision and 5
linearity targets for validation of an IFNgamma ELISPOT, cytokine flow 6
cytometry, and tetramer assay using CMV peptides. BMC Immunol 9:9. 7
17. Maecker, H. T., J. Moon, S. Bhatia, S. A. Ghanekar, V. C. Maino, J. K. 8
Payne, K. Kuus-Reichel, J. C. Chang, A. Summers, T. M. Clay, M. A. Morse, 9
H. K. Lyerly, C. DeLaRosa, D. P. Ankerst, and M. L. Disis. 2005. Impact of 10
cryopreservation on tetramer, cytokine flow cytometry, and ELISPOT. BMC 11
Immunol 6:17. 12
18. Malyguine, A., S. L. Strobl, K. A. Shafer-Weaver, T. Ulderich, A. Troke, M. 13
Baseler, L. W. Kwak, and S. S. Neelapu. 2004. A modified human ELISPOT 14
assay to detect specific responses to primary tumor cell targets. J Transl Med 2:9. 15
19. McElrath, M. J., R. F. Siliciano, and K. J. Weinhold. 1997. HIV Type 1 16
Vaccine-induced cytotoxic T cell responses in phase I clinical trials: detection, 17
characterization and quantitation. AIDS Research and human Retroviruses 18
13:211-216. 19
20. Mwau, M., A. McMichael, and T. Hanke. 2002. Design and validation of an 20
enzyme-linked immunospot assay for use in clinical trials of candidate HIV 21
vaccines. AIDS Res Hum Retroviruses 18:611-8. 22
ACCEPTED
on August 26, 2018 by guest
http://cvi.asm.org/
Dow
nloaded from

28
21. Nomura, L. E., J. M. Walker, and H. T. Maecker. 2000. Optimization of whole 1
blood antigen-specific cytokine assays for CD4(+) T cells. Cytometry 40:60-8. 2
22. Peters, B. S., W. Jaoko, E. Vardas, G. Panayotakopoulos, P. Fast, C. 3
Schmidt, J. Gilmour, M. Bogoshi, G. Omosa-Manyonyi, L. Dally, L. 4
Klavinskis, B. Farah, T. Tarragona, P. A. Bart, A. Robinson, C. Pieterse, W. 5
Stevens, R. Thomas, B. Barin, A. J. McMichael, J. A. McIntyre, G. Pantaleo, 6
T. Hanke, and J. Bwayo. 2007. Studies of a prophylactic HIV-1 vaccine 7
candidate based on modified vaccinia virus Ankara (MVA) with and without 8
DNA priming: effects of dosage and route on safety and immunogenicity. 9
Vaccine 25:2120-7. 10
23. Russell, N. D., M. G. Hudgens, R. Ha, C. Havenar-Daughton, and M. J. 11
McElrath. 2003. Moving to HIV-1 Vaccine Efficacy Trials: Defining T cell 12
Responses as Potential Correlates of Immunity. J Infect Dis 187:226-242. 13
24. Sacha, J. B., C. Chung, E. G. Rakasz, S. P. Spencer, A. K. Jonas, A. T. Bean, 14
W. Lee, B. J. Burwitz, J. J. Stephany, J. T. Loffredo, D. B. Allison, S. Adnan, 15
A. Hoji, N. A. Wilson, T. C. Friedrich, J. D. Lifson, O. O. Yang, and D. I. 16
Watkins. 2007. Gag-Specific CD8+ T Lymphocytes Recognize Infected Cells 17
before AIDS-Virus Integration and Viral Protein Expression. J Immunol 18
178:2746-2754. 19
25. Schmitz, J. E., R. P. Johnson, H. M. McClure, K. H. Manson, M. S. Wyand, 20
M. J. Kuroda, M. A. Lifton, R. S. Khunkhun, K. J. McEvers, J. Gillis, M. 21
Piatak, J. D. Lifson, G. Grosschupff, P. Racz, K. Tenner-Racz, E. P. Rieber, 22
K. Kuus-Reichel, R. S. Gelman, N. L. Letvin, D. C. Montefiori, R. M. 23
ACCEPTED
on August 26, 2018 by guest
http://cvi.asm.org/
Dow
nloaded from

29
Ruprecht, R. C. Desrosiers, and K. A. Reimann. 2005. Effect of CD8+ 1
lymphocyte depletion on virus containment after simian immunodeficiency virus 2
SIVmac251 challenge of live attenuated SIVmac239delta3-vaccinated rhesus 3
macaques. J Virol 79:8131-41. 4
26. Sekaly, R. P. 2008. The failed HIV Merck vaccine study: a step back or a 5
launching point for future vaccine development? J Exp Med 205:7-12. 6
27. Smith, J. G., H. R. Joseph, T. Green, J. A. Field, M. Wooters, R. M. 7
Kaufhold, J. Antonello, and M. J. Caulfield. 2007. Establishing Acceptance 8
Criteria for Cell-Mediated-Immunity Assays Using Frozen Peripheral Blood 9
Mononuclear Cells Stored under Optimal and Suboptimal Conditions. Clin. 10
Vaccine Immunol. 14:527-537. 11
28. Stiles, T., V. Grant, and T. Mawbey. 2003. Good Clinical Laboratory Practice 12
(GCLP). A quality system for laboratories that undertake the analysis of samples 13
from clinical trials, p. 1-18. British Association of Research Quality Assurance. 14
29. Tobery, T. W., S. A. Dubey, K. Anderson, D. C. Freed, K. S. Cox, J. Lin, M. 15
T. Prokop, K. J. Sykes, R. Mogg, D. V. Mehrotra, T. M. Fu, D. R. Casimiro, 16
and J. W. Shiver. 2006. A comparison of standard immunogenicity assays for 17
monitoring HIV type 1 gag-specific T cell responses in Ad5 HIV Type 1 gag 18
vaccinated human subjects. AIDS Res Hum Retroviruses 22:1081-90. 19
30. Vuola, J. M., S. Keating, D. P. Webster, T. Berthoud, S. Dunachie, S. C. 20
Gilbert, and A. V. S. Hill. 2005. Differential Immunogenicity of Various 21
Heterologous Prime-Boost Vaccine Regimens Using DNA and Viral Vectors in 22
Healthy Volunteers. J Immunol 174:449-455. 23
ACCEPTED
on August 26, 2018 by guest
http://cvi.asm.org/
Dow
nloaded from

30
31. Whiteside, T. L., Y. Zhao, T. Tsukishiro, E. M. Elder, W. Gooding, and J. 1
Baar. 2003. Enzyme-linked Immunospot, Cytokine Flow Cytometry, and 2
Tetramers in the Detection of T-Cell Responses to a Dendritic Cell-based 3
Multipeptide Vaccine in Patients with Melanoma. Clin Cancer Res 9:641-649. 4
5
6
ACCEPTED
on August 26, 2018 by guest
http://cvi.asm.org/
Dow
nloaded from

<=60
70
80
90
100
1 2 3 1 2 3 1 2 3 1 2 3 1 2 3 1 2 3 1 2 3
0
10
20
30
40
50
60
70
80
90
100
110
120
130
140
150
160
170
>=180
1 2 3 1 2 3 1 2 3 1 2 3 1 2 3 1 2 3 1 2 3
Pe
rcen
t
Recovery Viability
CLS Core KAVI Oxford UVRI NARI TRC Lab
CLS Core KAVI Oxford UVRI NARI TRC Lab
Figure 1
ACCEPTED on A
ugust 26, 2018 by guesthttp://cvi.asm
.org/D
ownloaded from

Figure 2S
FU
/mill
ion
<=10
100
1000
10000
Sample #
1 2 3 4 5 6 7 8 9 10 11 12 13 14 15 16 17
PANEL 1 PANEL 2 PANEL 3
SF
U/m
illio
n
<=10
100
1000
10000
Sample #
1 2 3 4 5 6 7 8 9 10 11 12 13 14 15 16 17
PANEL 1 PANEL 2 PANEL 3
SF
U/m
illio
n
<=10
100
1000
10000
Sample #
1 2 3 4 5 6 7 8 9 10 11 12 13 14 15 16 17
PANEL 1 PANEL 2 PANEL 3
SF
U/m
illio
n
<=10
100
1000
10000
Sample #
1 2 3 4 5 6 7 8 9 10 11 12 13 14 15 16 17
PANEL 1 PANEL 2 PANEL 3
A = MOCK
C = CMV
B = CEF
D = PHA ACCEPTED on A
ugust 26, 2018 by guesthttp://cvi.asm
.org/D
ownloaded from

Figure 3
1
10
100
1000
1
10
100
1000
Coe
ffic
ient
of V
aria
tion (
%)
UVRI Core Lab
≤10 >10 >50 >100 >250 >500 >1000 >2000 >3000
SFC/million ≤10 >10 >50 >100 >250 >500 >1000 >2000 >3000
SFC/million
ACCEPTED on A
ugust 26, 2018 by guesthttp://cvi.asm
.org/D
ownloaded from

KA
VI
(SF
U/m
illio
n)
10
100
1000
10000
Core Lab (SFU/million)
10 100 1000 10000
KA
VI
(SF
U/m
illio
n)
10
100
1000
10000
Core Lab (SFU/million)
10 100 1000 10000
KA
VI
(SF
U/m
illio
n)
10
100
1000
10000
Core Lab (SFU/million)
10 100 1000 10000
KA
VI
(SF
U/m
illio
n)
10
100
1000
10000
Core Lab (SFU/million)
10 100 1000 10000
KA
VI
(SF
U/m
illio
n)
10
100
1000
10000
Core Lab (SFU/million)
10 100 1000 10000K
AV
I (S
FU
/mill
ion
)
10
100
1000
10000
Core Lab (SFU/million)
10 100 1000 10000
Env A (N=50, 64%, p<.0001) Env B (N=59, 68%, p<.0001) Pol B1 (N=15, 50%, p=0.0562)
Pol B2 (N=16, 52%, p=0.0400) NEF (N=31, 55%, p=0.0012) CEF (N=99, 71%, p<.0001)
Figure 4
ACCEPTED on A
ugust 26, 2018 by guesthttp://cvi.asm
.org/D
ownloaded from