Embed Size (px)
Citation preview

1
MEASURING STRATEGIC BUSINESS-IT ALIGNMENT
Elisa van Hout, BSc.
February 2012

2

3
MEASURING STRATEGIC BUSINESS‐IT ALIGNMENT ON THE CONSTRUCTION AND VALIDATION OF A MEASUREMENT MODEL FOR STRATEGIC BUSINESS‐IT ALIGNMENT
Elisa van Hout, BSc.
Master’s thesis for
Eindhoven University of Technology
Department of Mathematics and Computer Science
Programme: Business Information Systems
Den Dolech 2
5612 AZ Eindhoven
Facilitated by
KPMG Advisory N.V.
Management Consulting ‐ IT Project Advisory
Laan van Langerhuize 1
1186 DS Amstelveen
Supervised by
Dr. ir. Jos Trienekens, Eindhoven University of Technology
Ir. Harold Weffers PDEng, Eindhoven University of Technology
Drs. Alex Brouwer, KPMG
Ir. Jan Willem van Houwelingen, KPMG
16 February 2012

4

5
DISCLAIMER
This research project has been facilitated by KPMG Advisory N.V.. However, KPMG Advisory
N.V. does not hold any responsibility for the correctness of the data, reviews, conclusions
and recommendations, which are the sole responsibility of the author.

6
7
MANAGEMENT SUMMARY
Information technology has come to play a crucial role in the support, sustainability and growth of
organisations. Because of this, there is a bigger focus on managing IT projects. For these IT projects, it is
important that they deliver good value for the organisation. In order to accomplish this, the projects need to
be in connection with the business side of the organisation. The process of managing and improving this
connection is called strategic alignment. Many studies on the effects of strategic alignment have been
performed. In short, they support the hypothesis that organisations that have successfully aligned their
business and IT outperform organisations that do not, for example by maximising the return on IT investments
and an improved competitive position.
But even though strategic alignment of business and IT has proven to be very important, many organisations
still struggle with it. It appears that selecting and prioritising IT projects is experienced as a burden by
managers. For a number of years already, business‐IT alignment is regarded by IT executives as one of their
key issues.
As it is considered to be a key issue, much research has been carried out on the topic of strategic alignment.
However, one of the main points of criticism on the existing research is that it is too theoretical and fails to
capture real life. Simply put, the theoretical models that deal with the various aspects of strategic alignment
are not deemed usable in practice.
This gap between theory and practice is the focus of this research project. In order to bridge this gap, the goal
of this project was to construct the basis for a measurement method for strategic alignment. This method is
based on existing theory, but usable in practice, thus bridging the existing gap between the two.
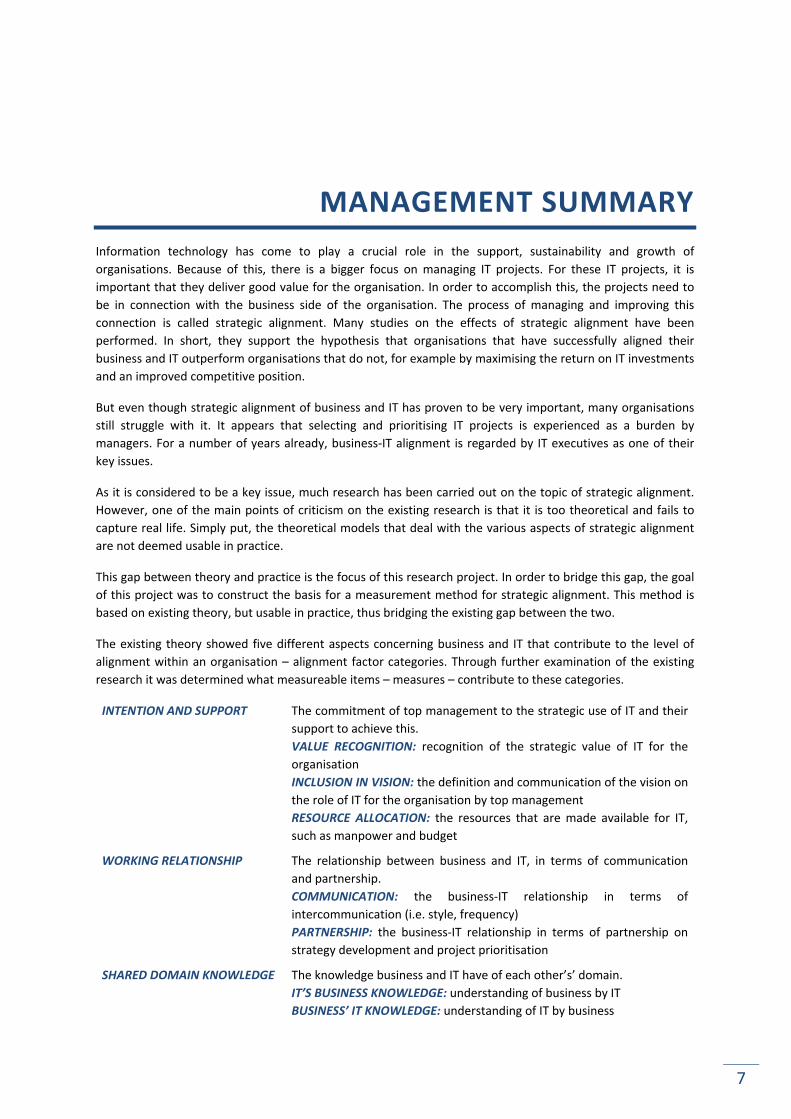
The existing theory showed five different aspects concerning business and IT that contribute to the level of
alignment within an organisation – alignment factor categories. Through further examination of the existing
research it was determined what measureable items – measures – contribute to these categories.
INTENTION AND SUPPORT The commitment of top management to the strategic use of IT and their
support to achieve this.
VALUE RECOGNITION: recognition of the strategic value of IT for the
organisation
INCLUSION IN VISION: the definition and communication of the vision on
the role of IT for the organisation by top management
RESOURCE ALLOCATION: the resources that are made available for IT,
such as manpower and budget
WORKING RELATIONSHIP The relationship between business and IT, in terms of communication
and partnership.
COMMUNICATION: the business‐IT relationship in terms of
intercommunication (i.e. style, frequency)
PARTNERSHIP: the business‐IT relationship in terms of partnership on
strategy development and project prioritisation
SHARED DOMAIN KNOWLEDGE The knowledge business and IT have of each other’s’ domain.
IT’S BUSINESS KNOWLEDGE: understanding of business by IT
BUSINESS’ IT KNOWLEDGE: understanding of IT by business

8
IT PROJECTS AND PLANNING The connection IT projects and planning have with the business.
SPONSORING: business sponsoring for IT projects
LINKAGE: the extent of linkage between business and IT plans
PRIORITISATION: adequacy of project prioritisation
IT PERFORMANCE The performance of the IT department, concerning the position amongst
competitors and the perception of IT by the business, and structures to
stimulate performance.
INNOVATION: technological leadership amongst competitors and
stimulation of creativity
RELIABILITY: reliability of the IT department, in terms of meeting
business needs and made commitments
OPPORTUNITIES: presence of structures for IT to improve performance
and alignment
A case study was carried out at five medium to large‐sized organisations, operating in the financial sector, to
examine if these alignment factor categories and measures can be used in the measurement of strategic
alignment. A number of different aspects were investigated in the case study: the completeness of the
measurement method, the relation of the measurement method with strategic alignment in practice, and the
actual measurement results.
Overall, these aspects show that there is need for further refinement of the measurement method, but also
that the alignment factor categories seem to form a good basis for the measurement of strategic alignment.
The categories show a relation to strategic alignment in practice. Furthermore, no need to alter or add new
categories presented itself.
All participating organisations, labelled A to E, were rated on a scale of 1 to 5 for all alignment factor
categories ad measures. Results for the five organisations, per alignment factor category are presented in the
graph below:
Of all the ratings assigned for the participating organisation, the following measures received the best and worst ratings on average:
Best‐rated measures:
1. Linkage (IT projects and planning )
2. IT’s business knowledge (Shared domain
knowledge)
3. Communication (Working relationship)
Worst‐rated measures:
1. Business’ IT knowledge (Shared domain
knowledge)
2. Opportunities (IT performance)
3. Value recognition (Intention and support)
0
1
2
3
4
5
Intention andsupport
Workingrelationship
Shared domainknowledge
IT projects andplanning
IT performance
A
B
C
D
E
9
TABLE OF CONTENTS
Management summary ................................................................................................................................ 7
1. Introduction ....................................................................................................................................... 11
1.1. Structure of the report ........................................................................................................................ 11
2. Research outline ................................................................................................................................. 13
2.1. Problem description ............................................................................................................................ 13 2.2. Goal ...................................................................................................................................................... 15 2.3. Research questions .............................................................................................................................. 15 2.4. Research strategy ................................................................................................................................ 15
3. Research method................................................................................................................................ 19
3.1 Theoretical research ............................................................................................................................ 19 3.2. Case study ............................................................................................................................................ 20
4. Strategic alignment............................................................................................................................. 25
4.1. Definitions ............................................................................................................................................ 25 4.2. Models and frameworks ...................................................................................................................... 27 4.3. Alignment factors ................................................................................................................................ 34
5. Measuring strategic alignment ............................................................................................................ 37
5.1. Outline ................................................................................................................................................. 37 5.2. Alignment factor categories ................................................................................................................ 37 5.3. Measures and ratings .......................................................................................................................... 44 5.4. Interview questions ............................................................................................................................. 58 5.5. Recapitulation ...................................................................................................................................... 59
6. Case study .......................................................................................................................................... 61
6.1. Outline ................................................................................................................................................. 61 6.2. Case descriptions ................................................................................................................................. 62 6.3. Results.................................................................................................................................................. 63 6.4. Evaluation ............................................................................................................................................ 73 6.5. Findings ................................................................................................................................................ 80
7. Conclusion .......................................................................................................................................... 83
7.1. Research conclusions ........................................................................................................................... 83 7.2. Limitations ........................................................................................................................................... 86 7.3. Future research .................................................................................................................................... 86
Acknowledgements .................................................................................................................................... 87
Bibliography .............................................................................................................................................. 89
List of figures ............................................................................................................................................. 93
Glossary ..................................................................................................................................................... 95
10
Appendices ................................................................................................................................................ 97
A. Theoretical research: search strategies ................................................................................................... 97 B. Case study: details on validity.................................................................................................................. 98 C. Strategic Alignment Model: alignment perspectives ............................................................................... 99 D. Strategic Alignment Maturity Model: alignment characteristics ........................................................... 102 E. Used studies on alignment factors ........................................................................................................ 105 F. Background on construction of alignment factor categories ................................................................ 110 G. Grouping of alignment factors ............................................................................................................... 111 H. Listing of constructed measures and ratings ......................................................................................... 113 I. Details on interviews ............................................................................................................................. 117 J. Case study results: Measurement results .............................................................................................. 122

11
1. INTRODUCTION This research project is the conclusion of the Master’s programme Business Information Systems at the
Eindhoven University of Technology. This Master’s programme is a joint programme between the department
of Mathematics and Computer Science, and the department of Industrial Engineering and Innovation Sciences.
This graduation project took place at the Information Systems capacity group of the department Industrial
Engineering and Innovation Sciences.
The project was facilitated by KPMG, which is a network of member firms, offering audit, tax and advisory
services for their clients. These clients include business corporations, governments and public sector agencies
and non‐profit organisations. KPMG is located in over 150 countries, with over a 138,000 employees.
1.1. STRUCTURE OF THE REPORT
This document is divided into a number of chapters, each discussing a different aspect of this research project.
In short, the core content of the report is structured as shown in the table below. Subsequent to this core
content, the bibliography, a list of figures, the glossary and a number of appendices can be found.
Chapter Pages Content
2 13‐18
Describes the outline of the research in terms of the problem description, the
goal of the project, research questions and a general strategy on how these
questions are answered.
3 19‐24
Full description of the method used to carry out the theoretical research and
case study included in this project. For both types of research, the validity of
the research carried out was also taken into account and detailed on.
4 25‐36
Results of theoretical research. This concerns concern three topics: the
definition of strategic alignment, models and frameworks for strategic
alignment, and factors impacting strategic alignment.
5 37‐60 Describes the construction process of a measurement method for strategic
alignment and its results
6 61‐82
Provides details and results of the case study carried out for this project. This
chapter contains details such as the cases itself, analyses of the cases and the
consequences for the constructed measurement method.
7 83‐86 All the answers to the research questions are presented, along with limitations
of the results and suggestions for future research.

12

13
2. RESEARCH OUTLINE This chapter describes the outline of the research in terms of the problem description, the goal of the project,
research questions and a general strategy on how these questions were answered.
2.1. PROBLEM DESCRIPTION
Information technology1 has come to play a crucial role in the support, sustainability and growth of
organisations (Haes & Grembergen, 2008). Because of this, there is a bigger focus on managing IT projects. For
these IT projects, it is important that they deliver good value for the organisation. In order to accomplish this,
the projects need to be in connection with the business side of the organisation. The process of managing and
improving this connection is called strategic alignment. Good alignment between business and IT contributes
to the success of an organisation in various ways. Avison et al. (2004) point out the following benefits of good
alignment:
- “Maximising the return value from IT investments”;
- “A better competitive position through information systems”;
- “Providing direction and flexibility to react to change”.
The opposite also holds: a lack of alignment between business and IT can seriously harm a business’
performance (Avison, et al., 2004).
Many other studies on the effects of strategic alignment have been performed. In short, they support the
hypothesis that organisations that have successfully aligned their business and IT outperform organisations
that do not (Chan & Reich, 2007).
Examples of the effects of alignment and misalignment can be found in practice:
- Citigroup is one of world’s leading financial services companies. In 2010, they set out to dramatically
reduce their time to market by accelerating development cycles for the company’s 20,000 (internal)
application developers. Typically, they had to wait up to 45 days for server resources to be
provisioned. Citigroup began looking for a smarter approach to service delivery. One of these
approaches was the automation and speeding up of the procedure for requesting and provisioning
development servers for writing and test code.
Improving time to market has always been the primary driver to create this solution; it was one of the
key complaints from the development community. It made the company look at the process of server
provisioning, and eventually the adaptation of a new technology. By implementing this technology,
provisioning time was reduces from 45 days to less than 20 minutes.
(IBM Corporation, 2011)
1 The scope of what is meant with IT is not unequivocal. Some make the distinction between IT, ICT and Information systems, but others do not. For clarity purposes, the term information technology is included in the glossary of this report to pin down what IT means in this report.

14
- Because of the increasing fuel prices, global logistics leaders are looking into developing technology
that will help them to cut costs as well as decrease the impact on the environment.
UPS, the world’s largest logistics corporation has over a 10,000 delivery vehicles on the road. If each
vehicle would save even a few minutes of time and a few dollars’ worth of fuel each day, this would
result in massive saving for such a large company.
By using telematics technology, that is exactly what UPS did. The use of this technology helps in
making smarter choices for maintenance and the running of the company’s trucks. A test showed that
the amount of time trucks idled was reduced by 24 minutes per driver per day, resulting in fuel
savings of 188 US dollars per driver per year. For the total of 90,000 US package drivers, the resulting
annual savings would figure over 16,000,000 US dollars.
(Industry Leaders Magazine, 2011)
- The Dutch tax administration (Dutch: Belastingdienst) has a history of problems with their IT. For
example, in 2007 the administration lost data from about 400,000 companies, which meant that
550,000 companies had to resubmit their yearly data on wages. Estimated costs: at least EUR 200
million.
Another example is the assignation of financial compensations (Dutch: huur‐, zorg‐ en
kinderopvangtoeslag). Miscommunications between different systems caused the administration to
not be able to properly determine the compensations. Because of this, advances were paid out based
on information supplied by the applicants themselves, without screening. This brings along high risks.
For example, the yearly budget from the year before was exceeded with EUR 100 million, without a
known cause.
Due to another technical problem, 730,000 people had to resubmit their yearly income taxes in 2008.
After this, the entire organisation was investigated and the following conclusions were drawn:
- Wrong priorities were established: The administration was looking for solutions through IT,
while the basis of the organisation itself was flawed;
- The IT‐structure was too complex and unprofessional;
- The was too little IT knowledge amongst the managers in the IT department;
- The IT costs had to be reduced and made more transparent.
In short, the tremendous financial losses were caused by the misalignment of business and IT within
the organisation.
(NRC Handelsblad, 2008) (FEM Business & Finance, 2007) (Computable, 2011)
Even though strategic alignment of business and IT has proved to be very important, many organizations still
struggle with it. It appears that selecting and prioritizing is experienced as a burden by managers (Moonen, et
al., 2008). For a number of years already, business and IT alignment is regarded by IT executives as one of their
‘key issues’ (Luftman et al., 2004, 2005, 2006, 2008, 2009, 2010)2.
In order to better deal with this, there is a need for a usable method for organisations to deal with the
different aspects of strategic alignment.
Though many models have been developed for strategic alignment, one of the main points of criticism on the
existing research is that it is too theoretical and fails to capture real life (Chan & Reich, 2007). Simply put, the
theoretical models that deal with the various aspects of strategic alignment are not usable in practice.
This gap between theory and practice is the focus of this research project, in particular on the measurement of
strategic alignment.
2 (Luftman & Ephraim, 2004; Luftman & Ephraim, 2004) (Luftman & Ephraim, 2004) (Luftman, 2005) (Luftman, et al., 2006) (Luftman & Kempaiah, 2008) (Luftman, et al., 2009) (Luftman & Ben‐Zvi, 2010) (Luftman & Ben‐Zvi, 2010)

15
2.2. GOAL
As stated in the problem description, there appears to be a gap between strategic alignment in theory, and
strategic alignment in practice. In order to bridge this gap, the goal of this project is to construct (the basis for)
a measurement method for strategic alignment. This method should be based on theory, but usable in
practice, thus bridging the existing gap between the two.
2.3. RESEARCH QUESTIONS
This project covers the following research question:
How can strategic alignment be measured?
To answer the main research question the following questions need to be answered:
1. How is strategic alignment defined?
2. What factors determine the level of strategic alignment?
3. How can each of these factors be measured?
4. Can the measurement of these factors be used in practice to measure strategic alignment in
organisations?
2.4. RESEARCH STRATEGY
In order to answer all of the research questions presented above, both theoretical and empirical research was
carried out. Questions 1‐3 were answered by doing theoretical research, question 4 by doing empirical
research in the form of a case study. Below, a description is given of how each research question was
answered, along with a graphical representation of the process.
1. How is strategic alignment defined?
Different definitions were extracted from existing
literature and compared. Out of the available
literature the most accurate or well‐founded were
selected. If necessary, definitions are combined to
construct an appropriate definition, used
throughout the rest of the project. Also, different
models on strategic alignment were researched in
order to create a better understanding of the
concept strategic alignment.
2. What factors determine the level of strategic
alignment?
In order to measure alignment, we need to know
what factors determine how well an organisation
is aligned. A literature study was carried out to
find these factors. The results were compared and
grouped, in order to create a set of essential
alignment factors.

16
3. How can each of these factors be measured?
The previous research question resulted in a set of
alignment factors extracted from literature. For
each of the factors in this set, a number of
measurement criteria were determined, using the
literature on alignment factors. Besides this,
elements from the different models on strategic
alignment were incorporated where possible, as
well as literature on the measurement of
alignment.
4. Can the measurement of these factors be used in
practice to measure strategic alignment in
organisations?
A measurement tool was constructed using the
measurement criteria resulting from the previous
research question. The tool was validated by a
pilot case, in order to find out whether the use of
the tool provides relevant data on the
measurement criteria. The tool will then be tested
in practice, to determine whether it provides a
proper representation of an organisation’s
alignment and gain additional insights on strategic
alignment in practice. This test was carried out at
5 different organisations.
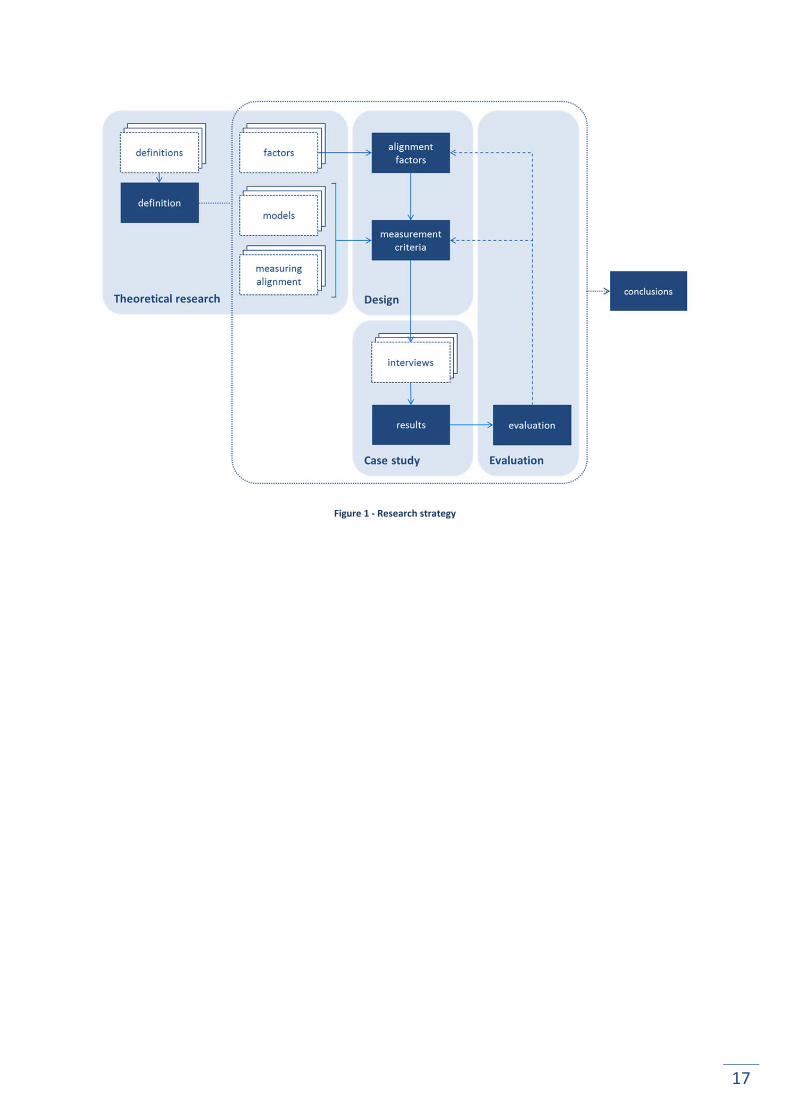
Putting all of these individual strategies together leads to the image below, giving a complete overview of the
layout of the research project.
17
Figure 1 ‐ Research strategy

18

19
3. RESEARCH METHOD
This chapter describes the methods that were used to carry out the theoretical research and the case study
included in this project.
3.1 THEORETICAL RESEARCH
In order to answer the first three research questions in this study theoretical research is required, in the form
of a so‐called desk research, by gathering and synthesising existing research. To ensure the quality of this
research the research method is based on guidelines provided by Kitchenham et al. (Kitchenham & Charters,
2007):
3.1.1. DATA GATHERING
The completeness of the retrieved documents in theoretical, is one of the aspects contributing to the quality
of this research. In order to get a high level of completeness, several search strategies were used by the
author to gather relevant papers. First, a search for keywords. These keywords are the main topics of the
information that is being searched for, but also a number of synonyms. Furthermore, a search for well‐known
authors of papers on strategic alignment was performed. A third strategy used to find relevant papers is the
so‐called snowball effect. Details on all of these strategies can be found in Appendix A of this report.
These different searches resulted in a large collection of possible resources. However, not all articles are
usable or relevant. How the relevant articles were selected is described below.
3.1.2. DATA SELECTION
To select studies from the great number of search results, the main selection criterion was the relevance of
the study to answer the research questions. The sources that resulted were filtered by reading abstracts and
browsing through the document. When an article was found to be relevant for this research project, the
usability was further determined by:
the (type of) authors;
the journal the article was published in / the conference from which the report originated;
the quality of the publication ( i.e. clarity of research aims, sample sizes, credibility of findings);
the publication date;
the number of references to the study.
3.1.3. DATA EXTRACTION AND REPORTING
To answer the research questions, relevant outtakes from the selected studies were tabulated, compared and
synthesised. References to the used sources are documented by using the Harvard system of reference (Anglia
Ruskin University, 2010).

20
3.1.4. VALIDATION
The validity of this research method is provided by the use of the structured method constructed by
Kitchenham et al. (Kitchenham & Charters, 2007). This method ensures that a wide search is performed and
provides quality criteria, thus contributing to the completeness and quality of the research results.
Another validation is provided through the input of experts, who gave feedback on the preliminary findings of
the theoretical research.
3.2. CASE STUDY
Answering the fourth and final research question requires empirical research. We are looking to assess the
usability of the previously determined alignment factors for strategic alignment. This is done through a case
study. Details of this case study are given in this section, by giving the protocol followed when carrying out the
study.
Brereton et al. (2008) used a number of basic case study methodologies to set up a general template for case
study protocols. This template was used to create the protocol for this study. Much of the content of the
protocol was constructed using the work on case study research from Yin (2003).
3.2.1. BACKGROUND
In this part of the research project, the measurement tool for strategic alignment developed in the research
phases preceding this case study was put in practice to assess the validity of the underlying construction. As a
result, we want to know if this construction forms an appropriate basis for the measurement of strategic
alignment, and how it can be improved in future research.
Yin defines the case study as follows:
A case study is an empirical inquiry that
- investigates a contemporary phenomenon within its real‐life context,
especially when
- the boundaries between phenomenon and context are not clearly evident.
Source: (Yin, 2003)
Applying this definition to our research goal we get the following:
‐ The phenomenon in question is strategic alignment. As we are looking at alignment in practice and at
the state of alignment as is, we are looking at a contemporary phenomenon in its real‐life context.
‐ Furthermore, we are trying to establish whether the factors and criteria found in the theoretical part
of the study, do in fact give a representative image of the strategic alignment in an organisation. This
implies that the boundaries between phenomenon and its context are not yet evident.
Considering this, a qualitative case study seems an appropriate research strategy for this project.

21
3.2.2. GOAL
The goal of this case study is to answer the fourth research question of this project, namely: “Can the
measurement of these factors be used in practice to measure strategic alignment in organisations?” In this
question, “these” refers to the alignment factors categories that are set up in the design phase of this project.
Because of time and resource constraints, it was not possible to perform a full validation of the method, but
nevertheless it can reveal whether the underlying principles of this method, the alignment factor categories,
provide a good basis for further research and development.
3.2.3. DESIGN
Taking the statement below into account, this case study consists of multiple cases. For each of these cases
the strategic alignment was examined for the organisation as a whole, making this a holistic multiple‐case
design (Yin, 2003, p. 40).
[..] when you have the choice, multiple‐case designs may be preferred over single‐case
designs. [..] Single‐case designs are vulnerable if only because you will have put ‘all your
eggs in one basket’. More important, the analytical benefits from having two (or more)
cases may be substantial.
Source: (Yin, 2003)
The object of study is the result from the previous research phase: a set of alignment factor categories and a
list of measures for each of these factors. We want to assess whether these categories and measures form a
good basis for the measurement of strategic alignment. What data is used for this and how it is analysed is
described in the following two subsections.
3.2.4. DATA COLLECTION
For each case, two interviews were held to rate all defined measures, together resulting in a rating for the
different alignment factors and strategic alignment as a whole. One interview was held with someone working
in the business environment of the organisation, and one with someone in the IT environment. This way, it is
possible to rate strategic alignment from both a business and IT perspective.
In both cases these persons should operate high enough in the organisation’s hierarchy to be knowledgeable
about strategic planning, both for business and IT. Also, positions across all of the cases should be comparable.
Furthermore, only a limited time span is available for this project, so the accessibility of the informants is also
something to take into account.
Considering all of the above, the choice was made to contact people in the sub‐top management level of both
business IT, meaning working at one hierarchical level below the CEO/CIO of their organisations. For example
a director in product development to get the business perspective, and a director IT development for the IT
perspective.
Next to knowing, what kind of people we want to contact, we also need to know what organisations we want
to investigate. In small to medium‐sized organisations, IT planning is mostly carried out informally and the
degree of alignment is high (Chan & Reich, 2007). Measuring strategic alignment becomes interesting when it
is more of an issue. Chan and Reich (2007) argue that alignment research should focus on specific firm sizes,

22
types and specific industries. Taking this into account, the selected cases for this study will meet the following
criteria:
‐ The organisation has a medium to large size
One of the cases is in the process formalising their IT and the construction of an IT strategy.
The organisation had become the size that previous on‐the‐fly constructions for IT no longer
suffice. The size of this organisation will be a lower bound for this criterion, with 323 FTE and
a yearly IT budget of EUR 25 Million.
‐ The organisation operates in the financial sector
Many of the studies on strategic alignment have been carried out – either completely or for a
majority ‐ within the financial sector (i.e. (Avison, et al., 2004), (Reich & Benbasat, 2000),
(Chan, et al., 2006)) . The choice to study the financial sector in this study was made in order
to ensure that this external factor does not play a role in the validation of the measurement
method.
Selecting and contacting potential cases was done via the network of colleagues at KPMG. Using their personal
networks, they made first contact with a number of potential informants after which appointments could be
made with the ten definitive informants.
Because this is a non‐random sampling method, the possibility of a sampling bias deserves special attention. In
order to reduce the risks of self‐selection, the potential informants were only given very basic information
about the case study in advance to an agreement to participate. Furthermore, there was no pre‐screening of
informants or organisations. The only information considered prior to the selection of cases was information
concerning the selection criteria for this study. Finally, there was no exclusion of particular organisations and a
variation of organisations sizes and structure were included in the study to improve the generalisability of the
case study results.
3.2.5. DATA PROCESSING
All of the interviews were recorded with a voice recorder. These recordings were used to write a report for
each interview, answering each of the interview questions and rating all of the set measures. Ratings for the
alignment factors are determined by evaluating the rates for the corresponding measures. These rates are a
combination of the information given in both interviews belonging to the case.
All of the ratings and calculations are stored in a spread sheet. For each case, inputting the ratings given in the
interviews resulted in ratings for the alignment factors along with a graphical representation of these scores.
This graphical representation has the form of a radar graph, giving an intuitive and clear overview of the
ratings for each factor.
Together, the documentation and recordings mentioned in this paragraph form the case study database for
this project.
Note: Due to privacy considerations, neither the reports of the interviews nor the individual ratings given by the
informants are included in this report.
3.2.6. EVALUATION
The measurement results for each case are compared with to other assessments: the rating of the
organisation’s strategic alignment as provided by the informants of the case, and where available by an
external party that is familiar with the organisation. Furthermore, matters that are pointed out by the case’s
informants as major obstacles in achieving alignment should be also be revealed by the measurement method
More details on the evaluation of the case study data in given in chapter 6 of this report.

23
3.2.7. VALIDATION
Four tests are commonly used to establish the quality of empirical social research. As case studies are also a
type of social research (Yin, 2003), these tests are also relevant for this project. These tests are:
- Construct validity: establishing correct operational measures for the concepts
being studies.
- Internal validity: establishing a causal relationship whereby certain conditions are
shown to lead to other conditions, as distinguished from spurious relationships.
- External validity: establishing the domain to which a study’s findings can be
generalised.
- Reliability: demonstrating that the operations of a study can be repeated, with
the same results
Source: (Yin, 2003)
Yin (2003) states that internal validity only applies to explanatory or causal case studies. As this study is
neither, internal validity is not taken into account in the remainder of this section. Also, this case study does
not yet attempt to generalise the underlying model to a wider domain. Its goal is to indicate that the basis for
the theoretical model is solid enough for further, in‐depth research. Because of this, external validity is not an
issue for this case study. Nevertheless, a variation of organisations was included in this study to increase the
generalisability of the study results.
For each of these tests a number of case study tactics exist (Yin, 2003). These tactics were applied in this
project to ensure validity and reliability of the case study. All of the tactics are presented in the table below.
Though the application of the majority of these tactics is already described in this chapter, they are repeated
briefly in the table below for clarity purposes.
Tests Case study tactic Application in research project
Construct
validity
Use multiple sources of
evidence
Case study consists of 5 cases, each with 2
informants to use the measurement tool.
Evaluation of the results is done with both
informants, and also an external party familiar with
the organization.
Establish chain of evidence The followed chain of evidence is included in
Appendix B, page 98.
Have key informants review
draft case study report
Interview results reviewed by informants of 3
cases.
Reliability
Use case study protocol This entire section describes the protocol used for
this case study.
Develop case study database The original data is stored through voice recordings
of the interviews. All resulting material is kept
digitally.
Besides these tactics, some additional precautions were taken. A pilot interview was held to ensure that the
questions result in the required data. The set‐up of this pilot and its results are given in Appendix B, on page
98. Also, all calculations made were checked by an external party.

24
25
4. STRATEGIC ALIGNMENT
A literature review was carried out to get a better understanding of the term ‘strategic alignment’. The results
are presented in this chapter, starting with a discussion on the definitions of strategic alignment, followed by a
number of models and frameworks concerning the topic, and the factors that impact the alignment within an
organisation. For each of these topics, the results are accompanied by a short description is given of how the
findings can contribute to the measurement of strategic alignment.
4.1. DEFINITIONS
When searching for the definition of strategic alignment, many options are available. However, though there
are many definitions available, they are often not very informative. As Maes et al. state: “In general, alignment
is defined in an indefinite and vague way, if at all! Many publications simply avoid any pinning down of the
concept, or fall back to tautological definitions. [..] This indefiniteness is continuously repeated with only slight
alterations.” (Maes, et al., 2000).
Examples of such definitions are shown in the table below:
Reich & Benbasat (1996)
“the degree to which the IT mission, objectives, and plans support and are supported by the business mission, objectives, and plans.”
Henderson & Venkatraman (1989)
“[..] alignment across internal and external domains as well as functional integration across business and I/T areas.”
Luftman (2000)
“[..] alignment addresses both how IT is in harmony with the business, and how the business should, or could be in harmony with IT. Alignment evolves into a relationship where the function of IT and other business functions adapt their strategies together.”
Tallon et al. (2000)
“[..] the alignment of IT with the business strategy.”
Avison et al. (2004)
“[..] the integration of strategies relating to the business and its IT/IS.”

26
Chan & Reich (2007)
“Sauer and Yetton (1997) argue that its basic principle is that IT should be managed in a way that mirrors management of the business.”
“McKeen and Smith (2003) argue that strategic alignment of IT exists when an organization’s goals and activities and the information systems that support them remain in harmony.”
These definitions tell us how business and IT should support or mirror one another, be integrated, aligned,
coherent or in harmony. They make clear that alignment has to be some kind of link between business and IT,
but do not provide the unequivocal description one expects when searching for a definition.
An attempt to make this more unequivocal definition was made by Maes et al. (2000). They looked at a
number of issues:
They define strategic alignment as a dynamic process. In the past the view of alignment as an
end‐state was the dominant one, and the need to maintain alignment dynamically is rarely
acknowledged (Maes, et al., 2000) (Avison, et al., 2004). However, this dominant view has
shifted over time as more research argued for dynamic alignment (Avison, et al., 2004).
Nowadays, strategic alignment is viewed as a process (Avison, et al., 2004) (Chan & Reich, 2007).
All of the aspects of the business‐IT relationship are taken into account. They do not restrict only
to the strategic level or managerial processes, but include information sharing at all levels and
also design processes (Maes, et al., 2000).
They do not use terms such as harmony or balance between the different elements of the
business‐IT relationship. Instead, they assume that these elements are interrelated in a conscious
way. This leaves the possibility for an introduced lack of balance, which may drive organizational
innovations (Maes, et al., 2000).
The result is the following definition of strategic alignment:
Maes et al. (2000)
“We define alignment as the continuous process, involving management and design sub‐processes, of consciously and coherently interrelating all components of the business‐IT relationship in order to contribute to the organisation’s performance over time.”
4.1.1. CONSEQUENCES FOR ALIGNMENT MEASUREMENT
The goal of this research project is to measure strategic alignment. In the light of the above definition, we
need to find the processes interrelating the components of the business‐IT relationship. The extent to which
these processes are in place and well‐functioning should determine how well an organisation is aligned.

27
4.2. MODELS AND FRAMEWORKS
4.2.1. OVERVIEW
In the course of time, many models and frameworks have been developed to describe strategic alignment.
This development started in the 1980s when IT started to move from a merely supporting role to more
strategic one, as technology advanced. The first attempt to model this strategic potential was done at MIT,
resulting in the MIT90s framework (Scott Morton, 1990).
This research influenced Henderson and Venkatraman in their development of the Strategic Alignment Model
(SAM) (Henderson & Venkatraman, 1989). Where the MIT90s framework only focuses on the internal aspects
of the organisation, the SAM also takes into account the external aspects. By doing this it recognises the
potential of IT to not only support business policy, but also to shape it (Avison, et al., 2004). In the course of
time many models have been developed to measure the strategic alignment of an organisation. Out of these
models, the SAM is one that formed the basis for many of the other developed models (Maes, et al., 2000)
(Chan & Reich, 2007).
The practical interpretations of the SAM were extended by
Luftman (1996). His later research led to the identification of
the major enablers and inhibitors of strategic alignment as well
as the development of a new alignment framework. The
Strategic Alignment Maturity Model (SAMM) (Luftman, 2000)
describes a number of different alignment criteria as well as a
number of possible alignment levels.
One of the models that build further on the SAM is the generic
framework, developed by Maes (1999). This framework
further details the internal domain of the SAM, as well as the IT
domain. Later, Maes et al combined this generic framework
with the Integrated Architecture Framework (IAF) (Goedvolk,
1999), leading to the unified framework (Maes, et al., 2000).
In Figure 2 an overview is given of these models. The arrows in the figure show how the models are related to
each other. For example, the SAM is based on the MIT90s framework, and the SAM was the basis for the
generic framework.
All of the aforementioned models and frameworks are described in the following section. Special attention
was given to the SAM, as this is stated to be the basis for much of the research on strategic alignment (Avison,
et al., 2004).
Figure 2 ‐ Overview of strategic alignment
models/frameworks

28
4.2.2. MODEL DESCRIPTIONS
MIT90S FRAMEWORK
The framework defines the different areas within the organisation that need to be aligned, in order for IT to be
rewarding in a strategical way. These areas are represented graphically in Figure 3.
Scott Morton (1990) describes the framework as follows: "An organization can be thought of as comprised of
five sets of forces in dynamic equilibrium among themselves even as the organization is subjected to
influences from an external environment. [..] In this view, a central task of general management is to ensure
that the organization [..] moves through time to accomplish the organization's objectives."
Figure 3 ‐ The MIT90s framework (Scott Morton, 1990)
STRATEGIC ALIGNMENT MODEL
The Strategic Alignment Model (SAM), shown in Figure 4, divides an organisation into four domains. Strategic
alignment concerns the linking of these domains. This linking can be done in various ways. The domains and
links are described in the remainder of this section.
MODEL DOMAINS
The goal of the SAM is to align business and IT. However, the model does not look at business and IT as whole
entities, but divides them according to their focus: the internal or external environment of the organisation.
This results in two domains for the business side of the organisation – business strategy, and organisational
infrastructure and processes – and two for the IT side – IT strategy, and Information systems infrastructure
and processes. These four domains are described below:
The business strategy covers the choices affecting the positioning of the organisation amongst competitors. It
deals with business scope and the organisation’s approach to compete in the market. This approach is viewed
in terms of distinctive competences and governance structures. These refer to respectively the attributes of
strategy (i.e. pricing and quality) and the mechanisms (i.e. partnerships and strategic alliances) for obtaining
competitive advantage (Henderson & Venkatraman, 1989).

29
Organisational infrastructure and processes is defined as the choices concerning the particular internal
arrangements supporting the position amongst competitors, such as the management structure and work
processes. Three aspects of this domain are especially relevant in this case, as they are intertwined with IT and
business strategy issues, namely: the administration infrastructure such as structure and roles, the (work)
processes defining the work flow and its associated information flow and the skills indicating the capability of
the organisation (Henderson & Venkatraman, 1989).
The IT strategy comprises the choices determining the positioning of the organisation in the IT marketplace.
The main aspects of this domain are analogous to those of the business strategy: technology scope, distinctive
competencies and governance structure. Strategic choices concerning scope often centre on the adoption of
an emerging technology. Distinctive competencies are those choices that affect the ability of the organisation
to differentiate its IT infrastructure. The governance issue is parallel to the governance in the business strategy
(Henderson & Venkatraman, 1989).
Information systems infrastructure and processes are defined in terms of the choices relevant to the internal
arrangements and the processes that determine the range and types of products and services delivered by
information systems to the organisation. Its main aspects are similar to those of the organisational
infrastructure and processes: information systems infrastructure, processes and skills. Information systems
architecture represents the definitions, governing policies and rules, and implied priorities for applications,
data and technology configurations. The processes are those that are relevant to the efficient and effective
operation of the information system infrastructure (i.e. development, security procedures). Finally, the skills
aspect reflects the knowledge and need for new skills within the IT function (Henderson & Venkatraman,
1989).
Figure 4 ‐ Strategic alignment model (Henderson & Venkatraman, 1989)

30
MODEL LINKS
Each of the domains is important in its own context. However, they have to work as a whole to gain value
(Coleman & Papp, 2006). This means the different domains need to be linked. The different types of links are
described below:
The (vertical) link between strategy and infrastructure domains are linked is called strategic fit. The strategic
fit interconnects the external and the internal domain of the organisation (Avison, et al., 2004). This is
important, as the effective management requires both the positioning of the organisation in the (external)
market and the arrangement of the internal structure and processes supporting the positioning strategy
(Henderson & Venkatraman, 1989).
The business domain and IT domain are also linked. This (horizontal) link is called functional integration. The
information technology strategies must change as business strategies change and vice versa (Papp, 2004).
Analogue, the ability to design, implement and operate the IS infrastructure is directly related to the
organisational infrastructure. Also, the design of organisational infrastructure determines the requirements
for the IS infrastructure and processes (Henderson & Venkatraman, 1989).
As stated, strategic fit and functional integration only concern two of the four domains in the SAM. Such a link
is called a bivariate fit. For example, if organisational and information systems infrastructures can be
reconfigured easily, the functional integration between the strategic domains would suffice. Because the
infrastructure can be adapted easily, management can delegate this issue and focus on their strategies.
However, there is a risk that internal inconsistencies between strategy and structure will occur (Henderson &
Venkatraman, 1999). The same holds for cases when only the strategic fit is considered. It is perhaps a truism
that if the business domain and IT domain are completely detached, IT does not contribute to the
achievement of business goals. So, because the bivariate fit only considers two of the domains in the model, it
does not suffice in describing more complex organisational changes adequately (Henderson & Venkamatran,
1992).
To address the shortcomings of the bivariate fit, the cross‐domain alignments were added to the model and
are also known as the strategic alignment perspectives. These are links between three of the domains in the
SAM. These domains are sequentially linked, starting at the anchor domain. The anchor domain is the domain
provides the forces behind the change, often as the initiator of it. A change initiative is intended to address a
problem area. This problem area is the second domain in the link, also known as the pivot domain. The
changes in the pivot domain affect a third domain, called the impacted domain. The impacted domain
completes the strategic alignment perspective. In total, eight different strategic alignment perspectives can be
constructed. Because strategy is often the driver of changes, the perspectives with one of the strategy
domains as the anchor domain are considered to be the dominant perspectives (Henderson & Venkamatran,
1992). In total there are eight different alignment perspectives. The four non‐dominant perspectives were not
a part of the original SAM but developed in later research, by Luftman (1996). All of the perspectives are
described in more detail in Appendix B. To illustrate this principle, an example is given below:
In the example given on page 14, where UPS implemented telematics to make a
significant cut is their annual costs, the change was initiated by the wish of the
organisation to cut costs. This makes the business strategy the anchor domain for this
case. The change had to do with implementing new technologies. This falls under the
technology scope of the IT strategy domain, making this the pivot domain. The
incorporation of this new technology meant adapting the IS infrastructure, making IT
Infrastructure and processes the impacted factor for this change. This way of linking
the domains is called the Technology leverage perspective.

31
Figure 5 ‐ IT business alignment maturity criteria of the SAMM
(Luftman, et al., 1999)
STRATEGIC ALIGNMENT MATURITY MODEL
The construction of this model started out with the analysis of enablers and inhibitors of strategic alignment.
This set of business practices formed the basis of the Strategic Alignment Maturity Model (SAMM).
The SAMM defines six criteria determining a
number of different alignment maturity levels.
These criteria are: communications,
competency/value measures, governance,
partnership, scope and architecture, skills. These
are displayed graphically in Figure 5.
This set of criteria determines the maturity level
of the organization in terms of strategic
alignment. These levels were modelled after the
Capability Maturity Model3. The SAMM defines
five levels of maturity for strategic alignment:
initial process, committed process, established
focus process, improved process and optimised
process. These levels are also shown in the figure
below:
Figure 6 ‐ Maturity levels of the SAMM (Luftman, et al., 1999)
For each criterion, a number of attributes have been defined, which have different characteristics at the
different maturity levels. An example of one of the attributes and its characteristics is given below:
1: initial process 2: committed process
3: established focused process
4: improved/ managed process
5: optimised process
Understanding of business by IT
IT management lacks understanding
Limited understanding by IT management
Good understanding by IT management
Understanding encouraged among IT staff
Understanding required of all IT staff
A full list of the attributes and their characteristics is given in Appendix D.
3 More information on the Capability Maturity Model can be found at: http://www.sei.cmu.edu/reports/93tr024.pdf
32
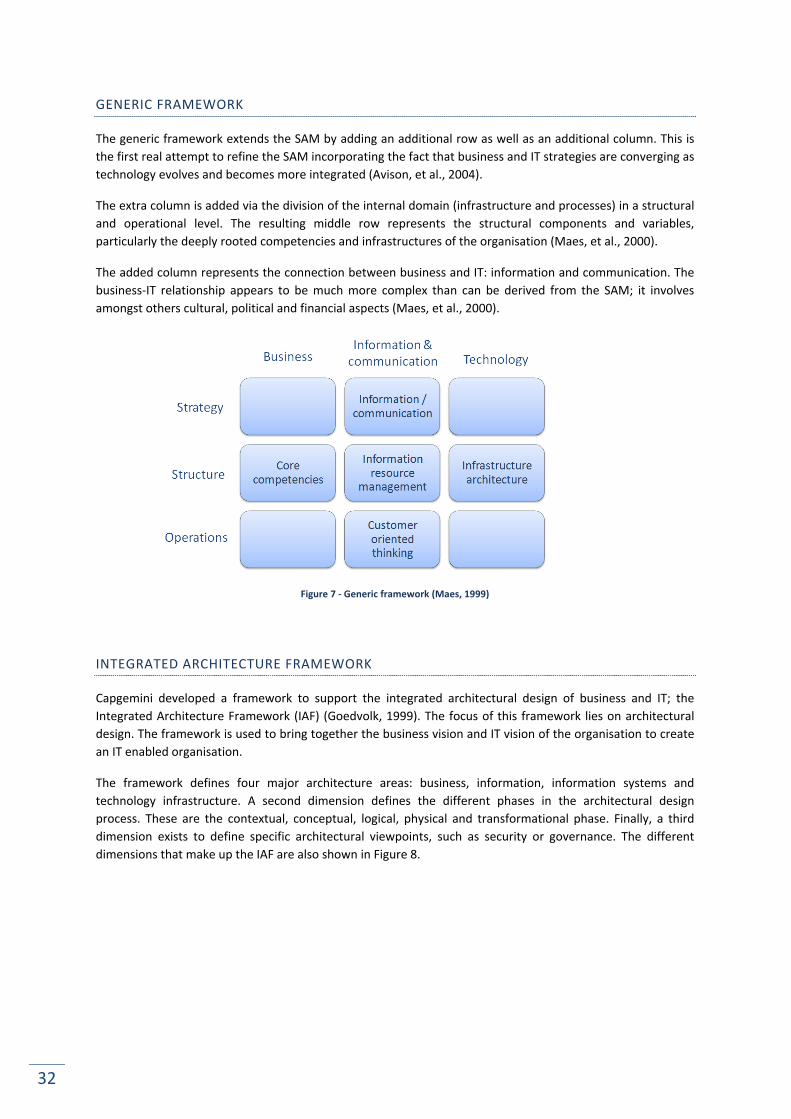
GENERIC FRAMEWORK
The generic framework extends the SAM by adding an additional row as well as an additional column. This is
the first real attempt to refine the SAM incorporating the fact that business and IT strategies are converging as
technology evolves and becomes more integrated (Avison, et al., 2004).
The extra column is added via the division of the internal domain (infrastructure and processes) in a structural
and operational level. The resulting middle row represents the structural components and variables,
particularly the deeply rooted competencies and infrastructures of the organisation (Maes, et al., 2000).
The added column represents the connection between business and IT: information and communication. The
business‐IT relationship appears to be much more complex than can be derived from the SAM; it involves
amongst others cultural, political and financial aspects (Maes, et al., 2000).
Figure 7 ‐ Generic framework (Maes, 1999)
INTEGRATED ARCHITECTURE FRAMEWORK
Capgemini developed a framework to support the integrated architectural design of business and IT; the
Integrated Architecture Framework (IAF) (Goedvolk, 1999). The focus of this framework lies on architectural
design. The framework is used to bring together the business vision and IT vision of the organisation to create
an IT enabled organisation.
The framework defines four major architecture areas: business, information, information systems and
technology infrastructure. A second dimension defines the different phases in the architectural design
process. These are the contextual, conceptual, logical, physical and transformational phase. Finally, a third
dimension exists to define specific architectural viewpoints, such as security or governance. The different
dimensions that make up the IAF are also shown in Figure 8.

33
Figure 8 ‐ Integrated Architecture Framework (Goedvolk, 1999)
UNIFIED FRAMEWORK
The unified framework combines the previously described generic framework and IAF. The management
components from the generic framework and the design component from the IAF were taken and put
together to form a three‐dimensional alignment framework. The result of this combination is shown in Figure
9.
Figure 9 ‐ Unified framework (Maes, et al., 2000)

34
4.2.3. CONSEQUENCES FOR ALIGNMENT MEASUREMENT
In this section of the report six different models on strategic alignment are described. The MIT90s framework,
SAM, IAF, generic framework and the unified framework all describe different business domains that need to
be connected in some way to achieve better strategic alignment. These models remain fairly high level; they
describe the domains that should be aligned but not in what way this can be achieved in practice. As the goal
of this project is to study how strategic alignment can be measured in organisations, this lack of practical
aspects cause these models to provide little basis for the construction of this measurement.
This is also one of the main points of criticism on the existing research; it is too theoretical and fails to capture
real life (Chan & Reich, 2007). Simply put, theoretical models to deal with the various aspects of strategic
alignment exist, but they are not usable in practice.
However, one lead on how to use the SAM and its derivatives in practice is given in a study by Avison et al.
(2004). The goal of their study was to validate the SAM, and demonstrate its practical value. They also propose
a practical framework for managers to change future alignment as required. This framework is based on the
alignment perspectives of the SAM, as described in detail in Appendix C. The organisation under study should
determine which alignment perspective best represents it, or which is found most appropriate. For all
proposed new projects it should be determined what its corresponding alignment perspective is. The
perspective for a proposed project should match the ideal perspective for the organisation, in order to achieve
alignment. This idea can be incorporated in a measurement tool, by determining the match between the
desired and actual alignment perspective of an organisation.
In contrary to the other models for strategic alignment, the SAMM is based solely on practices and processes
in organisations. It mentions a number of criteria by which the alignment of an organisation can be rated.
However, the papers on this model provide little proof on their validity. There is on the construction of the
individual characteristics. Therefore, the question remains whether if and how they contribute to strategic
alignment.
4.3. ALIGNMENT FACTORS
This part of the literature study focuses on finding specific factors that contribute to the strategic alignment of
organisations. This research resulted in a set of success factors for strategic alignment, extracted from a
number of existing studies. The findings of this research are presented in this section.
The available studies offer a wide spectrum of research methods. Three of the studies are based on qualitative
research, four on quantitative research. Some studies used predefined alignment factors, others, started from
scratch. The factors were analysed by having stakeholders rate them, or by analysing documents. The specifics
of these research methods, along with more detailing on the used studies can be found in Appendix E.
The results of each study, in terms of found alignment factors are presented in the following table, grouped by
their source.

35
Luftman et al. (1999)
Enablers 1. Senior executive support for IT 2. IT involved in strategy development 3. IT understands the business 4. Business‐IT partnership 5. Well‐prioritised IT projects 6. IT demonstrates leadership
Inhibitors1. IT/business lack close relationships 2. IT does not prioritise well 3. IT fails to meet commitments 4. IT does not understand business 5. Senior executives do not support IT 6. IT management lacks leadership
Teo & Ang (1999)
1. Top management is committed to the strategic use of IT 2. IS management is knowledgeable about business 3. Top management has confidence in the IS department (Related to 1) 4. The IS department provides efficient and reliable services to user departments 5. There is frequent communication between user and IS department 6. The IS staff are able to keep up with advances in IT 7. Business and IS management work together in partnership in prioritizing applications development 8. Business goals and objectives are made known to IS management 9. The IS department is responsive to user needs (Related to 4) 10. Top management is knowledgeable about IT 11. The IS department often comes up with creative ideas on how to use IT strategically (Related to 6) 12. The corporate business plan is made available to IS management (Related to 8)
Reich & Benbasat (2000)
Shared domain knowledge
Communication between business and IT executives
Connections between business and IT planning
Successful IT history
Chan (2002)
CEO and CIO have a strong working relationship
Business and IS plans are closely linked
IS personnel participate in business planning
IS projects have business sponsors
IS personnel make lateral short‐ or long‐term transfers into business partner areas
Incentive/compensation bonus schemes exist
Kearns & Lederer (2003)
Information intensity of the value chain
The CIO participates in business planning
The CEO participates in IT planning
The IT plan reflects the business plan
Chan et al. (2006)
Shared domain knowledge
Prior IS success
Organisational size
Huang & Hu (2007)
Integrating IT planning with business planning
Maintaining effective communication channels
Developing strong relationships between IT and business
Institutionalising the culture of alignment
36
4.3.1. CONSEQUENCES FOR ALIGNMENT MEASUREMENT
The alignment factors presented in this section are of a very practical nature, touching practices and processes
in organisation. Though some of them still remain vague (e.g. “senior executive support for IT”), these factors
seem usable for the purpose of measuring alignment. With further research, these vague factors could be
concretised to a more usable form.
It appears that many of the factors have similarities. For example, “Prior IS success” and “Successful IT history”
or “IS management is knowledgeable about business” and “Shared domain knowledge”. In order to measure
alignment, we need to know the key factors contributing to it. For this purpose, the ‘doubles’ in the list of
factors are redundant and need to be condensed into a number of key elements that together determine
strategic alignment.

37
5. MEASURING STRATEGIC ALIGNMENT
In this chapter, the results from the theory presented in the previous chapter are used to construct a
measurement method for strategic alignment. The basis for this measurement is formed by the found
alignment factors. How these factors led to a method for the measurement of strategic alignment is described
in this chapter.
5.1. OUTLINE
In this part of the research project, the goal is to set up a method to measure strategic alignment. This method
should enable us to quantify the level of alignment in an organisation. The basis for this method is given in the
previous chapter, where strategic alignment was examined in detail by the means of a literature study. This
study consisted of three topics: definitions, models and alignment factors. Along with the results from the
literature study, a brief consideration is given on how these topics can contribute to the measurement of
alignment.
Based on these considerations, the first step in constructing the measurement method is to condense the
different alignment factors, so that redundancy is removed and similar factors are grouped. As a result a core
set of alignment factors is created; alignment factor categories.
In order to be able to measure the alignment within in an organisation, measures for each of the alignment
factor categories were constructed, along with a definition on how each measure is rated. When measuring
the strategic alignment within an organisation information relevant for the rating of all measures needs to be
gathered. For this purpose, a list of interview questions was constructed.
All of the above is described further in the remainder of this chapter.
5.2. ALIGNMENT FACTOR CATEGORIES
As stated, the first step in constructing the measurement method is to condense the alignment factors into a
core set of alignment factors, from hereon called alignment factor categories. The process of how this
condensation was carried out, the execution of this process and the resulting alignment factor categories are
described in the remainder of this section.
5.2.1. CONSTRUCTION PROCESS
In order to construct the different alignment factors, the following steps were undertaken:
1. A small number of alignment factors describe a characteristic of an organisation, not a process
that interrelates business and IT. As these do not fall under the definition of strategic alignment
used in this research project (see: Section 4.1.) these alignment factors are omitted.
2. For each individual alignment factor, a label is assigned to it that captures the topic of the
alignment factor.

38
3. Some of the labels umbrella others. Factors that fall under such an umbrella are assigned the
label of this umbrella.
4. For the resulting labels, the labels that touch on a similar aspect are grouped together and
assigned a label that covers all content.
These steps are based on a method for the analysis of quantitative data described by Baarda et al. (2005). This
method is described in Appendix F.
The results of each step in this process are presented hereafter.
STEP 1: SELECTION OF USED ALIGNMENT FACTORS
Two of the alignment factors are omitted because they concern characteristics of the organisation, opposite to
processes interrelating business and IT. All the other alignment factors remain included. The omitted factors
are:
- Organisational size (Chan, et al., 2006)
- Information intensity of the value chain (Kearns & Lederer, 2003)
STEP 2: LABELLING OF ALIGNMENT FACTORS
Below, an overview is given of all of the used alignment factors, grouped by source. Each of the alignment
factors has been assigned a label, capturing its topic.
Luftman et al. (1999) Label
Senior executive support for IT Management support
IT involved in strategy development Participation
IT understands the business IT's business knowledge
Business‐IT partnership Partnership
Well‐prioritised IT projects Project prioritisation
IT demonstrates leadership Leadership
Inhibitor: IT/business lack close relationships Working relationship
Inhibitor: IT does not prioritise well Project prioritisation
Inhibitor: IT fails to meet commitments IT Commitments
Inhibitor: IT does not understand business IT's business knowledge
Inhibitor: Senior executives do not support IT Management support
Inhibitor: IT management lacks leadership Leadership
Teo & Ang (1999) Label
Top management is committed to the strategic use of IT Commitment
IS management is knowledgeable about business IT's business knowledge
Top management has confidence in the IS department Confidence in IT
The IS department provides efficient and reliable services to user departments Perception4
There is frequent communication between user and IS department Communication
The IS staff are able to keep up with advances in IT IT advancement
Business and IS management work together in partnership in prioritizing
applications development Partnership
Business goals and objectives are made known to IS management Information sharing
The IS department is responsive to user needs Responsiveness
4 The IS department should be perceived as efficient, effective and reliable by user departments. So, this alignment factor is mostly concerned with the perception of the IT department.

39
Top management is knowledgeable about IT Business' IT knowledge
The IS department often comes up with creative ideas on how to use IT
strategically Creativity
The corporate business plan is made available to IS management Information sharing
Shared domain knowledge Shared domain knowledge
Communication between business and IT executives Communication
Connections between business and IT planning Linkage
Successful IT history IT history
Chan (2002) Label
CEO and CIO have a strong working relationship Working relationship
Business and IS plans are closely linked Linkage
IS personnel participate in business planning Participation
IS personnel make lateral short‐ or long‐term transfers into business partner
areas Cross‐over opportunities
IS projects have business sponsors Sponsors
Incentive/compensation bonus schemes exist Rewarding
Kearns & Lederer (2003) Label
Information intensity of the value chain Information Intensity
The CIO participates in business planning Participation
The CEO participates in IT planning Participation
The IT plan reflects the business plan Linkage
Chan et al. (2006) Label
Shared domain knowledge Shared domain knowledge
Prior IS success IT history
Organisational size Organisational size
Huang & Hu (2007) Label
Integrating IT planning with business planning Linkage
Maintaining effective communication channels Communication
Developing strong relationships between IT and business Working relationship
Institutionalising the culture of alignment Culture
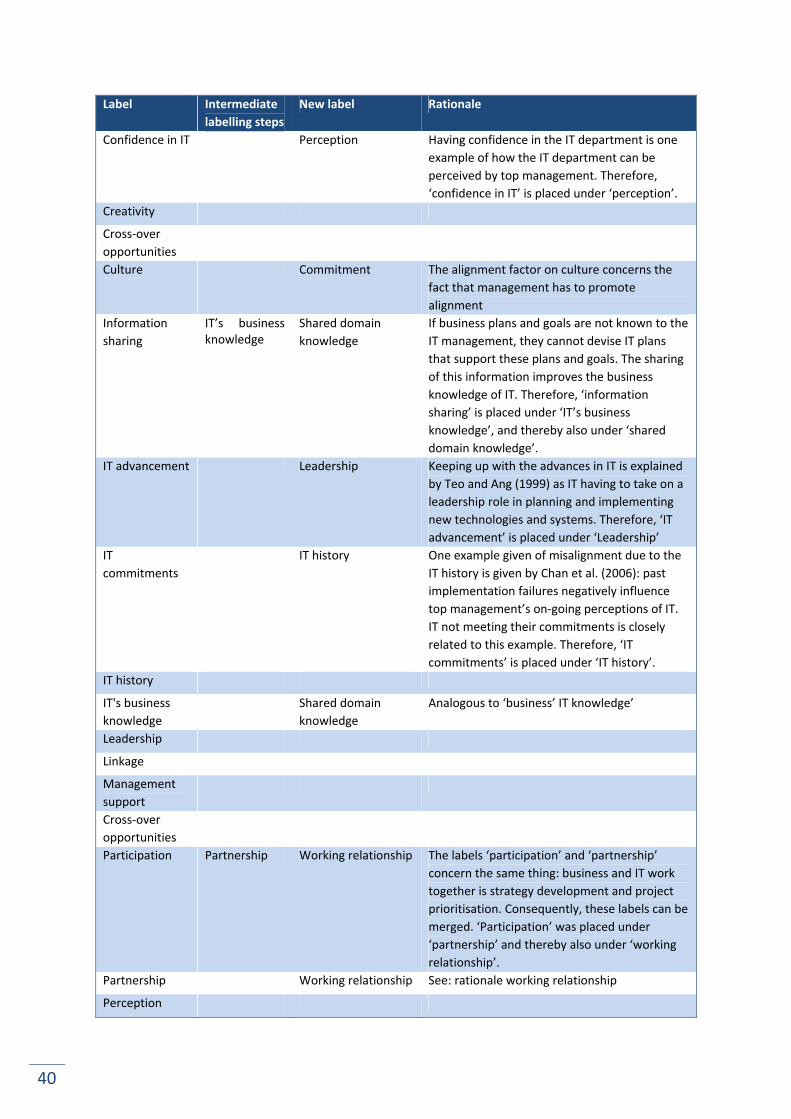
STEP 3: MERGING UMBRELLA CONSTRUCTIONS
In the table below, labels that fall under another label are grouped. All factors under the umbrella of another
factor are assigned the label of this umbrella.
Label Intermediate
labelling steps
New label Rationale
Business' IT
knowledge
Shared domain
knowledge
One other topic in this list is “shared domain
knowledge”. This means business and IT are
knowledgeable (to some extent) about each
other’s domain. Business’ IT knowledge is a part
of this.
Commitment
Communication Working relationship See: rationale working relationship
40
Label Intermediate
labelling steps
New label Rationale
Confidence in IT Perception Having confidence in the IT department is one
example of how the IT department can be
perceived by top management. Therefore,
‘confidence in IT’ is placed under ‘perception’.
Creativity
Cross‐over
opportunities
Culture Commitment The alignment factor on culture concerns the
fact that management has to promote
alignment
Information
sharing
IT’s business knowledge
Shared domain
knowledge
If business plans and goals are not known to the
IT management, they cannot devise IT plans
that support these plans and goals. The sharing
of this information improves the business
knowledge of IT. Therefore, ‘information
sharing’ is placed under ‘IT’s business
knowledge’, and thereby also under ‘shared
domain knowledge’.
IT advancement Leadership Keeping up with the advances in IT is explained
by Teo and Ang (1999) as IT having to take on a
leadership role in planning and implementing
new technologies and systems. Therefore, ‘IT
advancement’ is placed under ‘Leadership’
IT
commitments
IT history One example given of misalignment due to the
IT history is given by Chan et al. (2006): past
implementation failures negatively influence
top management’s on‐going perceptions of IT.
IT not meeting their commitments is closely
related to this example. Therefore, ‘IT
commitments’ is placed under ‘IT history’.
IT history
IT's business
knowledge
Shared domain
knowledge
Analogous to ‘business’ IT knowledge’
Leadership
Linkage
Management
support
Cross‐over
opportunities
Participation Partnership Working relationship The labels ‘participation’ and ‘partnership’
concern the same thing: business and IT work
together is strategy development and project
prioritisation. Consequently, these labels can be
merged. ‘Participation’ was placed under
‘partnership’ and thereby also under ‘working
relationship’.
Partnership Working relationship See: rationale working relationship
Perception

41
Label Intermediate
labelling steps
New label Rationale
Project
prioritisation
Responsiveness Perception This alignment factor concerns the fact that IT
deliverables correspond to needs existing in the
business environment. Business should perceive
these useful. Consequently, this label was
merged with ‘perception’.
Rewarding
Shared domain
knowledge
Working
relationship
The studies mentioning the alignment factors
on the working relationship give two possible
interpretations for what is meant by this:
Luftman (1999) mentions partnership; the
cooperation between business and IT, and
Huang and Hu (2007) mention the interactions
between both parties. In line with these
interpretations, the labels ‘partnership’ and
‘communication’ can be seen as a part of the
working relationship between business and IT.
STEP 4: GROUPING SIMILAR LABELS
When labels concern a similar aspect, they are grouped in this step of the construction process. How the labels
were grouped is described in the table below.
Label Intermediate
labelling steps New label Rationale
Shared domain
knowledge
Working
relationship
Commitment
Intention and
support
Both these labels concern the way tom
management looks at IT. There has to be the
intention to use IT strategically and
management should provide the necessary
support to achieve this. Accordingly, these
labels are merged under the name ‘intention
and support’.
Management
support
Cross‐over
opportunities
Opportunities IT performance
These labels are concerned with the
opportunities in place for IT personnel; is it
possible for them to cross‐over to a business‐
related function, and are bonus schemes in
place. Having such opportunities stimulates the
personnel, which on its turn contributes to the
performance of the IT department. Therefore,
these labels are merged under ‘IT performance’.
Rewarding
Creativity Innovation IT performance These three labels all concern the technological
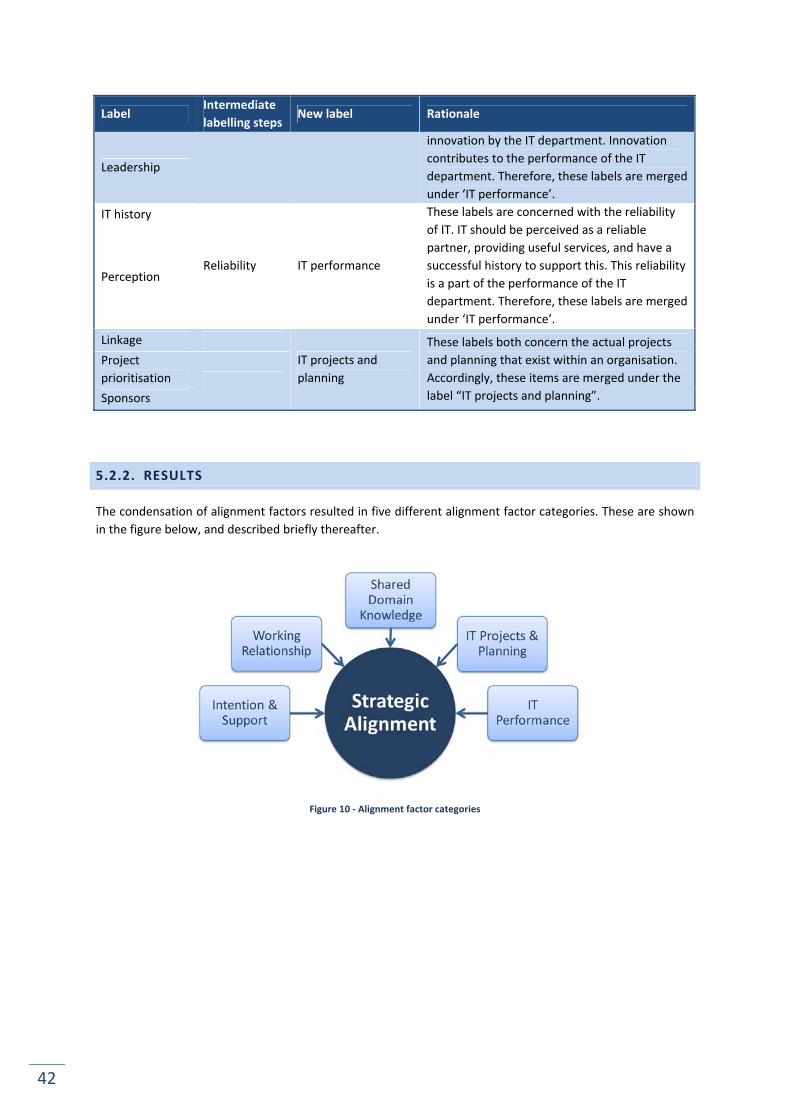
42
Label Intermediate
labelling steps New label Rationale
Leadership
innovation by the IT department. Innovation
contributes to the performance of the IT
department. Therefore, these labels are merged
under ‘IT performance’.
IT history
Reliability IT performance
These labels are concerned with the reliability
of IT. IT should be perceived as a reliable
partner, providing useful services, and have a
successful history to support this. This reliability
is a part of the performance of the IT
department. Therefore, these labels are merged
under ‘IT performance’.
Perception
Linkage
IT projects and
planning
These labels both concern the actual projects
and planning that exist within an organisation.
Accordingly, these items are merged under the
label “IT projects and planning”.
Project
prioritisation
Sponsors
5.2.2. RESULTS
The condensation of alignment factors resulted in five different alignment factor categories. These are shown
in the figure below, and described briefly thereafter.
Figure 10 ‐ Alignment factor categories

43
INTENTION & SUPPORT
This category concerns the alignment factors touching whether the organisation has the intention to create
and sustain strategic alignment. High‐level management has to be committed to the strategic use of IT, but
also demonstrate this by supporting IT. This can be done in various ways: such as providing funds and
leadership for IT and setting up an appropriate organisational structure (Teo & Ang, 1999).
WORKING RELATIONSHIP
The working relationship between business and IT on both management and department level is very
important. A lack of close relationships between business and IT was even named top inhibitor for strategic
alignment amongst IT executives (Luftman, et al., 1999). Within this working relationship, two aspects can be
identified: communication and the partnership. There needs to be frequent communication between business
and IT executives, but also between the different departments. Furthermore, business and IT should work
together in partnership in strategy development and project prioritisation.
SHARED DOMAIN KNOWLEDGE
Business needs to have knowledge on IT and vice versa. CIOs with good business and IT strategy knowledge
enjoy greater participation in top management (Luftman, et al., 1999). Vice versa, a lack of business
knowledge in the IT department stands in the way of strategic alignment, as it hinders the organisation’s
ability to exploit IT strategically (Luftman, et al., 1999) (Teo & Ang, 1999).
Top management also needs to be knowledgeable about IT so that they are able to objectively evaluate
proposals for purchase or upgrade of hardware and software. They will also be better able to evaluate payoffs
from IT investments and have more realistic expectations of what the IT investments can or cannot achieve
(Teo & Ang, 1999).
IT PROJECTS & PLANNING
The IT projects and planning need to be closely linked to business strategies and plans. The business policies
should translate to the priorities set by IT in order to create value. IT unto itself cannot provide this value.
Also, the prioritisation of projects should result the incorporation of technology so organisations do not fall
behind competitors (Luftman, et al., 1999).
IT PERFORMANCE
The IT staff needs to be able to keep up with the advances in IT, generate creative and innovative ideas to
exploit new and existing technologies and take a leadership role in planning and implementing new
technologies and systems (Teo & Ang, 1999) (Luftman, et al., 1999). By doing so, the organisation can gain a
competitive advantage and can develop or maintain its reputation as a technological leader in the industry
(Teo & Ang, 1999). Also, firms that do not keep their customers happy by investing in technological
enhancements fall behind their competitors (Luftman, et al., 1999). This contributes to the long term viability
of the organisation.
Also, the IT department should be perceived as a reliable party. When the IT department provides efficient
and reliable services to the business, this improves the perception of the IT department. This is an important
requirement for the IT department to be successful in the organisation (Teo & Ang, 1999). Also, when the IT
department is deemed reliable, this will prevent the business departments from developing their own
applications themselves. Having a successful IT history can contribute to this reliability. For example, IT
meeting its commitments. However, a great number of projects are late and over budget. Even though most
of the problems are not technical, this significantly impacts the credibility of the IT department (Luftman, et
al., 1999).
Finally, certain opportunities should be in place to stimulate IT performance. These are bonus schemes and
the opportunity to cross‐over to business related functions.

44
5.3. MEASURES AND RATINGS
The five alignment factor categories will form the basis of the measurement method for strategic alignment.
The use of this measurements method should result in a rating for each of the alignment factor categories. In
order to assign these ratings we need to know what items determine the state of alignment for each category.
These items are called measures from hereon.
5.3.1. CONSTRUCTION PROCESS
In order to construct these ratings, information from different sources is combined: the labelling structure
resulting from the category construction, the studies used in finding the individual alignment factors and
where possible information from the models on strategic alignment. This combination was done through the
following process:
1. The labelling process followed to construct the alignment factor categories resulted in a labelling
structure for each category. This structure can be visualised as a tree for each alignment factor
category, with the category as the root of the tree and the alignment factors as leaves. This
structure is used to define the measures for each alignment factors category. The nodes directly
subsidiary to the root (first level of the tree) are used as measures.
2. Each measure contains a number of alignment factors. For each of the measures the available
detailing on these alignment factors is extracted from the studies they originated from.
3. Based on the information given in the detailing of the alignment factors of each measure,
relevant information is extracted from three additional sources:
- Alignment criteria of the SAMM (see also: Appendix D, page 102)
- Usable principles from the SAM (see also: Section 4.2.3., page 34)
- Questionnaire items from the used studies on alignment factors (where available).
4. The information available is grouped according to their similarities. Each group should contain
items that are fine‐grained enough to be used in an interview, to get the information needed to
rate each of the measures.
5. When the additional information causes a large amount of overlap between the defined
measures, the definition of measures is reconsidered in order to better accommodate all of the
information found.
6. The previous steps result in a list of measures for each alignment category, together with a list of
items for each measure that can be rated directly from the input given in the interviews. How
each item is rated is decided as follows:
1. Where available, the ratings as defined in the SAMM are used;
2. if such a rating is not available one is constructed where possible, based on the available
information;
3. if the information available does not provide enough information to construct a pre‐
defined rating, the rating is provided directly by the informants;
4. the ratings for umbrella constructions are calculated by averaging the ratings of their
subsidiaries. For example, the rating for the alignment factor category ‘Intention &
Support’ consists of four measures, each rated on a scale from 1 to 5. It is not known
how these measures relate to each other in their contribution to their alignment factor
category. In order to ensure the objectivity for these ratings, the decision was made to
take the average ratings of subsidiary measures for such cases.
This process results in a list of measures for each alignment factor category, along with the necessary
information to rate each of the measures, and on what basis each rating is provided.

45
5.3.2. RESULTS
The process described above was carried out in order to construct a list of measures and rating criteria for the
measurement of strategic alignment. This construction is described below, for each alignment factor category:
INTENTION & SUPPORT
Step 1: Extracting measures from the labelling structure
In Figure 11 the labelling structure for alignment factors on intention and support are presented. Based on this
structure, commitment and management support are used as measures for this alignment factor category.
Figure 11 ‐ Labelling tree: intention & support
Step 2 ‐4: Gather available information for each measure and construct grouping of information
COMMITMENT
An overview of the available information on commitment is given in the table below:
Sources alignment
factors
Teo & Ang (1999) Top management is committed to the strategic use of IT
- Elevation of hierarchical position CIO
- Setting up an IT steering committee
- Allocation of adequate resources (e.g. funds and manpower)
Huang & Hu (2007) Institutionalising the culture of alignment
- Management promotes alignment by institutionalising the
elements of alignment into organizational routines
SAMM N/A
Additional related
items
N/A
In a study by Chan (2002) it was shown that elevation of the CIO and the introduction of an IT steering
committee are only of moderate importance. It showed that the informal aspects of the organisational
structure were far more important than the formal ones. The informal aspect of the CEO‐CIO relationship is
taken into account in the alignment factor category ‘working relationship’, as is that of the IT steering
committee. Therefore, the items on the CIO’s position and the IT steering committee are omitted here.
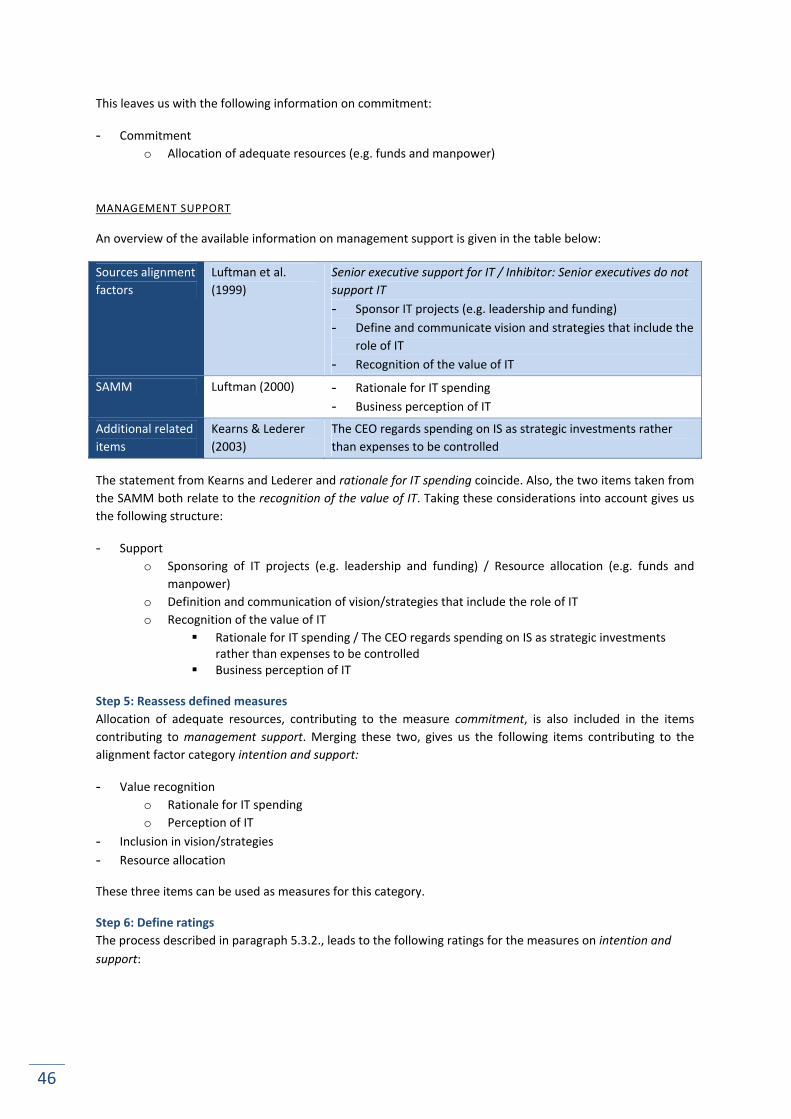
46
This leaves us with the following information on commitment:
- Commitment
o Allocation of adequate resources (e.g. funds and manpower)
MANAGEMENT SUPPORT
An overview of the available information on management support is given in the table below:
Sources alignment
factors
Luftman et al.
(1999)
Senior executive support for IT / Inhibitor: Senior executives do not
support IT
- Sponsor IT projects (e.g. leadership and funding)
- Define and communicate vision and strategies that include the
role of IT
- Recognition of the value of IT
SAMM Luftman (2000) - Rationale for IT spending
- Business perception of IT
Additional related
items
Kearns & Lederer
(2003)
The CEO regards spending on IS as strategic investments rather
than expenses to be controlled
The statement from Kearns and Lederer and rationale for IT spending coincide. Also, the two items taken from
the SAMM both relate to the recognition of the value of IT. Taking these considerations into account gives us
the following structure:
- Support
o Sponsoring of IT projects (e.g. leadership and funding) / Resource allocation (e.g. funds and
manpower)
o Definition and communication of vision/strategies that include the role of IT
o Recognition of the value of IT
Rationale for IT spending / The CEO regards spending on IS as strategic investments rather than expenses to be controlled
Business perception of IT
Step 5: Reassess defined measures
Allocation of adequate resources, contributing to the measure commitment, is also included in the items
contributing to management support. Merging these two, gives us the following items contributing to the
alignment factor category intention and support:
- Value recognition
o Rationale for IT spending
o Perception of IT
- Inclusion in vision/strategies
- Resource allocation
These three items can be used as measures for this category.
Step 6: Define ratings
The process described in paragraph 5.3.2., leads to the following ratings for the measures on intention and
support:

47
Measure Rating
Value recognition
Rated according to “rationale for IT spending” of the SAMM:
1‐ Reduce costs
2‐ Productivity, efficiency
3‐ Also a process enabler
4‐ Process driver
5‐ Competitive advantage, profit
And to “business perception of IT” of the SAMM:
1‐ Cost of doing business
2‐ Becoming an asset
3‐ Enables future business activity
4‐ Drives future business activity
5‐ Partner with business in creating value
Inclusion in vision/strategies Rating based on management practice “Define and communicate vision and strategies that include the role of IT” (Luftman, et al., 1999). Average of following ratings: 1‐ No vision on IT by top management
3‐ Only short‐term vision
5‐ Also long‐term vision
and 1‐ Vision is not communicated by top management
3‐ Only communicated on request
5‐ Communicated
Resource allocation Rating based on perceived adequacy of funds and manpower provided for
IT. These ratings are provided by the informants.
WORKING RELATIONSHIP
Step 1: Extracting measures from the labelling structure
In Figure 12 the labelling structure for alignment factors on the working relationship are presented. Based on
this structure, communication and partnership are used as measures for this alignment factor category.
Step 2 ‐4: Gather available information for each measure and construct grouping of information
COMMUNICATION
An overview of the available information on communication is given in the table below:
Sources alignment
factors
Teo & Ang (1999) There is frequent communication between user and IS department
Reich & Benbasat
(2000)
Communication between business and IT executives
Huang & Hu (2007) Maintaining effective communication channels
SAMM Luftman (2000) - Style of communication
o One‐way versus two‐way
o Formal versus informal
- IT‐business liaison staff: rated by presence and efficiency
Additional related Kearns & Lederer - The CIO has regular informal contacts with top management

48
items (2003) - The CIO has easy access to the CEO
- The CIO has frequent contacts with the CEO
The additional information taken from the SAMM and Kearns and Lederer coincide with the different
individual alignment factors: the different items contribute to the effectiveness of communication channels
and a distinction can be made between general business‐IT contact and business and IT executives. Structuring
the information above by this distinction, gives us the following:
- Communication
o CIO‐CEO relationship:
The CIO has easy access to the CEO
The CIO has frequent contacts with the CEO
o IT‐business relationship:
Contact frequency IT‐business
Style of communication
Presence and efficiency IT‐business liaison staff
Figure 12 ‐ Labelling tree: working relationship

49
PARTNERSHIP
An overview of the available information on partnership is given in the table below:
Sources alignment
factors
Luftman (1999) IT involved in strategy development
Business‐IT partnership
Teo & Ang (1999) Business and IS management work together in partnership in
prioritizing applications
Chan (2002) IS personnel participate in business planning
Kearns & Lederer
(2003)
The CIO participates in business planning
- CIO attends business planning meetings
- CIO contributes to the formulation of business goals
The CEO participates in IT planning
- The CEO plays an important role in the IS steering committee
SAMM Luftman (2000) - How projects are prioritised: partnership in determination
prioritisation criteria
Additional related
items
N/A
In the category intention and support it was explained why formal structures such as an IT steering committee
are not taken into account. Because of this, the items on the role of the CEO in the steering committee will not
be taken into account, but rather the role of the CEO in the planning process in general.
Amongst these items, two topics can be distinguished: partnership in planning processes and project
prioritization. For the planning process, another distinction can be made: IT’s involvement in business strategy
development and the role of the CEO in IT planning.
Structuring the available information by these distinctions, with the consideration above taken into account,
results in the following list:
- Partnership
o Planning and strategy development
Role IT in business strategy development
IT involvement in strategy development / IS personnel participate in business
planning
The CIO participates in business planning
o CIO attends business planning meetings
o CIO contributes to the formulation of business goals
Role CEO in IT planning
CEO participates in IT planning
o Project prioritisation
Partnership in prioritisation
How projects are prioritised: partnership in determination prioritisation criteria
Step 5: Reassess defined measures
A cause to reassess the defined measures did not present itself.
Step 6: Define ratings
The process described in paragraph 5.3.2., leads to the following ratings for the measures on the working
relationship:

50
Measure Rating
Communication: CIO‐CEO
relationship
CEO’s accessibility for CIO: Rating on adequacy of accessibility provided
by informants
Contact frequency CEO‐CIO: Rating on adequacy of contact frequency
provided by informants
Communication: IT‐business
relationship
Contact frequency IT‐business: Rating on adequacy of contact frequency
provided by informants
Style of communication: Rated according to “Style and ease of access”
of the SAMM:
1‐ Business to IT only, formal
2‐ One‐way, somewhat informal
3‐ Two‐way, formal
4‐ Two‐way, somewhat informal
5‐ Two‐way, informal and flexible
Presence and efficiency IT‐business liaison staff: Rated according to “IT‐
Business liaison staff” of the SAMM:
1‐ None, or only as needed
2‐ Primary IT‐business link
3‐ Facilitate knowledge transfer
4‐ Facilitate relationship building
5‐ Building relationship with partners
Partnership: participation
planning process
Role IT in business strategy development: rated according to: o Degree of IT involvement: rating provided by
informants
o Attendance CIO in business meetings: rated from 1‐
never to 5‐ (almost) always
o Contribution CIO to business goals: rated from 1‐never
to 5‐ (almost) always
Role CEO in IT planning: contribution CEO rated from 1‐never to 5‐
(almost) always
Partnership: determination
prioritisation criteria
Rated according to “How projects are prioritized” of the SAMM:
1‐ React to business or IT need
2‐ Determined by IT function
3‐ Determined by business function
4‐ Mutually determined
5‐ Partner’s priorities are considered

51
SHARED DOMAIN KNOWLEDGE
Step 1: Extracting measures from the labelling structure
In Figure 13 the labelling structure for alignment factors on shared domain knowledge are presented. Based
on this structure, IT’s business knowledge and business’ IT knowledge are used as measures for this alignment
factor category.
Figure 13 ‐ Labelling tree: shared domain knowledge
Step 2 ‐4: Gather available information for each measure and construct grouping of information
IT’S BUSINESS KNOWLEDGE
An overview of the available information on IT’s business knowledge is given in the table below:
Sources alignment
factors
Luftman (1999) IT understands the business / Inhibitor: IT does not understand
business
Teo & Ang (1999) IS management is knowledgeable about business
Business goals and objectives are made known to IS management
The corporate business plan is made available to IS management
SAMM Luftman (2000) - Understanding of business by IT
Additional related
items
Chan et al. (2006) Shared domain knowledge
- IS managers are kept informed about key business initiatives
and plans

52
In this information a distinction can be made between items on business knowledge in general and the sharing
of organisation specific information with IT. Accordingly, IT’s business knowledge is determined by the
following items:
- IT’s business knowledge
o Understanding of business by IT
o Information sharing
BUSINESS’ IT KNOWLEDGE
An overview of the available information on business’ IT knowledge is given in the table below:
Sources alignment
factors
Teo & Ang (1999) Top management is knowledgeable about IT
SAMM Luftman (2000) - Understanding of IT by business
Additional related
items
Chan et al. (2006) Shared domain knowledge
- Top management follows information technology
developments
The three mentioned items do not give cause for a further distinction of the measure business’ IT knowledge.
Step 5: Reassess defined measures
A cause to reassess the defined measures did not present itself.
Step 6: Define ratings
The process described in paragraph 5.3.2., leads to the following ratings for the measures on shared domain
knowledge:
Measure Rating criteria
IT’s business knowledge Understanding of business by IT: rated according to “Understanding of business by IT” of the SAMM: 1‐ IT management lacks understanding
2‐ Limited understanding by IT management
3‐ Good understanding by IT management
4‐ Understanding encouraged among IT staff
5‐ Understanding required of all IT staff
Information sharing: This measure concern IT’s knowledge on business goals and the sharing of the business plan with IT. These items can be rated as follows: 1‐ Business goals not known to IT management
3‐ Limited knowledge
5‐ Good knowledge
and 1‐ Business plans not available for IT management
3‐ Available on special request
5‐ Provided by management
Averaging these ratings results in a rating on a 1‐5 scale for information
sharing.
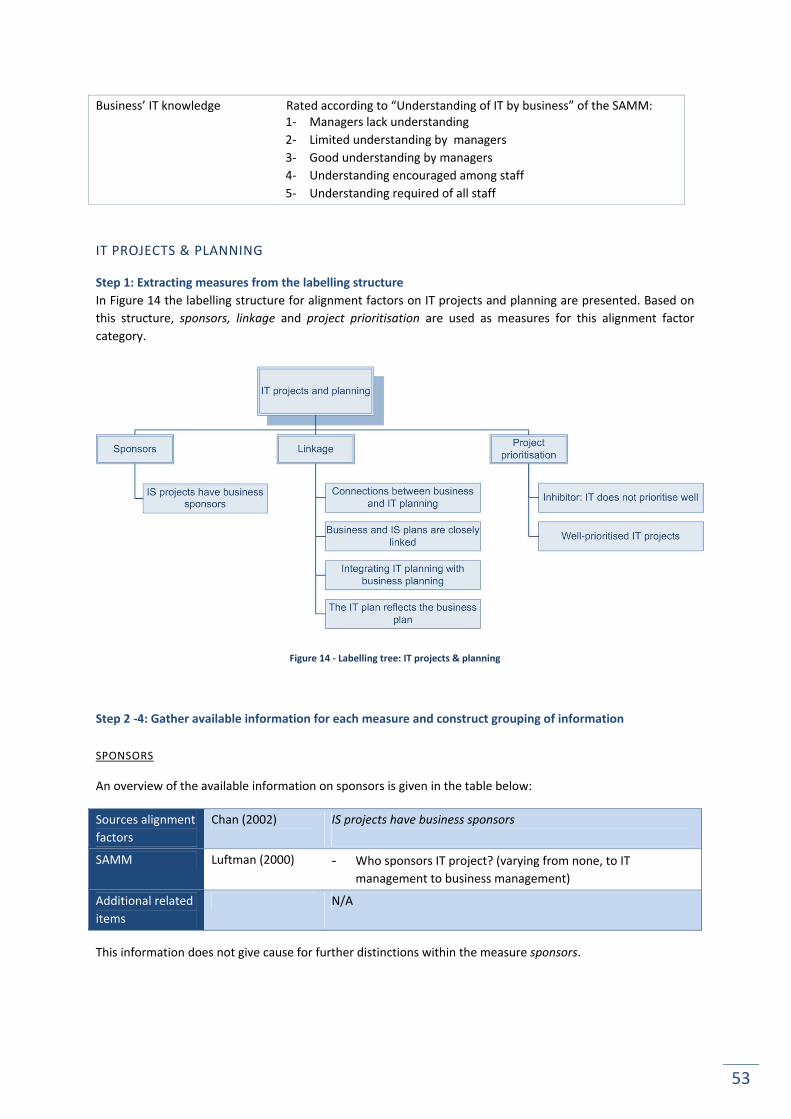
53
Business’ IT knowledge Rated according to “Understanding of IT by business” of the SAMM: 1‐ Managers lack understanding
2‐ Limited understanding by managers
3‐ Good understanding by managers
4‐ Understanding encouraged among staff
5‐ Understanding required of all staff
IT PROJECTS & PLANNING
Step 1: Extracting measures from the labelling structure
In Figure 14 the labelling structure for alignment factors on IT projects and planning are presented. Based on
this structure, sponsors, linkage and project prioritisation are used as measures for this alignment factor
category.
Figure 14 ‐ Labelling tree: IT projects & planning
Step 2 ‐4: Gather available information for each measure and construct grouping of information
SPONSORS
An overview of the available information on sponsors is given in the table below:
Sources alignment
factors
Chan (2002) IS projects have business sponsors
SAMM Luftman (2000) - Who sponsors IT project? (varying from none, to IT
management to business management)
Additional related
items
N/A
This information does not give cause for further distinctions within the measure sponsors.

54
LINKAGE
An overview of the available information on linkage is given in the table below:
Sources alignment
factors
Reich & Benbasat
(2000)
Connections between business and IT planning
Chan (2002) Business and IS plans are closely linked
Kearns & Lederer
(2003)
The IT plan reflects the business plan
- IT Plan reflects business plan: mission, goals, strategies,
external business environment forces, resource constraints.
Huang & Hu (2007) Integrating IT planning with business planning
SAMM N/A
Additional related
items
N/A
This information does not give cause for further distinctions within the measure linkage.
PROJECT PRIORITISATION
An overview of the available information on project prioritisation is given in the table below:
Sources alignment
factors
Luftman (1999) Well‐prioritised IT projects / Inhibitor: IT does not prioritise well
- Example: Firms are able to incorporate technology into their
strategies in a timely manner so that they do not fall behind
competitors
SAMM N/A
Additional related
items
SAM The study on Henderson and Venkatraman’s Strategic Alignment
Model by Avison et al. (2004) provides more insight on the
prioritisation of projects. Ideally, all projects follow a certain flow.
These flows are the different alignment perspectives defined in
the SAM (full descriptions can be found in Appendix C). The study
by Avison et al. proposed that projects are prioritised according to
how they match the ideal alignment perspective of the
organisation. So when an organisation follows the idea of
“business leads and IT follows”, this should be reflected by the
project portfolio. The projects in the project portfolio should have
business initiators and its priority should be assessed by criteria set
by the organisation. In short, the initiation of a project should
follow the process set out by the organisation.
The information above presents two different aspects on project prioritisation: whether projects are well‐
prioritised and the project initiation. Accordingly, this measure can be divided as follows:
- Project prioritisation
o Adequacy of prioritisation
o Project initiation process
Step 5: Reassess defined measures
A cause to reassess the defined measures did not present itself.
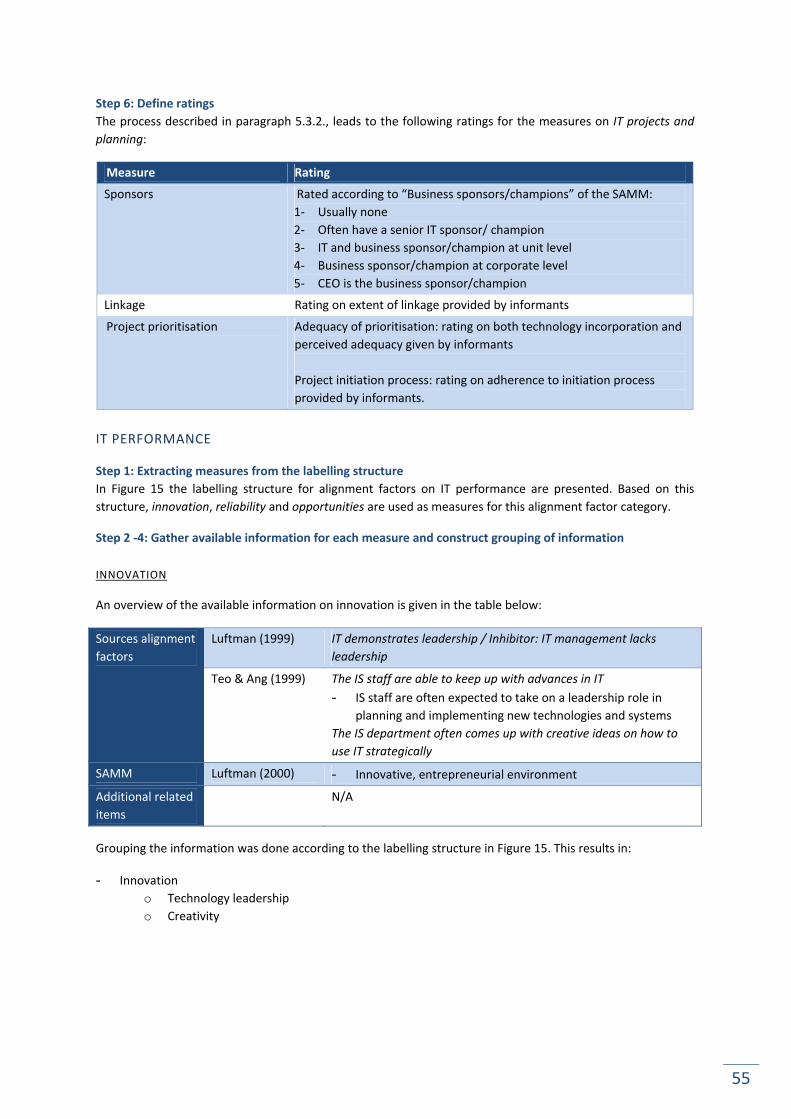
55
Step 6: Define ratings
The process described in paragraph 5.3.2., leads to the following ratings for the measures on IT projects and
planning:
Measure Rating
Sponsors Rated according to “Business sponsors/champions” of the SAMM:
1‐ Usually none
2‐ Often have a senior IT sponsor/ champion
3‐ IT and business sponsor/champion at unit level
4‐ Business sponsor/champion at corporate level
5‐ CEO is the business sponsor/champion
Linkage Rating on extent of linkage provided by informants
Project prioritisation Adequacy of prioritisation: rating on both technology incorporation and
perceived adequacy given by informants
Project initiation process: rating on adherence to initiation process
provided by informants.
IT PERFORMANCE
Step 1: Extracting measures from the labelling structure
In Figure 15 the labelling structure for alignment factors on IT performance are presented. Based on this
structure, innovation, reliability and opportunities are used as measures for this alignment factor category.
Step 2 ‐4: Gather available information for each measure and construct grouping of information
INNOVATION
An overview of the available information on innovation is given in the table below:
Sources alignment
factors
Luftman (1999) IT demonstrates leadership / Inhibitor: IT management lacks
leadership
Teo & Ang (1999) The IS staff are able to keep up with advances in IT
- IS staff are often expected to take on a leadership role in
planning and implementing new technologies and systems
The IS department often comes up with creative ideas on how to
use IT strategically
SAMM Luftman (2000) - Innovative, entrepreneurial environment
Additional related
items
N/A
Grouping the information was done according to the labelling structure in Figure 15. This results in:
- Innovation
o Technology leadership
o Creativity

56
Figure 15 ‐ Labelling tree: IT performance

57
RELIABILITY
An overview of the available information on reliability is given in the table below:
Sources alignment
factors
Luftman (1999) Inhibitor: IT fails to meet commitments
Teo & Ang (1999) Top management has confidence in the IS department
- Top management has confidence in the capabilities of the IS
department to deliver appropriate systems that are crucial for
the successful implementation of firm’s strategies.
The IS department provides efficient and reliable services to user
departments
The IS department is responsive to user needs
Reich & Benbasat
(2000)
Successful IT history
Chan et al. (2006) Prior IS success
- Example: past implementation failures negatively influence
top management’s on‐going perceptions of IT
SAMM N/A
Additional related
items
N/A
Grouping the information was done according to the labelling structure in Figure 15. This results in:
- Reliability
o IT history
o Perception
OPPORTUNITIES
An overview of the available information on opportunities is given in the table below:
Sources alignment
factors
Chan (2002) IS personnel make lateral short‐ or long‐term transfers into
business partner areas
Incentive/compensation bonus schemes exist
SAMM Luftman (2000) - Career crossover opportunities
Additional related
items
N/A
Grouping the information was done according to the labelling structure in Figure 15. This results in:
- Opportunities
o Cross‐over opportunities
o Bonus schemes
Step 5: Reassess defined measures
A cause to reassess the defined measures did not present itself.
Step 6: Define ratings
The process described in paragraph 5.3.2., leads to the following ratings for the measures on IT performance:

58
Measure Rating
Innovation
Technology leadership: rating on leadership provided by informants
Delivered services: rating provided by informants on the perceived
extent to which IT projects match business needs
Creativity: rated according to “Innovative, entrepreneurial
environment” of the SAMM:
1‐ Discouraged
2‐ Somewhat encouraged at unit level
3‐ Strongly encouraged at unit level
4‐ Also at corporate level
5‐ Also with partners
Reliability IT history: rating on successfulness of IT provided by informants, by
averaging their scores on:
‐ IT meeting their commitments
‐ Delivered products
Perception: perceived reliability of the IT department by top
management rated by informants
Opportunities Cross‐over opportunities: rated according to “Career crossover
opportunities” of the SAMM:
1‐ Job transfers rarely occur
2‐ Occasionally occur within unit
3‐ Regularly occur for unit management
4‐ Regularly occur at all unit levels
5‐ Also at corporate level
Bonus schemes: rated by presence and effectiveness: 1‐ No bonus schemes are in place
3‐ Bonus schemes exist but do not amount to much
5‐ Bonus schemes exist and provide incentive for IT staff
5.4. INTERVIEW QUESTIONS
In order to rate all of the constructed alignment factor categories and measures, a set of interview questions
was constructed as a basis for each interview. This list of questions was supplemented with an overview of the
measures and ratings in the actual interviews, to get more precise and in‐depth information where necessary.
The list of interview questions is given in Appendix I, on page 117. The Appendix also provides details on which
questions contribute to which rating.
With this list of interview questions, two separate interviews were created. One of the interviews focuses on
the business perspective on strategic alignment, the other on the IT perspective. How the interview questions
were split amongst them, is also shown in Appendix I.

59
5.5. RECAPITULATION
In Figure 16, an overview of the alignment factor categories and measures constructed in this chapter is
presented. In Appendix H of this report, a full list of all the constructed ratings is presented. The constructed
interview questions corresponding to these ratings are presented in Appendix I.
Figure 16 ‐ Overview of designed measurement structure

60
61
6. CASE STUDY This chapter presents all details and results of the case study carried out for this project. This includes case
descriptions, results, evaluation and the main findings of this research phase.
6.1. OUTLINE
An overview of the case study set up is already given in chapter 3, on pages 20‐23. Now that the basis for a
measurement method has been set up, it is possible to fill in the further details of the case study. More
specifically, the details on how the case study data will be evaluated
With the information In the preceding phases of this research project, literature has been reviewed and
synthesised in order to set up the basis for a measurement method on strategic alignment.
The basis for this measurement method is formed by the alignment factor categories constructed in the
previous chapter. Based on the literature that led to the construction of these categories, several measures
were defined for each category. It is important to note that as this point, there is no information available on
the weights of any of the measures. This means that the scores from using these measures will not yet be
reliable.
Nevertheless we want to know if the information gathered and synthesised forms a good basis for further
development of a measurement method. For this purpose, a case study is carried out to perform a sanity
check. This sanity check will consist of a number of different aspects:
A comparison of the measurement results with a self‐assessment
The self‐assessment is performed by the case informants, by rating the strategic alignment of their
organisation and naming the hindrances they experience in aligning business and IT.
Where possible, a comparison of the measurement results with an external assessment
For two of the investigated organisation, an external party was available that was very familiar with
the organisation. This external party rated each of the measures defined in the measurement method,
and level of strategic alignment for the organisation.
Occurrence of alignment issues, as stated by informants, in measurement results
The comparison of the measurement with the self‐assessment and external assessment should not show any
strong contradictions, and matters that are experienced as major issues in achieving strategic alignment
should show in the measurement results.
For example, when the self‐assessment and external assessment of a case show that an organization is well‐
aligned, we expect our measurement to return high ratings. When the results show low ratings, something is
off. When this occurs consistently, this indicates the measurement could not give a good representation of
alignment in practice.
Also, the measurement method should reveal major issues in achieving strategic alignment. This would mean
that the method, constructed solely on the basis of literature, shows connections with strategic alignment in
practice.

62
6.2. CASE DESCRIPTIONS
This case study consists of 5 cases. Below, a description is given on each of the cases. In section 6.2.1. an
overview is given of the most relevant details for each organisation.
ORGANISATION A
This organisation is an asset manager operational around the globe, and is a subsidiary of a larger financial
organisation. The organisation is divided according to the regions they operate in. The part of the organisation
investigated in this research targets the European market, and employs 1400 FTE. It has a separate IT (and
other technology) group, run on a European level. This European IT group is concentrated mostly in The
Netherlands with 80 FTE out of a total 85‐90 FTE. This IT group has an annual budget of EUR 55 Million, EUR 33
Million of which is designated for build‐projects.
ORGANISATION B
This organisation is a significant player in the Dutch consumer credit market and part of a larger global
organization, mostly active in Europe. In total, the organisation employs 10,500 FTE, of which 323 are located
in The Netherlands. Out of 323 FTE, 60 belong to the Dutch IT group, which operates independently. This
group has a yearly budget of EUR 12 Million for run‐projects and EUR 13 Million for build‐projects.
ORGANISATION C
Organisation C is an online broker bank, offering their services in three different European countries. In total
the organization employs 602 FTE, of which 150 FTE are IT personnel. These IT resources are divided over a
number of front‐end departments (one for each business division) and a number of back‐end departments.
The back‐end departments are part of a centralized IT group, dealing with matters as control and
infrastructure. The personnel for the front‐end are placed within the different business divisions, though they
are officially a part of the IT group. In practice, they fall under control of the business divisions, in a product
development group. The front‐end IT groups deal with matters as software development and application
management. The yearly budget for IT is about EUR 30 Million.
ORGANISATION D
Organisation D is a large financial organisation, offering a number of services such as insurances and pensions.
The organization in active in The Netherlands, Belgium and Germany and operates under a number of brands..
In total the organization employs 6077 FTE. Out of these 6077, 600 to 650FTE are IT staff, operational in a
centralised IT department. In total, al yearly budget of EUR 135 Million is available for IT.
ORGANISATION E
This organisation is a Dutch pension administrator. The organisation employs 1300 FTE in total, of which 180
FTE is IT personnel. IT is structured as a federative organisation, with a central unit (90 FTE) but also
decentralised staff (90 FTE) for the main business divisions. IT has a yearly budget of EUR 30 Million, 20 Million
of which is designated for build‐projects.

63
6.2.1. SUMMARISED DESCRIPTIONS
Org. Employees (in FTE) Budget (in EUR Million)
[build‐run]
Structure
Total IT
A 1400 85‐90 55 [33‐22] Subsidiary of larger organisation, with regional
divisions. Each region has a decentralised IT
group.
B 323 60 25 [13‐12] Subsidiary of larger organisation, with regional
divisions. Each region has a decentralised IT
group.
C 602 150 30 Federal structure: back‐end IT is centralised,
front‐end decentralised. The decentralised IT
units are under direct control of the business
divisions.
D 6077 600 135 Organisation operates under a number of
brands. IT is centralised for the entire
organisation.
E 1066 180 30 [20‐10] Federal structure: software development is
decentralised for the major business divisions
(fall under control of IT).
6.3. RESULTS
In this section, the results of all of the components of this case study are presented; the measurement results,
the self‐assessment, and where applicable, the external assessment. These results are presented per
organisation. At the end of this section a summarised overview is given of these results.
6.3.1. RESULTS ORGANISATION A
MEASUREMENT RESULTS
Details of the measurement are described in Appendix J of this report, from page 123 onwards. Below, an
overview is given of the main results for each alignment factor category, along with the corresponding rating.
Alignment factor Analysis Rating
Intention &
support
IT is looked upon as something that provides efficiency and flexibility. IT’s
goal is to support the business and follow their needs. This result is a lower
score for the value recognition of IT. This lower score is compensated by
the fact that there is a vision of IT that is well communicated, and a positive
rating on the resource allocation for IT.
4‐
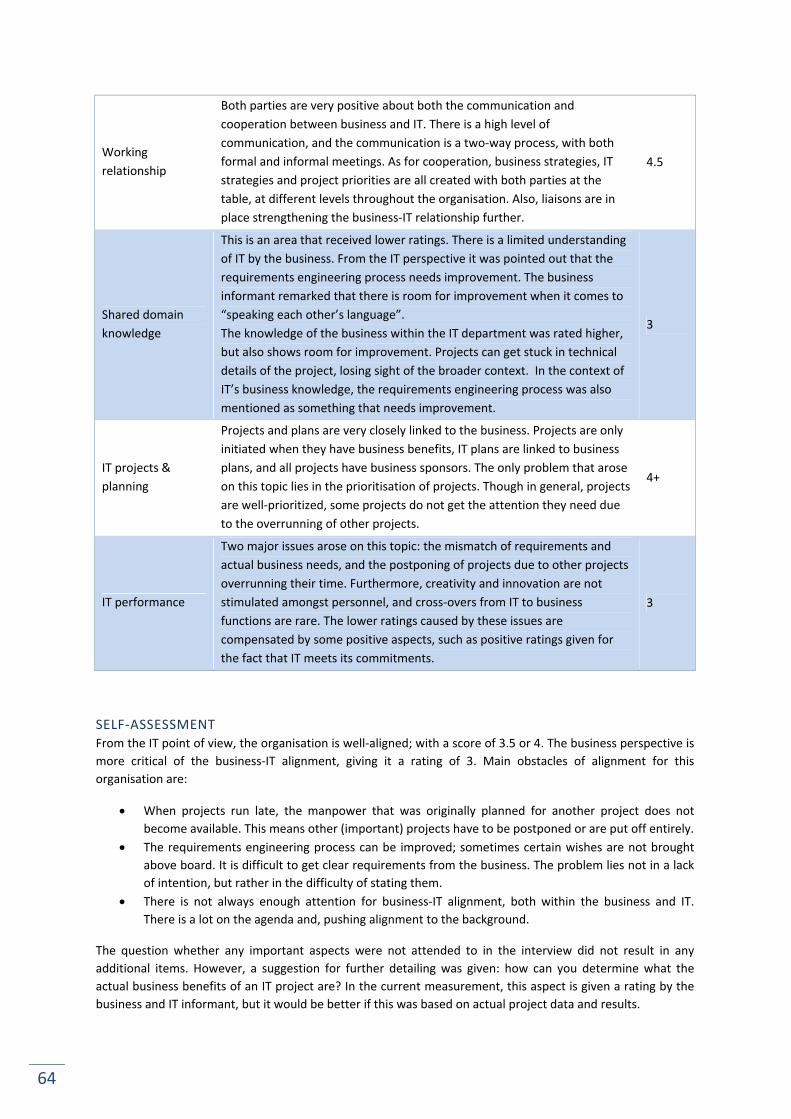
64
SELF‐ASSESSMENT
From the IT point of view, the organisation is well‐aligned; with a score of 3.5 or 4. The business perspective is
more critical of the business‐IT alignment, giving it a rating of 3. Main obstacles of alignment for this
organisation are:
When projects run late, the manpower that was originally planned for another project does not
become available. This means other (important) projects have to be postponed or are put off entirely.
The requirements engineering process can be improved; sometimes certain wishes are not brought
above board. It is difficult to get clear requirements from the business. The problem lies not in a lack
of intention, but rather in the difficulty of stating them.
There is not always enough attention for business‐IT alignment, both within the business and IT.
There is a lot on the agenda and, pushing alignment to the background.
The question whether any important aspects were not attended to in the interview did not result in any
additional items. However, a suggestion for further detailing was given: how can you determine what the
actual business benefits of an IT project are? In the current measurement, this aspect is given a rating by the
business and IT informant, but it would be better if this was based on actual project data and results.
Working
relationship
Both parties are very positive about both the communication and
cooperation between business and IT. There is a high level of
communication, and the communication is a two‐way process, with both
formal and informal meetings. As for cooperation, business strategies, IT
strategies and project priorities are all created with both parties at the
table, at different levels throughout the organisation. Also, liaisons are in
place strengthening the business‐IT relationship further.
4.5
Shared domain
knowledge
This is an area that received lower ratings. There is a limited understanding
of IT by the business. From the IT perspective it was pointed out that the
requirements engineering process needs improvement. The business
informant remarked that there is room for improvement when it comes to
“speaking each other’s language”.
The knowledge of the business within the IT department was rated higher,
but also shows room for improvement. Projects can get stuck in technical
details of the project, losing sight of the broader context. In the context of
IT’s business knowledge, the requirements engineering process was also
mentioned as something that needs improvement.
3
IT projects &
planning
Projects and plans are very closely linked to the business. Projects are only
initiated when they have business benefits, IT plans are linked to business
plans, and all projects have business sponsors. The only problem that arose
on this topic lies in the prioritisation of projects. Though in general, projects
are well‐prioritized, some projects do not get the attention they need due
to the overrunning of other projects.
4+
IT performance
Two major issues arose on this topic: the mismatch of requirements and
actual business needs, and the postponing of projects due to other projects
overrunning their time. Furthermore, creativity and innovation are not
stimulated amongst personnel, and cross‐overs from IT to business
functions are rare. The lower ratings caused by these issues are
compensated by some positive aspects, such as positive ratings given for
the fact that IT meets its commitments.
3

65
EXTERNAL ASSESSMENT
No external assessment was available for this organisation.
6.3.2. RESULTS ORGANISATION B
MEASUREMENT RESULTS
Details of the measurement are described in Appendix J of this report, from page 128 onwards. Below, an
overview is given of the main results for each alignment factor category, along with the corresponding rating.
SELF‐ASSESSMENT
From the IT point of view, the organisation is well‐aligned; giving it a rating of 4 out of 5. The business
informant differentiated his rating, making a distinction between the recent situation and the situation with all
the changes currently happening around IT kept in mind. The ratings are a 3+ and 4‐ respectively. These
Alignment factor Analysis Rating
Intention &
support
It is seen as something that should always follow the business, contributing to
efficiency but also enable new functionality for customers. A vision on IT is still
in development, but the IT staff has a good idea about its direction. Also, the
allocation of resources is very flexible, and is not an issue.
4‐
Working
relationship
Communication is informal, two‐way and flexible and the contact frequency is
perceived as sufficient. Several liaison‐like functions are in place to facilitate
the relationship building between business and IT.
In the partnership between business and IT, the business leads both on
strategy development but also in project prioritisation. IT is involved in both
processes, but for the strategy development only involved in strategy
development on an operational level.
4‐
Shared domain
knowledge
There is a large gap between the business’ knowledge on IT and IT’s knowledge
on the business. IT’s business knowledge is rated very high by both business
and IT, and is something that is required of all IT staff.
The IT knowledge amongst business personnel is rated poorly. A new
department has been set up to act as a middle man between business and IT in
product development, in order to deal with this issue.
3+
IT projects &
planning
Projects have business sponsors and there is a high level of linkage between
business plans and IT plans. Also, when projects are initiated, they need to
have a business driver. The prioritisation of projects was rated as reasonable,
needing improvement.
4
IT performance
This category received a low rating, all subcategories were rated poorly. On
the IT Innovation, it was stated this is not encouraged at all. Nevertheless the
organisation offers services that are reasonably state of the art.
The reliability of the IT department received low ratings due to the history of
IT. IT failed to meet commitments in the past and there should be a higher
responsiveness to business wishes.
Furthermore, there are few IT‐to‐business cross‐overs, and bonus schemes or
flexible salaries are only available for higher levels within the organisation.
2

66
changes have to do with friction between business and IT in the past. For this purpose, several changes were
made within the organisation, most importantly:
Setting up a vision on IT
Setting up a product development department, as a liaison between business and IT
This friction was ascribed to the growth of the organisation. Before, there was no need for such structure, and
everything was handled at a very informal level. Now that the organisation has become larger, more formal
structures are needed.
Another obstacle lies in the way IT works. Different concepts need to be adapted, so their work does not fall
behind on the business. For example, agile development could be adopted, or a larger focus on processes.
Furthermore, the business needs to have better IT knowledge so they can better interact with IT.
The question whether any important aspects were not attended to in the interview did not result in any
additional items. However, the suggestion was made to further detail on the type of relationship that business
and IT have (e.g. client‐supplier).
EXTERNAL ASSESSMENT
The results of the external assessment for this organisation are presented below:
Topic Rating
1. Overall business‐IT alignment for this organisation 3
2. Available resources for IT (e.g. manpower and budget) 2.5
3. Recognition of the strategic value of IT for the organisation 2
4. Definition and communication of vision on the role of IT within the organisation 2
5. The business‐IT relationship in terms of intercommunication 3
6. The business‐IT relationship in terms of partnership on strategy development and project prioritisation
2.5
7. Understanding of business by IT 2
8. Understanding of IT by business 3
9. Business sponsoring for IT projects 3
10. The project portfolio, resulting from the prioritisation process 3.5
11. The extent of linkage between business and IT plans 3
12. Position compared to competitors, concerning use of technology 2.5
13. Reliability of the IT department, in terms of meeting business needs and made commitments
2.5
14. Presence of structures for IT to improve performance and alignment (cross‐over opportunities to business, bonus schemes)
1.5

67
6.3.3. RESULTS ORGANISATION C
MEASUREMENT RESULTS
Details of the measurement are described in Appendix J of this report, from page 133 onwards. Below, an
overview is given of the main results for each alignment factor category, along with the corresponding rating.
Alignment factor Analysis Rating
Intention &
support
Business and IT work together in creating strategic advantage. The business
sees software development as an important part of strategic development
and provides the resource to support this. There is both a general vision on
IT and a specific one for each business division.
4+
Working
relationship
Because of the integration of the front‐end IT groups with the business
division, the contact frequency is very high. Also on the direction level,
there is contact whenever there is a need for it. Contacts are very informal
and flexible, but often one‐way: from business to IT.
The business is very much involved in the creation of IT plans and setting
priorities for the specific business divisions, as they are in direct charge of
the front‐end IT. On a central level, IT sets its own priorities. The
involvement of IT in the business plans is limited to the operational level.
4.5
Shared domain
knowledge
With the placement of software developers within the business divisions,
their business knowledge has greatly improved. In general, having good
business knowledge is something that is encouraged amongst IT staff.
There is a good IT knowledge amongst business managers, especially in the
product development departments. However, it is not something that is
specifically encouraged.
4‐
IT projects &
planning
For IT projects, the head of a business division is its business sponsor, and
business cases are defined. When there are no clear business benefits,
projects are not initiated. Also, there is a close link between the business
plans for the divisions and the IT plans, as these IT plans are set up by the
business.
5‐
IT performance
The organisation offers state‐of‐the‐art services to their customers, but is a
fast‐follower when it comes to the technologies used. There is a good
match between what the business wants and what is delivered by IT, but
here is still a wish to improve this further. IT is seen as a motivated, hard‐
working partner, and does not lack to meet its commitments. When it
comes to the delivered products, there is however room for improvement.
Furthermore, bonus schemes are in place for all IT staff, based on IT
successes and also personal performance.
Two aspects lowering the rating for this category are creativity, which is not
something that is strongly encouraged, and the cross‐over opportunities.
These only occur within units, for the developers that are placed within the
business divisions, but not at higher levels within the organisation.
4‐

68
SELF‐ASSESSMENT
From the IT point of view, the organisation is well‐aligned; stated that it is at least worth a 4 out of 5. The
business informant was also positive on the business‐IT alignment of the organisation, rating it with a 4‐.
Only one obstacle for alignment was mentioned: the mind‐set of business and IT personnel in terms of the
business‐IT working relationship. Often there is an us‐versus‐them attitude. This needs to change in order to
achieve better results. Everyone works for the same organisation, and everyone has to work together. The
goal should be full integration of business and IT.
The question whether any important aspects were not attended to in the interview did not result in any
additional items.
EXTERNAL ASSESSMENT
No external assessment was available for this organisation.
6.3.4. RESULTS ORGANISATION D
MEASUREMENT RESULTS
Details of the measurement are described in Appendix J of this report, from page 137 onwards. Below, an
overview is given of the main results for each alignment factor category, along with the corresponding rating.
Code Alignment factor Analysis Rating
INT Intention & support
The mail goal for IT is to be a business enabler, but
thus far it has not reached this level. Also, IT is seen
more as a cost than an investment. Resources are cut
yearly and more is needed for innovation. The role of
IT is implicit, and is detailed by the IT department.
3
WOR Working relationship
Aspects on communication between business and IT
within this organisation received high ratings, both for
the CEO‐CIO contact as business‐IT in general.
The involvement of IT in setting up business strategies
is limited to a supportive and advising level. Vice
versa, the IT planning is mostly done in cooperation
with Information management. The involvement of
the CEO is limited. Prioritisation of projects is done
per business division, by the parties from within this
division.
3.5
SHA Shared domain
knowledge
IT management has good business knowledge. On the
lower levels business knowledge varies per individual,
but mostly lacks. Business goals and vision however
are shared with IT personnel and the personnel are
knowledgeable about them.
Business’ IT knowledge is more limited. Within
information management, there is good IT
knowledge, but outside of it (including top
management) the knowledge is limited.
3+

69
Code Alignment factor Analysis Rating
IPP IT projects & planning
Projects are sponsored by the director of a business
division or a manager form the division. The IT plans
are considered to be reasonably linked to the
business plans. How well‐prioritised projects are
varies per business division, in general this was
qualified as reasonable.
3.5
IPF IT performance
The organisation is not a technological leader, but is
more mainstream, and creativity is only moderately
encouraged. However, IT is responsive to user needs;
this was given a positive rating.
The same holds for the reliability of the IT
department. Only few projects run late or over
budget. An evaluation on the IT department held by
this organisation showed that business sponsors rate
the IT projects with 7.2 out of 10.
What greatly reduces the rating for IT performance
are the cross‐over opportunities and bonus schemes.
The latter are not implemented for IT and the cross‐
overs occur only occasionally, mostly for project
management.
2.5
SELF‐ASSESSMENT
From the IT point of view, the organisation is reasonably aligned; rating it with “a 3.5 at most”. The business
informant was a bit more positive on the business‐IT alignment of the organisation, rating it with a 3.5.
Two obstacles were mentioned by the informants:
A lack of understanding of each other’s domain. The business thinks that IT matters can be easily and
quickly dealt with and do not have a notion on the impact certain demands can have on IT. Business
and IT do not know how their processes and actions impact one another.
An us‐versus‐them attitude between business and IT.
The question whether any important aspects were not attended to in the interview did not result in any
additional items. However, the suggestion was made to further detail on the type of relationship that business
and IT have. It was stated that purely a client‐supplier relationship is not a situation to be desired. It is
important that business and IT act as partners.
EXTERNAL ASSESSMENT
The results of the external assessment for this organisation are presented below:
Topic Rating
1. Overall business‐IT alignment for this organisation 3.5
2. Available resources for IT (e.g. manpower and budget) 3.5
3. Recognition of the strategic value of IT for the organisation 63
4. Definition and communication of vision on the role of IT within the organisation 3.5
5. The business‐IT relationship in terms of intercommunication 3.5
6. The business‐IT relationship in terms of partnership on strategy development and project prioritisation
3

70
7. Understanding of business by IT 3.5
8. Understanding of IT by business 2.5
9. Business sponsoring for IT projects 4
10. The project portfolio, resulting from the prioritisation process 4
11. The extent of linkage between business and IT plans 2.5
12. Position compared to competitors, concerning use of technology 3
13. Reliability of the IT department, in terms of meeting business needs and made commitments
3.5
14. Presence of structures for IT to improve performance and alignment (cross‐over opportunities to business, bonus schemes)
2.5
6.3.5. RESULTS ORGANISATION E
MEASUREMENT RESULTS
Details of the measurement are described in Appendix J of this report, from page 142 onwards. Below, an
overview is given of the main results for each alignment factor category, along with the corresponding rating.
Code Alignment factor Analysis Rating
INT Intention & support
IT is seen as a business enabler. Visions on IT are
constructed at a decentral level. On the level of top
management, a vision on the role of IT has not been
defined. Budget is not considered an issue for IT.
3+
WOR Working relationship
The reporting structure ‐ The CIO reports to the CFO‐
hinders the accessibility of the CEO for the CEO in this
organisation. The CEO and CIO do have regular contact
at an informal level. On the topic of business‐IT
communication in general, both business and IT are
positive.
The level of partnership between business and IT is
something that needs improvement, both IT’s
involvement in business planning and vice versa. More
specifically the role of the CEO in the IT planning
process. Project prioritisation is also mainly done by
the business division.
3+
SHA Shared domain knowledge
Both for business and IT, shared domain knowledge is
limited to the management levels within the
organisation. For IT the business knowledge is
considered to be good, for the business this is
somewhat more limited and in need of improvement.
3+
IPP IT projects & planning
Projects are considered to be well‐prioritised and
tightly linked to business plans. Projects do have
business sponsors, but not at a corporate level; they
are sponsored at a unit level.
4

71
Code Alignment factor Analysis Rating
IPF IT performance
The organisation is considered a technological leader
and responsive to user needs. Also, creativity is
stimulated through an innovation platform. The
reliability of the IT department was also given positive
ratings. Cross‐overs from business to IT can occur (and
have) at all organisational levels. The bonus schemes
for IT however still need improvement; they are
applied beyond a certain pay scale and should focus
more on personal performance and contributions.
4
SELF‐ASSESSMENT
From the IT point of view, the organisation is reasonably aligned; rating it a 4‐ out of 5. The business informant
was a bit less positive on the business‐IT alignment of the organisation, rating it with 3.5.
Two obstacles were mentioned by the informants:
There is not enough control from the top level of the organisation. The business divisions operate
independently when it comes to IT, which may reduce efficiency.
The business underestimates the work that is required to meet business needs. They lack knowledge
on the complexity of IT. IT constantly has to explain this.
The question whether any important aspects were not attended to in the interview did not result in any
additional items. However, the suggestion was made to further detail on the type of relationship that business
and IT have. There needs to be mutual respect, a shared frame of reference and shared support. Such matters
can be improved by structures as an IT governance board.
EXTERNAL ASSESSMENT
No external assessment was available for this organisation.
6.3.6. SUMMARISED RESULTS
The tables hereafter give an overview of the results for each case within this study.
Organisation Obstacles
A When projects run late, the manpower that was originally planned for another
project does not become available. This means other projects have to be postponed
or are put off entirely.
The requirements engineering process can be improved; sometimes certain wishes
are not brought above board. It is difficult to get clear requirements from the
business. The problem lies not in a lack of intention, but rather in the difficulty of
stating them.
There is not always enough attention for business‐IT alignment, both within the
business and IT. There is a lot on the agenda and, pushing alignment to the
background.

72
Organisation Obstacles
B Growth of the organisation. Before, there was no need for such structure, and
everything was handled at a very informal level. Now that the organisation has
become larger, more formal structures are needed.
Different concepts need to be adapted by IT, so their work does not fall behind on
the business. For example, agile development could be adopted, or a larger focus on
processes.
Business needs to have better IT knowledge so they can better interact with IT.
C Attitude toward the business‐IT relationship. The us‐versus‐them relation needs to
change into an integration of business and IT.
D A lack of understanding of each other’s domain. The business thinks that IT matters
can be easily and quickly dealt with and do not have a notion on the impact certain
demands can have on IT. Business and IT do not know how their processes and
actions impact one another.
An us‐versus‐them attitude between business and IT.
E There is not enough control from the top level of the organisation. The business
divisions operate independently when it comes to IT, which may reduce efficiency.
The business underestimates the work that is required to meet business needs. They
lack knowledge on the complexity of IT. IT constantly has to explain this.
Organisation A Organisation B Organisation C Organisation D Organisation E
M S E M S E M S E M S E M S E
Strategic alignment 4‐ 3+/4‐ 3.5 3+/4 3 4+ 4‐/4 3+ 3.5 3.5 3.5 3.5/4‐
Intention & Support 4‐ 4‐ 2+ 4+ 3 3+ 3+
Value recognition 2.5 3 2 5 2.5 3 3
Inclusion in vision 5 3 2 4 3.5 3.5 3
Resource allocation 4 5 2.5 4 3 3.5 4
Working Relationship 4.5 4‐ 3‐ 4.5 3.5 3+ 3+
Communication 4.5 4 3 5‐ 4+ 3.5 3.5
Partnership 5‐ 3.5 2.5 4.5 3‐ 3 3
Shared Domain Knowledge 3 4‐ 2.5 4‐ 3+ 3 3+
IT’s business knowledge 4 4.5 2 4.5 4 3.5 4
Business’ IT knowledge 2 2 3 3 2.5 2.5 2.5
IT Projects & Planning 4+ 4 3+ 5‐ 3.5 3.5 4
Sponsors 4 4 3 5 3.5 4 3
Linkage 5 4 3 5 3.5 2.5 5
Prioritisation 3.5 3.5 3.5 4.5 4‐ 4 4+
IT Performance 3 2 2+ 4‐ 2.5 3+ 4
Innovation 3 2.5 2.5 3.5 2.5 3+ 4.5
Reliability 3.5 2 2.5 4 4‐ 3.5 4
Opportunities 3 2 1.5 3.5 1.5 2.5 4
M = Measurement results S = Self‐assessment E = External assessment
bold = rating determined by average of lower‐level ratings
regular = rating determined by direct input from informant(s)

73
6.4. EVALUATION
The evaluation of the case results was done according to the three aspects stated in section 6.1:
A comparison of the measurement results with a self‐assessment
Where possible, a comparison of the measurement results with an external assessment
Occurrence of alignment issues, as stated by informants, in measurement results
In this section, these aspects are discussed for each of the cases. This evaluation per case is followed by a
summary of the main evaluation findings.
6.4.1. EVALUATION ORGANISATION A
Comparison of the measurement results with a self‐assessment
The self‐assessment of this organisation resulted in a 3+ and 4‐ out of 5. The measurement resulted in ratings
for the alignment factor categories between 3 and 4.5, averaging at 4‐. This value lies (just) within in the range
provided by the informants.
Comparison of the measurement results with an external assessment
An external assessment was not available.
Occurrence of alignment issues, as stated by informants, in measurement results
The table below discusses how matters that were pointed out as obstacles for strategic alignment within their
organisation matches the (results of) alignment measurement.
Obstacle Reflection in measurement results
When projects run late, the manpower that was
originally planned for another project does not
become available. This means other (important)
projects have to be postponed or are put off
entirely.
This obstacle is reflected in the measurement
within three measures: prioritisation – opinion on
set criteria, IT innovation‐ responsive to user needs
and the reliability of IT ‐ perception. These three
items were rated a 3, 3 and 2 respectively, well
below the organisation’s average rating of 4‐.
The requirements engineering process can be
improved; sometimes certain wishes are not
brought above board. It is difficult to get clear
requirements from the business. The problem lies
not in a lack of intention, but rather in the difficulty
of stating them.
Though this obstacle was only mentioned by one
party as a major obstacle, the topic came up as a
problem for both informants within the held
interviews. This obstacle is reflected in three
measures: IT’s business knowledge – Understanding
of business by IT, business’ IT knowledge and
reliability of IT – perception. These items received a
rating of 3, 2 and 3 respectively, well below the
organisation’s average rating of 4‐.
There is not always enough attention for business‐
IT alignment, both within the business and IT.
There is a lot on the agenda and, pushing alignment
to the background.
Though this obstacle was not mentioned within the
measurement results as is, the low rating on value
recognition (2.5) does provide a possible
explanation for this obstacle: when the strategic
value is not recognised fully, and the role of IT is
only to follow the business, achieving alignment
may not be seen as a priority.

74
6.4.2. EVALUATION ORGANISATION B
Comparison of the measurement results with a self‐assessment
The self‐assessment of this organisation resulted in a 3+ and 4 out of 5. The measurement resulted in ratings
for the alignment factor categories between 2 and 4, averaging at 3.5. This value lies (just) within in the range
provided by the informants. There seems to be a significant gap between the rating provided by business and
the rating by IT. An explanation for this can be found in the fact that the organisation is in the process of
adapting changes concerning business‐IT alignment. The IT informant is relatively new to the organisation, and
is familiar with only the improved situation, while the business informant has been at the organisation for a
longer time and held a position in IT before his current position. This possible explanation is supported by the
fact that the business informant distinguished the situation as it was and is, and the expected situation in the
near future. The situation as‐is was given the rating of 3+, but the near‐future a 4‐.
Comparison of the measurement results with an external assessment
Again, it is important to keep in mind that this organisation is adopting a number of changes concerning
business‐IT alignment. The informant for this external assessment is someone who carried out a consulting
role in this process. The low scores are more in line with the ratings provided by the business informant of this
organisation than the IT informant.
Two measures stand out in the comparison of the ratings provided by the measurement results and the
external assessment:
Resource allocation
IT’s business knowledge
Both these measures were rated 2.5 points out of 5 higher by the business and IT informant than by the
external informant. Needless to say, a difference of 50% is very significant.
In the measurement method both informants were very positive about the resource allocation and the
flexibility of it. The rating is based purely on this perception, making it very subjective. The same hold for IT’s
business knowledge. A possible explanation for the difference in the ratings is the frame of reference the
informants have on both topics. Judging on IT’s business knowledge and resource allocation is based on what
the informants perceive as necessary or ideal. In order to reduce the influence of these different perceptions,
other sources could be used in the measurement, such as actual data on the organisation (yearly budget,
manpower) for the resource allocation. Also a more objective frame of reference could be created, for
example by determining what business knowledge is important for IT. This way, this frame of reference can be
used by someone who is investigating the strategic alignment of an organisation, instead of basing ratings
completely on the perception of informants from within the organisation.
Occurrence of alignment issues, as stated by informants, in measurement results
The table below discusses how matters that were pointed out as obstacles for strategic alignment within their
organisation matches the (results of) alignment measurement.

75
Obstacle Reflection in measurement results
Growth of the organisation. Before, there was no
need for such structure, and everything was
handled at a very informal level. Now that the
organisation has become larger, more formal
structures are needed.
Because the size of the organisation is a characteristic of an organisation, instead of something an organisation can influence directly, it was not taken into account in the measurement method for strategic alignment. However, the implications of this growth are included in the method. These are the construction of a vision on IT (corresponding measure: Vision on IT) and the set‐up of a product development department (corresponding measure: Communication – IT‐business liaison staff).
Different concepts need to be adapted by IT, so
their work does not fall behind on the business.
For example, agile development could be
adopted, or a larger focus on processes.
This obstacle also came up in the measurement, for the measure IT reliability ‐ perception. It was stated that this had a sufficient level, but needed improvement, leading to a 2 as a rating. This is well below the average rating for this organisation of 3.5.
Business needs to have better IT knowledge so
they can better interact with IT.
This obstacle directly corresponds to the measure business’ IT knowledge, which was rated a 2 in the alignment measurement. This is well below the average rating for this organisation of 3.5.
6.4.3. EVALUATION ORGANISATION C
Comparison of the measurement results with a self‐assessment
The self‐assessment of this organisation resulted in a 4‐ and (at least) 4 out of 5. The measurement resulted in
ratings for the alignment factor categories between 4‐ and 5‐, averaging at 4+. This average lies just the above
the range provided by the informants (0.25 points, 5%), but the high rating is in line with the positive views
provided by the informants on the alignment of this organisation, and also the statement that the rating
would be “at least 4”.
Comparison of the measurement results with an external assessment An external assessment was not available.
Occurrence of alignment issues, as stated by informants, in measurement results
The table below discusses how matters that were pointed out as obstacles for strategic alignment within their
organisation matches the (results of) alignment measurement.
Obstacle Reflection in measurement results
Attitude toward the business‐IT relationship. The
us‐versus‐them relation needs to change into an
integration of business and IT.
Though this is not a topic that is directly reflected in
the measurement results, it does coincide with one
of the alignment factor categories: working
relationship. More specifically, the partnership
between business and IT.

76
6.4.4. EVALUATION ORGANISATION D
Comparison of the measurement results with a self‐assessment
The self‐assessment of this organisation resulted in a rating of (at most) 3.5 out of 5. The measurement
resulted in ratings for the alignment factor categories between 2.5 and 3.5, averaging at 3+. This average lies
just the below the rating provided by the informants (0.25 points, 5%). However, the results are in line with
the statement that the rating would be “at most 3.5”.
Comparison of the measurement results with an external assessment With only 0.25 points difference between the average rating from the measurement results and the rating
provided by the external assessment, these ratings can considered to be in line with each other. A closer
investigation of the results shows four measures that stand out:
Communication: difference of 0.75 points
Linkage: difference of 1 point
Innovation: difference of 0.75 points
Opportunities: difference of 1 point
A possible explanation can be found in the basis of the ratings; they are based on the perception of each
measure within the informants’ frame of reference.
This is in line with the findings of the comparison of measurement results with the external measurement of
organisation B.
Occurrence of alignment issues, as stated by informants, in measurement results
The table below discusses how matters that were pointed out as obstacles for strategic alignment within their
organisation matches the (results of) alignment measurement.
Obstacle Reflection in measurement results
A lack of understanding of each other’s domain.
The business thinks that IT matters can be easily
and quickly dealt with and do not have a notion on
the impact certain demands can have on IT.
Business and IT do not know how their processes
and actions impact one another.
This obstacle is reflected in the submeasures
understanding of business by IT and understanding
of IT by business, rated 3 and 2.5 respectively. Both
ratings are below the average rating of 3+.
An us‐versus‐them attitude between business and
IT.
Though this is not a topic that is directly reflected in
the measurement results, it does coincide with one
of the alignment factor categories: working
relationship. More specifically, the partnership
between business and IT, which was rated 3‐ in this
measurement, well below the average rating of 3+.
6.4.5. EVALUATION ORGANISATION E
Comparison of the measurement results with a self‐assessment
The self‐assessment of this organisation resulted in a 3.5 and 4‐ out of 5. The measurement resulted in ratings
for the alignment factor categories between 3+ and 4, averaging at 3.5. This value lies within in the range
provided by the informants.
Comparison of the measurement results with an external assessment An external assessment was not available.

77
Occurrence of alignment issues, as stated by informants, in measurement results
The table below discusses how matters that were pointed out as obstacles for strategic alignment within their
organisation matches the (results of) alignment measurement.
Obstacle Reflection in measurement results
There is not enough control from the top level of
the organisation. The business divisions operate
independently when it comes to IT, which may
reduce efficiency.
This obstacle concerns the balance between
centralised and decentralised IT. The formal
structure of the IT organisation is not taken into
account in the measurement method constructed
in this project. However, this topic does address a
shortcoming of the measurement as carried out in
this case study: with only one informant for the
business perspective and one for the IT perspective.
This means the investigation focuses on the level in
which the informants operate. To assess an
organisation fully, the business‐IT alignment for
every level of the organisation should be
investigated.
The business underestimates the work that is
required to meet business needs. They lack
knowledge on the complexity of IT. IT constantly
has to explain this.
This obstacle directly corresponds to the measure
business’ IT knowledge, which was rated a 2.5 in the
alignment measurement. This is well below the
average rating for this organisation of 3+.
6.4.6. BUSINESS VERSUS IT
In the evaluation of the self‐assessments and the individual answers to interview question, it was observed
that that there are differences between the ratings provided by business and IT informants. In this section, it is
investigated whether these differences are significant and if the business informants are significantly more
positive than IT informants of vice versa.
These differences are calculated for all the measures that use input from both informants (see also: Appendix:
I). The individual ratings are presented in the table on the following page, for each of the relevant measures.
The measures are obscured, as the agreement was made not to publish individual results. The measures are
listed in a random order.
On average, there is a difference between 0.27 points between the ratings provided by business and IT. As
stated in the evaluation of organisation B, the ratings provided by the informants vary because of the different
backgrounds of the informants. Leaving this organisation out of the calculation results in an average difference
of 0.23 points. Both these averages show a difference of around 5% between business and IT ratings. This is
not a significant difference, especially when taking into account that most measures are rated with only
integers (increments of 1 point).
Taking the sum of all ratings provided by business informants result in a total of 279 points out of a possible
375. For the IT informants this total lies at 290.5 points. The difference between these two sums 11.5 out of
375 points, equal to about 3%. This cannot be considered to be a significant difference.

78
Measure Organisation A Organisation B Organisation C Organisation D Organisation E
B I B I B I B I B I
5 5 4 3 4 4 3 4 3 3
4 4 5 5 4 4 3 3 4 4
4 4 3 3 4 4.5 3 3 5 5
3.5 4 2 2 4 4 4.5 4 4 4
3 3 3 3 4 4 3.5 3.5 5 4.5
4 4 4 4 5 5 4 4 4 4
3 4 3.5 5 4 4 3 3 3 3
2 2 1 2.5 3 3 2 2 2.5 3
5 5 4 4 4 5 5 4 3.5 3
5 5 4 4 4 5 4 4 3 3.5
4 5 3 4 5 5 4 4 3.5 4
4 4 5 5 5 5 4 4 5 5
4 3 3 3 5 5 4 4 3 3
4.5 5 3 4 4 4 3 3 3 4
4 5 3 4 4 4 2 2 3 3
Avg. Difference 0.33 0.47 0.17 0.17 0.23
Sum 59 62 50.5 55.5 63 65.5 52 51.5 54.5 56
6.4.7. SUMMARISED EVALUATION
The comparison of the self‐assessment with the measurement results showed no peculiarities. For
organisations A, B and E, the average measurement rating fell within the range of the ratings provided by the
case information for the strategic alignment within their organisations. For organisation C and D, the ratings
from the measurement deviated from the ratings provided by the informants, but only by 0.25 points out of 5
(5%).
A comparison of the available external assessment for two of the investigated organisations with the
measurement results revealed a need use more objective rating criteria in the measurement method. Large
differences between the measurement results and the external assessment could all be ascribed to the use of
subjective ratings; these rating were fully based on the perception of an informant.
A comparison of business ratings and IT ratings showed no significant differences between the two.
The table below shows how matters that were named as obstacles for strategic alignment matches the results
from the alignment measurement and/or the underlying model. This overview is based on the previously
discussed evaluations per case.
Org. Obstacle
Included in
measurement
Not included in measurement
Matches
categories/measures
Does not match
categories/measures
A When projects run late, the manpower
that was originally planned for another
project does not become available. This
means other (important) projects have
to be postponed or are put off entirely.
X

79
A The requirements engineering process
can be improved; sometimes certain
wishes are not brought above board. It
is difficult to get clear requirements
from the business. The problem lies not
in a lack of intention, but rather in the
difficulty of stating them.
X
A There is not always enough attention
for business‐IT alignment, both within
the business and IT. There is a lot on the
agenda and, pushing alignment to the
background.
X
B Growth of the organisation. Before,
there was no need for such structure,
and everything was handled at a very
informal level. Now that the
organisation has become larger, more
formal structures are needed.
X
B Different concepts need to be adapted
by IT, so their work does not fall behind
on the business. For example, agile
development could be adopted, or a
larger focus on processes.
X
B Business needs to have better IT
knowledge so they can better interact
with IT.
X
C Attitude toward the business‐IT
relationship. The us‐versus‐them
relation needs to change into an
integration of business and IT.
X
D A lack of understanding of each
other’s domain. The business thinks
that IT matters can be easily and
quickly dealt with and do not have a
notion on the impact certain
demands can have on IT. Business
and IT do not know how their
processes and actions impact one
another.
X
D An us‐versus‐them attitude between
business and IT.
X
E There is not enough control from the
top level of the organisation. The
business divisions operate
independently when it comes to IT,
which may reduce efficiency.
X
E The business underestimates the
work that is required to meet
business needs. They lack knowledge
on the complexity of IT. IT constantly
has to explain this.
X

80
6.5. FINDINGS
Two types of findings can be distinguished for this case study: implications for the constructed measurement
method and the result of the conducted measurement within the participating organisations. Both types of
findings are presented in the remainder of this section.
6.5.1. IMPLICATIONS FOR MEASUREMENT METHOD
In order to study the completeness of the constructed measurement method and its relation to practice, the
informants were asked to name major obstacles for business‐IT alignment within their organisation and name
aspects of alignment that were not discussed in the interview.
This resulted in a list of obstacles, presented in the previous section, and a small list of suggestions for further
detailing of the measurement method.
These suggestions were made by the informants to further detail the measurement method. All of these
suggestions relate to the working relationship between business and IT. More specifically, the type of relations
ship (e.g. client‐supplier, partners) and other aspects of this relationship such as shared support and mutual
respect.
The list of obstacles for alignment consists of eleven items, seven of which directly relate to measures already
present in the model. Three of the obstacles were not directly included, but coincide with one of the
alignment factor categories. One final obstacle was not included in the measurement method, addressing a
shortcoming in the model:
This obstacle concerns the balance between centralised and decentralised IT. The
formal structure of the IT organisation is not taken into account in the measurement
method constructed in this project. However, this topic does address a shortcoming
of the measurement as carried out in this case study: with only one informant for the
business perspective and one for the IT perspective. This means the investigation
focuses on the level in which the informants operate. To assess an organisation fully,
the business‐IT alignment for every level of the organisation should be investigated.
Furthermore, results from the measurement were compared with results of a self‐assessment of the
organisation. This comparison showed no peculiarities. For most organisations, the ratings from the
measurement were in line with the ratings that were provided by the organisations’ informants. For the other
cases the ratings measurement showed a difference of only 5%.
A comparison of the available external assessment for two of the investigated organisations with the
measurement results revealed a need remove subjective ratings for the measurement method.
Overall, these results underline that the actual measurement method needs refinement. However, all possible
additions and refinements by this case study do not require any adaptations of the basis for the measurement
method – the alignment factor categories.

81
6.5.2. RESULTS OF CONDUCTED MEASUREMENT
The case study resulted in ratings for all the defined categories and measures for each of the participating
organisations. The results for the alignment factor categories are displayed in the graph below
Investigating the level below the alignment factor categories, the measures, shows a larger variation in ratings.
The ratings assigned to these measures vary from 1.5 to 5, nearly covering the entire available range. Below,
the top three of measures with the highest and lowest ratings are presented:
Best‐rated measures:
Measure Corresponding alignment factor category Average rating
Linkage IT projects and planning 4.5
IT’s business knowledge Shared domain knowledge 4.2
Communication Working relationship 4.2
Worst‐rated measures:
Measure Corresponding alignment factor category Average rating
Business’ IT knowledge Shared domain knowledge 2.4
Opportunities IT performance 2.8
Value recognition Intention and support 3.2
0
1
2
3
4
5
Intention andsupport
Workingrelationship
Shared domainknowledge
IT projects andplanning
IT performance
A
B
C
D
E

82

83
7. CONCLUSION This chapter presents all the answers to the research questions, along with limitations of the results and
suggestions for future research.
7.1. RESEARCH CONCLUSIONS
The goal of this research project was to construct (the basis for) a measurement method for strategic
alignment. This measurement contributes to reduce the gap between theory on strategic alignment and
strategic alignment in practice.
In order to reach this goal, a number of research questions were set up that would result in a basis for the
measurement of strategic alignment, fully based on literature on the definition of strategic alignment, models
on strategic alignment and factors contributing to strategic alignment. This measurement method was later
tested in a small number of organisations to assess its value in practice.
Each of these research questions is answered in the remainder of this section.
1. HOW IS STRATEGIC ALIGNMENT DEFINED?
A number of definitions are available for strategic alignment. However, most are not very informative as
they avoid any pinning down of the concept. An attempt to define strategic alignment more precisely was
made by Maes et al. (2000), resulting in the definition presented below. This is the definition of strategic
alignment as used throughout this project.
“We define alignment as the continuous process, involving management and design sub‐
processes, of consciously and coherently interrelating all components of the business‐IT
relationship in order to contribute to the organisation’s performance over time.”
2. WHAT FACTORS DETERMINE THE LEVEL OF STRATEGIC ALIGNMENT?
A literature review was carried out to find the factors that determine how well‐aligned an organisation is.
This review resulted in seven studies, each presenting a list of factors. A full list of these factors can be
found in section 4.3. The factors in this list showed similarities and also redundancy. Based on this, the list
of factors was condensed into a five core factors for strategic alignment – alignment factor categories.
These five categories are described briefly below (details can be found in in section 5.2. of this report):

84
INTENTION AND SUPPORT: The commitment of top management to the strategic use of IT
and their support to achieve this.
WORKING RELATIONSHIP: The relationship between business and IT, in terms of
communication and partnership.
SHARED DOMAIN KNOWLEDGE: the knowledge business and IT have of each other’s’ domain.
IT PROJECTS AND PLANNING: the connection of IT projects and planning have with the
business.
IT PERFORMANCE: the performance of the IT department, concerning the position amongst
competitors and the perception of IT by the business, and structures to stimulate
performance.
3. HOW CAN EACH OF THESE FACTORS BE MEASURED?
How the five alignment factor categories can be measured was determined through the use of the results
of the literate review and the construction process of the categories: the underlying structure of the
alignment factor categories, the studies used in finding the individual alignment factors, and where
possible information from the models on strategic alignment. How this information was used precisely,
along with a full overview of results, is described in section 5.3.. A brief overview of the results, a short list
of measures for each alignment factor category, is presented below:
INTENTION AND SUPPORT
O VALUE RECOGNITION: recognition of the strategic value of IT for the organisation
O INCLUSION IN VISION: the definition and communication of the vision on the role of
IT for the organisation by top management
O RESOURCE ALLOCATION: the resources that are made available for IT, such as
manpower and budget
WORKING RELATIONSHIP
O COMMUNICATION: the business‐IT relationship in terms of intercommunication
(style, frequency, etc.)
O PARTNERSHIP: the business‐IT relationship in terms of partnership on strategy
development and project prioritisation
SHARED DOMAIN KNOWLEDGE
O IT’S BUSINESS KNOWLEDGE: understanding of business by IT
O BUSINESS’ IT KNOWLEDGE: understanding of IT by business
IT PROJECTS AND PLANNING
O SPONSORING: business sponsoring for IT projects
O LINKAGE: the extent of linkage between business and IT plans
O PRIORITISATION: adequacy of project prioritisation
IT PERFORMANCE
O INNOVATION: technological leadership amongst competitors and stimulation of
creativity
O RELIABILITY: reliability of the IT department, in terms of meeting business needs and
made commitments
O OPPORTUNITIES: presence of structures for IT to improve performance and
alignment
In order to quantify the level of a strategic alignment each alignment factor is rated on a scale of 1 to 5 – a
scale that is also used in one of the models on strategic alignment. These ratings are based on a list of
interview questions, both for a party within the business of an organisation and a party from IT.

85
4. CAN THE MEASUREMENT OF THESE FACTORS BE USED IN PRACTICE TO MEASURE STRATEGIC ALIGNMENT
IN ORGANISATIONS?
A case study was carried out for the answering of this research question. A full description of all the
details on this case study can be found in chapter 6, with a presentation of the main findings on page 80.
An overview of these findings is given hereafter.
A number of different aspects were investigated in the case study: the completeness of the measurement
method, the relation of the measurement method with strategic alignment in practice, and the actual
measurement results.
Overall, these aspects show that there is need for further refinement of the measurement method, but
also that the alignment factor categories seem to form a good basis for the measurement of strategic
alignment. The categories show a relation to strategic alignment in practice. Furthermore, no need to alter
or add new categories presented itself. More details for each aspect are given below:
COMPLETENESS
The informants for every case were asked to name the main obstacles for strategic alignment within their
organisation. This resulted in a list of eleven obstacles, seven of which directly relate to measures already
present in the model. Three of the obstacles were not directly included, but coincide with one of the
alignment factor categories. One final obstacle was not included in the measurement method, but
concerned the method the measurement is deployed within an organisation, not the underlying
measurement construct.
Furthermore, the informants supplied a number of possible refinements of the measurement. These
suggestions all concern the alignment factor category working relationship.
Overall, these results give reason to further refine the model on the level of used measures and the
deployment of the measurement method within organisations. However, all results fit in the constructed
alignment factor categories.
RELATION WITH PRACTICE
As stated above, the matters that were pointed out as obstacles coincide with the basis for the
measurement method – the alignment factor categories. The obstacles that correspond with one or more
of the constructed measure showed below‐average (for the concerning organisation) ratings for these
measures.
MEASUREMENT RESULTS
A comparison of the measurement results and the overall ratings of the level of strategic alignment for
each organisation as provided by the case informants showed no peculiarities. For most organisations, the
ratings from the measurement were in line with the ratings that were provided by the organisations’
informants. For the other cases the ratings measurement showed a difference of only 5%.
A comparison of the available external assessment for two of the investigated organisations with the
measurement results revealed a need use more objective rating criteria in the measurement method.
Large differences between the measurement results and the external assessment could all be ascribed to
the use of subjective ratings; these rating were fully based on the perception of an informant.

86
7.2. LIMITATIONS
Every research project has its limitations. The limitations for this project are described in this section.
For this project only one researcher was available, for 840 hours in total. Due to this, a check on the objectivity
of the condensation of alignment factors to the set of alignment factor categories could not be performed. To
compensate for this, insight in the process is given by providing the results for each individual step of the
process.
Also, the construction of measures and ratings for each alignment factor category was limited. Ideally, each
alignment factor category would be investigated individually. As this was not possible in the available time, the
literature that was already gathered in the previous phases of the project was used. As a result, the
constructed measures may not be complete, and no information on the weights of the measures is available.
Furthermore, the findings of the case study are based on a small group of organisations and informants, all
operating in the financial sector. It would be premature to generalize the findings of the case study to a wider
domain.
Finally, the results of the case study for the individual organisation showed that all investigated are reasonably
to well‐aligned. This means the method was not yet tested on organisations that are very badly aligned.
7.3. FUTURE RESEARCH
In this project, the basis for a measurement method for strategic alignment was constructed. In order to
change this basis into a mature and reliable measurement method, the method needs further detailing. The
below suggestions are the direct results from the findings of the case study carried out during this research
project, and the limitations presented in the previous section.
Firstly, the alignment categories need further detailing. For each alignment factor, it needs to be studied in
more detail what organisational aspects contribute to it, how these aspects correlate to each other and to
what extent they contribute to the relating alignment factor category. The principle of correlation and weights
is also needed for the alignment factor categories themselves. Not every category may contribute to strategic
alignment to the same extent, or may impact other categories. This needs further research.
Furthermore, some adaptations of the measurement method itself are needed to increase its reliability and
coverage. These adaptations are the result of the evaluation of the case study results:
‐ Distinguishing of hierarchical levels within the organisation to determine the level of strategic
alignment for the entire organisation, opposed to for example only one of the business divisions
within the organisation.
‐ Using more objective criteria in the measurement
The measurement as‐is, is fully based on the perceptions of the informants. To increase the reliability
and objectivity, other sources of information could be incorporated into the measurement, such as
data on the project portfolio of the organisation.
Finally, the measurement needs to be validated. In this project only a small case study was used to perform an
initial inspection of the measurement method. In order to assess the method more thoroughly, the
measurement should be tested in more organisations, covering differences in the sector in which the
organisations operate, organisation sizes, organisation and IT structures, and levels of alignment.

87
ACKNOWLEDGEMENTS
From June 2011 to February 2012 I worked on this research project, to complete my Master’s programme at
the Eindhoven University of Technology. Completing this project would not have been possible without the
support from a number of people.
Firstly, I would like to thank my supervisors Jos Trienekens, Harold Weffers, Alex Brouwer and Jan Willem van
Houwelingen for their support in the last months. Your feedback and our brainstorms have helped me to fully
set up and carry out this project.
As a part of this project, I carried out a case study in different organisations. In this case study I held interviews
with a number of (anonymous) informants. Their willingness to participate in my project enabled me to carry
out this study. I am very grateful they were willing to free some time to speak with me and providing me with
all the information I needed for my study. Suggestions for organisations to include in my study, and initial
contact with these organisations were made by Alex Brouwer, Guido Dieperink and Victor Bos ‐ thank you!
Furthermore, there are two people outside of my project that are very dear to me and to whom I wish to
express my gratitude:
Bart Laarhoven, we started out as “intropapa” and “dochter” in the summer of 2004, when I started as a first‐
year at the university. Over the past years we have seen and been through a lot together, in our studies that
pretty much coincided, putting our public transit cards to good use by traveling all over the country, and much
much more. You have become like a brother to me over the past years. Thank you for always being there for
me.
Jorn van der Pol, throughout this project you helped me so much; we have brainstormed on my research
methodology and crazy hours but more importantly you stood by me through all my ups and downs. At times
when I was overwhelmed or exhausted, you have kept me going. I am forever grateful to have you in my life
and I love you with all my heart.
Elisa van Hout
Eindhoven, 06 February 2012

88

89
BIBLIOGRAPHY
Anglia Ruskin University, 2010. Harvard System of Referencing Guide. [Online]
Available at: http://libweb.anglia.ac.uk/referencing/files/Harvard_referencing_2010.pdf
[Geopend 10 aug 2011].
Avison, D., Jones, J., Powell, P. & Wilson, D., 2004. Using and validating the strategic alignment model. Journal
of Strategic Alignment Systems, Volume 13, pp. 223‐246.
Baarda, D., de Goede, M. & Teunissen, J., 2005. Basisboek Kwalitatief Onderzoek. In: 2 red. sl:Noordhoff
Uitgevers.
Brereton, P., Kitchenham, B., Budgen, D. & Li, Z., 2008. Using a Protocol Template for Case Study Planning.
Bari, Italy, EASE.
Chan, Y. E., 2002. Why haven't we mastered alignment? The importance of the informal organization
structure. MIS Quarterly Executive, 1(2), pp. 97‐112.
Chan, Y. E., Sabhelwahl, R. & Thatcher, J. B., 2006. Antecedents and Outcomes of Strategic IS Alignment: An
Empirical Investigation. IEEE Transactions on Engineering Management, 53(1), pp. 27‐47.
Chan, Y. & Reich, B., 2007. IT alignment: an annotated bibliography. Journal of Information Technology,
2007(22), pp. 316‐396.
Chan, Y. & Reich, B. H., 2007. IT Alignment: what have we learned?. Journal of Information Technology,
2007(22), pp. 297‐315.
Coleman, P. & Papp, R., 2006. Strategic alignment: analysis of perspectives. Jacksonville, Florida, USA, sn, pp.
242‐250.
Computable, 2011. Belastingdienst stuurt managers op ICT‐cursus. [Online]
Available at: http://www.computable.nl/artikel/ict_topics/overheid/4028704/1277202
[Geopend 12 July 2011].
FEM Business & Finance, 2007. Belastingdienst: Chaos bij de belastingdienst. [Online]
Available at: http://archief.fembusiness.nl/2007/07/07/nummer‐27/Belastingdienst‐Chaos‐bij‐de‐
belastingdienst.htm
[Geopend 12 July 2011].
Goedvolk, J. G., 1999. White Paper Integrated Architecture Framework, Amsterdam: sn
Haes, S. d. & Grembergen, W. v., 2008. Best practices in IT governance and alignment. In: IT Service
Management Global Best Practices. sl:Van Haren Publishing, pp. 47‐56.
Henderson, J. C. & Venkamatran, N., 1992. Strategic Alignment: A model for organizational transformation
through information technology. In: Transforming Organizations. sl:Oxford University Press, pp. 97‐116.
Henderson, J. C. & Venkatraman, N., 1989. Strategic Alignment: A framework for strategic information
technology management, Cambridge, Massachusetts: sn

90
Henderson, J. C. & Venkatraman, N., 1999. Strategic Alignment: Leveraging information technology for
transforming organizations. IBM Systems Journal, 38(2&3), pp. 472‐484.
Huang, C. D. & Hu, Q., 2007. Achieving IT‐Business Strategic Alignment via Enterprise‐Wide Implementation of
Balanced Scorecards. Information Systems Management, 24(2), pp. 173‐184.
IBM Corporation, 2011. Citigroup transforms application development with an IBM cloud solution. [Online]
Available at: http://www‐01.ibm.com/software/success/cssdb.nsf/CS/ARBN‐8EFLS3
[Geopend 06 July 2011].
Industry Leaders Magazine, 2011. The Parcel Service that’s Cutting Costs by Going Green: UPS. [Online]
Available at: http://www.industryleadersmagazine.com/the‐parcel‐service‐that’s‐cutting‐costs‐by‐going‐
green‐ups/
[Geopend 06 July 2011].
Kearns, G. S. & Lederer, A. L., 2003. A Resource‐based View of Strategic IT Alignment: How Knowledge Sharing
Creates Competitive Advantage. Desicion Sciences, 34(1), pp. 1‐29.
Kitchenham, B. & Charters, S., 2007. Guidelines for performing systematic literature reviews in software
engineering, Durham, UK: EBSE.
Luftman, J., 2000. Assessing Business‐IT Alignment Maturity. Communications of the Association for
Information Systems (AIS), 4(14).
Luftman, J., 2005. Key Issues for IT Executives 2004. MIS Quarterly Executive, 4(2).
Luftman, J. & Ben‐Zvi, T., 2010. Key Issues for IT Executives 2009: Difficult Ecenomy's Impact on IT. MIS
Quarterly Executive, 9(1).
Luftman, J. & Ben‐Zvi, T., 2010. Key Issues for IT Executives 2010: Judicious IT Investments Continue Post‐
Recession. MIS Quarterly Executive, 9(4).
Luftman, J. & Ephraim, M., 2004. Key Issues for IT Executives. MIS Quarterly Executive, 3(2).
Luftman, J. & Kempaiah, R., 2008. Key Issues for IT Executives 2007. MIS Quarterly Executive, 7(2).
Luftman, J., Kempaiah, R. & Nash, E., 2006. Key Issues for IT Executives 2005. MIS Quarterly Executive, 5(2).
Luftman, J., Kempaiah, R. & Rigoni, E., 2009. Key Issues for IT Executives 2008. MIS Quarterly Executive, 8(3).
Luftman, J., Lewis, P. R. & Oldach, S. H., 1993. Transforming the enterprise: the alignment of business and
information strategies. IBM Systems Journal, 32(1), pp. 198‐221.
Luftman, J. N., 1996. Applying the Strategic Alignment Model. In: J. N. Luftman, red. Competing in the
Information Age: Strategic Alignment in Practice. sl:Oxford University Press.
Luftman, J. N., Papp, R. & Brier, T., 1999. Enablers and inhibitors of Business‐IT alignment. Communications of
the Association for Information Systems, 1(11), pp. 1‐33.
Maes, R., 1999. A generic framework for Information Management, sl: Prima Vera Working Paper.
Maes, R., 1999. Reconsidering information management through a generic framework, Amsterdan: PrimaVera.
Maes, R., Rijsenbrij, D., Truijens, O. & Goedvolk, H., 2000. Redefining business – IT alignment through a unified
framework, sl: PrimaVera Working Paper.

91
McKeen, J. D. & Smith, H., 2003. Making IT Happen: Critical issues in IT management. 1 red. Hoboken, New
Jersey: Wiley.
Moonen, H., Jong ‐ Elsinga, D. d., Schut, D. & Hoek, E. v. d., 2008. Organizations no longer accept a low degree
of project success. In: H. Donkers & B. Beugelaar, red. IT Governance, Performance & Compliance. sl:Uitgeverij
Kleine Uil, pp. 144‐154.
NRC Handelsblad, 2008. Opnieuw problemen bij de belastingdienst. [Online]
Available at: http://vorige.nrc.nl/nieuwsthema/belastingdienst/article1884414.ece
[Geopend 12 July 2011].
Oxford University Press, 2012. Oxford Dictionaries. [Online]
Available at: http://oxforddictionaries.com/definition/information%2Btechnology
[Geopend 15 January 2012].
Papp, R., 2004. Assessing strategic alignment in real‐time. Journal of Informatics Education Research, 6(1), pp.
11‐28.
Reich, B. H. & Benbasat, I., 1996. Measuring the Linkage between Business and Information Technology
Objectives. MIS Quarterly, 20(1), pp. 55‐81.
Reich, B. H. & Benbasat, I., 2000. Factors that influence the social dimension of alignment between business
and information technology objectives. MIS Quarterly, 24(1), pp. 81‐113.
Sauer, C. & Yetton, P. W., 1997. The Right Stuff ‐ An introduction to new thinking about management. In: C.
Sauer & P. W. Yetton, red. Steps to the Future: Fresh thinking on the management of IT‐based organizational
transformation. 1st edition red. San Fransisco: Jossey‐Bass, pp. 1‐21.
Scott Morton, M., 1990. Corporation of the 1990s: Information Technology and Organizational
Transformation. sl:Oxford University Press.
Tallon, P., Kraemer, K. & Gurbanaxi, V., 2000. Executives' Perceptions of the Business Value of Information
Technology: A Process‐Oriented Approach. Journal of Management Information Systems, 16(4), pp. 145‐172.
Teo, T. S. H. & Ang, J. S. K., 1999. Critical success factors in the alignment of IS plans with business plans.
International Journal of Information Management, 19(1), pp. 173‐185.
Yin, R. K., 2003. Case study research. 3rd Ed. red. Thousand Oaks: Sage publications.

92

93
LIST OF FIGURES
Figure 1 ‐ Research strategy ................................................................................................................................ 17
Figure 2 ‐ Overview of strategic alignment models/frameworks ........................................................................ 27
Figure 3 ‐ The MIT90s framework (Scott Morton, 1990) ..................................................................................... 28
Figure 4 ‐ Strategic alignment model (Henderson & Venkatraman, 1989) ......................................................... 29
Figure 5 ‐ IT business alignment maturity criteria of the SAMM (Luftman, et al., 1999) .................................... 31
Figure 6 ‐ Maturity levels of the SAMM (Luftman, et al., 1999) .......................................................................... 31
Figure 7 ‐ Generic framework (Maes, 1999) ........................................................................................................ 32
Figure 8 ‐ Integrated Architecture Framework (Goedvolk, 1999) ....................................................................... 33
Figure 9 ‐ Unified framework (Maes, et al., 2000) ............................................................................................... 33
Figure 10 ‐ Alignment factor categories .............................................................................................................. 42
Figure 11 ‐ Labelling tree: intention & support ................................................................................................... 45
Figure 12 ‐ Labelling tree: working relationship .................................................................................................. 48
Figure 13 ‐ Labelling tree: shared domain knowledge......................................................................................... 51
Figure 14 ‐ Labelling tree: IT projects & planning ................................................................................................ 53
Figure 15 ‐ Labelling tree: IT performance .......................................................................................................... 56
Figure 16 ‐ Overview of designed measurement structure ................................................................................. 59
Figure 17 ‐ Case study chain of evidence ............................................................................................................. 98

94
95
GLOSSARY
ALIGNMENT FACTOR
Alignment factors are elements within an organisation that contribute to the level of strategic alignment.
ALIGNMENT FACTOR CATEGORY
Alignment factor categories are the result of the condensation of the above mentioned alignment factors.
These factors were grouped according to their similarities, resulting in five main categories of alignment
factors.
EXTERNAL ASSESSMENT
External assessment is a part of the case study, where a party from outside of the investigated organisation
assesses the level of strategic alignment of the organisation.
INFORMATION TECHNOLOGY (IT)
According to the Oxford dictionary (Oxford University Press, 2012), information technology is defined as “the
[..] use of systems (especially computers and telecommunications) for storing, retrieving, and sending
information”. This is the definition of IT used throughout this project.
MEASURE
For the measurement of strategic alignment, each alignment factor category is divided into a number of
measures. Together, the measures for a category determine how well an organisation’s alignment is rated on
this particular category.
SELF‐ASSESSMENT
The self‐assessment is a part of the case study, where the case informants perform a short assessment of the
strategic alignment within their organisation.
STRATEGIC ALIGNMENT
As stated in section 4.1., the following definition for strategic alignment is used throughout this project: “We
define alignment as the continuous process, involving management and design sub‐processes, of consciously
and coherently interrelating all components of the business‐IT relationship in order to contribute to the
organisation’s performance over time.”

96
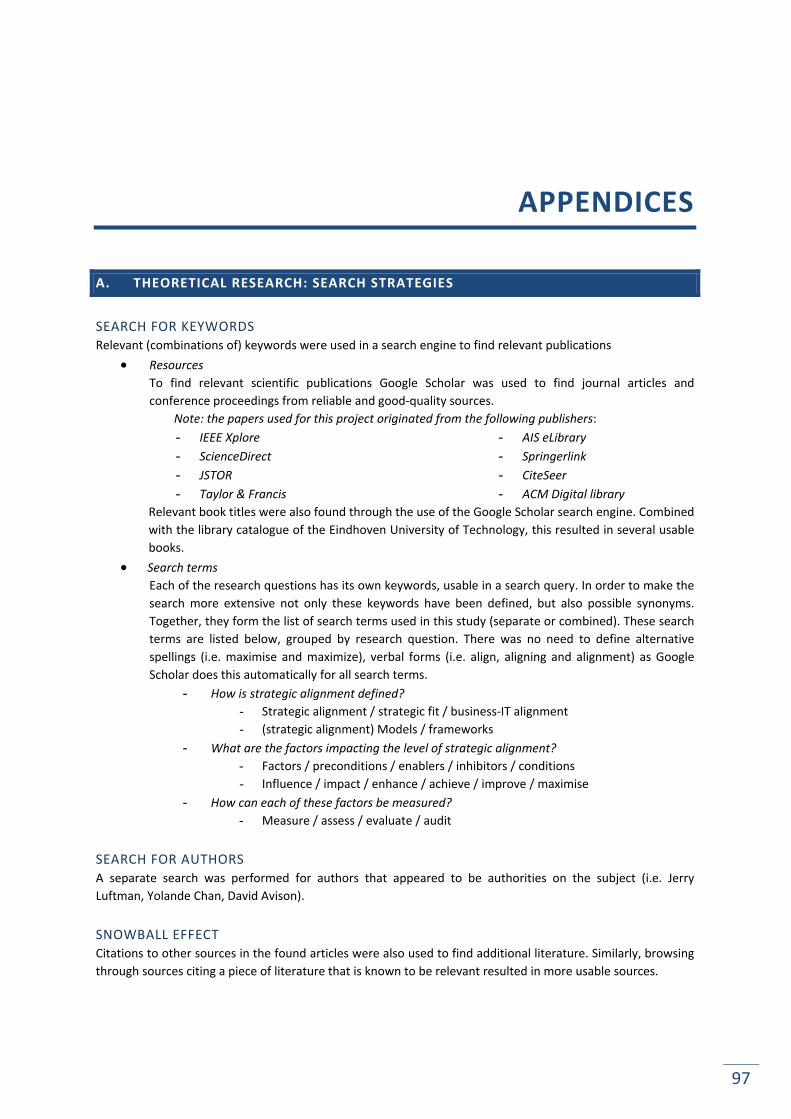
97
APPENDICES
A. THEORETICAL RESEARCH: SEARCH STRATEGIES
SEARCH FOR KEYWORDS
Relevant (combinations of) keywords were used in a search engine to find relevant publications
Resources
To find relevant scientific publications Google Scholar was used to find journal articles and
conference proceedings from reliable and good‐quality sources.
Note: the papers used for this project originated from the following publishers:
- IEEE Xplore
- ScienceDirect
- JSTOR
- Taylor & Francis
- AIS eLibrary
- Springerlink
- CiteSeer
- ACM Digital library
Relevant book titles were also found through the use of the Google Scholar search engine. Combined
with the library catalogue of the Eindhoven University of Technology, this resulted in several usable
books.
Search terms
Each of the research questions has its own keywords, usable in a search query. In order to make the
search more extensive not only these keywords have been defined, but also possible synonyms.
Together, they form the list of search terms used in this study (separate or combined). These search
terms are listed below, grouped by research question. There was no need to define alternative
spellings (i.e. maximise and maximize), verbal forms (i.e. align, aligning and alignment) as Google
Scholar does this automatically for all search terms.
- How is strategic alignment defined?
- Strategic alignment / strategic fit / business‐IT alignment
- (strategic alignment) Models / frameworks
- What are the factors impacting the level of strategic alignment?
- Factors / preconditions / enablers / inhibitors / conditions
- Influence / impact / enhance / achieve / improve / maximise
- How can each of these factors be measured?
- Measure / assess / evaluate / audit
SEARCH FOR AUTHORS
A separate search was performed for authors that appeared to be authorities on the subject (i.e. Jerry
Luftman, Yolande Chan, David Avison).
SNOWBALL EFFECT
Citations to other sources in the found articles were also used to find additional literature. Similarly, browsing
through sources citing a piece of literature that is known to be relevant resulted in more usable sources.
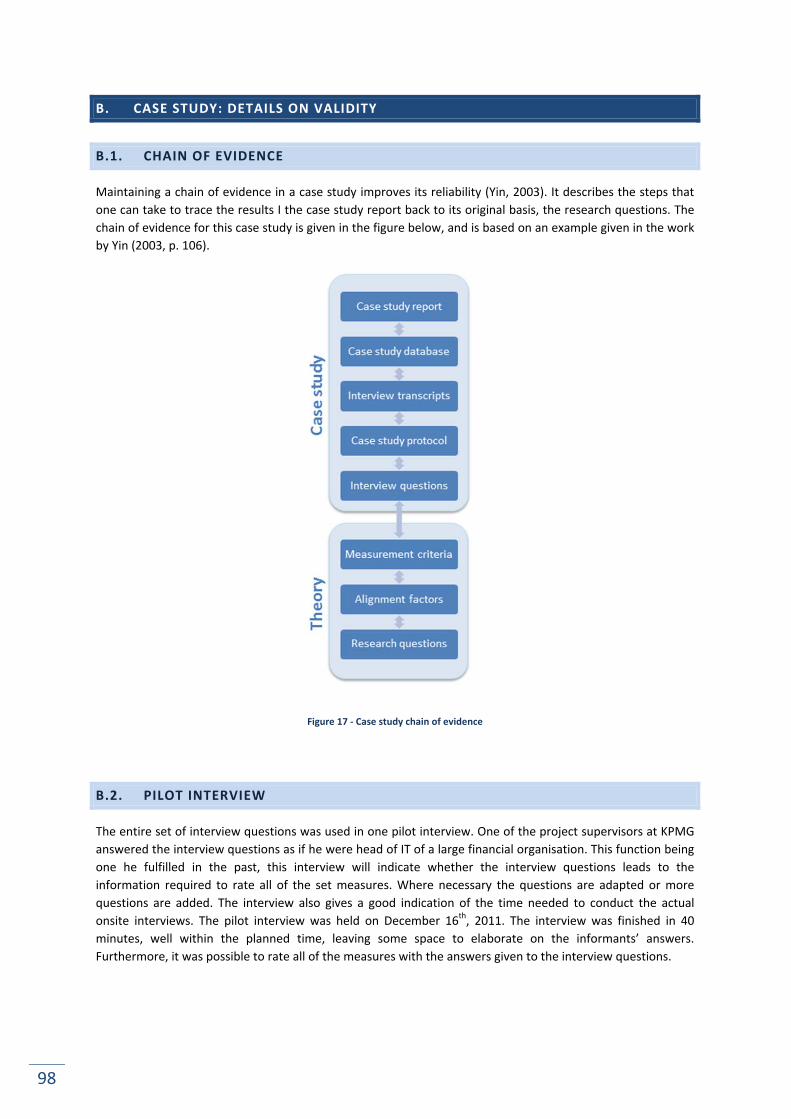
98
B. CASE STUDY: DETAILS ON VALIDITY
B.1. CHAIN OF EVIDENCE
Maintaining a chain of evidence in a case study improves its reliability (Yin, 2003). It describes the steps that
one can take to trace the results I the case study report back to its original basis, the research questions. The
chain of evidence for this case study is given in the figure below, and is based on an example given in the work
by Yin (2003, p. 106).
Figure 17 ‐ Case study chain of evidence
B.2. PILOT INTERVIEW
The entire set of interview questions was used in one pilot interview. One of the project supervisors at KPMG
answered the interview questions as if he were head of IT of a large financial organisation. This function being
one he fulfilled in the past, this interview will indicate whether the interview questions leads to the
information required to rate all of the set measures. Where necessary the questions are adapted or more
questions are added. The interview also gives a good indication of the time needed to conduct the actual
onsite interviews. The pilot interview was held on December 16th, 2011. The interview was finished in 40
minutes, well within the planned time, leaving some space to elaborate on the informants’ answers.
Furthermore, it was possible to rate all of the measures with the answers given to the interview questions.

99
C. STRATEGIC ALIGNMENT MODEL: ALIGNMENT PERSPECTIVES
In total, there are eight different alignment perspectives. All of these perspectives are described below
(Coleman & Papp, 2006) (Henderson & Venkamatran, 1992) (Henderson & Venkatraman, 1999) (Luftman, et
al., 1993) (Papp, 2004):
Strategy implementation
This is the classical, hierarchical view on strategic management. The organisation traditionally has a strong and well‐established strategy. This business strategy is implemented by choosing an appropriate organisational infrastructure and management processes, as well as designing and developing the appropriate IT infrastructure and processes.
The role of the top management is that of the strategy formulator or leader, articulating the logic and choices relating to the business strategy. The IT manager is the strategy implementer, effectively en efficiently designing and developing the required IT infrastructure and processes.
The goals usually are along the line of reducing delays and errors, enhancement of services and time savings.
Technology leverage
This perspective has the business strategy as the driving factor and seeks to identify the best possible IT solutions and the corresponding internal IT architecture. The value of IT is its contribution to the final product or service.
The role of the management is to provide a technology vision that supports the business strategy. The IT management has the role of the technology architect, effectively en efficiently designing and developing the required IT infrastructure and processes.
The performance is measured by assessing the position of the organisation in the IT marketplace.
Technology exploitation
Here, the IT strategy is leading. Emerging possibilities in IT lead to new products and services, and influence key attributes of the business strategy, which also leads to corresponding changes in the organisational infrastructure and processes. This means that unlike the previous two perspective, the business strategy is not a given. With the IT strategy as a starting point, the best set of strategic options is identified. From these strategic options comes competitive advantage.
The top management has the role of business visionary, stating how the emerging IT capabilities influence the business strategy. The IT manager acts as a catalyst, identifying and interpreting trends in IT to assist business managers to understand the

100
possible opportunities and threats from an IT perspective.
The performance within the perspective is based on business leadership, with measurements such as market share, growth or the introduction of new products.
Technology implementation
This perspective focuses on building a high‐quality IT service organisation, improving the delivery of products and services to processes. The fit between IT strategy and IT infrastructure creates the capacity to meet the needs of IT customers. The role of the business strategy is indirect and mostly deals with providing direction and stimulating customer demand. This perspective is considered necessary to ensure the effective use of IT.
Top management fulfils the role of prioritiser, stating how the available resources can be distributed within the organisation best. The IT manager functions as executive leadership, looking to make the internal service business succeed with the operating guidelines from top management.
The performance criteria are based on customer satisfaction, measured using benchmarks.
Organisation requirements
This perspective results in process improvements from IT. The organisation structure provides direction for IT to design appropriate products and services and the adoption of an IT strategy that will support the demands for development of these products and services, along with necessary support.
Business manager has the role of a leader or sponsor, while IT management’s role is that of a process architect.
Organisation exploitation
In this perspective, there is a consistent process. The internal knowledge and individual innovation are interpreted in terms of the implications for effective business strategies. This perspective exploits the capabilities to develop new products and services, influence strategy and develop new relationships. It combines the leadership roles from strategy implementation and technology exploitation. IT management acts as a project manager and the business manager is a sponsor. The role of IT is to deploy value to business processes using the value of IT to the product of service.
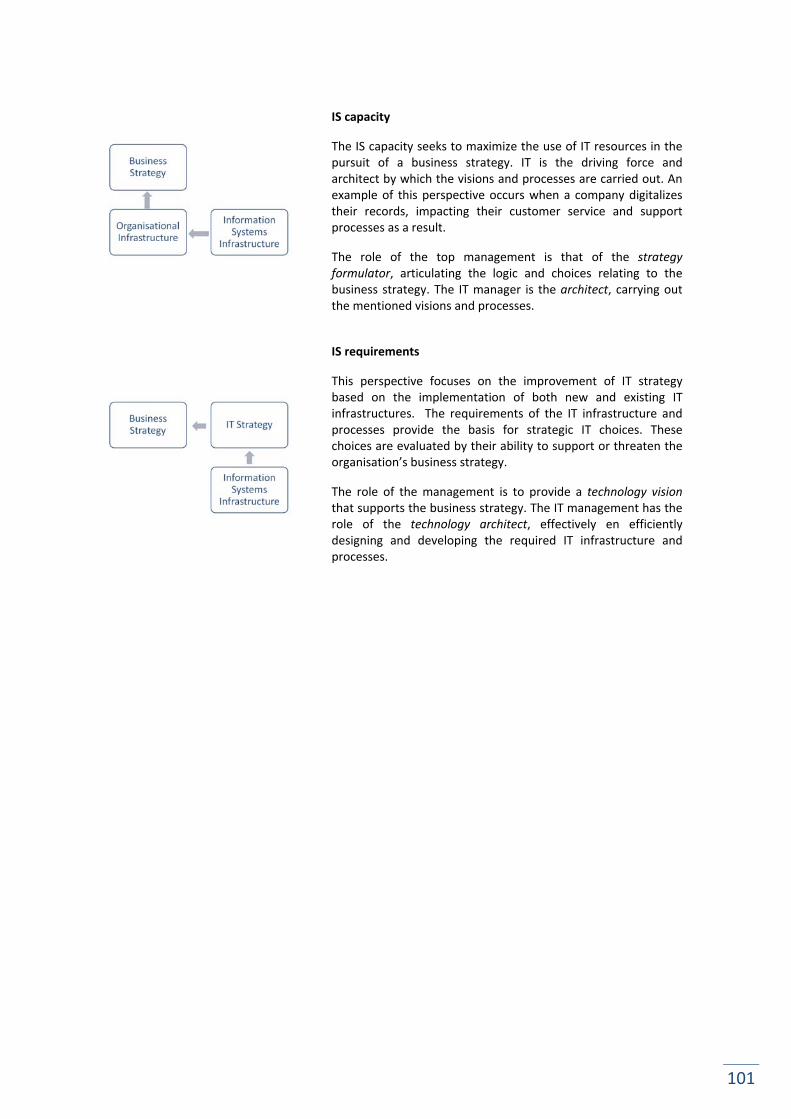
101
IS capacity
The IS capacity seeks to maximize the use of IT resources in the pursuit of a business strategy. IT is the driving force and architect by which the visions and processes are carried out. An example of this perspective occurs when a company digitalizes their records, impacting their customer service and support processes as a result.
The role of the top management is that of the strategy formulator, articulating the logic and choices relating to the business strategy. The IT manager is the architect, carrying out the mentioned visions and processes.
IS requirements
This perspective focuses on the improvement of IT strategy based on the implementation of both new and existing IT infrastructures. The requirements of the IT infrastructure and processes provide the basis for strategic IT choices. These choices are evaluated by their ability to support or threaten the organisation’s business strategy.
The role of the management is to provide a technology vision that supports the business strategy. The IT management has the role of the technology architect, effectively en efficiently designing and developing the required IT infrastructure and processes.

102
D. STRATEGIC ALIGNMENT MATURITY MODEL: ALIGNMENT CHARACTERISTICS
This section comprises the different alignment criteria and levels of the Strategic Alignment Maturity Model
and all of their characteristics, as defined by Luftman et al. (1999) and Luftman (2000).
Alignment criteria Alignment levels
1: initial process 2: committed process
3: established focused process
4: improved/ managed process
5: optimised process
Communications
Understanding of business by IT
IT management lacks understanding
Limited understanding by IT management
Good understanding by IT management
Understanding encouraged among IT staff
Understanding required of all IT staff
Understanding of IT by business
Managers lack understanding
Limited understanding by managers
Good understanding by managers
Understanding encouraged among staff
Understanding required of staff
Organisational learning
Casual conversation and meetings
Newsletters, reports, group e‐mail
Training, departmental meetings
Formal methods sponsored by senior management
Learning monitored for effectiveness
Style and ease of access
Business to IT only; formal
One‐way, somewhat informal
Two‐way, formal Two‐way, somewhat informal
Two‐way, informal and flexible
Leveraging intellectual assets
Ad‐hoc Some structured sharing emerging
Structured around key processes
Formal sharing at all levels
Formal sharing with partners
IT‐business liaison staff
None or use only as needed
Primary IT‐business link
Facilitate knowledge transfer
Facilitate relationship building
Building relationship with partners
Competency / value m
easurements
IT metrics Technical only Technical cost; metrics rarely reviewed
Review, act on technical, ROI metrics
Also measure effectiveness
Also measure business ops, HR, partners
Business metrics
IT investments measured rarely, if ever
Cost/unit; rarely reviewed
Review, act on ROI, cost
Also measure customer value
Balanced scorecard, includes partners
Link between IT and business metrics
Value of IT investments rarely measured
Business, IT metrics not linked
Business, IT metrics becoming linked
Formally linked; reviewed and acted upon
Balanced scorecard, includes partners
Service level agreements
Used sporadically
With units for technology performance
With units; becoming enterprise‐wide
Enterprise‐wide Includes partners
Benchmarking Seldom or never Sometimes benchmark informally
May benchmark formally, seldom act
Routinely benchmark, usually act
Routinely benchmark, act on, and measure results
Formally assess IT investments
Do not assess Only when there is a problem
Becoming a routine occurrence
Routinely assess and act on findings
Routinely assess, act on, and measure results
Continuous improvement practices
None Few; effectiveness not measured
Few; starting to measure effectiveness
Many; frequently measure effectiveness
Practices and measures well‐established

103
Governan
ce
Formal business strategy planning
Not done, or done as needed
At unit functional level, slight input IT
Some IT input and cross‐functional planning
At unit and enterprise, with IT
With IT and partners
Formal IT strategy planning
Not done, or done as needed
At unit functional level, light business input
Some business input and cross‐functional planning
At unit and enterprise, with business
With partners
Organisational structure
Centralised or decentralised
Central/decentral; some collocation
Central/decentral or federal
Federal Federal
Reporting relationships
CIO reports to CFO
CIO reports to CFO
CIO reports to COO
CIO reports to COO or CEO
CIO reports to CEO
How IT is budgeted
Cost centre, spending is unpredictable
Cost centre by unit
Some projects treated as investments
IT treated as investment
Profit centre
Rationale for IT spending
Reduce costs Productivity, efficiency
Also a process enabler
Process driver, strategy enabler
Competitive advantage, profit
Senior‐level IT steering committee
Do not have Meet informally as needed
Formal committees meet regularly
Proven to be effective
Also includes external partners
How projects are prioritised
React to business or IT need
Determined by IT function
Determined by business function
Mutually determined
Partner’s priorities are considered
Partnership
Business perception of IT
Cost of doing business
Becoming an asset
Enables future business activity
Drives future business activity
IT, business adapt quickly to change
IT’s role in strategic business planning
Not involved Enables business processes
Drives business processes
Enables or drives business activity
IT, business adapt quickly to change
Shared risks and rewards
IT takes all the risks, get no rewards
IT takes most risks with little reward
IT, business start sharing risks, rewards
Risks, rewards always shared
Managers incented to take risks
Managing the IT‐business relationship
IT‐business relationship is not managed
Managed on an ad hoc basis
Processes exist but not always followed
Processes exist and complied with
Processes are continuously improved
Relationship / trust style
Conflict and mistrust
Transactional relationship
IT becoming a valued service provider
Long‐term partnership
Partner, trusted vendor or IT services
Business sponsors / champions
Usually none Often have a senior IT sponsor or champion
IT and business sponsor or champion at unit level
Business sponsor or champion at corporate level
CEO is business sponsor or champion
1: initial process 2: committed process
3: established focused process
4: improved/ managed process
5: optimised process

104
Skills
Innovative, entrepreneurial environment
Discouraged Somewhat encouraged at unit level
Strongly encouraged at unit level
Also at corporate level
Also with partners
Key IT decisions made by:
Top business and IT management at corporate level
Same, with emerging functional influence
Top business and unit management; IT advises
Top business and IT management across firm
Top management across firm with partners
Change readiness
Tend to resist change
Change readiness programs emerging
Programs in place at functional level
Programs in place at corporate level
Also proactive and anticipate change
Career crossover opportunities
Job transfers rarely occur
Occasionally occur within unit
Regularly occur for unit management
Regularly occur at all levels
Also at corporate level
Cross‐functional training and job rotation
No opportunities
Decided by units Formal programs run by all units
Also across enterprise
Also with partners
Social interaction
Minimal IT‐business interaction
Strictly a business‐only relationship
Trust and confidence is starting
Trust and confidence achieved
Attained with customers and partners
Attract and retain top talent
No retention program; poor recruiting
IT hiring focused on technical skills
Technology and business focus; retention program
Formal program for hiring and retaining
Effective program for hiring and retaining
1: initial process 2: committed process
3: established focused process
4: improved/ managed process
5: optimised process
Scope &
architecture
Scope Traditional (e.g. accounting, e‐mail)
Transactional (e.g. ESS, DSS)
Expanded scope (e.g. business process enabler)
Redefined scope (business process driver)
External scope;business strategy enabler / driver
Standards None or ad hoc Standards defined Emerging enterprise standards
Enterprise standards
Inter‐enterprise standards
Architectural integration: functional organisation
No formal integration
Early attempts at integration
Integrated across organisation
Integrated with partners
Evolved with partners
Architectural integration: enterprise
No formal integration
Early attempts at integration
Integrated across organisation
Integrated with partners
Evolved with partners
Architectural integration: inter‐enterprise
No formal integration
Early concept testing
Emerging with key partners
Integrated with key partners
Evolved with all partners
Architectural transparency, flexibility
None Limited Focused on communications
Effective emerging technology management
Across the infrastructure

105
E. USED STUDIES ON ALIGNMENT FACTORS
Different search strategies (see: Appendix A) resulted in a number of usable studies to define which factors are
most important when it comes to achieving alignment within an organisation. The following studies were used
in this research project:
Luftman et al. (1999): Enablers and inhibitors of Business‐IT alignment
Goal: “The objective of our research was to determine (over time, regardless of industry or executive
position) the enablers and inhibitors to aligning business and IT strategies.”
Main findings: “The authors found that there are known enablers and inhibitors that help and hinder
alignment. What is striking about these are that the same set of topics (executive support,
understanding the business, IT‐business relations, and leadership) show up as both enablers and
inhibitors. The authors conclude that strategic alignment is an on‐going process. Executives should
work toward minimizing those activities that inhibit alignment and maximizing those activities that
bolster it, such as improving the relationships between the business and IT functional areas, working
toward mutual cooperation and participation in strategy development, maintaining executive
support, and prioritizing projects more effectively. In previous work (Luftman, Papp and Brier, 1999),
the authors have presented the detailed findings of the enablers‐inhibitors study. The purpose of this
article is to present the methodology that they have applied that leverages the enablers and
inhibitors.” (Chan & Reich, 2007)
Type Quantitative
Sample size N = 1051 (persons, >500 organisations)
Selection criteria Attendees of seminars on alignment, US Fortune 1000 organisations
Measurement tool Questionnaire: open questions asking for top 3 enablers/inhibitors of strategic alignment
Analysis method The enablers and inhibitors were grouped. The groups were ranked according to the questionnaire results.
Used results Top 6 of enablers and inhibitors
Enablers 1. Senior executive support for IT 2. IT involved in strategy development 3. IT understands the business 4. Business‐IT partnership 5. Well‐prioritised IT projects 6. IT demonstrates leadership
Inhibitors1. IT/business lack close relationships 2. IT does not prioritise well 3. IT fails to meet commitments 4. IT does not understand business 5. Senior executives do not support IT 6. IT management lacks leadership
Teo & Ang (1999): Critical success factors in the alignment of IS plans with business plans
Goal: “[..] none of the existing research has examined CSFs [critical success factors] in IS planning
alignment and this paper is an initial attempt to do so.”
Main findings: “This article examines critical success factors (CSF) for aligning business plans with IS
plans. The findings indicate that there are 12 success factors critical for aligning IS plans with business
plans, [..] These CSFs are particularly useful for practitioners who are attempting to align their
businesses. These CSFs provide practitioners with issues to focus on.” (Chan & Reich, 2007)

106
Type Quantitative
Sample size N = 136 (organisations)
Selection criteria Random sample from organisations in Singapore
Measurement tool Questionnaire: rank predefined success factors on Likert scale (1‐5)
Analysis method Sorting of success factors based on average ranking
Used results Success factors with a rating ≥ 4,00
1. Top management is committed to the strategic use of IT 2. IS management is knowledgeable about business 3. Top management has confidence in the IS department (Related to 1) 4. The IS department provides efficient and reliable services to user departments 5. There is frequent communication between user and IS department 6. The IS staff are able to keep up with advances in IT 7. Business and IS management work together in partnership in prioritizing applications
development 8. Business goals and objectives are made known to IS management 9. The IS department is responsive to user needs (Related to 4) 10. Top management is knowledgeable about IT 11. The IS department often comes up with creative ideas on how to use IT strategically
(Related to 6) 12. The corporate business plan is made available to IS management (Related to 8)
Reich & Benbasat (2000): Factors That Influence the Social Dimension of Alignment between Business and
Information Technology Objectives
Goal: “The overall research goal was to (1) define the alignment construct, (2) develop measures for
alignment, and (3) investigate the organizational factors and events that influence alignment.”
Main findings: “This research investigates the social dimension of alignment. It looks to identify
factors that either enable or inhibit alignment. The proposed model states that a shared domain of
knowledge between business and IT executives and successful IT history lead to increased
communication between business and IS executives and connections between business planning and
IT planning. Altogether this leads to greater alignment. This model was significantly supported for
short‐term strategic IT alignment. When looking at short‐term alignment, a fifth factor was found to
influence alignment directly – short‐term business direction. The most important factoring
influencing short‐term alignment was the frequency of unstructured or structured communication.
However, when looking at long‐term alignment an interesting model presented itself. Shared domain
of knowledge between business and IT executives and long‐term business direction led to alignment.
The findings indicate that both researchers and practitioners should devote great effort towards
understanding shared domain of knowledge.” (Chan & Reich, 2007)
Type Qualitative
Sample size N =3 (organisations, 10 business units)
Selection criteria Similarity of external influences and IT characteristics (thus controlling these variables)
Measurement tool Interviews and documents on short and long‐term strategies
Analysis method Developed alignment ratings per factor, based on literature. Gathered data was reviewed to rank each of the factors.
Used results Factors influencing alignment
Shared domain knowledge
Communication between business and IT executives
Connections between business and IT planning
Successful IT history

107
Chan (2002): Why haven’t we mastered alignment? The importance of the informal organization structure
Goal: “Determine whether preconditions for strategic and structural alignment were consistently
present at different points in time when the firms experienced high IS alignment”
Main findings: “In studying these top performers, it was found that alignment research and practice
are generally in sync, with the exception of the need to document the IS and business plans and
having the IT personnel involved in product and service development. However, there was no one
right way to align; each organization aligned in different ways. Strategic alignment mattered more
than structural IS alignment. The IS structures had to be flexible and these structures were primarily a
means to an end. Mostly importantly, it was found, that the informal organizational is more
important than previously thought in achieving alignment. This informal structure is reinforced by the
culture. Future research is needed to fully understand the alignment benefits of the informal
structure.” (Chan & Reich, 2007)
Type Qualitative
Sample size N = 8 (organisations)
Selection criteria Selection of best aligned / performance from North American organisations
Measurement tool Semi‐structured interview and relevant documents
Analysis method
Researches constructed list of practices that could potentially enhance alignment. These were verified by analysis of two of the cases by external researchers. The results were compared, thus determining the final list of practices.
Used results Practices marked as critical
CEO and CIO have a strong working relationship
Business and IS plans are closely linked
IS personnel participate in business planning
IS personnel make lateral short‐ or long‐term transfers into business partner areas
Incentive/compensation bonus schemes exist
Kearns & Lederer (2003): A resource‐based view of strategic IT alignment: hoe knowledge sharing creates
competitive advantage
Goal: “[..] the goals of this paper are to assess, in the context of the resource‐based view, three sets
of relationships: the influence of information intensity upon strategic IT alignment processes; the
influence of strategic IT alignment upon the outcomes or strategies; and the influence of the
outcomes upon the use of IT for competitive advantage.”
Main findings: “This research investigates the importance of the formal planning approach taken by
CEOs and CIOs in IT planning. The authors develop and test a model. This model predicts that the
information intensity of an organization will lead greater involvement of the CEO and the CIO in the IT
and business planning processes. This in turn will lead to the business and IT plans reflecting each
other, which is hypothesized to lead to IT that is used for competitive advantage. All paths are
supported with the exception of an IT plan that reflects the business plan leading to more strategic
use of IT.
This study has many key findings. Firstly, information intensity plays a significant role in involvement
in planning processes that leads to an increase in knowledge sharing. However, some interesting
findings emerged. The CEO's participation in IT planning did not clearly lead to the IT plan reflecting
the business plan, but. This can be attributed to the fact that the CIO does not perceive their
participation as important and/or the CEO's involvement may only be symbolic. These finding present
a fruitful area for future research.” (Chan & Reich, 2007)

108
Type Quantitative
Sample size 161 (organisations)
Selection criteria Random sample from 1200 US organisations with over 75M€ annual revenues
Measurement tool Questionnaire, 1 informant per organisation
Analysis method Analysis of predefined alignment constructed. Through statistical analysis the support for hypotheses on each of the constructs was tested.
Used results Constructs contributing to usage of IT for competitive advantage
Information intensity of the value chain
The CIO participates in business planning
The CEO participates in IT planning
The IT plan reflects the business plan
Chan et al. (2006): Antecedents and Outcomes of Strategic IS Alignment: An Empirical Investigation
Goal: “[..] the first specific objective of this paper is to provide additional empirical insight into the
factors affecting alignment. [..] The second objective of this paper is to provide insights into the
differences between business firms and academic institutions, and across business strategies, in the
impacts of alignment and the factors affecting it.”
Main findings: "This paper tests an integrated empirical model of alignment. Specifically, it looks at
antecedents to alignment in different business industries (public and private) and in businesses with
different strategies (Defender, Analyzer, Prospector). This study provides empirical support for the
popular argument that alignment improves organizational performance, but it is argued that not all
firms are equally well served by allocating scarce resources to improve IS alignment.” (Chan & Reich,
2007)
Type Quantitative
Sample size N = 164 (organisations)
Selection criteria Contacted companies in Dun & Bradstreet directories (US and Canada)
Measurement tool Questionnaires for different stakeholders within the organisation
Analysis method Derived preconditions from literatureThrough statistical analysis it was determined whether the preconditions were supported by the research data or not.
Used results Preconditions marked as ‘supported’
Shared domain knowledge
Prior IS success
Organisational size

109
Huang & Hu (2007): Achieving IT‐Business Strategic Alignment via Enterprise‐Wide Implementation of
Balanced Scorecards
Goal: “[..] four key elements of IT‐business alignment [..] were enhanced [within an organisation] by
the enterprise‐wide implementation of an established strategic management tool, the balanced
scorecard” 5
Main findings: A literature review resulted in four key elements for IT‐business alignment. The
remainder of the study concerns implementation of the balanced scorecard in one organisation,
which is not relevant for our research.
Type Qualitative
Sample size N = 1 (organisation)
Selection criteria Pre‐existing knowledge at company on subjects relevant for study
Measurement tool Semi structured interviews, documents, discussions
Analysis method Comparison of information from different sources
Used results Key elements of alignment (resulting from theoretical research)
Integrating IT planning with business planning
Maintaining effective communication channels
Developing strong relationships between IT and business
Institutionalising the culture of alignment
5 Determining the ‘key elements’ of strategic alignment on itself was not a goal of the study, nevertheless determining these elements was a part of the study. This was done through theoretical research.
110
F. BACKGROUND ON CONSTRUCTION OF ALIGNMENT FACTOR CATEGORIES
The process used to construct the alignment factor categories is based on a method to analyse quantitative
data, described by Baarda et al. (2005). To process described entails the steps listed below. For each of the
steps a description is given of how it relates to the construction of the alignment factor categories.
1. Selecting relevant information
This step was already carried out before the actual construction of categories. In the literature review
a selection was made of relevant papers on the topic of alignment factors and also on the content of
these papers. What information is selected is described in Appendix E.
2. Splitting text in fragments
The alignment factors found through the literature are already concise, and do not need to be split
further. The individual alignment factors fulfil the role of fragments in this process.
3. Assigning a label to each relevant fragment
The decision on what alignment factors are relevant and which are not is the first step of the
construction process. All relevant alignment factors are assigned a label, capturing their main topic
(step 2 of the construction process).
4. Ordering and reduction of labels
This action is carried out in step 3 and 4 of the construction process. Similar labels are grouped and
merged.
5. Determining the validity of the label set
The validity of this set lies in the completeness of the data used. All relevant labels ‘fit’ in the defined
labels.
6. Description of core labels
The description of the found alignment factor categories are given in section 5.2.2.
7. Determining intersubjectivity
This aspect requires multiple researchers, which is not the case for this project. To compensate for
this, insight in the labelling process is given by providing the results for each individual labelling step.
These results can be found in section 5.2.1 of this report.
8. Answering the research question
The goal of this process was to construct a core set of alignment factors: alignment factor categories.
This goal is reached by the execution of this process.
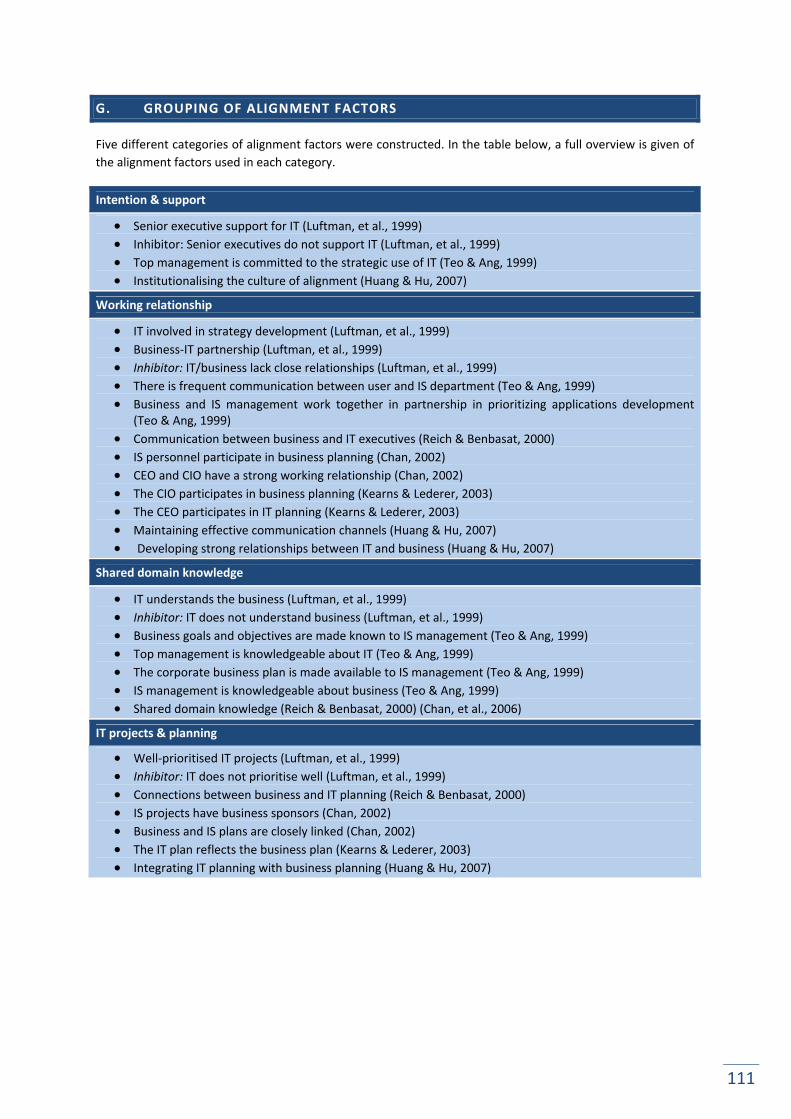
111
G. GROUPING OF ALIGNMENT FACTORS
Five different categories of alignment factors were constructed. In the table below, a full overview is given of
the alignment factors used in each category.
Intention & support
Senior executive support for IT (Luftman, et al., 1999)
Inhibitor: Senior executives do not support IT (Luftman, et al., 1999)
Top management is committed to the strategic use of IT (Teo & Ang, 1999)
Institutionalising the culture of alignment (Huang & Hu, 2007)
Working relationship
IT involved in strategy development (Luftman, et al., 1999)
Business‐IT partnership (Luftman, et al., 1999)
Inhibitor: IT/business lack close relationships (Luftman, et al., 1999)
There is frequent communication between user and IS department (Teo & Ang, 1999)
Business and IS management work together in partnership in prioritizing applications development (Teo & Ang, 1999)
Communication between business and IT executives (Reich & Benbasat, 2000)
IS personnel participate in business planning (Chan, 2002)
CEO and CIO have a strong working relationship (Chan, 2002)
The CIO participates in business planning (Kearns & Lederer, 2003)
The CEO participates in IT planning (Kearns & Lederer, 2003)
Maintaining effective communication channels (Huang & Hu, 2007)
Developing strong relationships between IT and business (Huang & Hu, 2007)
Shared domain knowledge
IT understands the business (Luftman, et al., 1999)
Inhibitor: IT does not understand business (Luftman, et al., 1999)
Business goals and objectives are made known to IS management (Teo & Ang, 1999)
Top management is knowledgeable about IT (Teo & Ang, 1999)
The corporate business plan is made available to IS management (Teo & Ang, 1999)
IS management is knowledgeable about business (Teo & Ang, 1999)
Shared domain knowledge (Reich & Benbasat, 2000) (Chan, et al., 2006)
IT projects & planning
Well‐prioritised IT projects (Luftman, et al., 1999)
Inhibitor: IT does not prioritise well (Luftman, et al., 1999)
Connections between business and IT planning (Reich & Benbasat, 2000)
IS projects have business sponsors (Chan, 2002)
Business and IS plans are closely linked (Chan, 2002)
The IT plan reflects the business plan (Kearns & Lederer, 2003)
Integrating IT planning with business planning (Huang & Hu, 2007)

112
IT performance
IT demonstrates leadership (Luftman, et al., 1999)
Inhibitor: IT fails to meet commitments (Luftman, et al., 1999)
Inhibitor: IT management lacks leadership (Luftman, et al., 1999)
Top management has confidence in the IS department (Teo & Ang, 1999)
The IS department provides efficient and reliable services to user departments (Teo & Ang, 1999)
The IS staff are able to keep up with advances in IT (Teo & Ang, 1999)
The IS department is responsive to user needs (Teo & Ang, 1999)
The IS department often comes up with creative ideas on how to use IT strategically (Teo & Ang, 1999)
Successful IT history (Reich & Benbasat, 2000)
IS personnel make lateral short‐ or long‐term transfers into business partner areas (Chan, 2002)
Incentive/compensation bonus schemes exist (Chan, 2002)
Prior IS success (Chan, et al., 2006)

113
H. LISTING OF CONSTRUCTED MEASURES AND RATINGS
Below, a complete overview is presented of the constructed measures for each of the alignment factor
categories, as described on pages 44 to 58 of this report. Each alignment factor and (sub)measure has been
assigned an identification code for future references.
Ratings that require interview questions are marked light blue and ratings that only require a calculation are
marked dark blue.
Code Alignment factor / Measure Rating
INT Intention & support Average of INT‐1, INT‐2 and INT‐3
INT‐1 Value recognition Average of INT‐1a and INT‐1b
INT‐1a Rationale for IT spending Rated according to “rationale for IT spending” of the SAMM:
1‐ Reduce costs
2‐ Productivity, efficiency
3‐ Also a process enabler
4‐ Process driver
5‐ Competitive advantage, profit
INT‐1b Perception of IT Rated according to “business perception of IT” of the SAMM:
1‐ Cost of doing business
2‐ Becoming an asset
3‐ Enables future business activity
4‐ Drives future business activity
5‐ Partner with business in creating value
INT‐2 Inclusion in vision/strategies Rating based on management practice “Define and communicate vision and strategies that include the role of IT” (Luftman, et al., 1999). Average of following ratings: 1‐ No vision on IT by top management 3‐ Only short‐term vision 5‐ Also long‐term vision and 1‐ Vision is not communicated by top management 3‐ Only communicated on request 5‐ Communicated
INT‐3 Resource allocation Rating based on perceived adequacy of funds and manpower
provided for IT. These ratings are provided by the informants.
WOR Working relationship Average of WOR‐1 and WOR‐2
WOR‐1 Communication Average of WOR‐1a and WOR‐1b
WOR‐1a CIO‐CEO relationship: Average of WOR‐1a‐1 and WOR‐1a‐2
WOR‐1a‐1 CEO’s accessibility for CIO Rating on adequacy of accessibility provided by informants
WOR‐1a‐2 Contact frequency CEO‐CIO Rating on adequacy of contact frequency provided by
informants
WOR‐1b IT‐business relationship: Evaluation of WOR‐1b‐1, WOR‐1b‐2 and WOR‐1b‐3
WOR‐1b‐1 Contact frequency IT‐
business
Rating on adequacy of contact frequency provided by
informants

114
Code Alignment factor / Measure Rating
WOR‐1b‐2 Style of communication Rated according to “Style and ease of access” of the SAMM:
1‐ Business to IT only, formal
2‐ One‐way, somewhat informal
3‐ Two‐way, formal
4‐ Two‐way, somewhat informal
5‐ Two‐way, informal and flexible
WOR‐1b‐3 Presence and efficiency IT‐business liaison staff
Rated according to “IT‐Business liaison staff” of the SAMM:
1‐ None, or only as needed
2‐ Primary IT‐business link
3‐ Facilitate knowledge transfer
4‐ Facilitate relationship building
5‐ Building relationship with partners
WOR‐2 Partnership Average of WOR‐2a and WOR‐2b
WOR‐2a Participation planning
process
Average of WOR‐2a‐1 and WOR‐2a‐2
WOR‐2a‐1
Role IT in business strategy
development
When constructing this measures, three items touched this topic: ‐ IT participates in business strategy planning ‐ CIO attends business planning meetings ‐ CIO contributes to the formulation of business goals Each of these items can be rated on a scale of 1 to 5. Averaging these scores results in a rating for this submeasure. - Degree of IT involvement: rating provided by informants
- Attendance CIO in business meetings: rated from 1‐never to
5‐ (almost) always
- Contribution CIO to business goals: rated from 1‐never to 5‐
(almost) always
WOR‐2a‐2 Role CEO in IT planning Contribution CEO rated from 1‐never to 5‐ (almost) always
WOR‐2b
Partnership in
determination prioritisation
criteria
Rated according to “How projects are prioritized” of the SAMM:
1‐ React to business or IT need
2‐ Determined by IT function
3‐ Determined by business function
4‐ Mutually determined
5‐ Partner’s priorities are considered
SHA Shared domain knowledge Average of SHA‐1 and SHA‐‐2
SHA‐1 IT’s business knowledge Average of SHA‐1a and SHA‐1b
SHA‐1a Understanding of business
by IT
Rated according to “Understanding of business by IT” of the SAMM: 1‐ IT management lacks understanding
2‐ Limited understanding by IT management
3‐ Good understanding by IT management
4‐ Understanding encouraged among IT staff
5‐ Understanding required of all IT staff

115
Code Alignment factor / Measure Rating
SHA‐1b Information sharing This measure concern IT’s knowledge on business goals and the sharing of the business plan with IT. These items can be rated as follows: 1‐ Business goals not known to IT management
3‐ Limited knowledge
5‐ Good knowledge
and 2‐ Business plans not available for IT management 3‐ Available on special request 5‐ Provided by management Averaging these ratings results in a rating on a 1‐5 scale for this sub measure.
SHA‐2 Business’ IT knowledge Rated according to “Understanding of IT by business” of the SAMM: 1‐ Managers lack understanding
2‐ Limited understanding by managers
3‐ Good understanding by managers
4‐ Understanding encouraged among staff
5‐ Understanding required of all staff
IPP IT projects & planning Evaluation of IPP‐1, IPP‐2 and IPP‐3
IPP‐1 Business sponsors for IT
projects
Rated according to “Business sponsors/champions” of the
SAMM:
1‐ Usually none
2‐ Often have a senior IT sponsor/ champion
3‐ IT and business sponsor/champion at unit level
4‐ Business sponsor/champion at corporate level
5‐ CEO is the business sponsor/champion
IPP‐2 Linkage business and IT
planning
Rating on extent of linkage provided by informants
IPP‐3 Project prioritisation Average of IPP‐3a and IPP‐3b
IPP‐3a Adequacy of prioritisation Average IPP‐3a‐1 and IPP‐3a‐2
IPP‐3a‐1 Perceived adequacy Rating on perceived adequacy given by informants
IPP‐3a‐2 Incorporation of new
technologies
Rating on technology incorporation given by informants
IPP‐3b Project initiation Rating on adherence to initiation process provided by informants.
IPF IT performance Average of IPF‐1, IPF‐2 and IPF‐3
IPF‐1 Innovation Average of IPF‐1a and IPF‐1b
IPF‐1a Technology leadership Rating on leadership provided by informants

116
Code Alignment factor / Measure Rating
IPF‐1b Creativity Rated according to “Innovative, entrepreneurial environment”
of the SAMM:
1‐ Discouraged
2‐ Somewhat encouraged at unit level
3‐ Strongly encouraged at unit level
4‐ Also at corporate level
5‐ Also with partners
IPF‐2 Reliability Average of IPF‐2a and IPF‐2b
IPF‐2a IT history Rating on successfulness of IT provided by informants, by
averaging their scores on:
‐ IT meeting their commitments
‐ Delivered products
IPF‐2b Perception Perceived reliability of the IT department and usefulness of their
deliverables by top management rated by informants
IPF‐3 Opportunities Average of IPF‐3a and IPF‐3b
IPF‐3a Cross‐over opportunities Rated according to “Career crossover opportunities” of the
SAMM:
1‐ Job transfers rarely occur
2‐ Occasionally occur within unit
3‐ Regularly occur for unit management
4‐ Regularly occur at all unit levels
5‐ Also at corporate level
IPF‐3b Bonus schemes Rated by presence and effectiveness:1‐ No bonus schemes are in place
3‐ Bonus schemes exist but do not amount to much
5‐ Bonus schemes exist and provide incentive for IT staff

117
I. DETAILS ON INTERVIEWS
This Appendix provides all details on the interviews that were held for this project.
I.1. INTERVIEW OUTLINE
All of the interviews follow the same structure. This structure is presented below:
1. Introduction (5 minutes)
Introduction of researcher
Description of research project
Goal of the interview
Structure of the interview
Detail on anonymity of informant in the project
Request to record interview
2. Introductory questions (5 minutes)
Introduction of informant
Description of IT structure in organisation
3. Main interview questions (45 minutes)
These questions are discussed in the remainder of this Appendix
Global questions:
- “What is the biggest issue in achieving strategic alignment for this organization?”
- “Did you miss any aspects you find important on the topic of strategic alignment?”
- “How would you score the strategic alignment of this organization?”
4. Closing (5 minutes)
Thanking the informant for his cooperation
Describe what results the informant will receive: interview report, case report and thesis
I.2. FULL LISTING OF INTERVIEW QUESTIONS
Based on the constructed measures and their rating criteria, interview questions were created in order to
retrieve the required information for every measure. With these questions two interviews were set up, one to
get a business point of view on the relevant topics, the other to get the IT point of view. These views can
complement each other in revealing the information needed to rate the measures for strategic alignment.
Within the scope of this reasoning the majority of questions are asked in both the business and the IT
interview.
Some of the questions however concern only the business or IT perspective. For example, we want to know
how the business perceives the added value IT for the organization (measure INT‐2). This specifically concerns
the business perspective and is therefore only included in the business interview. Additionally, some questions
are not based on the informants’ perception, but concern organizational facts. For example which parties
sponsor IT projects (measure IPP‐2). This is something that specifically concerns an IT topic, and is therefore
only included in the IT interview.
Which question was included in which interview is included in the following table (BU/IT):

118
# Corresponding measure
BU/IT? Question
1. INT‐1a BU What is the primary goal of IT in your organisation?
2. INT‐1b BU What is the added value of IT for your organisation?
3. INT‐2 BU + IT Has top management constructed a vision on the role of IT for the
organisation?
4. INT‐2 BU + IT Does top management communicate their vision on the role of IT for
the organisation?
5. INT‐3 BU + IT On a scale from 1 to 5, are adequate resources provided for the IT
department, in terms of funds and manpower?
6. WOR‐1a‐1 BU + IT On a scale from 1 to 5, how would you rate the CEO’s accessibility for
the CIO?
7. WOR‐1a‐2 BU + IT How often is there contact between the CIO and CEO? On a scale from
1 to 5, how would you rate the contact frequency of CEO and CIO?
8. WOR‐1b‐1 BU + IT How often is there business‐IT communication? On a scale from 1 to 5,
how would you rate the contact frequency of business and IT
9. WOR‐1b‐2 BU + IT Would you classify the communication between business and IT as
being a one‐way process or two‐way?
10. WOR‐1b‐2 BU + IT Would you classify the communication between business and IT as
more formal or informal?
11. WOR‐1b‐3 BU + IT Does this organisation have IT‐business liaison staff and if so, what is its
added value?
12. WOR‐2a‐1 BU + IT On a scale from 1 to 5, how would you rate the degree to which IT is
involved in the business strategy planning?
13. WOR‐2a‐1 BU + IT Does the CIO attend business planning meetings?
14. WOR‐2a‐1 BU + IT Does the CIO contribute to the formulation of business goals?
15. WOR‐2a‐2 BU + IT Does the CEO contribute to the IT planning?
16. WOR‐2b BU Are there prioritisation criteria in place for IT projects and if so, which
parties determine these criteria?
17. SHA‐1a BU + IT Does IT management have enough business knowledge to use IT as a
strategic instrument and communicate this to business management?
18. SHA‐1a IT Are courses (or other methods) available to increase business
knowledge amongst IT managers and if so, are they compulsory of
voluntary?
19. SHA‐1a IT Is business knowledge considered when selecting new IT managers?
20. SHA‐1b IT Are the business goals known to IT management?
21. SHA‐1b IT Are the business plans available for IT management?
22. SHA‐2 BU + IT Does business management have enough IT knowledge to discuss and
judge IT projects?
23. SHA‐2 BU Are courses (or other methods) available to increase IT knowledge
amongst managers and if so, are they compulsory of voluntary?
24. SHA‐2 BU Is IT knowledge considered when selecting new managers?
25. IPP‐1 IT Who sponsors IT projects?
26. IPP‐2 IT On a scale from 1 to 5, to what extent do the IT plans reflect the
business plan? (In terms of mission, goals, strategies, etc.)
27. IPP‐3a‐1 BU On a scale from 1 to 5, how well‐prioritised are the current IT projects?

119
# Corresponding measure
BU/IT? Question
28. IPP‐3a‐2 BU + IT Project prioritisation criteria should make sure that technologies are
incorporated in a timely manner, so that an organisation does not fall
behind competitors. On a scale from 1 to 5, to what extent do the
prioritisation criteria for this organisation meet this requirement?
29. IPP‐3b BU + IT How are projects initiated? And do all projects follow this path?
30. IPF‐1a BU + IT On a scale of 1 to 5, to what extent do you consider this firm to be a
technological leader amongst competitors?
31. IPF‐1b IT Is IT staff stimulated to create innovative ideas on how to use IT for the
organisation?
32. IPF‐2a BU + IT On a scale of 1 to 5, to what extent does the IT department meet its
commitments?
33. IPF‐2b BU On a scale of 1 to 5, to what extent do you have confidence in the IT
department in terms of reliability and the usefulness of their
deliverables?
34. IPF‐3a IT Is it possible for IT staff to crossover to more business‐related positions
and if so, how often and for what positions does this occur?
35. IPF‐3b IT Are bonus schemes in place for IT staff? If so, are they effective?
I.3. DEFINITIVE VERSION OF INTERVIEWS (DUTCH)
In this section, the final versions of the interviews are presented. The order of the questions has been shuffled
to improve the natural flow of the conversation, and the questions are translated to Dutch. Each of the
definitive questions is accompanied with a number, indicating to which question it corresponds in the listing
from the previous section.
BUSINESS INTERVIEW
Question #
Op welke manier kan IT bijdragen aan het succes van de organisatie? 1
Wat is de voornaamste bijdrage van IT aan uw organisatie in de praktijk? 2
Op een schaal van 1 tot 5, in hoeverre ziet u deze organisatie als een voorloper op het gebied van
technologie ten opzichte van concurrenten?
30
Wat zijn de drijvende factoren/partijen bij het initiëren van nieuwe projecten? En geldt dit voor alle
projecten, of zijn er veel “losstaande” projecten?
29
Bij een goede projectprioritering wordt ervoor gezorgd dat nieuwe technologieën tijdig worden
geïmplementeerd, om concurrentie voor te blijven. Op een schaal van 1 tot 5, hoe zou u de gestelde
prioriteiten door IT beoordelen?
28
Op een schaal van 1 tot 5, in welke regelmaat lukt het IT om te voldoen aan hun commitments? 32
Wat is uw beeld van de IT‐afdeling in uw bedrijf als het gaat om betrouwbaarheid en de
bruikbaarheid van hun producten?
33
Op een schaal van 1 tot 5, in welke mate vindt u dat er adequate resources beschikbaar zijn voor IT
(in termen van budget en mankracht)?
5
Is er een visie gedefinieerd over de rol van IT?
Zo ja, voor korte en/of lange termijn?
3

120
In welke mate wordt de visie over de rol van IT gecommuniceerd? 4
In hoeverre (1‐5) is IT betrokken in de ontwikkeling van bedrijfsstrategieën? 12
Met welke regelmaat is de CIO aanwezig bij meetings over bedrijfsplanningen? 13
In welke mate draagt de CIO bij aan de formulering van bedrijfsstrategieën? 14
In welke mate draagt de CEO bij aan de IT‐planning? 15
Zijn er vastgestelde criteria om de projectprioritering vast te stellen?
Zo ja, door welke partijen worden deze opgesteld?
16
Op een schaal van 1 tot 5, hoe beoordeelt u de mate waarop het IT‐plan de bedrijfsplannen
reflecteren?
26
In hoeverre heeft IT genoeg kennis van business om IT doelgericht te kunnen gebruiken als
strategisch instrument en dit te communiceren naar business management?
17
In hoeverre heeft het topmanagement genoeg kennis van IT om projecten te kunnen beoordelen en
hierover te communiceren?
22
Zijn er trainingen (of andere methoden) om deze kennis te vergroten?
Zo ja, hebben deze een vrijwillig of verplicht karakter?
23
Wordt er bij het selecteren van (relevante) managers rekening gehouden met hun IT kennis? 24
Zou u de communicatie tussen business en IT typeren als een‐ of tweerichtingsverkeer? 9
En meer formeel of informeel? 10
Is er een liaison/tussenpersoon aangesteld?
Zo ja, wat is zijn of haar toegevoegde waarde in de relatie tussen business en IT?
11
Hoe vaak is er contact tussen business en IT? 8
Op een schaal van 1 tot 5, hoe zou u de contactfrequentie tussen business en IT beoordelen? 8
Hoe vaak is er contact tussen CEO en CIO? 7
Op een schaal van 1 tot 5, hoe zou u deze frequentie beoordelen? 7
Hoe zou u de toegankelijkheid van de CEO vanuit het oogpunt van de CIO beoordelen op een schaal
van 1 tot 5?
6
IT INTERVIEW
Question #
Op een schaal van 1 tot 5, in hoeverre ziet u deze organisatie als een voorloper op het gebied van
technologie ten opzichte van concurrenten?
30
Op een schaal van 1 tot 5, in welke regelmaat lukt het IT om te voldoen aan hun commitments? 32
Op een schaal van 1 tot 5, in welke mate vindt u dat er adequate resources beschikbaar zijn voor IT
(in termen van budget en mankracht)?
5
Is er een visie gedefinieerd over de rol van IT?
Zo ja, voor korte en/of lange termijn?
3
In welke mate wordt de visie over de rol van IT gecommuniceerd? 4
In hoeverre (1‐5) is IT betrokken in de ontwikkeling van bedrijfsstrategieën? 12
Met welke regelmaat is de CIO aanwezig bij meetings over bedrijfsplanningen? 13
In welke mate draagt de CIO bij aan de formulering van bedrijfsstrategieën? 14
In welke mate draagt de CEO bij aan de IT‐planning? 15
Op een schaal van 1 tot 5, hoe beoordeelt u de mate waarop het IT‐plan de bedrijfsplannen
reflecteren?
26
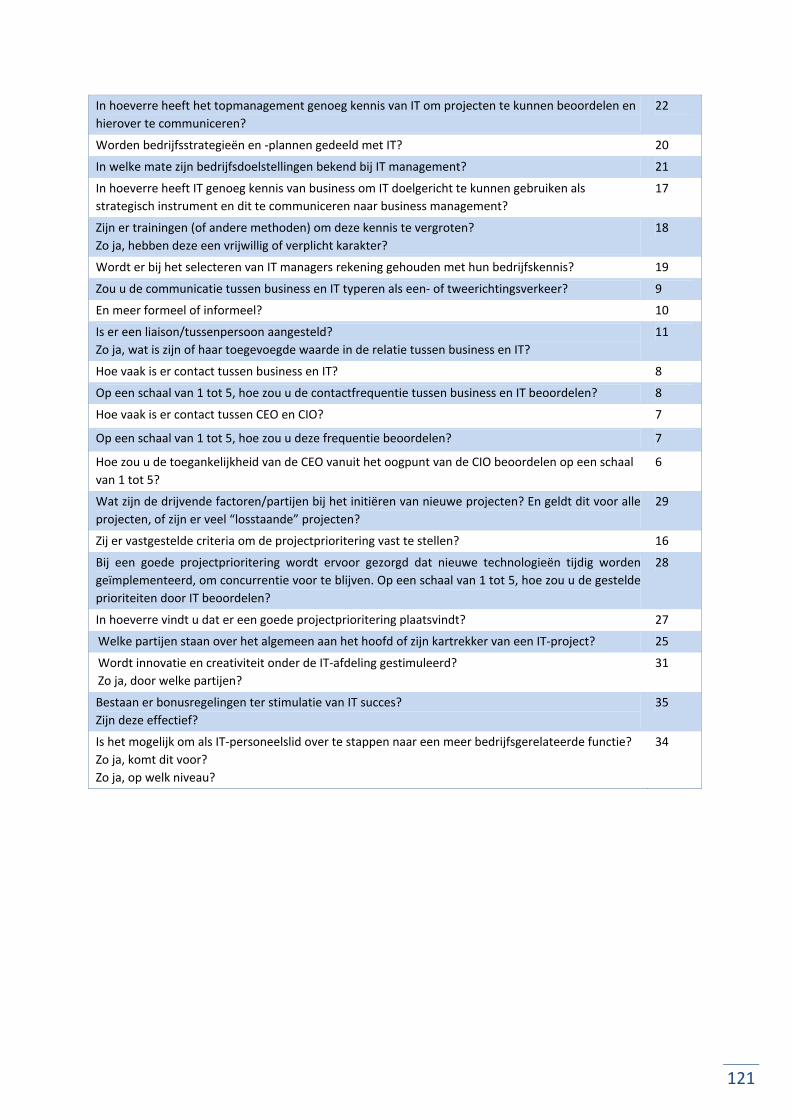
121
In hoeverre heeft het topmanagement genoeg kennis van IT om projecten te kunnen beoordelen en
hierover te communiceren?
22
Worden bedrijfsstrategieën en ‐plannen gedeeld met IT? 20
In welke mate zijn bedrijfsdoelstellingen bekend bij IT management? 21
In hoeverre heeft IT genoeg kennis van business om IT doelgericht te kunnen gebruiken als
strategisch instrument en dit te communiceren naar business management?
17
Zijn er trainingen (of andere methoden) om deze kennis te vergroten?
Zo ja, hebben deze een vrijwillig of verplicht karakter?
18
Wordt er bij het selecteren van IT managers rekening gehouden met hun bedrijfskennis? 19
Zou u de communicatie tussen business en IT typeren als een‐ of tweerichtingsverkeer? 9
En meer formeel of informeel? 10
Is er een liaison/tussenpersoon aangesteld?
Zo ja, wat is zijn of haar toegevoegde waarde in de relatie tussen business en IT?
11
Hoe vaak is er contact tussen business en IT? 8
Op een schaal van 1 tot 5, hoe zou u de contactfrequentie tussen business en IT beoordelen? 8
Hoe vaak is er contact tussen CEO en CIO? 7
Op een schaal van 1 tot 5, hoe zou u deze frequentie beoordelen? 7
Hoe zou u de toegankelijkheid van de CEO vanuit het oogpunt van de CIO beoordelen op een schaal
van 1 tot 5?
6
Wat zijn de drijvende factoren/partijen bij het initiëren van nieuwe projecten? En geldt dit voor alle
projecten, of zijn er veel “losstaande” projecten?
29
Zij er vastgestelde criteria om de projectprioritering vast te stellen? 16
Bij een goede projectprioritering wordt ervoor gezorgd dat nieuwe technologieën tijdig worden
geïmplementeerd, om concurrentie voor te blijven. Op een schaal van 1 tot 5, hoe zou u de gestelde
prioriteiten door IT beoordelen?
28
In hoeverre vindt u dat er een goede projectprioritering plaatsvindt? 27
Welke partijen staan over het algemeen aan het hoofd of zijn kartrekker van een IT‐project? 25
Wordt innovatie en creativiteit onder de IT‐afdeling gestimuleerd?
Zo ja, door welke partijen?
31
Bestaan er bonusregelingen ter stimulatie van IT succes?
Zijn deze effectief?
35
Is het mogelijk om als IT‐personeelslid over te stappen naar een meer bedrijfsgerelateerde functie?
Zo ja, komt dit voor?
Zo ja, op welk niveau?
34
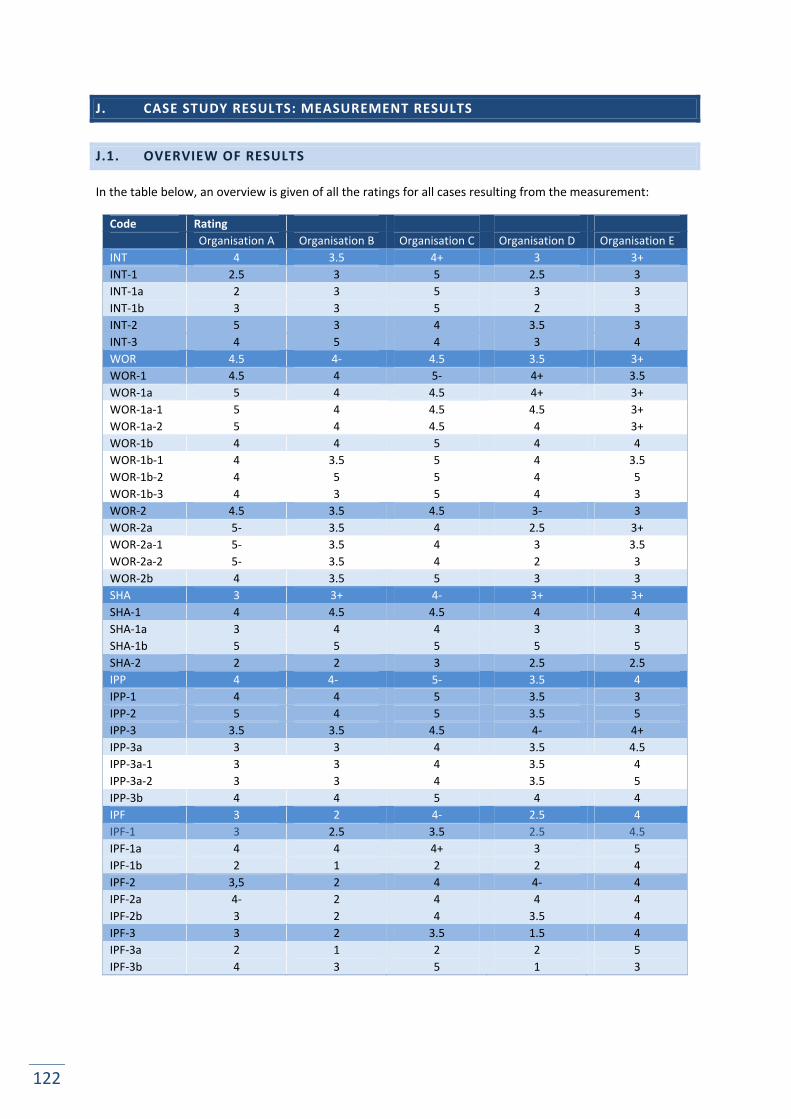
122
J. CASE STUDY RESULTS: MEASUREMENT RESULTS
J.1. OVERVIEW OF RESULTS
In the table below, an overview is given of all the ratings for all cases resulting from the measurement:
Code Rating
Organisation A Organisation B Organisation C Organisation D Organisation E
INT 4 3.5 4+ 3 3+
INT‐1 2.5 3 5 2.5 3
INT‐1a 2 3 5 3 3
INT‐1b 3 3 5 2 3
INT‐2 5 3 4 3.5 3
INT‐3 4 5 4 3 4
WOR 4.5 4‐ 4.5 3.5 3+
WOR‐1 4.5 4 5‐ 4+ 3.5
WOR‐1a 5 4 4.5 4+ 3+
WOR‐1a‐1 5 4 4.5 4.5 3+
WOR‐1a‐2 5 4 4.5 4 3+
WOR‐1b 4 4 5 4 4
WOR‐1b‐1 4 3.5 5 4 3.5
WOR‐1b‐2 4 5 5 4 5
WOR‐1b‐3 4 3 5 4 3
WOR‐2 4.5 3.5 4.5 3‐ 3
WOR‐2a 5‐ 3.5 4 2.5 3+
WOR‐2a‐1 5‐ 3.5 4 3 3.5
WOR‐2a‐2 5‐ 3.5 4 2 3
WOR‐2b 4 3.5 5 3 3
SHA 3 3+ 4‐ 3+ 3+
SHA‐1 4 4.5 4.5 4 4
SHA‐1a 3 4 4 3 3
SHA‐1b 5 5 5 5 5
SHA‐2 2 2 3 2.5 2.5
IPP 4 4‐ 5‐ 3.5 4
IPP‐1 4 4 5 3.5 3
IPP‐2 5 4 5 3.5 5
IPP‐3 3.5 3.5 4.5 4‐ 4+
IPP‐3a 3 3 4 3.5 4.5
IPP‐3a‐1 3 3 4 3.5 4
IPP‐3a‐2 3 3 4 3.5 5
IPP‐3b 4 4 5 4 4
IPF 3 2 4‐ 2.5 4
IPF‐1 3 2.5 3.5 2.5 4.5
IPF‐1a 4 4 4+ 3 5
IPF‐1b 2 1 2 2 4
IPF‐2 3,5 2 4 4‐ 4
IPF‐2a 4‐ 2 4 4 4
IPF‐2b 3 2 4 3.5 4
IPF‐3 3 2 3.5 1.5 4
IPF‐3a 2 1 2 2 5
IPF‐3b 4 3 5 1 3

123
J.2. ORGANISATION A: INTERVIEW RESULTS
Code Alignment factor / Measure Rating
INT‐1a Rationale for IT spending
1‐ Reduce costs
2‐ Productivity, efficiency
3‐ Also a process enabler
4‐ Process driver
5‐ Competitive advantage,
profit
Because of automation of processes, with only a small
number of people, large quantities of data can be
processed. IT provides efficiency and flexibility. The
goal for IT is to support/follow the business.
2
INT‐1b Perception of IT
1‐ Cost of doing business
2‐ Becoming an asset
3‐ Enables future business
activity
4‐ Drives future business
activity
5‐ Partner with business in
creating value
IT makes it possible to process large amount of data
and also keep track of large amounts of current data.
This enables certain business activities. However, IT is
always following the business, it does not drive future
business activities.
3
INT‐2 Inclusion in vision/strategies
Average of following ratings: 1‐ No vision on IT by top
management
3‐ Only short‐term vision
5‐ Also long‐term vision
and 1‐ Vision is not
communicated by top
management
3‐ Only communicated on
request
5‐ Communicated
There is a global 5‐year‐plan, which has been translated to a European 2‐year‐plan. The European plan describes the outline of the changes in IT for the next two years. (score: 5) This European plan is communicated very well, and it is clear to everyone what the direction of the plan is. (score: 5)
5
INT‐3 Resource allocation The provided resources are perceived as sufficient by
both business and IT. Budgets are realistic.
Nevertheless this is always a field of tension.
Estimates are made, because it is not always clear in
advance what is needed. This is mainly the case for
change‐projects.
4
WOR‐1a‐1 CEO’s accessibility for CIO The CTO is a member of the executive board, making
the CEO very accessible.
5
WOR‐1b‐1 Contact frequency CEO‐CIO Because the CTO is a member of the executive board,
the frequency is very high. The board meets every
week.
5
WOR‐1b‐1 Contact frequency IT‐
business
The frequency is rated as very sufficient. When
problems occur, this is not because of lack of
communication, but because people may not be
aware that some information is relevant to other
parties.
4

124
Code Alignment factor / Measure Rating
WOR‐1b‐2 Style of communication
1‐ Business to IT only,
formal
2‐ One‐way, somewhat
informal
3‐ Two‐way, formal
4‐ Two‐way, somewhat
informal
5‐ Two‐way, informal and
flexible
Both informants see the communication as being
more two‐way, and both formal and informal. The
opinion on which type is dominant differs: From the
business point of view, the contact is mostly at an
informal basis, and formal meetings are mostly in
place for specific projects. The IT informant stated
that most contact is formal, but there is also informal
contact within the project groups.
4
WOR‐1b‐3
Presence and efficiency IT‐
business liaison staff
1‐ None, or only as needed
2‐ Primary IT‐business link
3‐ Facilitate knowledge
transfer
4‐ Facilitate relationship
building
5‐ Building relationship
with partners
So‐called “Business Technology Managers” (BTM) are
in place to help the business is setting priorities and
act as a direct contact for a business division. Both the
business and IT informant are positive about the
BTMs. They have knowledge about the business and
facilitate/organise what is needed for the business, for
example translate business requirements to IT,
connects the right people for certain business wishes
and keeps track of progress in running projects.
4
WOR‐2a‐1
Role IT in business strategy
development
- Degree of IT
involvement: rating
provided by informants
- Attendance CIO in
business meetings:
rated from 1‐never to 5‐
(almost) always
- Contribution CIO to
business goals: rated
from 1‐never to 5‐
(almost) always
IT is included in strategy development to a large extent. There are teams of both business and IT personnel. (score: 5) Because the CTO is a member of the executive board, he is always present at business meetings (score: 5) and contributes to the development of business goals, for example in the development of the European plans (score: 5). The business divisions communicate on an informal level with the CTO about their plans. The main communication channel is through the Business Technology Manager. However, all plans are discussed in and have to be approved by the executive board, including the CTO.
5‐
WOR‐2a‐2 Role CEO in IT planning On the level of the European plans, the CEO
contributed to great extent; the plans were created
with the entire executive board.
Concerning more short‐term plans, IT plans are based
on needs voiced by the business. The executive board
eventually decides on the initiation of the project.
5‐

125
Code Alignment factor / Measure Rating
WOR‐2b
Partnership in
determination prioritisation
criteria
1‐ React to business or IT
need
2‐ Determined by IT
function
3‐ Determined by business
function
4‐ Mutually determined
5‐ Partner’s priorities are
considered
Some projects have to be prioritised because they are
required by law, others in order to support the
current systems and applications. For the other
projects concerns such as efficiency, added
functionality and risk reduction are considered. These
priorities are discussed by both business and IT on
different levels in the organisation. The executive
board decides on the eventual execution of the
projects.
4
SHA‐1a IT’s business knowledge
1‐ IT management lacks
understanding
2‐ Limited understanding
by IT management
3‐ Good understanding by
IT management
4‐ Understanding
encouraged among IT
staff
5‐ Understanding required
of all IT staff
IT: the IT organisation is fairly mature and a real conversation partner of the business. Obligatory trainings are in place to enlarge this knowledge, for example one that focuses on the value chains of asset managers. When relevant for the function, business knowledge is also taken into account in the selection of new managers. Business: On management levels there is sufficient knowledge. However, for the lower levels this is a difficulty. Projects can get stuck in detailed issues, and a broader perspective should be taken. Also, in the process of setting up requirements, things can be overlooked or not investigated deep enough. Often, problems occur that could have been avoided if considered earlier on in the process.
3
SHA‐1b Information sharing
This measure concern IT’s knowledge on business goals and the sharing of the business plan with IT. These items can be rated as follows: 1‐ Business goals not
known to IT
management
3‐ Limited knowledge
5‐ Good knowledge
and 1‐ Business plans not
available for IT
management
3‐ Available on special
request
5‐ Provided by
management
Averaging these ratings
results in a rating on a 1‐5
scale for this sub measure.
This information is part of the European plans. These plans are communicated well and IT has good knowledge on them
5

126
Code Alignment factor / Measure Rating
SHA‐2 Business’ IT knowledge
1‐ Managers lack
understanding
2‐ Limited understanding
by managers
3‐ Good understanding by
managers
4‐ Understanding
encouraged among staff
5‐ Understanding required
of all staff
Both business and IT question the necessity of this topic. A liaison is in place to translate wishes present in the business to IT. However, both parties also remark that some work is needed to improve the requirements engineering process. IT has the wish for the business to better define their requirements, and the business also indicates there is room for improvement when it comes to “speaking each other’s language”.
2
IPP‐1 Business sponsors for IT
projects
1‐ Usually none
2‐ Often have a senior IT
sponsor/ champion
3‐ IT and business
sponsor/champion at
unit level
4‐ Business
sponsor/champion at
corporate level
5‐ CEO is the business
sponsor/champion
All projects have a business sponsor, according to
prince2 (corporate level)
4
IPP‐2 Linkage business and IT
planning
On a strategic level, there is high alignment; business
benefits for IT projects are defined in the European
plans.
5
IPP‐3a‐1 Opinion on set criteria In general the projects are looked upon as well‐
prioritised. However, the time needed for the projects
is often underestimated. The manpower is still
required by the delayed project and cannot be
assigned to others. Because of this some (smaller)
projects do not receive the attention they require,
even though these projects can be very important.
3
IPP‐3a‐2 Incorporation of new
technologies
Critical developments are followed, but innovation is
not a goal of the organisation. That which is necessary
for the organisation is carried out. IT is there to
support the business, sometimes this can be done by
incorporating new technologies.
3
IPP‐3b Project initiation It was stated in the IT interview that business should
be leading for IT. When discussing the project
portfolio it was pointed out that change‐projects are
only initiated when they have a clear business benefit
and are approved by the executive board. For
maintenance projects, business benefits are not
considered.
4

127
Code Alignment factor / Measure Rating
IPF‐1a Technology leadership The organisation always looks at the ‘best in class’.
However, it needs to be assessed what can be done
and what cannot. In the current situation, the
organisation is “ahead of average”.
4
IPF‐1b Creativity
1‐ Discouraged
2‐ Somewhat encouraged
at unit level
3‐ Strongly encouraged at
unit level
4‐ Also at corporate level
5‐ Also with partners
Only limited. Innovation is not a goal and it is not
beneficial when it is accompanied with teething
troubles.
2
IPF‐2a IT history
‐ IT meeting their
commitments
‐ Delivered products
On the topic of meeting commitments, both
informants are positive. When projects do run late or
over budget, it is always discussed with the business.
Most of the projects are delivered within budget and
on time, but not always in scope. A possible
explanation was given for this: IT may overestimate
what can be done in a certain amount of time. (score:
4)
4‐
IPF‐2b Perception There appears to be a gap between what the business
wants and what is delivered by IT. Sometimes IT
deliverables meet all the set requirements and pass all
tests, but are not yet usable for the business. Not
surprisingly, remarks were made during the interviews
that the requirements engineering process needs
improvements.
Also, some of the smaller (but not less important)
projects do not get the required attention. When
other projects run late, manpower does not become
available when originally planned. This causes
previously planned projects to get left behind.
2
IPF‐3a Cross‐over opportunities
1‐ Job transfers rarely
occur
2‐ Occasionally occur
within unit
3‐ Regularly occur for unit
management
4‐ Regularly occur at all
unit levels
5‐ Also at corporate level
It is possible for IT personnel to cross‐over to more
business related functions. However this does not
occur very often, mostly they stay with IT.
When it does occur, this can be at any level in the
organisation.
2

128
Code Alignment factor / Measure Rating
IPF‐3b Bonus schemes
1‐ No bonus schemes are
in place
3‐ Bonus schemes exist
but do not amount to
much
5‐ Bonus schemes exist
and provide incentive
for IT staff
Variable salaries are in place for all personnel. Yearly agreements are made on what is expected of an employee. Based on an employee’s achievements, a decision is made on the payment of this salary. This results in a constructive discussion about what is expected and what achievements should be made.
4
J.3. ORGANISATION B: INTERVIEW RESULTS
Code Alignment factor / Measure Rating
INT‐1a Rationale for IT spending
1‐ Reduce costs
2‐ Productivity, efficiency
3‐ Also a process enabler
4‐ Process driver
5‐ Competitive advantage,
profit
IT contributes to the efficiency of processes, but also
to the development of new functionality. The business
is leading for IT.
3
INT‐1b Perception of IT
1‐ Cost of doing business
2‐ Becoming an asset
3‐ Enables future business
activity
4‐ Drives future business
activity
5‐ Partner with business
in creating value
Thanks to IT, it is possible to offer certain services to
customers such as fast processing or track & tracing.
The business is leading for IT.
3
INT‐2 Inclusion in
vision/strategies
Average of following ratings: 1‐ No vision on IT by top
management
3‐ Only short‐term vision
5‐ Also long‐term vision
and 1‐ Vision is not
communicated by top
management
3‐ Only communicated on
request
5‐ Communicated
An IT strategy is still in development, also for a longer term: 3 years. However, this vision is mostly created by IT itself, though top management was involved in some ways. In the top level strategy only a small paragraph is dedicated to IT. (rating: 2) Though the strategy has not yet been officially instantiated, people do have a good idea what it is about. (rating: 4)
3
INT‐3 Resource allocation Both business and IT are very positive about this
aspect. There is a lot of flexibility concerning resources
and it has not been an issue.
5

129
Code Alignment factor / Measure Rating
WOR‐1a‐1 CEO’s accessibility for CIO Of course there are busy schedules, but in general
accessibility is not a problem.
4
WOR‐1b‐1 Contact frequency CEO‐CIO Every two weeks the manager IT is present at a board
meeting. Besides this there is also much informal
contact. This is more than sufficient.
4
WOR‐1b‐1 Contact frequency IT‐
business
The frequency suffices, but can definitely be improved. 3.5
WOR‐1b‐2 Style of communication
1‐ Business to IT only,
formal
2‐ One‐way, somewhat
informal
3‐ Two‐way, formal
4‐ Two‐way, somewhat
informal
5‐ Two‐way, informal and
flexible
Communication goes both ways, and is both formal
and informal. There are formal meetings to set
agreements, but besides that there is also a lot of
informal contact.
5
WOR‐1b‐3
Presence and efficiency IT‐
business liaison staff
1‐ None, or only as needed
2‐ Primary IT‐business link
3‐ Facilitate knowledge
transfer
4‐ Facilitate relationship
building
5‐ Building relationship
with partners
There are liaisons in place for different areas. For
example architects that set up requirements, the
service desk for running business and projects
managers or analysts for project specific matters.
These functions help in making connections between
business and IT.
3
WOR‐2a‐1
Role IT in business strategy
development
- Degree of IT
involvement: rating
provided by informants
- Attendance CIO in
business meetings:
rated from 1‐never to 5‐
(almost) always
- Contribution CIO to
business goals: rated
from 1‐never to 5‐
(almost) always
IT in involved in strategy development on an operational level. The business sets the general direction, and IT looks at how this can be achieved. This also holds for the contribution to business goals The manager IT (equivalent to CIO for this group) is present at business meetings when relevant topics are on the agenda.
3.5
WOR‐2a‐2 Role CEO in IT planning All management levels have been involved in this
process. Furthermore, the board gives final approval
over the plans.
3.5
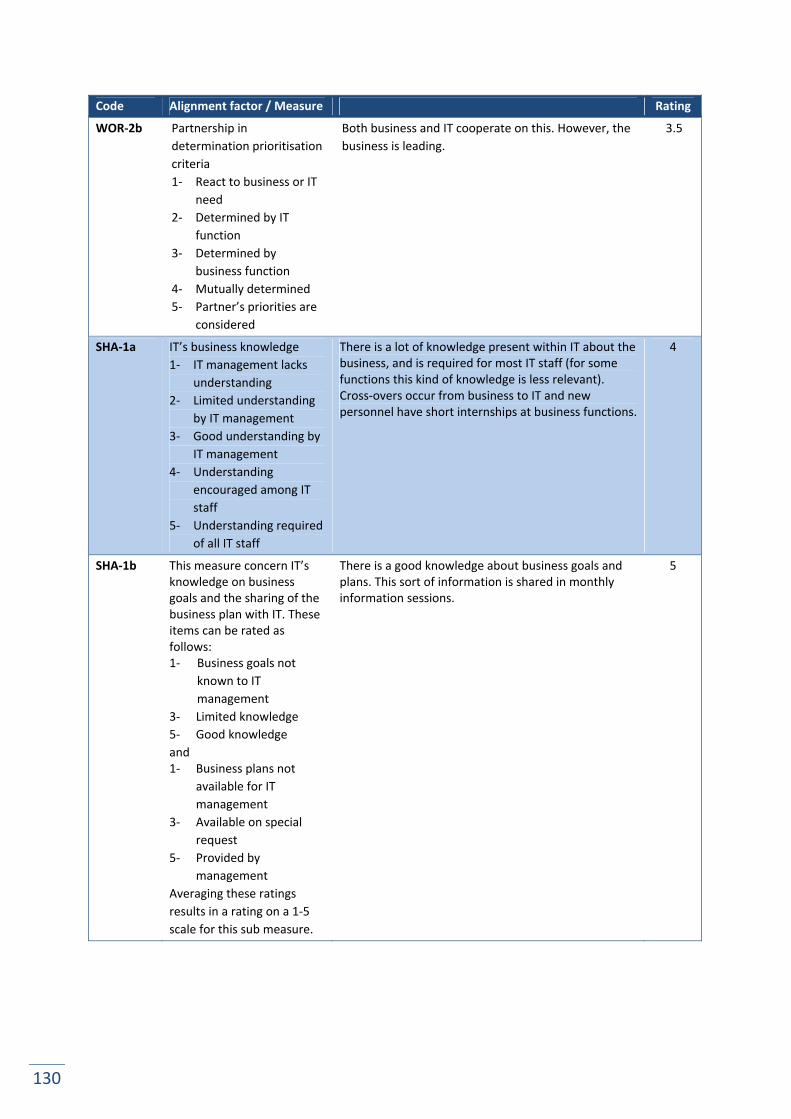
130
Code Alignment factor / Measure Rating
WOR‐2b
Partnership in
determination prioritisation
criteria
1‐ React to business or IT
need
2‐ Determined by IT
function
3‐ Determined by
business function
4‐ Mutually determined
5‐ Partner’s priorities are
considered
Both business and IT cooperate on this. However, the
business is leading.
3.5
SHA‐1a IT’s business knowledge
1‐ IT management lacks
understanding
2‐ Limited understanding
by IT management
3‐ Good understanding by
IT management
4‐ Understanding
encouraged among IT
staff
5‐ Understanding required
of all IT staff
There is a lot of knowledge present within IT about the business, and is required for most IT staff (for some functions this kind of knowledge is less relevant). Cross‐overs occur from business to IT and new personnel have short internships at business functions.
4
SHA‐1b This measure concern IT’s knowledge on business goals and the sharing of the business plan with IT. These items can be rated as follows: 1‐ Business goals not
known to IT
management
3‐ Limited knowledge
5‐ Good knowledge
and 1‐ Business plans not
available for IT
management
3‐ Available on special
request
5‐ Provided by
management
Averaging these ratings
results in a rating on a 1‐5
scale for this sub measure.
There is a good knowledge about business goals and plans. This sort of information is shared in monthly information sessions.
5

131
Code Alignment factor / Measure Rating
SHA‐2 Business’ IT knowledge
1‐ Managers lack
understanding
2‐ Limited understanding
by managers
3‐ Good understanding by
managers
4‐ Understanding
encouraged among staff
5‐ Understanding required
of all staff
There was a big lack of understanding in the past, which was the reason to set up a product development department, a sort of a middle man between business and IT. At the moment the knowledge is considered reasonable, but it is not encouraged specifically.
2
IPP‐1 Business sponsors for IT
projects
1‐ Usually none
2‐ Often have a senior IT
sponsor/ champion
3‐ IT and business
sponsor/champion at
unit level
4‐ Business
sponsor/champion at
corporate level
5‐ CEO is the business
sponsor/champion
Prince2 is used on IT projects. This means there is a
business sponsor at a corporate level.
4
IPP‐2 Linkage business and IT
planning
IT should sometimes deliberate more on what the
business benefits of a project are. However, the
eventual project portfolio and more high level plans
are well‐linked to the business plans.
4
IPP‐3a‐1 Opinion on set criteria The project is reasonably well‐prioritised. It is difficult
to keep course, Regularly, new projects that suddenly
become important get in the way of the original
priorities. This area needs improvement, according to
the informants
3
IPP‐3a‐2 Incorporation of new
technologies
Innovation causes delay in projects, making it
undesirable for the business at times. There is not
really a drive to innovate.
3
IPP‐3b Project initiation Business is considered leading and at most times,
projects have a business driver.
4
IPF‐1a Technology leadership The group is more of a trend follower than a trend
setter. The current technology is reasonably state of
the art, and a lot of services can be offered to the
customer.
4
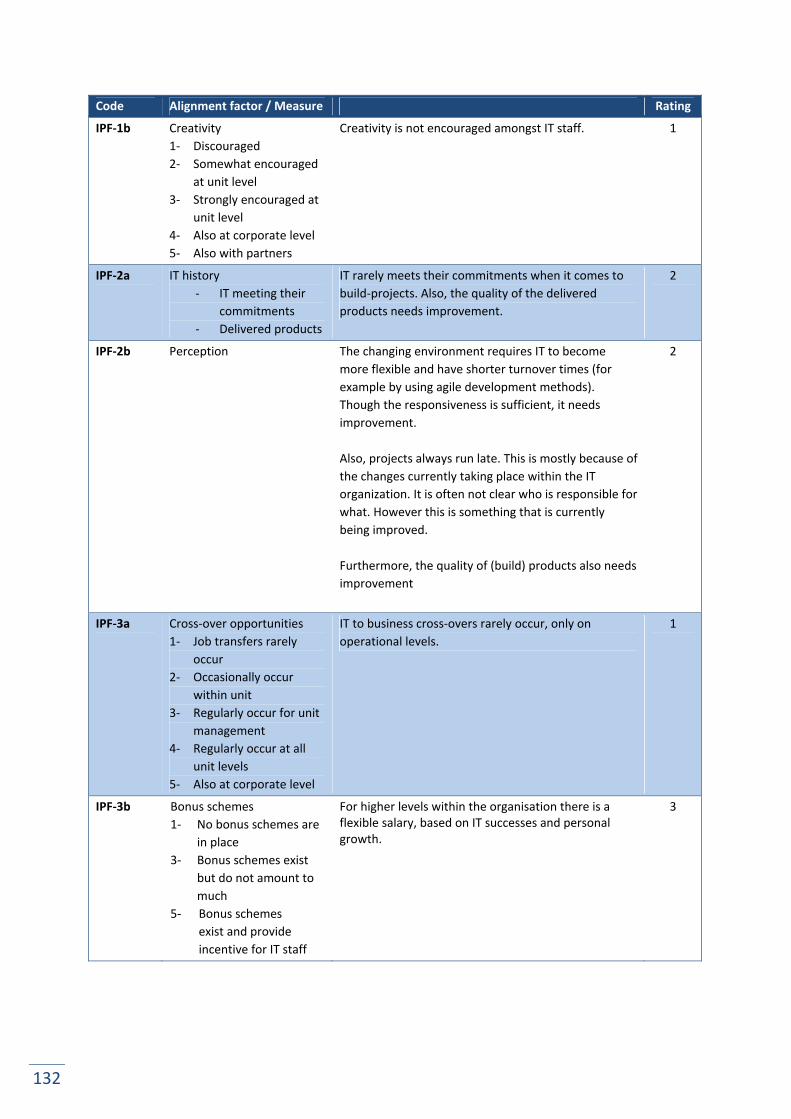
132
Code Alignment factor / Measure Rating
IPF‐1b Creativity
1‐ Discouraged
2‐ Somewhat encouraged
at unit level
3‐ Strongly encouraged at
unit level
4‐ Also at corporate level
5‐ Also with partners
Creativity is not encouraged amongst IT staff. 1
IPF‐2a IT history
‐ IT meeting their
commitments
‐ Delivered products
IT rarely meets their commitments when it comes to
build‐projects. Also, the quality of the delivered
products needs improvement.
2
IPF‐2b Perception The changing environment requires IT to become
more flexible and have shorter turnover times (for
example by using agile development methods).
Though the responsiveness is sufficient, it needs
improvement.
Also, projects always run late. This is mostly because of
the changes currently taking place within the IT
organization. It is often not clear who is responsible for
what. However this is something that is currently
being improved.
Furthermore, the quality of (build) products also needs
improvement
2
IPF‐3a Cross‐over opportunities
1‐ Job transfers rarely
occur
2‐ Occasionally occur
within unit
3‐ Regularly occur for unit
management
4‐ Regularly occur at all
unit levels
5‐ Also at corporate level
IT to business cross‐overs rarely occur, only on
operational levels.
1
IPF‐3b Bonus schemes
1‐ No bonus schemes are
in place
3‐ Bonus schemes exist
but do not amount to
much
5‐ Bonus schemes
exist and provide
incentive for IT staff
For higher levels within the organisation there is a flexible salary, based on IT successes and personal growth.
3

133
J.4. ORGANISATION C: INTERVIEW RESULTS
Code Alignment factor / Measure Rating
INT‐1a Rationale for IT spending
1‐ Reduce costs
2‐ Productivity, efficiency
3‐ Also a process enabler
4‐ Process driver
5‐ Competitive advantage,
profit
Software development is seen as an important part of
strategic development. There has even been cut in
other business areas to make more resources available
for it.
5
INT‐1b Perception of IT
1‐ Cost of doing business
2‐ Becoming an asset
3‐ Enables future business
activity
4‐ Drives future business
activity
5‐ Partner with business
in creating value
Business and IT work together in creating strategic
advantage. It is seen as very important to the
organisation.
5
INT‐2 Inclusion in
vision/strategies
Average of following ratings: 1‐ No vision on IT by top
management
3‐ Only short‐term vision
5‐ Also long‐term vision
and 1‐ Vision is not
communicated by top
management
3‐ Only communicated on
request
5‐ Communicated
There is general vision that includes IT, but also a more specific vision for each of the business divisions. This vision is communicated well, by the business divisions in strategy sessions.
4
INT‐3 Resource allocation Because build‐projects are placed within the business
divisions, they have direct control over these
resources. Both business and IT are positive about this.
For the IT back‐end the resource could be improved.
4
WOR‐1a‐1 CEO’s accessibility for CIO There is very easy access between the IT manager and
top management
4.5
WOR‐1a‐2 Contact frequency CEO‐CIO Next to formal contacts, there is contact whenever it is
needed. Both parties are very positive about this
frequency.
4.5
WOR‐1b‐1 Contact frequency IT‐
business
There is a lot of contact. There are formal moments,
but besides those there is contact on a daily basis as
the front‐end IT groups are integrated with the
business divisions.
5

134
Code Alignment factor / Measure Rating
WOR‐1b‐2 Style of communication
1‐ Business to IT only,
formal
2‐ One‐way, somewhat
informal
3‐ Two‐way, formal
4‐ Two‐way, somewhat
informal
5‐ Two‐way, informal and
flexible
Communication is very informal and flexible. IT is
mostly two way, but mostly from business to IT for
software development as they are part of the business
divisions.
5
WOR‐1b‐3
Presence and efficiency IT‐
business liaison staff
1‐ None, or only as needed
2‐ Primary IT‐business link
3‐ Facilitate knowledge
transfer
4‐ Facilitate relationship
building
5‐ Building relationship
with partners
Through the incorporation of the departments for
product development, the relationship between
business and IT was greatly improved. IT not only
improves the business‐IT relationship, but is an
integration of both parties.
5
WOR‐2a‐1
Role IT in business strategy
development
- Degree of IT
involvement: rating
provided by informants
- Attendance CIO in
business meetings:
rated from 1‐never to 5‐
(almost) always
- Contribution CIO to
business goals: rated
from 1‐never to 5‐
(almost) always
The involvement of IT in strategy development is limited to an operational level. For the strategies of the different business divisions, the manager product development attends strategy meetings and contributes to them. He can be seen as the CIO of that particular division.
4
WOR‐2a‐2 Role CEO in IT planning The IT planning is also decentralised. The head of each
business division is involved in this process to a great
extent.
4
WOR‐2b
Partnership in
determination prioritisation
criteria
1‐ React to business or IT
need
2‐ Determined by IT
function
3‐ Determined by
business function
4‐ Mutually determined
5‐ Partner’s priorities are
considered
Prioritisation is done by the business divisions, as far
as it concerns the projects for their specific divisions
(these projects also come out of their own resources).
For some of these divisions, the manager IT is present
in such meetings, but only to give estimates on the
time needed for projects and possible conflicts.
The central IT group has their own budget, and sets its
own priorities.
This way, both parties’ priorities are taken into
account.
5

135
Code Alignment factor / Measure Rating
SHA‐1a IT’s business knowledge
1‐ IT management lacks
understanding
2‐ Limited understanding
by IT management
3‐ Good understanding by
IT management
4‐ Understanding
encouraged among IT
staff
5‐ Understanding required
of all IT staff
With the placement of software developers within the business divisions, this has greatly improved. Before, it was often not clear why some deadlines were set and personnel had difficulty with the dynamics of the business. Now that the developers are placed within the business divisions, knowledge transfer has increased. Understanding of the business is strongly encouraged.
4
SHA‐1b This measure concern IT’s knowledge on business goals and the sharing of the business plan with IT. These items can be rated as follows: 1‐ Business goals not
known to IT
management
3‐ Limited knowledge
5‐ Good knowledge
and 1‐ Business plans not
available for IT
management
3‐ Available on special
request
5‐ Provided by
management
Averaging these ratings
results in a rating on a 1‐5
scale for this sub measure.
Business goals and strategies are well known to the IT personnel. This is experienced as a very positive thing.
5
SHA‐2 Business’ IT knowledge
1‐ Managers lack
understanding
2‐ Limited understanding
by managers
3‐ Good understanding by
managers
4‐ Understanding
encouraged among staff
5‐ Understanding required
of all staff
There is a good understanding in the department of product development, where it is relevant. The other departments within a business division rely on product development’s information on IT. Increasing this knowledge is not specifically encouraged.
3

136
Code Alignment factor / Measure Rating
IPP‐1 Business sponsors for IT
projects
1‐ Usually none
2‐ Often have a senior IT
sponsor/ champion
3‐ IT and business
sponsor/champion at
unit level
4‐ Business
sponsor/champion at
corporate level
5‐ CEO is the business
sponsor/champion
The director of a business division is the business
sponsor (CEO equivalent)
5
IPP‐2 Linkage business and IT
planning
There is a very close link between the business plans
and IT plans (for the individual business divisions), as
the business sets up these plans themselves.
5
IPP‐3a‐1 Opinion on set criteria Business sets the priorities for software development. 4
IPP‐3a‐2 Incorporation of new
technologies
Priority is assigned to build‐projects that are
important. Sometimes the incorporation runs behind
on schedule, but then it is discussed in a special
project committee (at a central level) in order to deal
with this and solve the problems.
4
IPP‐3b Project initiation All projects have business cases, otherwise they are
not initiated. In the prioritisation, the choice goes out
to larger projects that really provide business benefits,
instead of having a large number of smaller projects.
5
IPF‐1a Technology leadership On the customer side, the organisation provides state
of the art services. As for used technologies
(internally), the organisation is a fast‐follower.
4+
IPF‐1b Creativity
1‐ Discouraged
2‐ Somewhat encouraged
at unit level
3‐ Strongly encouraged at
unit level
4‐ Also at corporate level
5‐ Also with partners
Creativity is not something that is strongly
encouraged.
2
IPF‐2a IT history
‐ IT meeting their
commitments
‐ Delivered products
There is not much delay for the projects. The most
important part for the aspect is that the projects meet
customers’ needs. This is going reasonably well, and is
in the on‐going process of improvement. Using agile
development methods helps with this. Commitments
in terms of time or budget are not really considered an
issue.
4
IPF‐2b Perception IT is seen as motivated, hard‐working partner.
However it is noted that that is still room for
improvement when it comes to their delivered
products.
4

137
Code Alignment factor / Measure Rating
IPF‐3a Cross‐over opportunities
1‐ Job transfers rarely
occur
2‐ Occasionally occur
within unit
3‐ Regularly occur for unit
management
4‐ Regularly occur at all
unit levels
5‐ Also at corporate level
These rarely occur. However, the IT personnel for the
front‐end are placed within the business units. So
though they are officially a part of IT, in practice they
work for the business divisions.
2
IPF‐3b Bonus schemes
1‐ No bonus schemes are
in place
3‐ Bonus schemes exist
but do not amount to
much
5‐ Bonus schemes
exist and provide
incentive for IT staff
There are several bonus schemes in place for all IT personnel. There is a flexible salary based on growth in personal competencies, and a bonus based on successes and personal achievements.
5
J.5. ORGANISATION D: INTERVIEW RESULTS
Code Alignment factor / Measure Rating
INT‐1a Rationale for IT spending
1‐ Reduce costs
2‐ Productivity, efficiency
3‐ Also a process enabler
4‐ Process driver
5‐ Competitive advantage,
profit
IT is mostly an opportunity reduce costs, by the
automation of certain activities. However, it is
sometimes also used as a showstopper. Either way,
the business depends on IT, but there is a love‐hate
relationship between the two. The main goal is of IT is
to be a business enabler
3
INT‐1b Perception of IT
1‐ Cost of doing business
2‐ Becoming an asset
3‐ Enables future business
activity
4‐ Drives future business
activity
5‐ Partner with business
in creating value
IT is looked upon as an expense rather than an
investment. But on the other hand, it is also something
that is advertised with for the investigated business
division. However, the role of IT is still mostly
supportive.
2

138
Code Alignment factor / Measure Rating
INT‐2 Inclusion in
vision/strategies
Average of following ratings:
1‐ No vision on IT by top
management
3‐ Only short‐term vision
5‐ Also long‐term vision
and
1‐ Vision is not
communicated by top
management
3‐ Only communicated on
request
5‐ Communicated
The inclusion of IT in a top level vision is implicit, not
explicit. Further IT vision/strategies are developed by
IT.
One of these strategies concerns a model that defines
how the link between business and IT is made when
changes are adopted in the organisation. This
construct is something that is well‐communicated and
known throughout the department.
3.5
INT‐3 Resource allocation More resources should become available for
innovation. Because IT is still seen as a cost instead of
an investment, budget decrease each year and
eventually the organisation will burn its fingers on this.
3
WOR‐1a‐1 CEO’s accessibility for CIO The accessibility of the CEO for the CIO is rated very
positive by both business and IT. The two have known
each other for years, which strengthens their
relationship
4.5
WOR‐1a‐2 Contact frequency CEO‐CIO Formally, the CIO and CEO meet 6 times per year in an
IT board, but besides this there is a lot of informal
contact. Both business and IT are positive about this
frequency.
4
WOR‐1b‐1 Contact frequency IT‐
business
The frequencies of the various formal meetings are
being moved around a little, but most of them have a
sufficient frequency. Besides these meetings there is
contact on a daily basis.
4
WOR‐1b‐2 Style of communication
1‐ Business to IT only,
formal
2‐ One‐way, somewhat
informal
3‐ Two‐way, formal
4‐ Two‐way, somewhat
informal
5‐ Two‐way, informal and
flexible
On a higher level, there is a lot of formal contact, but
also informal. The communication is a two‐way
process. Information managers sit with both business
and IT to discuss and set the requirements of projects.
4

139
Code Alignment factor / Measure Rating
WOR‐1b‐3
Presence and efficiency IT‐
business liaison staff
1‐ None, or only as needed
2‐ Primary IT‐business link
3‐ Facilitate knowledge
transfer
4‐ Facilitate relationship
building
5‐ Building relationship
with partners
On the business side there are information managers
for each business division, who are the contact for the
management of the concerning division. They are an
important player in the translation from what the
business wants to what IT has to do. The information
manager sits with both business and IT to ensure that
both parties understand each other.
On an operational level, the liaison functions are the
portfolio manager on the business side and demand
manager on the IT side.
4
WOR‐2a‐1
Role IT in business strategy
development
- Degree of IT
involvement: rating
provided by
interviewees
- Attendance CIO in
business meetings:
rated from 1‐never to 5‐
(almost) always
- Contribution CIO to
business goals: rated
from 1‐never to 5‐
(almost) always
IT plays a supportive and advising role in the
development of strategies. This is also the role of the
CIO in the formulation of business goals. The CIO is
present at strategy sessions about 3 or 4 times per
year.
3
WOR‐2a‐2 Role CEO in IT planning The CEO is involved in setting the IT budget and setting
main themes together with the CIO. The actual
planning is set in corporation with information
management.
2
WOR‐3b
Partnership in
determination prioritisation
criteria
1‐ React to business or IT
need
2‐ Determined by IT
function
3‐ Determined by
business function
4‐ Mutually determined
5‐ Partner’s priorities are
considered
Priorities are set by the director of a business division
together with a number of business managers.
3

140
Code Alignment factor / Measure Rating
SHA‐1a IT’s business knowledge
1‐ IT management lacks
understanding
2‐ Limited understanding
by IT management
3‐ Good understanding by
IT management
4‐ Understanding
encouraged among IT
staff
5‐ Understanding required
of all IT staff
On a management level, there is a good knowledge on
the business. On the lower levels this is very
dependent on the individual, but for the most they
lack business knowledge
3
SHA‐1b This measure concern IT’s knowledge on business goals and the sharing of the business plan with IT. These items can be rated as follows: 1‐ Business goals not
known to IT
management
3‐ Limited knowledge
5‐ Good knowledge
and 3‐ Business plans not
available for IT
management
3‐ Available on special
request
5‐ Provided by
management
Averaging these ratings
results in a rating on a 1‐5
scale for this sub measure.
Business goals and vision are shared with IT. IT
personnel has a good knowledge on business goals
and vision
SHA‐2 Business’ IT knowledge
1‐ Managers lack
understanding
2‐ Limited understanding
by managers
3‐ Good understanding by
managers
4‐ Understanding
encouraged among staff
5‐ Understanding required
of all staff
Managers lack understanding mostly, but the party
within the business that is concerned with IT –
information management – has a good understanding.
It is however not considered something that is
considered a priority for other staff.
2.5

141
Code Alignment factor / Measure Rating
IPP‐1 Business sponsors for IT
projects
1‐ Usually none
2‐ Often have a senior IT
sponsor/ champion
3‐ IT and business
sponsor/champion at
unit level
4‐ Business
sponsor/champion at
corporate level
5‐ CEO is the business
sponsor/champion
This is a director or manager from the business
division.
3.5
IPP‐2 Linkage business and IT
planning
There is a reasonable match between business and IT
plans. On a high level they concern different matters,
but information management brings these two
together.
3.5
IPP‐3a‐1 Opinion on set criteria This aspect is perceived as positive for the investigated
business division. However it is noted that this differs
for all divisions. For this business division, a good
method is in place, but this is not the case for all
divisions.
3.5
IPP‐3a‐2 Incorporation of new
technologies
There is a good match between the set goals and the
IT projects. However, the organisation is not a front
runner when it comes to technology.
3.5
IPP‐3b Project initiation For this business division, all projects have business
cases. Based on these cases, a prioritisation is made.
Otherwise, projects are not initiated. This is not the
case for all business divisions.
4
IPF‐1a Technology leadership In some areas the organisation is ahead of average,
but on others behind. On average, it is mainstream
concerning technology
3
IPF‐1b Creativity
1‐ Discouraged
2‐ Somewhat encouraged
at unit level
3‐ Strongly encouraged at
unit level
4‐ Also at corporate level
5‐ Also with partners
Creativity is not specifically encouraged, but staff does
keep track of developments and how they can be used
for the organisation.
2
IPF‐2a IT history
‐ IT meeting their
commitments
‐ Delivered products
In the last year, only one or two projects ran late or
over budget. There is a tight control when it comes to
commitments in terms of budget and scope.
4
IPF‐2b Perception IT projects are rated at an average 7.2 by the business
sponsors. And there is tight control on matters such as
budget and scope of projects.
3.5

142
Code Alignment factor / Measure Rating
IPF‐3a Cross‐over opportunities
1‐ Job transfers rarely
occur
2‐ Occasionally occur
within unit
3‐ Regularly occur for unit
management
4‐ Regularly occur at all
unit levels
5‐ Also at corporate level
Job transfers rarely occur. When they do, this is mostly
on the level of project managers.
2
IPF‐3b Bonus schemes
1‐ No bonus schemes are
in place
3‐ Bonus schemes exist
but do not amount to
much
5‐ Bonus schemes
exist and provide
incentive for IT staff
No bonus schemes are in place for IT 1
J.6. ORGANISATION E: INTERVIEW RESULTS
Code Alignment factor / Measure Rating
INT‐1a Rationale for IT spending
1‐ Reduce costs
2‐ Productivity, efficiency
3‐ Also a process enabler
4‐ Process driver
5‐ Competitive advantage,
profit
IT is seen as a valuable asset, enabling business
activity. When there is a certain need concerning IT
within the business, IT meets this need. The business
is leading.
3
INT‐1b Perception of IT
1‐ Cost of doing business
2‐ Becoming an asset
3‐ Enables future business
activity
4‐ Drives future business
activity
5‐ Partner with business
in creating value
The perception of IT is in line with the rationale for IT;
IT enables future business activity
3

143
Code Alignment factor / Measure Rating
INT‐2 Inclusion in
vision/strategies
Average of following
ratings:
1‐ No vision on IT by top
management
3‐ Only short‐term vision
5‐ Also long‐term vision
and
1‐ Vision is not
communicated by top
management
3‐ Only communicated on
request
5‐ Communicated
On a top level there is a vision on what the
organisation should be like in three years. This gets
translated to a more concrete plan for each business
divisions. For each of these visions an IT strategy is set
up accordingly.
3
INT‐3 Resource allocation In principle, there is a large enough budget available.
More good staff could be used, but it is not
considered a major issue.
4
WOR‐1a‐1 CEO’s accessibility for CIO The CEO and CIO are in principally in good contact. But
within the organisation, the CIO reports to the CFO
who has little affinity for IT. This is something the CIO
struggles with. This CEO‐CFO‐CIO structure needs
improvement.
3+
WOR‐1a‐2 Contact frequency CEO‐CIO The CEO and CIO meet in a formal setting once a
month, but have more informal contact on a weekly
basis.
3+
WOR‐1b‐1 Contact frequency IT‐
business
Both informants are positive on this aspect, but see
room for improvement.
3.5
WOR‐1b‐2 Style of communication
1‐ Business to IT only,
formal
2‐ One‐way, somewhat
informal
3‐ Two‐way, formal
4‐ Two‐way, somewhat
informal
5‐ Two‐way, informal and
flexible
The communication takes place in both ways, and is
informal and flexible.
5
WOR‐1b‐3
Presence and efficiency IT‐
business liaison staff
1‐ None, or only as needed
2‐ Primary IT‐business link
3‐ Facilitate knowledge
transfer
4‐ Facilitate relationship
building
5‐ Building relationship
with partners
Information management fulfils this role. They are the
direct link between business and IT within the
organisation, but also provide insight into what is
possible for IT and what the business wants.
3

144
Code Alignment factor / Measure Rating
WOR‐2a‐1
Role IT in business strategy
development
- Degree of IT
involvement: rating
provided by
interviewees
- Attendance CIO in
business meetings:
rated from 1‐never to 5‐
(almost) always
- Contribution CIO to
business goals: rated
from 1‐never to 5‐
(almost) always
IT is involved in the business planning process, but the
level of involvement could be improved. The CIO is
present at business planning meetings, but does not
have all the necessary knowledge at hand.
3.5
WOR‐2a‐2 Role CEO in IT planning Most of the planning is done at the level of the
business divisions. The CEO does give formal approval
through a governance board, and is involved indirectly
in the planning process.
3
WOR‐2b
Partnership in
determination prioritisation
criteria
1‐ React to business or IT
need
2‐ Determined by IT
function
3‐ Determined by
business function
4‐ Mutually determined
5‐ Partner’s priorities are
considered
Priorities are determined at the level of the business
divisions, by the business.
3
SHA‐1a IT’s business knowledge
1‐ IT management lacks
understanding
2‐ Limited understanding
by IT management
3‐ Good understanding by
IT management
4‐ Understanding
encouraged among IT
staff
5‐ Understanding required
of all IT staff
IT management has a good understanding of the
business. On the lower levels within the organisation
business knowledge needs to be improved.
3

145
Code Alignment factor / Measure Rating
SHA‐1b This measure concerns IT’s knowledge on business goals and the sharing of the business plan with IT. These items can be rated as follows: 1‐ Business goals not
known to IT
management
3‐ Limited knowledge
5‐ Good knowledge
and 4‐ Business plans not
available for IT
management
3‐ Available on special
request
5‐ Provided by
management
Averaging these ratings
results in a rating on a 1‐5
scale for this sub measure.
Throughout the organisation there is much attention
for the sharing of business goals/vision with all
personnel.
5
SHA‐2 Business’ IT knowledge
1‐ Managers lack
understanding
2‐ Limited understanding
by managers
3‐ Good understanding by
managers
4‐ Understanding
encouraged among staff
5‐ Understanding required
of all staff
From the IT point of view, the business’ knowledge on
IT is not considered an issue. Business managers know
where they lack knowledge, and make sure that other
parties fill in this gap. From the business perspective,
the IT knowledge is considered limited. The business
should be more aware of the complexity of IT.
2.5
IPP‐1 Business sponsors for IT
projects
1‐ Usually none
2‐ Often have a senior IT
sponsor/ champion
3‐ IT and business
sponsor/champion at
unit level
4‐ Business
sponsor/champion at
corporate level
5‐ CEO is the business
sponsor/champion
The business divisions sponsor IT projects (unit level). 3
IPP‐2 Linkage business and IT
planning
The IT plans can be directly linked to the business
plans (for the business divisions)
5
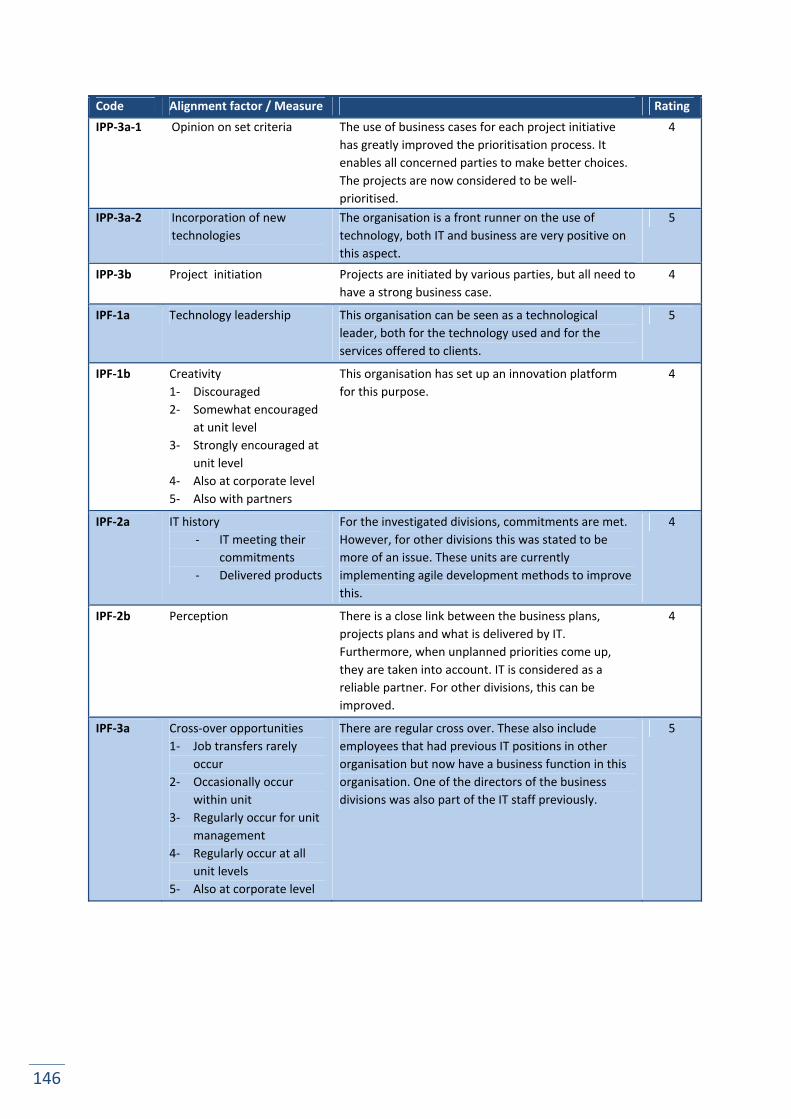
146
Code Alignment factor / Measure Rating
IPP‐3a‐1 Opinion on set criteria The use of business cases for each project initiative
has greatly improved the prioritisation process. It
enables all concerned parties to make better choices.
The projects are now considered to be well‐
prioritised.
4
IPP‐3a‐2 Incorporation of new
technologies
The organisation is a front runner on the use of
technology, both IT and business are very positive on
this aspect.
5
IPP‐3b Project initiation Projects are initiated by various parties, but all need to
have a strong business case.
4
IPF‐1a Technology leadership This organisation can be seen as a technological
leader, both for the technology used and for the
services offered to clients.
5
IPF‐1b Creativity
1‐ Discouraged
2‐ Somewhat encouraged
at unit level
3‐ Strongly encouraged at
unit level
4‐ Also at corporate level
5‐ Also with partners
This organisation has set up an innovation platform
for this purpose.
4
IPF‐2a IT history
‐ IT meeting their
commitments
‐ Delivered products
For the investigated divisions, commitments are met.
However, for other divisions this was stated to be
more of an issue. These units are currently
implementing agile development methods to improve
this.
4
IPF‐2b Perception There is a close link between the business plans,
projects plans and what is delivered by IT.
Furthermore, when unplanned priorities come up,
they are taken into account. IT is considered as a
reliable partner. For other divisions, this can be
improved.
4
IPF‐3a Cross‐over opportunities
1‐ Job transfers rarely
occur
2‐ Occasionally occur
within unit
3‐ Regularly occur for unit
management
4‐ Regularly occur at all
unit levels
5‐ Also at corporate level
There are regular cross over. These also include
employees that had previous IT positions in other
organisation but now have a business function in this
organisation. One of the directors of the business
divisions was also part of the IT staff previously.
5

147
Code Alignment factor / Measure Rating
IPF‐3b Bonus schemes
1‐ No bonus schemes are
in place
3‐ Bonus schemes exist
but do not amount to
much
5‐ Bonus schemes
exist and provide
incentive for IT staff
Bonus schemes are in place for personnel beyond a
certain pay scale, but they do not have the desired
effect. The schemes should be more focused on
personal performance and the contribution to the
success of the organisation.
3


![Finite sets in mCRL2alexandria.tue.nl/extra1/afstversl/wsk-i/louwers2007.pdf · 2008-05-16 · mCRL2 is a formal specification language and an overview of mCRL2 can be found in [4]](https://img.pdfslide.us/doc/110x75/5f4a453bce51f9546b6a1441/finite-sets-in-2008-05-16-mcrl2-is-a-formal-specification-language-and-an-overview.jpg)