Embed Size (px)
Citation preview

Edited by Agota Szende and Alan Williams
Measuring Self-Reported Population Health:
An International Perspective based on EQ-5D
EQ-5DAn Instrument to value Health from the
EuroQol Group


Measuring Self-Reported Population Health:
An International Perspective based on EQ-5D
Edited by Agota Szende and Alan Williams
On behalf of:The EuroQol Group’s International Task Force
on Self-Reported Health
EQ-5DAn Instrument to value Health from the
EuroQol Group

© 2004. EuroQol Group.
ISBN 963 94 56 47 0
EuroQol Group
• The EuroQol Group is a network of international multi-disciplinary researchers devoted to the measurement of health-related quality of life. The EuroQol Group originally consisted ofresearchers from Europe, but nowadays includes members fromNorth America, Asia, Africa, Australia, and New Zealand. TheGroup is responsible for the development of EQ-5D, a preferencebased measure of health-related quality of life.
• EQ-5D consists of the EQ-5D descriptive system that measureshealth-related quality of life on five dimensions (mobility, self-care, usual activities, pain/discomfort, and anxiety/depression)and the EQ VAS – a 20 cm vertical visual analogue scale thatgenerates a self-rating of health-related quality of life. EQ-5D iswidely used in clinical trials, observational studies, and otherhealth surveys.
• The EuroQol Group has 2 primary research interests. One focuseson empirical work using EQ-5D, and the other focuses onmethodological work to develop EQ-5D.
• The EuroQol Group is a “living” organization that, through itsmembers, continuously conducts research using EQ-5D. Researchareas include valuation and population studies, experimentingwith the EQ-5D descriptive system, computerized applications,interpretation of EQ-5D ratings, and social inequalities in healthstatus measurement.
• The EuroQol Group’s website (www.euroqol.org) containsdetailed information about EQ-5D, guidance for users, languageversions, references, and contact details.
4

CONTENTS
Introduction 9Rosalind Rabin, Frank de Charro, Agota Szende
Population norms and their uses 16Mark Oppe, Frank de Charro
Can we explain inter-country differences in levels of health? 23Irina Cleemput
Education and health 30Matejka Rebolj
Measuring health inequalities 37Agota Szende
References 43
Annex 1 51Description of EQ-5D population surveys
Annex 2 55EQ-5D population norms tables
5

LIST OF CONTRIBUTORS
Irina Cleemput Belgian Health Care Knowledge Centre, Brussels, Belgium
Frank de CharroErasmus University Rotterdam, The Netherlands
Mark OppeErasmus University Rotterdam, The Netherlands
Rosalind Rabin EuroQol Business Management, Rotterdam, The Netherlands
Matejka Rebolj Department of Public Health, Erasmus Medical Center, Rotterdam,The Netherlands
Agota SzendeMEDTAP International, London, United Kingdom
Alan WilliamsCentre for Health Economics, University of York, York, UnitedKingdom
6

ACKNOWLEDGEMENTS
The editors wish to acknowledge the following researchers whocontributed EQ-5D country data described in this booklet.
Armenia Gayane Gharagebakyan, Armenia TransitionProgramme, Yerevan, Armenia
Belgium Irina Cleemput, Belgian Health Care KnowledgeCentre, Brussels, Belgium
Canada Jeff Johnson, Institute of Health Economics,Edmonton, Canada
Finland Arto Ohinmaa, University of Alberta, Edmonton, CanadaHarri Sintonen, University of Helsinki, Helsinki, Finland
Germany Wolfgang Greiner, University of Hannover, Hannover, Germany
Greece Yannis Yfantopoulos, University of Athens, Athens, Greece
Hungary Agota Szende, MEDTAP International, London, United KingdomRenata Nemeth, Hungarian National Center forEpidemiology, Budapest, Hungary
Japan Naoki Ikegami, Keio University School of Medicine, Tokyo, JapanAki Tsuchiya, University of Sheffield, Sheffield, United Kingdom
7

Netherlands Jan Busschbach, Erasmus Medical Centre, University Medical Centre, Rotterdam, the NetherlandsMarie-Louise Essink Bot, Erasmus Medical Centre, University Medical Centre, Rotterdam, the Netherlands
New Zealand Nancy Devlin, City University, London, United KingdomPaul Hansen, Otago University, Dunedin, New Zealand
Slovenia Valentina Prevolnik-Rupel, Ministry of Health, Ljubljana, SloveniaMatejka Rebolj, Department of Public Health, Erasmus Medical Center, Rotterdam, The Netherlands
Spain Xavier Badia, Health Outcomes Research Europe, Barcelona, SpainIdoia Gaminde, Department of Health, Navarra, Spain
Sweden Stefan Björk, Novo Nordisk, Bagsvaerd, DenmarkKristina Burström, Karolinska Institute, Stockholm, Sweden
United Kingdom Paul Kind, University of York, York, United Kingdom
Zimbabwe Jennifer Jelsma, University of Cape Town, Cape Town, South Africa
8

Chapter 1
Introduction
Rosalind Rabin, Frank de Charro, Agota Szende
Purpose of this booklet
During the 15 years since EQ-5D was first developed, a substantialamount of research has been carried out worldwide using theinstrument. Among these studies were surveys conducted in variouscountries that measured the health-related quality of life of thegeneral population. These studies have been informative in providingnew data on population health characteristics, complementing thetraditionally collected morbidity and mortality data.
The EuroQol Group is frequently asked to provide EQ-5D populationreference data (sometimes called population norms) for a specificcountry or international region. Such data can be used to compareprofiles for patients with specific conditions with data for the averageperson in the general population in a similar age and/or gender group.
In response to the increasing need for EQ-5D population referencedata, the EuroQol Group established the Self-Reported Health TaskForce Group whose objectives were as follows:• Updating the international EQ-5D general population databasearchive.• Providing easy-to-use tables with population normative data forindividual countries.• Illustrating the potential use of EQ-5D data in population health studies.• Providing a recommended format to present and analyse EQ-5Ddata collected from future surveys.
9

This booklet summarises this work and presents the population normsfor 15 countries, as well as results of some additional analyses ofpopulation health based on EQ-5D. The target audiences for thisbooklet are researchers using EQ-5D to collect data from patients ormembers of the general population and policy-makers using thecollected information in health care decision-making. Readerswishing to learn more are encouraged to contact the EuroQolBusiness Management ([email protected]).
EQ-5D
EQ-5D is a standardized health-related quality of life questionnairedeveloped by the EuroQol Group in order to provide a simple,generic measure of health for clinical and economic appraisal(EuroQol Group, 1990). Applicable to a wide range of healthconditions and treatments, it provides a simple descriptive profileand a single index value for health status that can be used in theclinical and economic evaluation of health care as well as inpopulation health surveys (Figure 1).
EQ-5D is designed for self-completion by respondents and is ideallysuited for use in postal surveys, in clinics, and in face-to-faceinterviews. It is cognitively undemanding, taking only a few minutes tocomplete. Instructions to respondents are included in the questionnaire.
EQ-5D essentially consists of 2 pages – the EQ-5D descriptivesystem (page 2) and the EQ VAS (page 3). The EQ-5D descriptivesystem comprises 5 dimensions: mobility, self-care, usual activities,pain/discomfort and anxiety/depression. Each dimension has 3levels: no problems, some problems, severe problems. Therespondent is asked to indicate his/her health state by ticking (orplacing a cross) in the box against the most appropriate statement ineach of the 5 dimensions. This decision results in a 1-digit numberexpressing the level selected for that dimension. The digits for 5dimensions can be combined in a 5-digit number describing therespondent’s health state. It should be noted that the numerals 1-3have no arithmetic properties and should not be used as a cardinal
10

score. This current 3-level, 5-dimensional format of EQ-5D willremain unchanged for the immediate future.
The EQ VAS records the respondent’s self-rated health on a vertical,20 cm visual analogue scale where the endpoints are labelled ‘Bestimaginable health state’ and ‘Worst imaginable health state’. Thisinformation can be used as a quantitative measure of health outcomeas judged by the individual respondents.
International EQ-5D archive of population surveys
The international EQ-5D database archive consists of EQ-5Dpopulation surveys collected in 15 countries. The database isstructured in a standardized format to facilitate comparativeresearch. The database currently includes observations on more than29,000 individuals. Countries with 1 or more population surveysinclude: Armenia, Belgium, Canada, Finland, Germany, Greece,Hungary, Japan, The Netherlands, New Zealand, Slovenia, Spain,Sweden, United Kingdom and Zimbabwe. For a more detailedaccount of the data, see Annex 1.
All of the surveys used a standardized version of EQ-5D. TheDutch, Swedish and Finnish versions were translated in 1987according to a ‘simultaneous’ process while the remaining versionswere translated according to the EuroQol Group’s translationprotocol – based on international guidelines. However, somedifferences between sampling and data collection methods shouldbe noted. Most importantly, some surveys covered the whole of thecountry, others only a specific part (such as prefectures, regions oreven city areas). Therefore, care should be exercised in generalizingdata outside the geographic location captured by the data collection. Surveys also differed in sample sizes and in the method of datacollection. Some of the surveys were postal while others wereperformed as face-to-face interviews. Since the questions asked inEQ-5D are very simple to answer, there is no reason to believe thatthere would be a significant impact on results other than differencesin response rates.
11

Figure 1: EQ-5D
By placing a tick in one box in each group below, please indicatewhich statements best describe your own health state today.
MobilityI have no problems in walking about �I have some problems in walking about �I am confined to bed �
Self-CareI have no problems with self-care �I have some problems washing or dressing myself �I am unable to wash or dress myself �
Usual Activities (e.g. work, study, housework, family or
leisure activities)I have no problems with performing my usual activities �I have some problems with performing my usual activities �I am unable to perform my usual activities �
Pain/DiscomfortI have no pain or discomfort �I have moderate pain or discomfort �I have extreme pain or discomfort �
Anxiety/DepressionI am not anxious or depressed �I am moderately anxious or depressed �I am extremely anxious or depressed �
12

To help people say how good or bad a healthstate is, we have drawn a scale (rather like athermometer) on which the best state youcan imagine is marked 100 and the worststate you can imagine is marked 0.
We would like you to indicate on this scalehow good or bad your own health is today,in your opinion. Please do this by drawing aline from the box below to whichever pointon the scale indicates how good or bad yourhealth state is today.
13
Your own
health state
today

Analyses of EQ-5D data presented in this booklet focused on 3 maincharacteristics of the population: age, gender, and education level.Age in most surveys was measured as a continuous variable (lifeyears), while gender was recorded as a categorical variable.Education level in each country was described on a 3-level scale,distinguishing low, medium, and high education level.
The structure of the booklet
The remaining part of this booklet presents results from 4 mainanalyses of the international EQ-5D database.
Chapter 2 presents population norms using EQ-5D for the 15countries. EQ-5D norms are reported for EQ VAS scores, and forreported problems on each of the 5 dimensions of the EQ-5Ddescriptive system, all classified by age and gender. These EQ-5Dnorms can be used as reference data to compare profiles for patientswith specific conditions and to assess the burden of disease. Thechapter also demonstrates that cross-country differences exist inEQ-5D results after the population data is standardized fordemographic differences.
Chapter 3 attempts to explain these cross-country differences bylooking at macro data on the economic and health systemcharacteristics of the 15 countries. Results show that it is the priorliving standards of a country that mostly explain cross-countrydifferences in self-reported health.
Chapter 4 specifically addresses the relationship between attainededucation level and self-reported health. After controlling for ageand gender characteristics, the analysis shows that people with loweducation are generally speaking more likely to report moreproblems in all the 5 dimensions of health-related quality of life,although this impact on the anxiety/depression dimension is smallerin most countries.
14

Chapter 5 illustrates how EQ-5D can help to identify healthinequalities at the level of individual health-related quality of lifedimensions. The analysis indicates that in the majority of countriespain/discomfort explains the largest part of overall inequalities inself-assessed health. This finding highlights the importance of painmanagement programmes in tackling health inequalities.
A fuller account of this work was presented at the EuroQol Group’s20th annual meeting in Bled, Slovenia in 2003 and can be accessed viathe EuroQol Group’s website. Researchers planning to conduct newpopulation surveys using EQ-5D should contact the EuroQolBusiness Management ([email protected]).
Chapter 2
Population norms and their uses
Mark Oppe, Frank de Charro
Introduction
The EuroQol Group is frequently asked to provide EQ-5Dpopulation reference data (sometimes called normative data) for aspecific country or international region. Such data can be used asreference data to compare profiles for patients with specificconditions with data for the average person in the general populationin a similar age and/or gender group. This comparison helps toidentify the burden of disease in a particular patient population.
The data used to prepare the population norm tables were mainlyelicited from data gathered as part of the European Union fundedEQ-net project and managed by the EuroQol Group BusinessManagement in Rotterdam (Sintonen et al, 2003; Weijnen et al,2003). Additional EQ-5D data from other countries have beenadded. Not all data used for each country is representative of thatcountry. Some studies have been conducted in specific geographicregions or other subgroups of the population as a whole. Thepopulation norms tables are presented in Annex 2.
Description of the tables
The tables can be used as reference data to compare profiles forpatients with specific conditions with data for the average person inthe general population in a similar age and/or gender group. Thetables contain information on the size of the study, EQ VAS ratingsand proportion of reported problems on each of the EQ-5Ddimensions.
16

Seven age groups were used to present the data: 18-29 yrs; 30-39yrs; 40-49 yrs; 50-59 yrs; 60-69 yrs; 70-79 yrs; 80+ yrs. Data arepresented separately for males and females and for both gendersgrouped together.
• Study size
The first part of each table contains information on the size of thesample on which the table was based, by age and gender.
• EQ VAS data
EQ-5D self-reported VAS data (EQ VAS) generates information onthe self-perceived overall health-related quality of life of the generalpopulation. Presented in the tables are the mean and standarddeviation of the EQ VAS ratings as well as the median and the 25th
and 75th percentile ratings.
• Data on the 5 dimensions
The tables can also be used if the objective is to compare theresponses on a specific EQ-5D dimension or the health profile basedon all 5 EQ-5D dimensions. The tables contain information on theproportion of the population reporting level 1 (no problems), level 2(some problems) and level 3 (extreme problems) per dimension, byage group and gender.
Using the population norms tables
Because the population norms data are presented by age and gender,there is no need for the sample to have the same age distribution asthe general population. Therefore the data that are presented in thetables have not been weighted for age or gender. This means thatinternational comparisons across several age groups should be madewith caution. It should be borne in mind that the demographic build-up by age and gender varies between countries, and that the samplesof the general population used to create the tables do not necessarily
17

follow that same distribution. However, international comparisonsof data contained in a single cell (i.e. 1 age and gender group) arevalid using non-weighted data.
EQ VAS
Using the mean in combination with the standard deviation enablescomparisons to be made using fairly straightforward statisticaltechniques. Individual responses on the EQ VAS can be comparedwith the mean EQ VAS rating from a table using z scores. The zscore is the difference between the individual score and thepopulation mean, expressed in units of standard deviation of thepopulation score. The z score can be obtained using the followingequation:
X = the individual responsez =
X – µµ = the population meanσ σ = the population standard deviation
If normally distributed, approximately 95% of a group’s scoreswill fall between plus and minus 2 standard deviations from themean. A z score of ± 2 is therefore considered to be an extremelyhigh or low score (Kind et al, 1999).
18
Example:Is an EQ VAS rating of 76 that is reported by a 35-year-old malefrom the Netherlands high or low compared to other men his agein the Netherlands? The mean and standard deviation for Dutchmen aged 30-39 are 81 and 15 respectively and so:
z = 76 – 81
= –0.3315
His score is therefore 0.33 standard deviations below the meanscore for Dutch men his age.

Using z scores assumes that the ratings are normally distributed.However, this is not always the case. The median EQ VAS ratings(with the 25th and 75th percentiles) have been included in the tablesto facilitate comparisons of data that are not normally distributed.This will require more complicated statistical techniques.
A two-tailed t-test can be used for testing whether a group mean andthe population mean are significantly different, but this also requiresa normal distribution of the data.
The mean EQ VAS data from the 15 countries was pooled and arepresented in figure 2. As can be seen, the mean EQ VAS ratingsdecrease with increasing age. Also, men of all age groups reportedhigher EQ VAS ratings than women. This difference between menand women was larger for old people than for young people.
19
50
60
70
80
90
100
18-29 30-39 40-49 50-59 60-69 70-79 80+
age (yrs)
EQ
VA
S Men
Women
Total
Figure 2 shows the mean EQ VAS ratings reported by men, women and both for 7 distinct age groups. The mean EQ
VAS ratings are seen to decrease with increasing age. Also, men of all age groups reported higher EQ VAS ratings
than women.
Figure 2: Mean population EQ VAS ratings

EQ-5D dimensions
As the data on the 5 EQ-5D dimensions is not continuous butordinal, the information is presented as the proportions of thepopulation reporting level 1 (no problems), level 2 (some problems)and level 3 (extreme problems) per dimension, by age group andgender. Because the number of people reporting severe problems isusually very small in general population surveys, the sum of theproportions of reported level 2 and level 3 problems is sometimesused. This essentially changes the 3-level EQ-5D dimensions into 2-level dimensions, with categories ‘no problems’ and ‘problems’.
20
0
10
20
30
40
50
60
70
Mobility Self care Usual act Pain/Disc Anx/Depr
18-39 yrs
40-59 yrs
60+ yrs
Figure 3 shows the sum of the proportion of reported level 2 and level 3 problems for each of the 5 EQ-5D
dimensions for 3 distinct age groups. Older people reported more problems with all dimensions but the effect of age
was strongest for mobility and weakest for anxiety/depression
Figure 3: Quality of life profile of the population (% reporting problem)

Figure 3 shows the sum of the proportion of reported level 2 andlevel 3 problems for each of the 5 EQ-5D dimensions for 3 distinctage groups. As can be seen from the figure, the proportion ofproblems increased with age on all dimensions. Problems withmobility increased the most with increasing age, whereas problemswith anxiety / depression the least. For every age group theproportion of problems with pain was higher than the proportion ofproblems on the other dimensions.
Cross-country comparison of self-assessed population health
Finally, this chapter illustrates how EQ-5D data can be used in across-country comparison of self-reported health. When aggregatemeasures of self-assessed health are to be compared betweencountries, it is necessary to adjust for potential differences in ageand gender. Table 1 presents mean EQ-5D data for 15 countrieswhere demographic characteristics were standardized based on aEuropean population structure (Eurostat, 1997). Note that the datapresented in table 1 do not represent the actual situation in eachcountry, but are based on the European age distribution. Because theage structure superimposed on the dataset was the same for eachcountry, comparisons between countries can be made.
As can be seen in table 1, Armenia reported the lowest EQ VASratings, followed by Hungary, while Sweden and the UnitedKingdom reported the highest EQ VAS ratings. The highestproportion of problems on the 5 EQ-5D dimensions was reported byArmenia, followed by Slovenia. Note that while Hungary reported alower mean EQ VAS than Slovenia, more problems were reported inSlovenia on the 5 EQ-5D dimensions. The same result was found atthe other end of the spectrum. Japan reported the lowest proportionof problems but average EQ VAS ratings, while Sweden reportedthe highest EQ VAS ratings and average proportions of problems.These results indicate that countries also differed in how theyanswered the more general EQ VAS question relative to how theyanswered the more specific questions on the EQ-5D dimensions.
21

Table 1: Mean EQ-5D results in 15 (standardized for demographic differences
between countries)
EQ VAS Mobility Self Care Usual Pain / Anxiety /
Activity Discomfort Depression
Armenia 66.61 0.26 0.13 0.28 0.64 0.52
Belgium 80.96 0.13 0.03 0.15 0.42 0.21
Canada 80.35 0.16 0.02 0.14 0.38 0.30
Finland 79.42 0.20 0.05 0.18 0.39 0.14
Germany 82.22 0.18 0.03 0.13 0.37 0.18
Greece 77.78 0.15 0.07 0.12 0.19 0.11
Hungary 71.86 0.18 0.06 0.14 0.38 0.34
Japan 77.71 0.07 0.02 0.05 0.19 0.08
Netherlands 81.36 0.04 0.03 0.15 0.31 0.17
New Zealand 81.35 0.17 0.04 0.18 0.37 0.20
Slovenia 75.84 0.31 0.14 0.34 0.48 0.37
Spain 76.47 0.12 0.02 0.10 0.28 0.16
Sweden 83.49 0.10 0.02 0.08 0.42 0.30
UK 83.44 0.16 0.04 0.15 0.31 0.20
Zimbabwe 76.14 0.20 0.07 0.18 0.41 0.40
The table gives an overview of the mean EQ VAS ratings and the proportions of reported problems on each of
the 5 EQ-5D dimensions. Data have been aggregated after age standardization based on a European population
structure, in order to make the results between the 15 countries comparable.

23
Chapter 3
Can we explain inter-country differencesin levels of health?
Irina Cleemput
Introduction
The rate of self-reported problems on the 5 dimensions of EQ-5D ishighly variable between countries. This was seen in EQ-5D datafrom 15 different countries. In this study, we examine whether thereis a pattern in the prevalence of problems reported in the differentcountries and whether these patterns can be explained by differencesin living standards and health care system performance. Alsodifferences in the EQ VAS ratings between countries are explored.In addition, we examine whether macro-economic variables arecorrelated with the prevalence of problems, and with EQ VASratings in different age groups across countries.
Methods
EQ-5D descriptive system and EQ VAS data from 15 differentcountries were used. Living standards were estimated by means ofGDP per capita and unemployment rate. Indicators for health caresystem performance were health expenditure per capita and healthexpenditure as a % of GDP, number of hospital beds per 1,000people and number of physicians per 1,000 people. The indicatorswere selected on the basis of a presumed or possible relationshipwith self-reported health. Data were obtained from the World HealthOrganization Statistical Information System (www.who.int) and theWorld Bank (www.worldbank.org).

GDP per capita was used as an indicator of each country’s wealth. Itwas assumed that poorer populations would have more healthproblems than richer populations. The relationship between self-reported health and health expenditure per capita and total healthexpenditure is a priori unclear because it depends on the causalrelationship, e.g. higher health care expenditure might be aconsequence of the fact that people are more ill or, on the contrary,the more health care is provided, the healthier the people will be andthe less problems they report.
Country-level prevalences of problems on each dimension of EQ-5D were corrected for age using a European reference population(Eurostat, 1997). Adjustment for differences in age distributionswas performed to avoid bias in the results due to the fact that somepopulations have a relatively high proportion of elderly people. Ageadjustment was performed by weighting the prevalence of self-reported problems in each age category by the proportion of peoplein that age category of the standard population.
For the analysis of the age-group-level prevalence of reportedproblems on the EQ-5D descriptive system and the EQ VAS, largerintervals were used in order to increase sample size for eachanalysis. Age groups were defined at 10-year intervals, with theexception of the first age category: 18-29, 30-39, 40-49, 50-59, 60-69, 70-79, 80+.
Countries were ranked based on mean self-assessed health results,and their living standards and health care system performancecharacteristics. For all correlation analyses, non-parametricSpearman rank correlations were calculated. A high rank correlationmeans that the ranking of countries on 1 variable (e.g. prevalence ofself-reported health problems) is similar to the ranking of anothervariable (e.g. GDP per capita). Multivariate analysis was notappropriate given the small number of countries and the problem ofmultiple testing. Parametric correlations were not appropriate giventhe small number of observations (15 countries) and the skewednature of the data.
24

Results and discussion
A negative correlation was observed between self-reported healthproblems on each EQ-5D dimension and GDP per capita. Thecorrelations between GDP per capita and problems on thepain/discomfort and anxiety/depression dimensions did not,however, reach statistical significance. Countries with higher GDPper capita reported significantly fewer problems with mobility andself-care. Also the correlation with the EQ VAS rating was highlysignificant (p<0.05). Populations with a higher GDP per capita hadhigher mean EQ VAS ratings.
25
3000020000100000
90
80
70
60
Zimbabwe
Armenia
UK Sweden
SpainSlovenia
NZNL
Japan
Hungary
Greece
Germany
FinlandCanada
Belgium
EQV
AS
GDP per capita
This figure shows the positive correlation between GDP per capita and EQ VAS. Given the problems with fully
standardizing the EQ VAS rating for Zimbabwe for age, Zimbabwe was considered to be an outlier.
Figure 4: Living standards and self-reported health in 15 countries

The positive relationship between living standards and self-reportedhealth is graphically presented in Figure 4. Zimbabwe was anoutlier, with a relatively small GDP per capita but mediocre meanEQ VAS score. None of the Zimbabwean respondents was 80 yearsof age or older, however, which may have influenced the results.The mean EQ VAS for Zimbabwe could not be fully standardizeddue to the absence of respondents who were 80 years or older. Asthis age group usually reports lower EQ VAS ratings the mean EQVAS for Zimbabwe was probably overestimated relative to the EQVAS ratings of other countries.
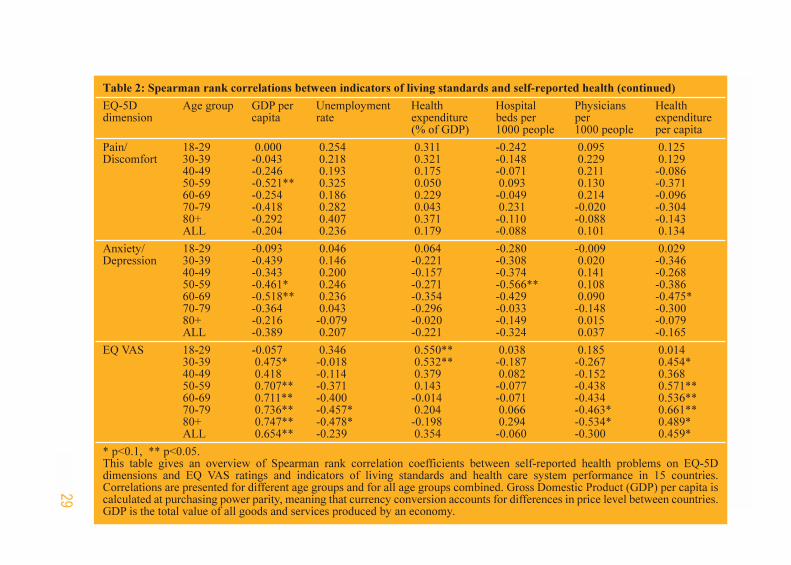
Regarding different age groups, it was observed that mostsignificant correlations between self-reported health problems andliving standards were observed in the 50-59 age group. An overviewof all correlation coefficients is given in Table 2.
In general, GDP per capita correlated well with problems onmobility and self-care in almost all age groups. Correlations withproblems with usual activities were mainly significant for the olderage groups. Also health expenditure per capita correlatedsignificantly with prevalence of mobility, self-care and usualactivity problems. The correlations were negative, which indicatesthat higher levels of wealth and higher levels of health expenditureper capita are associated with fewer self-reported problems on theseEQ-5D dimensions. The results on the EQ VAS indicated a similarrelationship. Except for the 18-29 and 40-49 age groups, thecorrelations between the GDP per capita and the EQ VAS andbetween the health expenditure per capita and the EQ VAS were allsignificant at a level of 10%. The strongest correlation was seen inthe 50+ age groups. A final observation is that unemployment ratecorrelated significantly with problems on mobility in all age groups.Interestingly, the EQ VAS ratings only correlated withunemployment rates in the 2 oldest age groups.
Significant correlations between self-reported problems and macro-economic variables were not always reflected in the correlationsbetween the EQ VAS and these variables in different age groups.
26

This suggests that self-reported health according to the EQ VAS isdetermined by other factors besides the 5 dimensions of EQ-5D.Cross-cultural differences may also explain part of the observations.Some populations may be more reluctant to give positive answers tothe questions in a survey than others. These aspects are not takeninto account in this study, but are worth examining in futureresearch. In conclusion, the analysis highlighted the important roleof a country’s living standards in determining the overall self-reported health of its general population.
27

28
Table 2: Spearman rank correlations between indicators of living standards and self-reported health
EQ-5D Age group GDP per Unemployment Health Hospital Physicians Health
dimension capita rate expenditure beds per per expenditure
(% of GDP) 1000 people 1000 people per capita
Mobility 18-29 -0.196 0.496* -0.068 -0.242 -0.057 -0.225
30-39 -0.511* 0.518** 0.029 -0.121 0.009 -0.400
40-49 -0.464* 0.454* 0.114 -0.016 0.000 -0.314
50-59 -0.718** 0.504* -0.007 0.005 0.176 -0.575**
60-69 -0.668** 0.618** 0.050 -0.044 0.040 -0.546**
70-79 -0.643** 0.464* -0.043 0.038 -0.031 -0.536**
80+ -0.658** 0.581** 0.227 -0.275 0.130 -0.497*
ALL -0.636** 0.539** 0.000 0.044 0.029 -0.429
Self-Care 18-29 -0.430 0.301 -0.491* 0.210 -0.310 -0.444*
30-39 -0.495* 0.483* 0.032 -0.190 0.191 -0.377
40-49 -0.679** 0.382 -0.129 0.132 0.145 -0.618**
50-59 -0.782** 0.393 -0.179 -0.110 0.313 -0.661**
60-69 -0.893** 0.486* -0.182 0.093 0.289 -0.771**
70-79 -0.676** 0.322 -0.045 0.267 0.325 -0.572**
80+ -0.629** 0.433 0.392 0.005 0.394 -0.389
ALL -0.793** 0.482* -0.100 0.088 0.273 -0.644**
Usual Activities 18-29 -0.064 0.239 0.064 0.008 -0.272 -0.014
30-39 -0.164 0.229 0.150 0.132 -0.048 -0.061
40-49 -0.425 0.211 -0.068 0.247 -0.055 -0.296
50-59 -0.664** 0.521** -0.014 0.209 -0.044 -0.600**
60-69 -0.696** 0.475* -0.100 0.049 -0.084 -0.614**
70-79 -0.571** 0.400 0.218 0.055 0.172 -0.414
80+ -0.420 0.323 0.275 0.055 0.037 -0.266
ALL -0.482* 0.404 0.000 0.198 -0.141 -0.301
29
Table 2: Spearman rank correlations between indicators of living standards and self-reported health (continued)
EQ-5D Age group GDP per Unemployment Health Hospital Physicians Health dimension capita rate expenditure beds per per expenditure
(% of GDP) 1000 people 1000 people per capita
Pain/ 18-29 0.000 0.254 0.311 -0.242 0.095 0.125Discomfort 30-39 -0.043 0.218 0.321 -0.148 0.229 0.129
40-49 -0.246 0.193 0.175 -0.071 0.211 -0.08650-59 -0.521** 0.325 0.050 0.093 0.130 -0.37160-69 -0.254 0.186 0.229 -0.049 0.214 -0.09670-79 -0.418 0.282 0.043 0.231 -0.020 -0.30480+ -0.292 0.407 0.371 -0.110 -0.088 -0.143ALL -0.204 0.236 0.179 -0.088 0.101 0.134
Anxiety/ 18-29 -0.093 0.046 0.064 -0.280 -0.009 0.029Depression 30-39 -0.439 0.146 -0.221 -0.308 0.020 -0.346
40-49 -0.343 0.200 -0.157 -0.374 0.141 -0.26850-59 -0.461* 0.246 -0.271 -0.566** 0.108 -0.38660-69 -0.518** 0.236 -0.354 -0.429 0.090 -0.475*70-79 -0.364 0.043 -0.296 -0.033 -0.148 -0.30080+ -0.216 -0.079 -0.020 -0.149 0.015 -0.079ALL -0.389 0.207 -0.221 -0.324 0.037 -0.165
EQ VAS 18-29 -0.057 0.346 0.550** 0.038 0.185 0.01430-39 0.475* -0.018 0.532** -0.187 -0.267 0.454*40-49 0.418 -0.114 0.379 0.082 -0.152 0.36850-59 0.707** -0.371 0.143 -0.077 -0.438 0.571**60-69 0.711** -0.400 -0.014 -0.071 -0.434 0.536**70-79 0.736** -0.457* 0.204 0.066 -0.463* 0.661**80+ 0.747** -0.478* -0.198 0.294 -0.534* 0.489*ALL 0.654** -0.239 0.354 -0.060 -0.300 0.459*
* p<0.1, ** p<0.05.This table gives an overview of Spearman rank correlation coefficients between self-reported health problems on EQ-5Ddimensions and EQ VAS ratings and indicators of living standards and health care system performance in 15 countries.Correlations are presented for different age groups and for all age groups combined. Gross Domestic Product (GDP) per capita iscalculated at purchasing power parity, meaning that currency conversion accounts for differences in price level between countries.GDP is the total value of all goods and services produced by an economy.

Chapter 4
Education and health
Matejka Rebolj
Introduction
The level of attained education represents the cultural component ofan individual’s socio-economic status, and is an indicator of livingcircumstances in the earlier part of one’s life. Education level isfairly stable over the life course. Later in life it shapes one’soccupation and expected income potential. Through thismechanism, its indirect link with health is stronger than its directeffect (Singh-Manoux et al, 2002).
Among the higher education groups, lower prevalence of health riskfactors has been observed. Given the existing health problems,individuals with a lower level of education experience greater ill-health (Eachus et al, 1999). Higher education can directly or throughits vehicle mechanisms (such as being able to afford domestic help,home appliances, reduced workload or part-time work) enable extracoping pathways that are not available to individuals with lowerlevels of attained education (Simon, 2002). Furthermore,observational studies among people suffering from chronicconditions revealed that, through better self-management andcompliance, better treatment results can be achieved among thebetter-educated (Katz, 1998; Karter et al, 2000; Goldman andSmith, 2002).
The aim of this chapter is to illustrate how higher levels of attainededucation are associated with self-reported health as measured byEQ-5D in the general populations of 15 countries, once the effectsof age and gender have been taken into account.
30

Methods
In the analysis, we compared self-reported health of individualswith different education levels. Self-reported health was measuredon the 5 dimensions of EQ-5D. Those reporting some or severeproblems on an EQ-5D dimension were merged into 1 category, asonly a small fraction of respondents among the general populationreported severe problems. Attained highest education level wasclassified into 3 groups: low (i.e. primary), medium (i.e. secondary)and high (i.e. university degree). To give a special focus to the mostdisadvantaged group, the latter 2 education levels wereamalgamated into a joint category in this analysis.
To estimate the relationship between health and education level, wecalculated logistic regression age- and gender-adjusted odds ratiosfor reporting problems on a particular EQ-5D dimension. Oddsratios in this analysis were a measure for differences betweenprevalences of reporting health problems by the less- educatedgroup compared to the better-educated group. An odds ratio higherthan 1 indicated that the less-educated group reported more healthproblems than the better-educated group.
Results
The education odds ratios, adjusted for age and gender, arepresented by country and by EQ-5D dimension in Table 3. Thereference population group was men aged 18-29 years with mediumor high education level. The odds ratios presented for demographicand education categories should be interpreted as relative to thisreference group.
Demographic characteristics.Each additional decade of life added between about 30% to morethan 100% to the odds of self-reporting problems on mobility, self-care or usual activities, and approximately 30% to almost 90% topain/discomfort. The highest age-related odds ratios in thesedimensions were found in Armenia, Canada, Finland, Greece,
31

Spain, New Zealand and Slovenia. The results indicate that age wasthe most important factor influencing the reporting of health-relatedquality of life problems, irrespective of the country or EQ-5Ddimension. The exception was the burden of anxiety/depression,which seemed to be spread uniformly over the entire age span.
Gender did not seem to play a very important additional role indetermining self-reported health within the EQ-5D framework.Where these odds were significant, they usually favoured men –except in the Dutch and the Swedish samples. Among thedimensions, exceptions were pain/discomfort and anxiety/dep-ression, with typical significant gender odds ratios falling in therange of 1.3-2.3. Greece showed an outlier pattern with high odds ofover 4 in the self-care dimension.
Education level.In most countries (with the exception of Germany, Japan, Spain, TheNetherlands, and New Zealand), attaining at least the medium levelof education translated into significantly lower age- and gender-adjusted odds of experiencing problems on any dimension. Wherethey were significant, these odds ratios were highest for indicators ofphysical functional disability. Among countries, a 2 - 3-folddifference between having a low level of education, and having atleast medium level of education can be observed. For the mobilitydimension the range of estimated odds ratios was 1.5-4.3, in self-care1.5-3.9, for performing usual activities 1,4-3,3, and for experiencingpain/discomfort 1.2-2.9. The country with (uniformly) highest oddsratios (and prevalences) on the first 3 dimensions was Slovenia.
In general, the odds ratios for anxiety/depression were lower (rangeof 1.5-2.2), although they reach the level of 4.1 in Greece. Amongthe countries analysed, Greece was also the highest on the odds ratiofor pain/discomfort (2.9). It is interesting to note that in Japan andthe Netherlands, where education does not seem to play such animportant role within the EQ-5D framework, the odds ratio wassignificant only for the anxiety/depression dimension. Countrieswith statistically significant, yet in comparison with other countries
32
in our selection relatively low age- and gender-adjusted educationodds ratios were Armenia, Canada, Finland, UK, Sweden andZimbabwe.
Discussion
This study shows that educational disparities in self-reported healthare a phenomenon that can be observed across many differentcultures. However, this relationship seems to possess some country-specific traits that deserve the attention of policy makers.
It seems that age is the most important overall predictor ofexperiencing problems on mobility, self-care, usual activities, andpain/discomfort in all countries. Gender does play an additionalrole, although its role is much smaller. Having attained at least amedium level of education, adjusted for age and gender, translatedinto lower odds of reporting problems on any dimension of EQ-5Din almost all surveyed countries. These odds ratios differed greatlyby dimension and country. The differences in estimated odds ratiosbetween education levels were 2 - 3-fold in mobility, self-care, usualactivities and pain/discomfort, and slightly lower in anxiety/dep-ression.
A typical profile of an individual reporting at least moderateproblem on anxiety/depression was a woman with low education,while on all other dimensions it was an older less-educated person.For the Netherlands, New Zealand, Germany, Japan and Spain, ourdata indicated that there may be educational inequalities in self-assessed health favouring the better-educated groups but results didnot reach statistical significance. Though EQ-5D data have yet to befurther explored in this respect, a large body of literature (Kunst etal, 1995; Mackenbach et al, 1997; Regidor et al, 1999; Borrell et al,1999; Dalstra et al, 2002; Blakely et al, 2002; Regidor et al; 2003;von dem Knesebeck et al, 2003; Nishi et al, 2004) has shown thateducation is an important determinant of health indicators in thesecountries as well.
33

Our data could not detect any clear and easily interpretable groupingof countries with similar age- and gender-adjusted educationaldisparities within the EQ-5D self-report health framework. None ofthe countries surveyed, however, seem to have avoided educationalinequalities in self-reported health. Although it would be toosimplistic to advise a policy that was only directed towardsincreasing the general education level in the general population,such a policy could potentially lower educational inequalitiesamong current younger generations, and would also help reinforcesome positive links between education and health, such as improvedhealth-related behaviour. It would seem though that, given theobserved differences in country profiles in EQ-5D self-reportedhealth, good national policies to tackle educational inequalitiesshould also identify the country-specific health mechanisms that aretriggered by education. Further research using self-assessed healthmeasures, such as EQ-5D, in conjunction with other relevant health,psychology, socio-economic studies can be useful in monitoringhealth inequalities internationally.
34

35
Table 3: Odds ratios (95% confidence intervals) for reporting problems on EQ-
5D dimensions in 15 countries
Country Dimension Gender Age Education
Armenia Mobility 1.08 (0.86-1.35) 1.81** (1.70-1.94) 1.46** (1.17-1.81)
(Gharagebakyan Self-care 0.75* (0.56-0.99) 2.02** (1.85-2.20) 1.56** (1.17-2.07)
et al, 2003) Usual activ. 0.94 (0.76-1.17) 1.63** (1.53-1.73) 1.42** (1.16-1.74)
Pain/Disc. 1.81** (1.46-2.23) 1.87** (1.74-2.00) 1.22* (1.01-1.48)
Anx./Depr. 1.42** (1.17-1.72) 1.36** (1.29-1.43) 0.87 (0.73-1.03)
Belgium Mobility 0.70* (0.50-0.98) 1.61** (1.44-1.80) 2.64** (1.85-3.76)
(Cleemput et al, Self-care 0.77 (0.43-1.38) 1.92** (1.55-2.38) 2.85** (1.47-5.50)
2004) Usual activ. 0.91 (0.67-1.24) 1.42** (1.28-1.57) 1.20 (0.85-1.68)
Pain/Disc. 1.33* (1.06-1.68) 1.28** (1.18-1.38) 1.46** (1.12-1.91)
Anx./Depr. 0.94 (0.72-1.24) 1.04 (0.95-1.14) 1.72** (1.26-2.34)
Canada Mobility 1.47** (1.10-1.96) 1.90** (1.72-2.10) 1.54** (1.12-2.12)
(Johnson et al, Self-care 1.28 (0.73-2.23) 2.41** (1.91-3.04) 1.11 (0.62-1.98)
2000) Usual activ. 1.14 (0.85-1.54) 1.73** (1.57-1.91) 1.76** (1.28-2.43)
Pain/Disc. 1.49** (1.19-1.88) 1.40** (1.30-1.50) 1.59** (1.20-2.13)
Anx./Depr. 1.28* (1.01-1.63) 0.99 (0.92-1.07) 2.00** (1.47-2.64)
Finland Mobility 1.08 (0.87-1.32) 2.02** (1.89-2.16) 1.47** (1.16-1.85)
(Ohinmaa et al, Self-care 1.06 (0.77-1.45) 2.30** (2.02-2.63) 1.49* (1.08-2.07)
1996) Usual activ. 0.96 (0.78-1.19) 1.79** (1.68-1.92) 1.71** (1.36-2.16)
Pain/Disc. 1.08 (0.91-1.30) 1.56** (1.49-1.64) 1.68** (1.35-2.09)
Anx./Depr. 1.20 (0.95-1.50) 1.08* (1.02-1.15) 1.48** (1.14-1.92)
Germany Mobility 0.77 (0.42-1.40) 1.37** (1.14-1.65) 2.54* (1.01-6.45)
(Claes et al, Self-care 0.97 (0.18-5.31) 1.90* (1.03-3.49) 1.41 (0.14-14.1)
1999) Usual activ. 0.92 (0.43-1.97) 1.22 (0.96-1.53) 1.26 (0.34-4.71)
Pain/Disc. 1.07 (0.67-1.70) 1.40** (1.21-1.61) 0.85 (0.35-2.11)
Anx./Depr. 1.76 (0.91-3.40) 1.14 (0.94-1.39) 1.17 (0.36-3.82)
Greece Mobility 1.26 (0.67-2.38) 1.97** (1.57-2.48) 2.09* (1.03-4.22)
(Yfantopoulous, Self-care 4.43** (1.62-12.12) 2.61** (1.80-3.78) 1.49 (0.53-4.25)
1999) Usual activ. 1.78 (0.85-3.71) 2.44** (1.83-3.26) 2.17 (0.94-5.05)
Pain/Disc. 1.79* (1.02-3.14) 1.66** (1.37-2.01) 2.94** (1.56-5.52)
Anx./Depr. 1.25 (0.65-2.39) 1.13 (0.91-1.41) 4.07** (1.84-8.98)
Hungary Mobility 1.17 (0.99-1.37) 1.80** (1.71-1.89) 2.00** (1.70-2.35)
(Szende & Self-care 0.84 (0.66-1.07) 1.82** (1.68-1.97) 2.63** (2.02-3.42)
Nemeth, 2003) Usual activ. 1.02 (0.86-2.12) 1.65** (1.56-1.74) 2.35** (1.96-2.80)
Pain/Disc. 1.44** (1.28-1.63) 1.49** (1.43-1.55) 1.96** (1.72-2.24)
Anx./Depr. 1.70** (1.51-1.92) 1.24** (1.19-1.28) 2.00** (1.75-2.28)
Japan Mobility 0.97 (0.50-1.86) 2.16** (1.66-2.82) 1.83 (0.93-3.63)
(Tsuchiyaet al, Self-care 1.89 (0.49-7.33) 1.60* (1.02-2.50) 3.77 (1.00-14.25)
2002) Usual activ. 1.21 (0.56-2.58) 1.86** (1.40-2.48) 2.02 (0.93-4.41)
Pain/Disc. 2.30** (1.47-3.59) 1.53** (1.32-1.77) 1.36 (0.85-2.20)
Anx./Depr. 1.46 (0.80-2.65) 1.13 (0.93-1.37) 2.20* (1.17-4.13)

Table 3: Odds ratios (95% confidence intervals) for reporting problems on EQ-
5D dimensions in 15 countries (continued)
Country Dimension Gender Age Education
The Mobility 0.42** (0.24-0.75) 2.19** (1.76-2.74) 1.32 (0.75-2.34)
Netherlands Self-care 0.81 (0.42-1.56) 2.06** (1.60-2.65) 0.96 (0.49-1.89)
(Essink-Bot et al, Usual activ. 0.63* (0.44-0.91) 1.39** (1.25-1.54) 1.20 (0.82-1.76)
1993) Pain/Disc. 0.73* (0.54-0.98) 1.38** (1.27-1.50) 0.99 (0.72-1.37)
Anx./Depr. 0.48** (0.33-0.68) 1.03 (0.94-1.14) 1.51* (1.03-2.22)
New Mobility 1.04 (0.77-1.40) 1.77** (1.60-1.95) 1.22 (0.89-1.67)
Zealand Self-care 0.77 (0.44-1.32) 1.71** (1.43-2.05) 1.25 (0.71-2.20)
(Devlin et al, Usual activ. 1.10 (0.83-1.47) 1.59** (1.45-1.75) 1.06 (0.78-1.44)
2000) Pain/Disc. 1.08 (0.85-1.37) 1.47** (1.36-1.58) 1.26 (0.97-1.65)
Anx./Depr. 1.43* (1.08-1.89) 1.12* (1.03-1.21) 1.26 (0.93-1.70)
Slovenia Mobility 0.70 (0.48-1.03) 1.98** (1.75-2.24) 4.30** (2.54-7.28)
(Prevolnik Rupel Self-care 0.86 (0.54-1.38) 1.62** (1.40-1.86) 3.93** (2.33-6.64)
& Rebolj, 2001) Usual activ. 0.93 (0.66-1.31) 1.49** (1.34-1.65) 3.29** (2.04-5.30)
Pain/Disc. 1.05 (0.77-1.45) 1.54** (1.39-1.71) 2.24** (1.35-3.70)
Anx./Depr. 1.13 (0.83-1.54) 1.17** (1.06-1.28) 1.64* (1.05-2.57)
Spain Mobility 1.04 (0.74-1.47) 1.83** (1.63-2.06) 1.51 (0.93-2.46)
(Gaminde et al, Self-care 1.02 (0.54-1.93) 1.96** (1.55-2.50) 2.77 (0.80-9.62)
2001) Usual activ. 0.98 (0.67-1.44) 1.61** (1.42-1.82) 1.43 (0.84-2.44)
Pain/Disc. 1.29* (1.01-1.67) 1.33** (1.22-1.44) 1.22 (0.89-1.68)
Anx./Depr. 2.25** (1.56-3.24) 1.17** (1.05-1.31) 1.40 (0.90-2.19)
Sweden Mobility 0.79 (0.60-1.04) 1.82** (1.65-2.01) 1.81** (1.33-2.47)
(Burström et al, Self-care 1.38 (0.76-2.49) 1.68** (1.36-2.07) 1.06 (0.54-2.07)
2001) Usual activ. 0.67* (0.50-0.92) 1.26** (1.13-1.39) 1.64** (1.16-2.32)
Pain/Disc. 0.77** (0.65-0.91) 1.26** (1.19-1.34) 1.90** (1.57-2.31)
Anx./Depr. 0.63** (0.53-0.75) 0.97 (0.91-1.03) 1.32* (1.07-1.62)
UK Mobility 0.91 (0.75-1.10) 1.63** (1.54-1.73) 1.71** (1.39-2.09)
(Kind, 1998) Self-care 0.81 (0.57-1.14) 1.41** (1.27-1.57) 1.90** (1.29-1.79)
Usual activ. 0.88 (0.73-1.07) 1.38** (1.31-1.47) 1.59** (1.29-1.95)
Pain/Disc. 1.02 (0.88-1.20) 1.39** (1.33-1.46) 1.78** (1.51-2.09)
Anx./Depr. 1.35** (1.14-1.61) 1.11** (1.06-1.17) 1.54** (1.28-1.86)
Zimbabwe Mobility 1.75** (1.23-2.50) 1.52** (1.33-1.75) 2.20** (1.57-3.09)
(Jelsma, 2003) Self-care 0.76 (0.46-1.25) 1.37** (1.10-1.70) 1.24 (0.69-2.23)
Usual activ. 1.21 (0.89-1.65) 1.43** (1.25-1.63) 1.80** (1.30-2.49)
Pain/Disc. 1.34** (1.10-1.65) 1.33** (1.20-1.46) 1.58** (1.25-1.99)
Anx./Depr. 1.19 (0.97-1.46) 1.28** (1.16-1.41) 1.49** (1.18-1.88)
*P<0.05, ** P<0.01.This table gives odds ratios for reporting problems on EQ-5D dimensions for gender (1 if female, 0 if male), age (indecades of life with age groups: 18-29, 30-39, 40-49, 50-59, 60-69, 70-79, 80+), and education categories (1 if loweducation, 0 if medium or high) by country and EQ-5D dimension (1 if at least moderate problems, 0 if noproblems). The reference population group is men aged 18-29 with medium or high education. All odds ratios areadjusted for the other 2 factors. For example, a statistically significant education odds ratio of 1,50 in mobilityreveals that in that country the odds of reporting at least moderate problems on mobility are 50% higher among thelow educated than among those with at least medium education, where age and gender have been adjusted for.

Chapter 5
Measuring health inequalities
Agota Szende
Introduction
While the improvement of the overall level of health of thepopulation continues to be a high priority in public health care, thereis a growing concern about the distribution of health within thepopulation (WHO, 1998; CEC, 2001). While the previous chaptersmainly provided evidence on the level of health in generalpopulations of different countries, this chapter illustrates how theEQ-5D can help to measure inequalities in self-reported health bysocio-demographic characteristics and at the level of quality of lifedimensions within each country.
Methods
The method used is the concentration index, which is a single indexmeasure of relative inequalities (Wagstaff et al, 1991; Kakwani et al,1997). The overall health concentration index measures the meandifference in health between individuals as a proportion of theaverage health of the total population. This index can also beinterpreted as a measure of how unequal the distribution of health isin the population. Health inequality is measured on a scale between0 (meaning complete equality in health) and 1 (meaning completeinequality in health). This overall index can be decomposed toidentify the impact of various factors, such as socio-demographiccharacteristics, in order to determine how much each factorcontributes to inequalities (Wagstaff and Doorslaer, 2002).
37

In the current analysis, overall health was measured by the EQ VAS.Decomposition analysis was performed to determine inequalities bysocio-demographic factors and by the level of each of the EQ-5Ddimensions. Results of the analysis of 15 countries are shown inTable 4.
Results
Results of this study suggest that the level of inequalities in self-assessed health and the health inequality profile by EQ-5Ddimension differed substantially across countries. In terms of theoverall level of inequalities, Belgium presented the lowest level ofrelative inequalities (0.0933) while Armenia had the highest relativeinequalities (0.1949).
Substantial differences were uncovered in the extent to which thesocio-demographic and the morbidity model explained overallinequalities in self-assessed health. Socio-demographic factorsexplained the smallest proportion of health inequalities in Japan(1.5%), The Netherlands (1.6%), and New Zealand (2.2%). Thesocio-demographic model was most powerful in Armenia (34.7%),Slovenia (27.8%), and Hungary (24.3%). The 5 dimensions of EQ-5D were generally powerful in explaining overall self-assessedhealth. The explained proportion of the index varied from 15.3% inJapan and 17.7% in Zimbabwe to 51.7% in Greece and 53.3% inSlovenia.
Within the socio-demographic model, gender played the smallestrole in explaining overall inequalities in self-assessed health, whileage was the most important determinant. Education played aconsistent role in explaining overall inequalities in health in eachcountry, but variation was observed whether it was medium or higheducational level that was more important.
The health inequality profile according to the EQ-5D dimensionsshowed different patterns across countries. Pain/discomfort was the
38

highest contributor to overall inequalities in self-assessed health inmost (n=7) countries, with a particularly high relative share in Spain(54.3%) and Japan (49.8%). Problems with usual activitiescontributed most to inequalities in 5 countries with the highestrelative share in The Netherlands (40.9%) and Canada (39.9%). InBelgium and Slovenia, problems with pain/discomfort and usualactivities contributed equally to inequalities. Greece showed anoutlier pattern with mobility being the main contributor (39.3%).The relative share of anxiety/depression was highest in Zimbabwe(31.8%), while New Zealand had the highest relative share of self-care (16.8%) in explaining overall inequalities in self-assessedhealth.
Discussion
This study is one of the first analyses measuring overall inequalitiesin self-assessed health, and the first multi-country study that uses aninternationally validated health-related quality of life instrument inthe decomposition analysis of health inequalities. The studydemonstrates that EQ-5D is a powerful tool in the analysis ofinequalities in self-assessed health.
Results showed that significant inequalities in overall self-assessedhealth exist in each country involved in the study. Thedecomposition analysis of the socio-demographic model indicatedthat gender played a minimal role while age played an importantrole. Education level played some role in explaining overallinequalities in health in most countries, although the degree ofimpact varied across countries. Generally speaking, education-related inequalities in health were only about one third as powerfulas the impact of age. It could be argued that this share of educationin explaining health inequalities is still important, since whiledecline of health with age is often regarded as a natural course oflife, differences in education level between people are oftenregarded by society as unfair.
39

The analysis of the overall health inequality index alongside the EQ-5D dimensions offered a special insight into the health inequalityprofile of the study populations. Results revealed that, in themajority of countries, pain/discomfort explained the highest relativeshare of inequalities in overall self-assessed health. The finding thatpain/discomfort had a high share in explaining overall healthinequalities is unique. One potential explanation for the lack ofsimilar investigations elsewhere is that pain has so far not beenregarded as a distinct morbidity indicator, but has been consideredas a consequence or co-morbidity of various health conditions.However, recent literature and clinical practice reveals that a changein paradigm in the approach to pain is underway. In the UK, forexample it has been revealed that pain affects over 25% of thepopulation. A wide variation was observed in the availability of painservices from hospital to hospital and from region to region withinthe UK. Survey data also showed that only 7% of chronic painsufferers had access to appropriate specialist care in a year withmost visiting their GPs, and 11% suffering in silence. (CSAG, 2000;NOP 2002; Foster, 2003). These results reveal the potential role ofpain management in tackling inequalities.
The analysis also showed that the health inequality profile can bespecific to the population of each country or geographical areas. Forthis reason, health policy-makers should consider this specifichealth inequality profile when developing strategies to addressinequalities in a particular country. For example, it might beworthwhile to consider why problems with mobility play such animportant role in the Greek population. If the explanation is relatedto geographical conditions (e.g. many hills, islands) along withinadequate transportation, then it can be further informative forlocal policy-makers to know how they can promote more equity byproviding support for those in most need (e.g. support for transportfor disabled people or providing home treatment, etc).
40

Finally, it has to be noted that the above results should not be usedfor ranking countries based on health inequality among theirpopulations. Each country should consider the results within thelight of their own social and health care context. Studies like this cangive an insight into the nature of health inequalities, which in turncan help policy-makers to improve their own strategies inpromoting greater equity.
41

Table 4: Health inequality profile of 15 countries
Inequality Socio-demographic factors Quality of life factorsindex Explained Gender Age Education Education Explained Mobility Self-care Usual Pain / Anxiety /
share medium high share activity Disc. Depr.
Armenia 0.1949* 34.7% 1.4% 94.9% 0.3% 3.7% 51.5% 15.5% 13.0% 19.2% 45.6% 6.7%
Belgium 0.0933* 7.9% 1.7% 57.9% 11.1% 29.3% 44.3% 10.6% 3.3% 34.7% 34.4% 17.0%
Canada 0.1062* 7.7% 0.1% 84.7% 7.9% 7.2% 38.8% 20.6% 5.7% 39.9% 22.4% 11.5%
Finland 0.1115* 18.7% 2.2% 79.0% 4.8% 14.0% 45.7% 14.2% 10.6% 37.3% 25.0% 12.9%
Germany 0.1131* 18.8% -0.6% 57.5% 12.6% 30.5% 48.9% 22.6% 7.5% 37.3% 24.0% 8.7%
Greece 0.1223* 16.8% 1.4% 77.4% 13.5% 7.7% 51.7% 39.3% 2.3% 25.8% 22.2% 10.4%
Hungary 0.1555* 24.3% 1.1% 79.0% 11.2% 8.7% 43.4% 19.1% 6.4% 14.1% 39.8% 20.5%
Japan 0.1117* 1.5% 8.9% 38.5% 12.3% 40.3% 15.3% 6.0% -2.1% 18.4% 49.8% 27.9%
Netherlands 0.1041* 1.6% 0.5% 81.4% 16.8% 1.2% 39.4% 9.5% 0.6% 40.9% 36.8% 12.2%
New Zealand 0.1013* 2.2% 3.6% 71.0% -4.1% 29.5% 36.0% 19.6% 16.8% 27.9% 17.1% 18.7%
Slovenia 0.1359* 27.8% 0.9% 55.2% 18.8% 25.1% 53.3% 22.7% 14.0% 27.6% 27.5% 8.2%
Spain 0.1332* 9.0% 2.9% 70.4% 2.8% 23.9% 39.7% 12.8% 0.9% 17.7% 54.3% 14.3%
Sweden 0.1025* 4.2% 1.5% 37.3% 9.1% 52.1% 43.7% 9.0% -0.3% 17.7% 43.2% 30.4%
UK 0.1090* 9.0% 0.1% 64.5% 10.3% 25.2% 33.2% 19.1% 4.3% 27.7% 30.1% 18.8%
Zimbabwe 0.1180* 2.9% 11.7% 44.6% 29.0% 14.6% 17.7% 13.6% 6.4% 12.3% 35.9% 31.8%
* P<0.01
This table summarizes the health inequality profile of 15 countries. The first column gives the value of the overall self-assessed health inequality index (based on EQ
VAS). Results of the decomposition analysis along the socio-demographic and the morbidity factors are presented separately. The first column in each of the two model
results refers to the share of inequalities that the model variables explained. (For example, in Armenia 34,7% of the inequality index was explained by the socio-
demographic model and 51,5% of the inequality index was explained by the quality of life model.) The rest of the columns give the share of each factor in the explained
part of overall inequalities. (For example, in Armenia pain/discomfort alone was responsible for 45,6% of the explained part of the health inequality index.)

43
References
Badia X, Roset M, Herdman M, Kind P (2001). A comparison ofUnited Kingdom and Spanish general population time trade-offvalues for EQ-5D health states. Medical Decision Making 21 (1): 7-16.
Bjork S, Norinder A (1999). The weighting exercise for the Swedishversion of the EuroQol. Health Econ 8 (2):117-26.
Blakely T, Woodward A, Pearce N, Salmond C, Kiro C, Davis P(2002). Socio-economic factors and mortality among 25-64 yearolds followed from 1991 to 1994: the New Zealand Census-Mortality Study. N Z Med J 115: 93-97.
Borrell C, Regidor E, Arias LC, Navarro P, Puigpinós R,Domínguez V, Plasència A (1999). Inequalities in mortalityaccording to educational level in two large Southern Europeancities. Int J Epidemiol 28: 58-63.
Burström K, Johannesson M, Diderichsen F (2001). Swedishpopulation health-related quality of life results using the EQ-5D.Quality of Life Research 10 (7): 621-635.
Claes C, Greiner W, Uber A, Schulenburg J-M. Graf v.d (1999). Aninterview-based comparison of the TTO and VAS values given toEuroQol states of health by the general German population. In:Greiner W, J-M. Graf v.d. Schulenburg, Piercy J. (Editors).(EuroQol) Plenary Meeting. Discussion Papers. Hannover Uni-Verlag Witte: 13-39.

44
Cleemput I, Kind P, Kesteloot K (2004). Re-scaling socialpreference data: implications for modelling. In: Kind P, Macran S.(Editors). 19th Plenary Meeting of the EuroQol Group. DiscussionPapers. Centre for Health Economics, University of York: 13-123.
Commission of the European Communities (2001). Decision of theEuropean Parliament and of the Council adopting a programme ofCommunity action in the field of public health (2001- 2006)Brussels.
CSAG. Services for patients with pain (2000). CSAG SupportTeam, The Unit of Health-Care Epidemiology, Institute of HealthSciences, Oxford.
Dalstra JAA, Kunst AE, Geurts JJM, Frenken FJM, Mackenbach JP(2002). Trends in socioeconomic health inequalities in theNetherlands, 1981-1999. J Epidemiol Community Health 56: 927-934.
Devlin NJ, Hansen P, Kind P, Williams A (2000). The health statepreferences and logical inconsistencies of New Zealanders: A tale oftwo tariffs. York Centre for Health Economics, UK and Universityof Otago New Zealand. Discussion paper no 180.
Eachus J, Chan P, Pearson N, Propper C, Smith GD (1999). Anadditional dimension to health inequalities: disease severity andsocio-economic position. J Epidemiol Community Health 53: 603-611.
Essink-Bot ML, Stouthard M, Bonsel GJ (1993). Generalizability ofvaluations on health states collected with the EuroQolquestionnaire. Health Economics 2: 237-246.

45
EuroQol Group (1990). EuroQol – A new facility for themeasurement of health-related quality of life. Health Policy 16: 199-208.
Eurostat. Statistiques démographiques 1987 (1997). Office despublications officielles des communautés européennes, Luxem-bourg.
Foster D (2003). Adult chronic pain management services in theUK. Pain Society.
Gaminde I, Cabasés J (1996). Measuring valuations for health statesamong the general population in Navarra (Spain). In: Badia X,Herdman M, Segura A. (Editors). EuroQol Plenary Meeting.Discussion Papers. Barcelona. Institut Universitari de Salut Publicade Catalunya: 113-123.
Gaminde I, Roset M (2001). Quality adjusted life expectancy. In:Cabasés J, Gaminde I. (Editors). 17th Plenary Meeting of theEuroQol Group. Discussion Papers. Universidad Pública deNavarra: 173-183.
Gharagebakyan G, Ghukasyan H, Williams A, Szende A (2003).Social inequalities in self-reported health: Is Armenia different fromSlovenia? In: Rupel VP (Eds). 20th Plenary Meeting of the EuroQolGroup. Discussion Papers. Republic of Slovenia, Ministry ofHealth: 79-87.
Goldman DP, Smith JP (2002). Can patient self-management helpexplain the SES health gradient? Proceedings of the NationalAcademy of Sciences of the USA, 99: 10929-10934.
Jelsma J, Hansen K, Weerdt W de, Cock P, Kind P. (2003). How doZimbabweans value health states? Population Health Metrics. 1:11.

46
Johnson JA, Pickard AS (2000). Comparison of the EQ-5D and SF-12 health surveys in a general population survey in Alberta, Canada.Med Care 38 (1): 115-21.
Kakwani NC, Wagstaff A, Doorslaer EV (1997). Socioeconomicinequalities in health: measurement, computation and statisticalinference. Journal of Econometrics 77: 87-103.
Karter AJ, Ferrara A, Darbinian JA, Ackerson LM, Selby JV (2000).Self-Monitoring of Blood Glucose: Language and financial barriersin a managed care population with diabetes. Diabetes Care 23: 477-483.
Katz PP (1998). Education and self-care activities among personswith rheumatoid arthritis. Soc Sci Med 46: 1057-1066.
Kind P, Dolan P, Gudex C, Williams A (1998). Variations inpopulation health status: results from a United Kingdom nationalquestionnaire survey Bmj 316 (7133): 736-41.
Kind P, Hardman G, Macran S (1999). UK Population norms forEQ-5D.York Centre for Health Economics Discussion Paper 172.
Knesebeck O von dem, Lüschen G, Cockerham WC, Siegrist J(2003). Socioeconomic status and health among the aged in theUnited States and Germany: A comparative cross-sectional study.Soc Sci Med 57: 1643-1652.
Kunst AE, Geurts JJM, Berg J van de (1995). International variationin socio-economic inequalities in self reported health. J EpidemiolCommunity Health 49: 117-23.
Mackenbach JP, Kunst AE, Cavelaars AEJM, Groenhof F, GeurtsJJM (1997). EU Working Group on Socioeconomic Inequalities inHealth. Socioeconomic inequalities in morbidity and mortality inwestern Europe. The Lancet 349: 1655-1659.

47
Nishi N, Makino K, Fukuda H, Tatara K (2004). Effects of socio-economic indicators on coronary risk factors, self-rated health andpsychological well-being among urban Japanese civil servants. SocSci Med 58: 1159-1170.
NOP Omnibus Survey. Pain. 4-6 October 2002. NOP World.
Ohinmaa A, Eija H, Sintonen H (1996). Modelling EuroQol valuesof Finnish adult population. In: Badia X, Herdman M, Segura A.(Editors). EuroQol Plenary Meeting. Discussion Papers. Barcelona.Institut Universitari de Salut Publica de Catalunya: 67-76.
Prevolnik Rupel V, Rebolj M (2001). The Slovenian VAS tariffbased on valuations of EQ-5D health states from the generalpopulation. In: Cabasés J, Gaminde I. (Editors). 17th PlenaryMeeting of the EuroQol Group. Discussion Papers. UniversidadPública de Navarra: 11-23.
Regidor E, Barrio G, Fuente L de la, Domingo A, Rodriguez C,Alonso J (1999). Association between educational level and healthrelated quality of life in Spanish adults. J Epidemiol CommunityHealth 53: 75-82.
Regidor E, Calle ME, Navarro P, Domínguez V (2003). The size ofeducational differences in mortality from specific causes of death inmen and women. Eur J Epidemiol 18: 395-400.
Schulenburg J.-M. G. v. d, Claes C, Greiner W, Uber A (1996). TheGerman version of the EuroQol quality of life questionnaire. In:Badia X, Herdman M, Segura A. (Editors). EuroQol PlenaryMeeting. Discussion Papers. Barcelona. Institut Universitari deSalut Publica de Catalunya: 135-161.
Simon JG (2002). How is your health in general? Qualitative andquantitative studies on self-assessed health and socioeconomicdifferences herein [thesis]. Rotterdam, The Netherlands: ErasmusUniversity Rotterdam.

48
Singh-Manoux A, Clarke P, Marmot M (2002). Multiple measuresof socio-economic position and psychosocial health: proximal anddistal measures. Int J Epidemiol 31: 1192-1199
Sintonen H, Weijnen T, Nieuwenhuizen M, Oppe S, Badia X,Busschbach J, Greiner W, Krabbe P, Ohinmaa A, Roset M, de CharroF (2003). Comparison of EQ-5D VAS valuations: analysis ofbackground variables. In: Brooks R, Rabin R, de Charro F. (Editors).The measurement and valuation of health status using EQ-5D: AEuropean perspective. Kluwer Academic Publishers:81-103.Szende A, Nemeth R. (2003). Health-related quality of life of theHungarian population. Orv Hetil 144 (34): 1667-74.
Tsuchiya A, Ikeda S., Ikegami N, Nishimura S, Sakai I, Fukuda T,Hamashima C, Hisashige A, Tamura M (2002). Estimating an EQ-5D population value set: the case of Japan. Health Econ 11 (4): 341-53.
Wagstaff A, Doorslaer EV (2002). Overall vs. SocioeconomicHealth Inequality: A Measurement Framework and Two EmpiricalIllustrations. Equity Project.
Wagstaff A, Paci P, Doorslaer EV (1991). On the measurement ofinequalities in health. Social Science and Medicine 33: 545-557.
Weijnen T, Nieuwenhuizen M, Ohinmaa A, de Charro F (2003).Construction of the EQ-net VAS and TTO databases. In: Brooks R,Rabin R, de Charro F. (Editors). The measurement and valuation ofhealth status using EQ-5D: A European perspective. KluwerAcademic Publishers:55-81.
World Health Organization (1998). Health21 - health for all in the21st century. Copenhagen: WHO.

Yfantopoulos Y (1999). Quality of life measurment and healthproduction in Greece. In: Greiner W, J-M. Graf v.d. Schulenburg,Piercy J. (Editors). (EuroQol) Plenary Meeting. Discussion Papers.Hannover Uni-Verlag Witte: 100-114.


Annex 1
EQ-5D population surveys
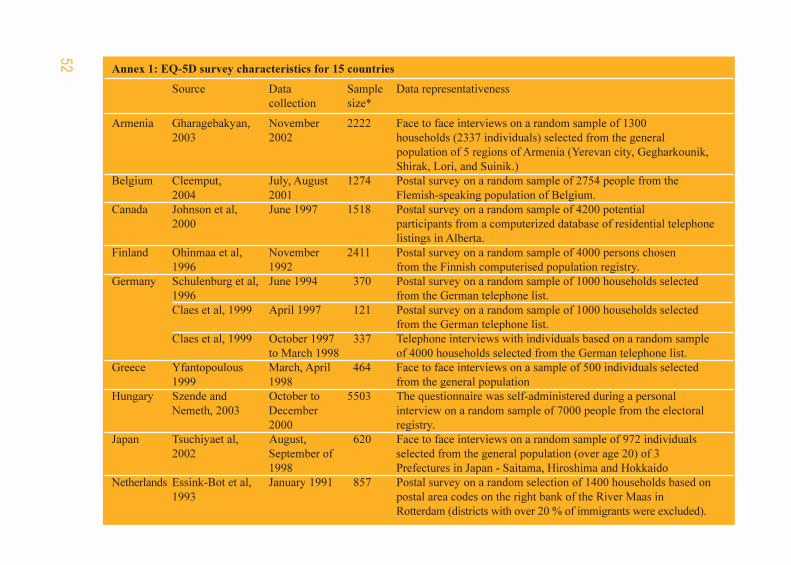
Annex 1: EQ-5D survey characteristics for 15 countries
Source Data Sample Data representativeness
collection size*
Armenia Gharagebakyan, November 2222 Face to face interviews on a random sample of 1300
2003 2002 households (2337 individuals) selected from the general
population of 5 regions of Armenia (Yerevan city, Gegharkounik,
Shirak, Lori, and Suinik.)
Belgium Cleemput, July, August 1274 Postal survey on a random sample of 2754 people from the
2004 2001 Flemish-speaking population of Belgium.
Canada Johnson et al, June 1997 1518 Postal survey on a random sample of 4200 potential
2000 participants from a computerized database of residential telephone
listings in Alberta.
Finland Ohinmaa et al, November 2411 Postal survey on a random sample of 4000 persons chosen
1996 1992 from the Finnish computerised population registry.
Germany Schulenburg et al, June 1994 370 Postal survey on a random sample of 1000 households selected
1996 from the German telephone list.
Claes et al, 1999 April 1997 121 Postal survey on a random sample of 1000 households selected
from the German telephone list.
Claes et al, 1999 October 1997 337 Telephone interviews with individuals based on a random sample
to March 1998 of 4000 households selected from the German telephone list.
Greece Yfantopoulous March, April 464 Face to face interviews on a sample of 500 individuals selected
1999 1998 from the general population
Hungary Szende and October to 5503 The questionnaire was self-administered during a personal
Nemeth, 2003 December interview on a random sample of 7000 people from the electoral
2000 registry.
Japan Tsuchiyaet al, August, 620 Face to face interviews on a random sample of 972 individuals
2002 September of selected from the general population (over age 20) of 3
1998 Prefectures in Japan - Saitama, Hiroshima and Hokkaido
Netherlands Essink-Bot et al, January 1991 857 Postal survey on a random selection of 1400 households based on
1993 postal area codes on the right bank of the River Maas in
Rotterdam (districts with over 20 % of immigrants were excluded).
52

53
Annex 1: EQ-5D survey characteristics for 15 countries (continued)
Source Data Sample Data representativeness
collection size*
New Devlin et al, January 1999 1328 Postal survey on a random sample of 3000 New Zealanders
Zealand 2000 selected from the electoral roll.
Slovenia Prevolnik Rupel April, May 742 Postal survey on a randomized sample of 3000 people selected
and Rebolj 2001 2000 from the general population in collaboration with the Statistical
Office of Slovenia
Spain Badia et al, October 1996 to 973 Face to face interviews on a random sample of 1930 individuals
2001 November 1997 selected from the general population of a primary health care
district on the outskirts of Barcelona, covering 4 different
socioeconomic areas.
Gaminde et al, September 300 Face to face interviews on a sample of 300 individuals selected
1996 1995 from the general population of Navarra.
Gaminde et al, December 1999 1468 Face to face interviews on a random sample of 1508 individuals
2001 to January 2000 selected from the general population of Navarra.
Sweden Björk et al, April 1994 534 Postal survey on a randomized sample of 1000 Swedish citizens
1999 selected from the general population from an address register.
Burström et al, During 1998 3069 Postal survey with the EQ-5D descriptive system - the Stockholm
2001 County public health survey - on a representative sample of the
(Stockholm) population aged 20-88 years.
United Kind, 1998 August, 3395 Face to face interviews on a random sample of 5324 individuals
Kingdom November 1993 selected from the general population (based on the Postcode
Address file) from England, Scotland and Wales.
Zimbabwe Jelsma, 2003 March 2000 2350 2488 residents from Glenview (a high density suburb of Harare)
were selected for interview. As compared to the 1992 census
Harare Profile, males were underrepresented and there were more
young and better educated respondents than in the general
population.
* These are the sample sizes used in this booklet


Annex 2
EQ-5D population norms data
56
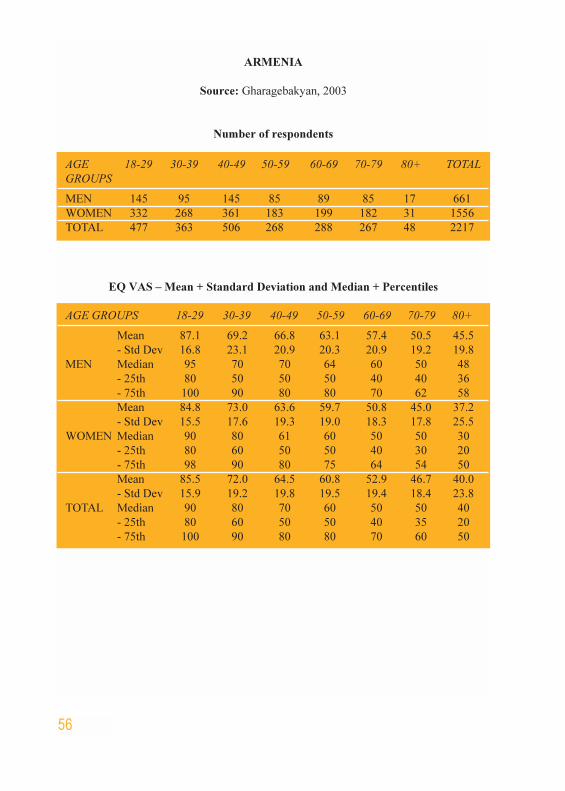
ARMENIA
Source: Gharagebakyan, 2003
Number of respondents
AGE 18-29 30-39 40-49 50-59 60-69 70-79 80+ TOTAL
GROUPS
MEN 145 95 145 85 89 85 17 661
WOMEN 332 268 361 183 199 182 31 1556
TOTAL 477 363 506 268 288 267 48 2217
EQ VAS – Mean + Standard Deviation and Median + Percentiles
AGE GROUPS 18-29 30-39 40-49 50-59 60-69 70-79 80+
Mean 87.1 69.2 66.8 63.1 57.4 50.5 45.5
- Std Dev 16.8 23.1 20.9 20.3 20.9 19.2 19.8
MEN Median 95 70 70 64 60 50 48
- 25th 80 50 50 50 40 40 36
- 75th 100 90 80 80 70 62 58
Mean 84.8 73.0 63.6 59.7 50.8 45.0 37.2
- Std Dev 15.5 17.6 19.3 19.0 18.3 17.8 25.5
WOMEN Median 90 80 61 60 50 50 30
- 25th 80 60 50 50 40 30 20
- 75th 98 90 80 75 64 54 50
Mean 85.5 72.0 64.5 60.8 52.9 46.7 40.0
- Std Dev 15.9 19.2 19.8 19.5 19.4 18.4 23.8
TOTAL Median 90 80 70 60 50 50 40
- 25th 80 60 50 50 40 35 20
- 75th 100 90 80 80 70 60 50

57
ARMENIA
Cont.
MOBILITY – Percentage (%) reporting each level of problem
SELF-CARE – Percentage (%) reporting each level of problem
AGE GROUPS 18-29 30-39 40-49 50-59 60-69 70-79 80+
Level 1 92.4 77.9 81.4 72.9 55.1 44.7 35.3
MEN Level 2 6.2 20.0 18.6 24.7 42.7 51.8 58.8
Level 3 1.4 2.1 0.0 2.4 2.2 3.5 5.9
Level 1 94.6 86.6 78.9 72.1 50.3 33.0 19.4
WOMEN Level 2 5.4 13.4 21.1 26.8 48.2 61.5 67.7
Level 3 0.0 0.0 0.0 1.1 1.5 5.5 12.9
Level 1 93.9 84.3 79.6 72.4 51.7 36.7 25.0
TOTAL Level 2 5.7 15.2 20.4 26.1 46.5 58.4 64.6
Level 3 0.4 0.6 0.0 1.5 1.7 4.9 10.4
AGE GROUPS 18-29 30-39 40-49 50-59 60-69 70-79 80+
Level 1 94.5 88.4 91.7 87.1 71.9 57.6 52.9
MEN Level 2 4.1 10.5 6.9 11.8 25.8 35.3 35.3
Level 3 1.4 1.1 1.4 1.2 2.2 7.1 11.8
Level 1 98.5 95.9 93.4 94.0 79.9 50.5 22.6
WOMEN Level 2 1.5 3.7 6.1 4.4 17.6 41.2 54.8
Level 3 0.0 0.4 0.6 1.6 2.5 8.2 22.6
Level 1 97.3 93.9 92.9 91.8 77.4 52.8 33.3
TOTAL Level 2 2.3 5.5 6.3 6.7 20.1 39.3 47.9
Level 3 0.4 0.6 0.8 1.5 2.4 7.9 18.8

58
ARMENIA
Cont.
USUAL ACTIVITY – Percentage (%) reporting each level of problem
AGE GROUPS 18-29 30-39 40-49 50-59 60-69 70-79 80+
Level 1 86.2 73.7 75.2 70.6 51.7 41.2 41.2
MEN Level 2 11.7 22.1 21.4 25.9 39.3 47.1 52.9
Level 3 2.1 4.2 3.4 3.5 9.0 11.8 5.9
Level 1 93.1 79.9 74.0 73.6 51.5 33.5 25.8
WOMEN Level 2 6.3 19.4 24.4 24.7 44.4 52.2 48.4
Level 3 0.6 0.7 1.7 1.6 4.0 14.3 25.8
Level 1 91.0 78.2 74.3 72.7 51.6 36.0 31.3
TOTAL Level 2 8.0 20.1 23.5 25.1 42.9 50.6 50.0
Level 3 1.0 1.7 2.2 2.2 5.6 13.5 18.8
PAIN / DISCOMFORT – Percentage (%) reporting each level of problem
AGE GROUPS 18-29 30-39 40-49 50-59 60-69 70-79 80+
Level 1 77.9 45.3 42.1 35.3 16.9 15.3 11.8
MEN Level 2 17.2 43.2 45.5 50.6 60.7 56.5 64.7
Level 3 4.8 11.6 12.4 14.1 22.5 28.2 23.5
Level 1 65.1 41.4 27.4 23.0 6.5 7.1 9.7
WOMEN Level 2 32.2 54.1 62.6 63.4 68.3 62.1 51.6
Level 3 2.7 4.5 10.0 13.7 25.1 30.8 38.7
Level 1 69.0 42.4 31.6 26.9 9.7 9.7 10.4
TOTAL Level 2 27.7 51.2 57.7 59.3 66.0 60.3 56.3
Level 3 3.4 6.3 10.7 13.8 24.3 30.0 33.3

59
ARMENIA
Cont.
ANXIETY / DEPRESSION – Percentage (%) reporting each level of problem
AGE GROUPS 18-29 30-39 40-49 50-59 60-69 70-79 80+
Level 1 71.5 50.0 51.7 50.6 40.2 35.3 47.1
MEN Level 2 25.7 40.4 37.2 40.0 41.4 47.1 35.3
Level 3 2.8 9.6 11.0 9.4 18.4 17.6 17.6
Level 1 66.7 50.6 40.2 38.3 26.9 28.2 35.5
WOMEN Level 2 31.2 42.6 50.0 48.6 54.8 43.1 35.5
Level 3 2.1 6.8 9.8 13.1 18.3 28.7 29.0
Level 1 68.1 50.4 43.5 42.2 31.0 30.5 39.6
TOTAL Level 2 29.5 42.1 46.3 45.9 50.7 44.4 35.4
Level 3 2.3 7.5 10.1 11.9 18.3 25.2 25.0

60
BELGIUM
Source: Cleemput, 2004
Number of respondents
AGE 18-29 30-39 40-49 50-59 60-69 70-79 80+ TOTAL
GROUPS
MEN 55 120 124 95 87 80 41 602
WOMEN 64 169 147 118 97 58 19 672
TOTAL 119 289 271 213 184 138 60 1274
EQ VAS – Mean + Standard Deviation and Median + Percentiles
AGE GROUPS 18-29 30-39 40-49 50-59 60-69 70-79 80+
Mean 85.0 83.7 82.0 79.8 77.3 71.4 73.0
- Std Dev 8.7 12.4 13.1 13.9 14.2 16.0 14.8
MEN Median 87 85 85 80 80 75 70
- 25th 80 79 75 70 70 64 65
- 75th 90 90 90 90 89 81 80
Mean 84.9 81.6 82.7 80.1 80.0 73.3 68.6
- Std Dev 12.0 13.7 13.2 14.7 14.4 18.5 18.5
WOMEN Median 90 85 85 80 80 75 77
- 25th 80 75 75 75 70 69 57
- 75th 91 90 90 90 90 84 80
Mean 84.9 82.5 82.4 79.9 78.7 72.2 71.8
- Std Dev 10.5 13.2 13.1 14.3 14.3 17.1 15.8
TOTAL Median 88 85 85 80 80 75 70
- 25th 80 75 75 75 70 68 64
- 75th 90 90 90 90 90 84 80

61
BELGIUM
Cont.
MOBILITY – Percentage (%) reporting each level of problem
SELF-CARE – Percentage (%) reporting each level of problem
AGE GROUPS 18-29 30-39 40-49 50-59 60-69 70-79 80+
Level 1 96.4 98.3 88.7 77.9 73.8 55.3 55.0
MEN Level 2 3.6 1.7 11.3 22.1 26.2 44.7 45.0
Level 3 0.0 0.0 0.0 0.0 0.0 0.0 0.0
Level 1 95.2 94.1 94.6 86.3 76.6 70.7 47.4
WOMEN Level 2 4.8 5.9 5.4 13.7 23.4 24.1 52.6
Level 3 0.0 0.0 0.0 0.0 0.0 5.2 0.0
Level 1 95.8 95.8 91.9 82.5 75.3 61.9 52.5
TOTAL Level 2 4.2 4.2 8.1 17.5 24.7 35.8 47.5
Level 3 0.0 0.0 0.0 0.0 0.0 2.2 0.0
AGE GROUPS 18-29 30-39 40-49 50-59 60-69 70-79 80+
Level 1 100.0 100.0 98.4 95.8 96.4 84.2 72.5
MEN Level 2 0.0 0.0 1.6 4.2 3.6 10.5 27.5
Level 3 0.0 0.0 0.0 0.0 0.0 5.3 0.0
Level 1 100.0 98.2 97.9 97.4 96.8 86.2 83.3
WOMEN Level 2 0.0 1.8 2.1 2.6 2.1 8.6 11.1
Level 3 0.0 0.0 0.0 0.0 1.1 5.2 5.6
Level 1 100.0 99.0 98.1 96.7 96.6 85.1 75.9
TOTAL Level 2 0.0 1.0 1.9 3.3 2.8 9.7 22.4
Level 3 0.0 0.0 0.0 0.0 0.6 5.2 1.7

62
BELGIUM
Cont.
USUAL ACTIVITY – Percentage (%) reporting each level of problem
AGE GROUPS 18-29 30-39 40-49 50-59 60-69 70-79 80+
Level 1 94.5 92.5 87.0 81.1 84.3 61.6 50.0
MEN Level 2 5.5 7.5 13.0 18.9 15.7 32.9 50.0
Level 3 0.0 0.0 0.0 0.0 0.0 5.5 0.0
Level 1 90.6 85.6 91.2 83.9 79.4 74.1 57.9
WOMEN Level 2 9.4 13.2 7.5 14.4 19.6 19.0 36.8
Level 3 0.0 1.2 1.4 1.7 1.0 6.9 5.3
Level 1 92.4 88.5 89.3 82.6 81.7 67.2 52.5
TOTAL Level 2 7.6 10.8 10.0 16.4 17.8 26.7 45.8
Level 3 0.0 0.7 0.7 0.9 0.6 6.1 1.7
PAIN / DISCOMFORT – Percentage (%) reporting each level of problem
AGE GROUPS 18-29 30-39 40-49 50-59 60-69 70-79 80+
Level 1 69.1 70.0 65.3 53.7 46.4 32.9 45.0
MEN Level 2 30.9 30.0 33.1 44.2 51.2 57.9 55.0
Level 3 0.0 0.0 1.6 2.1 2.4 9.2 0.0
Level 1 77.8 55.6 57.1 55.9 26.8 39.7 38.9
WOMEN Level 2 22.2 42.6 42.2 40.7 68.0 58.6 44.4
Level 3 0.0 1.8 0.7 3.4 5.2 1.7 16.7
Level 1 73.7 61.6 60.9 54.9 35.9 35.8 43.1
TOTAL Level 2 26.3 37.4 38.0 42.3 60.2 58.2 51.7
Level 3 0.0 1.0 1.1 2.8 3.9 6.0 5.2

63
BELGIUM
Cont.
ANXIETY / DEPRESSION – Percentage (%) reporting each level of problem
AGE GROUPS 18-29 30-39 40-49 50-59 60-69 70-79 80+
Level 1 78.2 84.2 83.1 69.5 81.0 76.3 60.0
MEN Level 2 20.0 14.2 16.9 30.5 17.9 22.4 40.0
Level 3 1.8 1.7 0.0 0.0 1.2 1.3 0.0
Level 1 87.3 81.1 74.8 80.3 74.2 81.0 82.4
WOMEN Level 2 12.7 18.9 23.8 15.4 24.7 19.0 11.8
Level 3 0.0 0.0 1.4 4.3 1.0 0.0 5.9
Level 1 83.1 82.4 78.6 75.5 77.3 78.4 66.7
TOTAL Level 2 16.1 17.0 20.7 22.2 21.5 20.9 31.6
Level 3 0.8 0.7 0.7 2.4 1.1 0.7 1.8

64
AGE 18-29 30-39 40-49 50-59 60-69 70-79 80+ TOTAL
GROUPS
MEN 44 169 232 199 175 145 45 1009
WOMEN 52 86 108 66 65 78 53 508
TOTAL 96 255 340 265 240 223 98 1517
CANADA
Source: Johnson et al, 2000
Number of respondents
EQ VAS – Mean + Standard Deviation and Median + Percentiles
AGE GROUPS 18-29 30-39 40-49 50-59 60-69 70-79 80+
Mean 82.1 83.4 81.2 81.1 77.3 71.9 64.3
- Std Dev 10.9 10.4 13.7 15.5 17.2 17.9 21.5
MEN Median 85 85 85 85 80 75 63
- 25th 80 80 75 75 70 64 50
- 75th 90 90 90 93 90 85 82
Mean 84.1 83.2 81.2 79.2 78.1 73.9 65.8
- Std Dev 11.7 12.4 14.2 14.8 16.2 18.1 17.5
WOMEN Median 85 85 80 80 80 75 70
- 25th 79 75 75 75 70 64 50
- 75th 90 90 90 89 90 90 80
Mean 83.2 83.3 81.2 80.6 77.5 72.6 65.1
- Std Dev 11.3 11.1 13.8 15.3 16.9 17.9 19.4
TOTAL Median 85 85 83 85 80 75 65
- 25th 80 80 75 75 70 64 50
- 75th 90 90 90 90 90 85 80

65
CANADA
Cont.
MOBILITY – Percentage (%) reporting each level of problem
SELF-CARE – Percentage (%) reporting each level of problem
AGE GROUPS 18-29 30-39 40-49 50-59 60-69 70-79 80+
Level 1 93.2 94.6 90.5 83.4 74.3 56.9 38.6
MEN Level 2 6.8 5.4 9.5 16.1 25.7 43.1 59.1
Level 3 0.0 0.0 0.0 0.5 0.0 0.0 2.3
Level 1 98.0 95.3 87.0 76.9 64.1 50.6 25.5
WOMEN Level 2 2.0 4.7 13.0 23.1 35.9 48.1 72.5
Level 3 0.0 0.0 0.0 0.0 0.0 1.3 2.0
Level 1 95.8 94.9 89.4 81.8 71.5 54.8 31.6
TOTAL Level 2 4.2 5.1 10.6 17.8 28.5 44.8 66.3
Level 3 0.0 0.0 0.0 0.4 0.0 0.5 2.1
AGE GROUPS 18-29 30-39 40-49 50-59 60-69 70-79 80+
Level 1 100.0 100.0 98.3 98.0 97.6 92.9 73.8
MEN Level 2 0.0 0.0 1.7 1.0 1.8 6.4 23.8
Level 3 0.0 0.0 0.0 1.0 0.6 0.7 2.4
Level 1 100.0 97.7 99.1 100.0 98.4 89.6 70.0
WOMEN Level 2 0.0 2.3 0.9 0.0 1.6 9.1 26.0
Level 3 0.0 0.0 0.0 0.0 0.0 1.3 4.0
Level 1 100.0 99.2 98.5 98.5 97.9 91.7 71.7
TOTAL Level 2 0.0 0.8 1.5 0.8 1.7 7.3 25.0
Level 3 0.0 0.0 0.0 0.8 0.4 0.9 3.3

66
CANADA
Cont.
USUAL ACTIVITY – Percentage (%) reporting each level of problem
AGE GROUPS 18-29 30-39 40-49 50-59 60-69 70-79 80+
Level 1 93.2 95.2 91.3 84.8 77.1 60.8 40.9
MEN Level 2 6.8 4.8 8.3 14.1 19.4 33.6 47.7
Level 3 0.0 0.0 0.4 1.0 3.5 5.6 11.4
Level 1 96.1 94.2 88.9 83.1 73.4 60.3 46.0
WOMEN Level 2 3.9 4.7 9.3 12.3 21.9 34.2 52.0
Level 3 0.0 1.2 1.9 4.6 4.7 5.5 2.0
Level 1 94.7 94.9 90.5 84.4 76.1 60.6 43.6
TOTAL Level 2 5.3 4.7 8.6 13.7 20.1 33.8 50.0
Level 3 0.0 0.4 0.9 1.9 3.8 5.6 6.4
PAIN / DISCOMFORT – Percentage (%) reporting each level of problem
AGE GROUPS 18-29 30-39 40-49 50-59 60-69 70-79 80+
Level 1 79.5 74.4 67.5 59.8 50.6 39.4 31.8
MEN Level 2 18.2 24.4 31.2 38.7 47.6 55.6 63.6
Level 3 2.3 1.2 1.3 1.5 1.8 4.9 4.5
Level 1 74.5 70.9 54.6 46.8 42.9 39.0 19.2
WOMEN Level 2 25.5 27.9 39.8 45.2 54.0 54.5 75.0
Level 3 0.0 1.2 5.6 8.1 3.2 6.5 5.8
Level 1 76.8 73.2 63.4 56.7 48.5 39.3 25.0
TOTAL Level 2 22.1 25.6 33.9 40.2 49.4 55.3 69.8
Level 3 1.1 1.2 2.7 3.1 2.1 5.5 5.2

67
CANADA
Cont.
ANXIETY / DEPRESSION – Percentage (%) reporting each level of problem
AGE GROUPS 18-29 30-39 40-49 50-59 60-69 70-79 80+
Level 1 68.2 79.2 73.2 72.2 75.7 64.8 70.7
MEN Level 2 27.3 20.2 24.2 27.3 24.3 35.2 29.3
Level 3 4.5 0.6 2.6 0.5 0.0 0.0 0.0
Level 1 68.0 75.3 63.0 64.1 71.0 76.3 58.8
WOMEN Level 2 32.0 23.5 36.1 35.9 29.0 22.4 41.2
Level 3 0.0 1.2 0.9 0.0 0.0 1.3 0.0
Level 1 68.1 77.9 69.9 70.2 74.5 68.8 64.1
TOTAL Level 2 29.8 21.3 28.0 29.4 25.5 30.7 35.9
Level 3 2.1 0.8 2.1 0.4 0.0 0.5 0.0

68
FINLAND
Source: Ohinmaa et al, 1996
Number of respondents
AGE 18-29 30-39 40-49 50-59 60-69 70-79 80+ TOTAL
GROUPS
MEN 209 165 161 120 241 201 66 1163
WOMEN 256 190 175 123 202 212 90 1248
TOTAL 465 355 336 243 443 413 156 2411
EQ VAS – Mean + Standard Deviation and Median + Percentiles
AGE GROUPS 18-29 30-39 40-49 50-59 60-69 70-79 80+
Mean 85.1 84.0 82.3 74.7 69.0 65.2 62.3
- Std Dev 11.7 11.6 15.0 17.6 19.5 21.0 23.7
MEN Median 89 85 85 80 70 70 61
- 25th 80 80 79 68 60 50 50
- 75th 95 92 92 90 80 80 80
Mean 87.0 87.3 82.3 78.2 70.3 67.5 56.6
- Std Dev 12.2 10.8 17.8 15.8 19.1 20.6 23.1
WOMEN Median 90 90 86 80 75 70 55
- 25th 80 80 80 70 60 50 40
- 75th 95 95 95 90 82 85 79
Mean 86.2 85.7 82.3 76.5 69.6 66.4 58.9
- Std Dev 12.0 11.3 16.5 16.8 19.4 20.8 23.4
TOTAL Median 90 90 85 80 72 70 60
- 25th 80 80 79 70 60 50 40
- 75th 95 95 94 90 80 81 80

69
FINLAND
Cont.
MOBILITY – Percentage (%) reporting each level of problem
SELF-CARE – Percentage (%) reporting each level of problem
AGE GROUPS 18-29 30-39 40-49 50-59 60-69 70-79 80+
Level 1 96.6 89.6 90.1 73.1 56.9 44.6 42.4
MEN Level 2 3.4 9.8 9.9 26.9 43.1 54.4 56.1
Level 3 0.0 0.6 0.0 0.0 0.0 1.0 1.5
Level 1 96.5 95.8 86.8 76.4 55.7 42.9 18.9
WOMEN Level 2 3.1 4.2 12.6 23.6 44.3 55.7 80.0
Level 3 0.4 0.0 0.6 0.0 0.0 1.4 1.1
Level 1 96.5 92.9 88.4 74.8 56.4 43.7 28.8
TOTAL Level 2 3.3 6.8 11.3 25.2 43.6 55.1 69.9
Level 3 0.2 0.3 0.3 0.0 0.0 1.2 1.3
AGE GROUPS 18-29 30-39 40-49 50-59 60-69 70-79 80+
Level 1 99.0 99.4 98.8 94.1 90.0 83.5 66.2
MEN Level 2 1.0 0.0 1.3 5.9 9.2 14.9 30.8
Level 3 0.0 0.6 0.0 0.0 0.8 1.5 3.1
Level 1 99.6 98.9 97.7 95.9 93.0 83.6 51.7
WOMEN Level 2 0.4 1.1 1.1 4.1 7.0 14.5 42.5
Level 3 0.0 0.0 1.1 0.0 0.0 1.9 5.7
Level 1 99.3 99.1 98.2 95.0 91.3 83.5 57.9
TOTAL Level 2 0.7 0.6 1.2 5.0 8.2 14.7 37.5
Level 3 0.0 0.3 0.6 0.0 0.5 1.7 4.6

70
FINLAND
Cont.
USUAL ACTIVITY – Percentage (%) reporting each level of problem
AGE GROUPS 18-29 30-39 40-49 50-59 60-69 70-79 80+
Level 1 95.2 90.2 91.9 71.7 65.4 54.9 43.3
MEN Level 2 4.8 8.6 6.2 23.3 31.6 40.4 51.7
Level 3 0.0 1.2 1.9 5.0 3.0 4.7 5.0
Level 1 95.7 94.7 87.4 82.8 66.7 55.2 28.2
WOMEN Level 2 3.9 4.7 10.9 17.2 29.8 39.9 58.8
Level 3 0.4 0.5 1.7 0.0 3.5 4.9 12.9
Level 1 95.5 92.6 89.6 77.3 66.0 55.1 34.5
TOTAL Level 2 4.3 6.5 8.6 20.2 30.8 40.2 55.9
Level 3 0.2 0.8 1.8 2.5 3.2 4.8 9.7
PAIN / DISCOMFORT – Percentage (%) reporting each level of problem
AGE GROUPS 18-29 30-39 40-49 50-59 60-69 70-79 80+
Level 1 79.2 75.8 65.6 48.7 42.3 26.3 32.3
MEN Level 2 20.3 23.6 33.8 49.6 56.5 70.6 63.1
Level 3 0.5 0.6 0.6 1.7 1.3 3.1 4.6
Level 1 82.3 75.3 60.0 46.3 35.0 31.9 19.1
WOMEN Level 2 17.3 24.2 36.6 51.2 62.5 65.2 68.5
Level 3 0.4 0.5 3.4 2.5 2.5 2.9 12.4
Level 1 80.9 75.5 62.7 47.5 39.0 29.2 24.7
TOTAL Level 2 18.7 23.9 35.2 50.4 59.2 67.8 66.2
Level 3 0.4 0.6 2.1 2.1 1.8 3.0 9.1

71
FINLAND
Cont.
ANXIETY / DEPRESSION – Percentage (%) reporting each level of problem
AGE GROUPS 18-29 30-39 40-49 50-59 60-69 70-79 80+
Level 1 87.0 85.3 88.8 82.2 88.6 86.8 81.5
MEN Level 2 12.6 13.5 11.3 15.3 10.5 12.7 12.3
Level 3 0.5 1.2 0.0 2.5 0.8 0.5 6.2
Level 1 91.8 86.2 81.7 88.5 81.5 81.9 71.6
WOMEN Level 2 8.2 13.8 16.6 11.5 17.5 17.6 25.0
Level 3 0.0 0.0 1.7 0.0 1.0 0.5 3.4
Level 1 89.6 85.8 85.1 85.4 85.4 84.3 75.8
TOTAL Level 2 10.2 13.6 14.0 13.3 13.7 15.2 19.6
Level 3 0.2 0.6 0.9 1.3 0.9 0.5 4.6

72
GERMANY
Source: Schulenburg et al, 1996; Claes et al, 1999; Claes et al, 1999
Tables are based on pooled data from three studies
Number of respondents
AGE 18-29 30-39 40-49 50-59 60-69 70-79 80+ TOTAL
GROUPS
MEN 45 66 82 119 123 45 4 484
WOMEN 77 53 36 57 42 42 33 340
TOTAL 122 119 118 176 165 87 37 824
EQ VAS – Mean + Standard Deviation and Median + Percentiles
AGE GROUPS 18-29 30-39 40-49 50-59 60-69 70-79 80+
Mean 88.4 87.4 83.3 78.5 73.8 75.4 71.3
- Std Dev 9.4 12.4 15.9 20.1 17.3 21.0 24.3
MEN Median 90 90 90 85 75 80 75
- 25th 85 80 80 73 61 63 46
- 75th 95 95 91 93 87 91 93
Mean 88.3 86.6 83.2 81.1 75.3 75.5 57.4
- Std Dev 10.1 14.6 15.7 15.8 19.9 19.2 27.4
WOMEN Median 90 90 88 81 77 80 60
- 25th 85 85 76 71 63 64 34
- 75th 95 95 95 95 90 90 75
Mean 88.4 87.0 83.3 79.4 74.2 75.5 58.9
- Std Dev 9.8 13.4 15.8 18.8 18.0 20.0 27.1
TOTAL Median 90 90 90 85 75 80 63
- 25th 85 85 80 73 61 63 40
- 75th 95 95 95 93 90 90 79

73
GERMANY
Cont.
MOBILITY – Percentage (%) reporting each level of problem
SELF-CARE – Percentage (%) reporting each level of problem
AGE GROUPS 18-29 30-39 40-49 50-59 60-69 70-79 80+
Level 1 95.6 90.9 83.8 73.7 69.1 65.9 50.0
MEN Level 2 2.2 9.1 16.3 26.3 30.9 34.1 50.0
Level 3 2.2 0.0 0.0 0.0 0.0 0.0 0.0
Level 1 96.1 92.5 88.9 78.9 65.0 54.8 46.9
WOMEN Level 2 3.9 7.5 11.1 21.1 35.0 45.2 53.1
Level 3 0.0 0.0 0.0 0.0 0.0 0.0 0.0
Level 1 95.9 91.6 85.3 75.4 68.1 60.5 47.2
TOTAL Level 2 3.3 8.4 14.7 24.6 31.9 39.5 52.8
Level 3 0.8 0.0 0.0 0.0 0.0 0.0 0.0
AGE GROUPS 18-29 30-39 40-49 50-59 60-69 70-79 80+
Level 1 97.8 98.5 98.8 96.6 96.7 93.3 75.0
MEN Level 2 0.0 1.5 1.2 2.5 3.3 6.7 25.0
Level 3 2.2 0.0 0.0 0.8 0.0 0.0 0.0
Level 1 100.0 98.1 97.2 98.2 92.5 92.9 75.0
WOMEN Level 2 0.0 0.0 2.8 0.0 2.5 7.1 18.8
Level 3 0.0 1.9 0.0 1.8 5.0 0.0 6.3
Level 1 99.2 98.3 98.3 97.1 95.7 93.1 75.0
TOTAL Level 2 0.0 0.8 1.7 1.7 3.1 6.9 19.4
Level 3 0.8 0.8 0.0 1.1 1.2 0.0 5.6

74
GERMANY
Cont.
USUAL ACTIVITY – Percentage (%) reporting each level of problem
PAIN / DISCOMFORT – Percentage (%) reporting each level of problem
AGE GROUPS 18-29 30-39 40-49 50-59 60-69 70-79 80+
Level 1 97.8 92.4 86.6 80.2 84.4 75.6 75.0
MEN Level 2 2.2 7.6 13.4 18.1 13.9 22.2 25.0
Level 3 0.0 0.0 0.0 1.7 1.6 2.2 0.0
Level 1 94.8 94.3 91.7 86.0 74.4 73.2 56.3
WOMEN Level 2 5.2 5.7 8.3 14.0 20.5 26.8 31.3
Level 3 0.0 0.0 0.0 0.0 5.1 0.0 12.5
Level 1 95.9 93.3 88.1 82.1 82.0 74.4 58.3
TOTAL Level 2 4.1 6.7 11.9 16.8 15.5 24.4 30.6
Level 3 0.0 0.0 0.0 1.2 2.5 1.2 11.1
AGE GROUPS 18-29 30-39 40-49 50-59 60-69 70-79 80+
Level 1 82.2 75.8 67.1 52.1 50.0 37.8 25.0
MEN Level 2 15.6 24.2 26.8 42.7 45.8 53.3 75.0
Level 3 2.2 0.0 6.1 5.1 4.2 8.9 0.0
Level 1 81.8 67.9 61.1 42.9 45.0 42.9 31.3
WOMEN Level 2 16.9 30.2 36.1 53.6 45.0 52.4 56.3
Level 3 1.3 1.9 2.8 3.6 10.0 4.8 12.5
Level 1 82.0 72.3 65.3 49.1 48.8 40.2 30.6
TOTAL Level 2 16.4 26.9 29.7 46.2 45.6 52.9 58.3
Level 3 1.6 0.8 5.1 4.6 5.6 6.9 11.1

75
GERMANY
Cont.
ANXIETY / DEPRESSION – Percentage (%) reporting each level of problem
AGE GROUPS 18-29 30-39 40-49 50-59 60-69 70-79 80+
Level 1 84.1 87.9 86.6 86.3 84.4 81.8 100.0
MEN Level 2 13.6 12.1 13.4 13.7 15.6 15.9 0.0
Level 3 2.3 0.0 0.0 0.0 0.0 2.3 0.0
Level 1 81.8 86.8 66.7 75.0 65.0 66.7 64.5
WOMEN Level 2 18.2 13.2 30.6 25.0 35.0 33.3 29.0
Level 3 0.0 0.0 2.8 0.0 0.0 0.0 6.5
Level 1 82.6 87.4 80.5 82.7 79.6 74.4 68.6
TOTAL Level 2 16.5 12.6 18.6 17.3 20.4 24.4 25.7
Level 3 0.8 0.0 0.8 0.0 0.0 1.2 5.7

76
GREECE
Source: Yfantopoulous, 1999
Number of respondents
AGE 18-29 30-39 40-49 50-59 60-69 70-79 80+ TOTAL
GROUPS
MEN 65 53 41 45 29 15 3 251
WOMEN 70 34 40 35 20 13 1 213
TOTAL 135 87 81 80 49 28 4 464
EQ VAS – Mean + Standard Deviation and Median + Percentiles
AGE GROUPS 18-29 30-39 40-49 50-59 60-69 70-79 80+
Mean 86.2 84.2 82.3 79.2 69.7 60.8 49.5
- Std Dev 11.9 14.5 17.4 17.0 17.9 26.2 13.4
MEN Median 90 90 89 84 70 61 50
- 25th 79 75 79 66 60 45 40
- 75th 98 95 94 90 86 82 59
Mean 84.6 81.5 84.1 64.6 69.2 64.2 40.0
- Std Dev 14.1 21.1 14.4 20.9 17.9 27.8 .
WOMEN Median 90 86 86 70 73 70 40
- 25th 80 80 80 50 61 48 40
- 75th 95 93 95 80 80 90 40
Mean 85.4 83.2 83.2 72.7 69.5 62.4 46.3
- Std Dev 13.1 17.3 15.9 20.1 17.7 26.5 11.0
TOTAL Median 90 88 87 79 70 63 40
- 25th 80 80 79 60 60 46 40
- 75th 95 95 95 90 80 89 59
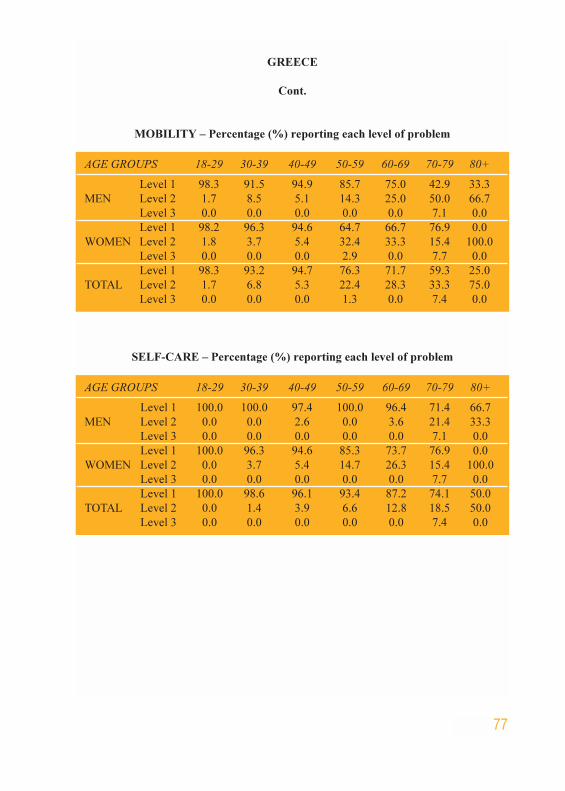
77
GREECE
Cont.
MOBILITY – Percentage (%) reporting each level of problem
SELF-CARE – Percentage (%) reporting each level of problem
AGE GROUPS 18-29 30-39 40-49 50-59 60-69 70-79 80+
Level 1 98.3 91.5 94.9 85.7 75.0 42.9 33.3
MEN Level 2 1.7 8.5 5.1 14.3 25.0 50.0 66.7
Level 3 0.0 0.0 0.0 0.0 0.0 7.1 0.0
Level 1 98.2 96.3 94.6 64.7 66.7 76.9 0.0
WOMEN Level 2 1.8 3.7 5.4 32.4 33.3 15.4 100.0
Level 3 0.0 0.0 0.0 2.9 0.0 7.7 0.0
Level 1 98.3 93.2 94.7 76.3 71.7 59.3 25.0
TOTAL Level 2 1.7 6.8 5.3 22.4 28.3 33.3 75.0
Level 3 0.0 0.0 0.0 1.3 0.0 7.4 0.0
AGE GROUPS 18-29 30-39 40-49 50-59 60-69 70-79 80+
Level 1 100.0 100.0 97.4 100.0 96.4 71.4 66.7
MEN Level 2 0.0 0.0 2.6 0.0 3.6 21.4 33.3
Level 3 0.0 0.0 0.0 0.0 0.0 7.1 0.0
Level 1 100.0 96.3 94.6 85.3 73.7 76.9 0.0
WOMEN Level 2 0.0 3.7 5.4 14.7 26.3 15.4 100.0
Level 3 0.0 0.0 0.0 0.0 0.0 7.7 0.0
Level 1 100.0 98.6 96.1 93.4 87.2 74.1 50.0
TOTAL Level 2 0.0 1.4 3.9 6.6 12.8 18.5 50.0
Level 3 0.0 0.0 0.0 0.0 0.0 7.4 0.0

78
GREECE
Cont.
USUAL ACTIVITY – Percentage (%) reporting each level of problem
PAIN / DISCOMFORT – Percentage (%) reporting each level of problem
AGE GROUPS 18-29 30-39 40-49 50-59 60-69 70-79 80+
Level 1 100.0 97.9 97.4 88.1 78.6 46.7 66.7
MEN Level 2 0.0 2.1 2.6 11.9 21.4 53.3 33.3
Level 3 0.0 0.0 0.0 0.0 0.0 0.0 0.0
Level 1 100.0 96.3 97.3 70.6 73.7 69.2 0.0
WOMEN Level 2 0.0 3.7 2.7 29.4 26.3 23.1 100.0
Level 3 0.0 0.0 0.0 0.0 0.0 7.7 0.0
Level 1 100.0 97.3 97.4 80.3 76.6 57.1 50.0
TOTAL Level 2 0.0 2.7 2.6 19.7 23.4 39.3 50.0
Level 3 0.0 0.0 0.0 0.0 0.0 3.6 0.0
AGE GROUPS 18-29 30-39 40-49 50-59 60-69 70-79 80+
Level 1 95.2 93.9 90.2 81.8 71.4 53.3 66.7
MEN Level 2 4.8 6.1 9.8 18.2 25.0 46.7 33.3
Level 3 0.0 0.0 0.0 0.0 3.6 0.0 0.0
Level 1 92.1 92.9 92.1 62.9 50.0 53.8 0.0
WOMEN Level 2 7.9 7.1 5.3 28.6 40.0 30.8 0.0
Level 3 0.0 0.0 2.6 8.6 10.0 15.4 100.0
Level 1 93.7 93.5 91.1 73.4 62.5 53.6 50.0
TOTAL Level 2 6.3 6.5 7.6 22.8 31.3 39.3 25.0
Level 3 0.0 0.0 1.3 3.8 6.3 7.1 25.0

79
GREECE
Cont.
ANXIETY / DEPRESSION – Percentage (%) reporting each level of problem
AGE GROUPS 18-29 30-39 40-49 50-59 60-69 70-79 80+
Level 1 95.0 93.8 89.7 85.7 77.8 92.9 100.0
MEN Level 2 3.3 6.3 5.1 9.5 14.8 7.1 0.0
Level 3 1.7 0.0 5.1 4.8 7.4 0.0 0.0
Level 1 94.6 92.9 89.2 79.4 83.3 76.9 100.0
WOMEN Level 2 3.6 7.1 10.8 20.6 5.6 23.1 0.0
Level 3 1.8 0.0 0.0 0.0 11.1 0.0 0.0
Level 1 94.8 93.4 89.5 82.9 80.0 85.2 100.0
TOTAL Level 2 3.4 6.6 7.9 14.5 11.1 14.8 0.0
Level 3 1.7 0.0 2.6 2.6 8.9 0.0 0.0
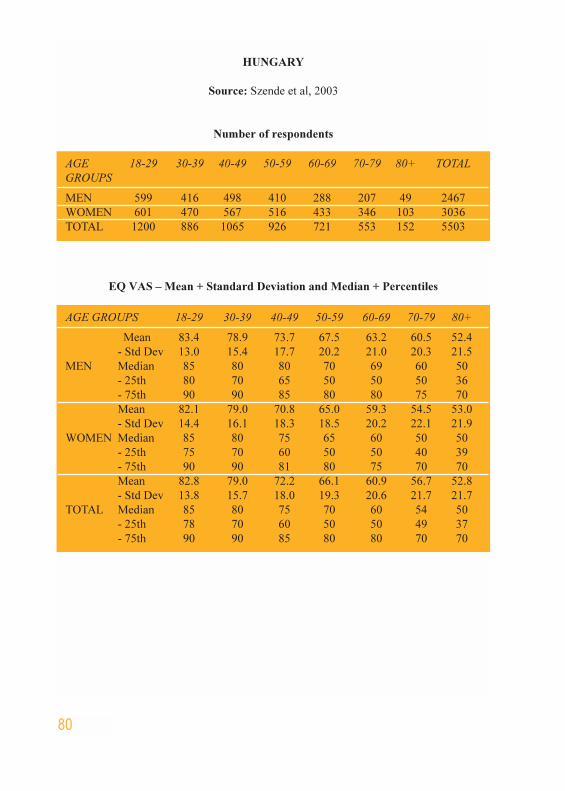
80
HUNGARY
Source: Szende et al, 2003
Number of respondents
AGE 18-29 30-39 40-49 50-59 60-69 70-79 80+ TOTAL
GROUPS
MEN 599 416 498 410 288 207 49 2467
WOMEN 601 470 567 516 433 346 103 3036
TOTAL 1200 886 1065 926 721 553 152 5503
EQ VAS – Mean + Standard Deviation and Median + Percentiles
AGE GROUPS 18-29 30-39 40-49 50-59 60-69 70-79 80+
Mean 83.4 78.9 73.7 67.5 63.2 60.5 52.4
- Std Dev 13.0 15.4 17.7 20.2 21.0 20.3 21.5
MEN Median 85 80 80 70 69 60 50
- 25th 80 70 65 50 50 50 36
- 75th 90 90 85 80 80 75 70
Mean 82.1 79.0 70.8 65.0 59.3 54.5 53.0
- Std Dev 14.4 16.1 18.3 18.5 20.2 22.1 21.9
WOMEN Median 85 80 75 65 60 50 50
- 25th 75 70 60 50 50 40 39
- 75th 90 90 81 80 75 70 70
Mean 82.8 79.0 72.2 66.1 60.9 56.7 52.8
- Std Dev 13.8 15.7 18.0 19.3 20.6 21.7 21.7
TOTAL Median 85 80 75 70 60 54 50
- 25th 78 70 60 50 50 49 37
- 75th 90 90 85 80 80 70 70

81
HUNGARY
Cont.
MOBILITY – Percentage (%) reporting each level of problem
SELF-CARE – Percentage (%) reporting each level of problem
AGE GROUPS 18-29 30-39 40-49 50-59 60-69 70-79 80+
Level 1 98.3 92.7 87.7 76.1 71.5 56.9 52.1
MEN Level 2 1.5 6.1 11.1 22.9 27.7 40.6 45.8
Level 3 0.2 1.2 1.2 1.0 0.7 2.5 2.1
Level 1 97.6 95.2 85.4 70.4 61.9 47.0 35.3
WOMEN Level 2 1.8 4.1 13.3 28.6 37.6 51.8 62.7
Level 3 0.5 0.7 1.3 1.0 0.5 1.2 2.0
Level 1 98.0 94.0 86.5 72.9 65.7 50.7 40.7
TOTAL Level 2 1.7 5.1 12.3 26.1 33.7 47.6 57.3
Level 3 0.3 0.9 1.2 1.0 0.6 1.7 2.0
AGE GROUPS 18-29 30-39 40-49 50-59 60-69 70-79 80+
Level 1 99.0 98.8 97.1 92.2 91.2 78.4 74.5
MEN Level 2 0.8 1.0 2.3 6.6 6.3 17.6 21.3
Level 3 0.2 0.2 0.6 1.3 2.6 4.0 4.3
Level 1 99.8 99.1 96.9 92.2 88.5 78.3 70.0
WOMEN Level 2 0.2 0.2 2.9 6.4 10.8 19.0 23.0
Level 3 0.0 0.7 0.2 1.4 0.7 2.7 7.0
Level 1 99.4 99.0 97.0 92.2 89.5 78.3 71.4
TOTAL Level 2 0.5 0.6 2.6 6.5 9.0 18.5 22.4
Level 3 0.1 0.5 0.4 1.3 1.5 3.2 6.1

82
HUNGARY
Cont.
USUAL ACTIVITY – Percentage (%) reporting each level of problem
AGE GROUPS 18-29 30-39 40-49 50-59 60-69 70-79 80+
Level 1 98.1 95.8 89.9 81.7 78.0 64.0 63.0
MEN Level 2 1.7 3.4 8.3 15.3 16.5 26.9 28.3
Level 3 0.2 0.7 1.9 3.1 5.5 9.1 8.7
Level 1 97.5 95.9 88.2 79.5 72.8 60.7 52.5
WOMEN Level 2 1.7 3.3 10.5 17.9 23.3 32.9 37.6
Level 3 0.8 0.9 1.3 2.6 3.8 6.3 9.9
Level 1 97.8 95.9 89.0 80.4 74.9 61.9 55.8
TOTAL Level 2 1.7 3.3 9.5 16.7 20.6 30.7 34.7
Level 3 0.5 0.8 1.5 2.8 4.5 7.4 9.5
PAIN / DISCOMFORT – Percentage (%) reporting each level of problem
AGE GROUPS 18-29 30-39 40-49 50-59 60-69 70-79 80+
Level 1 86.3 78.2 68.1 56.3 50.9 43.3 38.8
MEN Level 2 13.5 21.3 29.8 42.1 45.0 50.2 57.1
Level 3 0.2 0.5 2.1 1.5 4.1 6.5 4.1
Level 1 82.1 76.4 57.9 40.4 33.2 30.3 32.7
WOMEN Level 2 17.4 22.3 40.3 54.5 57.9 57.7 54.5
Level 3 0.5 1.3 1.8 5.1 9.0 12.0 12.9
Level 1 84.2 77.3 62.7 47.4 40.2 35.2 34.7
TOTAL Level 2 15.5 21.8 35.4 49.1 52.8 54.9 55.3
Level 3 0.3 0.9 1.9 3.6 7.0 9.9 10.0

83
HUNGARY
Cont.
ANXIETY / DEPRESSION – Percentage (%) reporting each level of problem
AGE GROUPS 18-29 30-39 40-49 50-59 60-69 70-79 80+
Level 1 85.8 78.8 74.7 63.5 63.3 57.5 50.0
MEN Level 2 13.0 20.0 22.8 34.2 31.5 39.0 45.7
Level 3 1.2 1.2 2.5 2.3 5.2 3.5 4.3
Level 1 74.4 69.3 60.4 47.7 44.9 46.4 40.0
WOMEN Level 2 23.9 27.4 35.8 47.7 45.9 47.0 47.0
Level 3 1.7 3.3 3.9 4.6 9.2 6.6 13.0
Level 1 80.1 73.8 67.1 54.6 52.2 50.6 43.2
TOTAL Level 2 18.4 23.9 29.7 41.8 40.2 44.0 46.6
Level 3 1.4 2.3 3.2 3.6 7.6 5.4 10.3

84
JAPAN
Source: Tsuchiya et al, 2002
Number of respondents
AGE 18-29 30-39 40-49 50-59 60-69 70-79 80+ TOTAL
GROUPS
MEN 40 53 40 54 56 20 2 265
WOMEN 50 55 81 82 52 26 9 355
TOTAL 90 108 121 136 108 46 11 620
EQ VAS – Mean + Standard Deviation and Median + Percentiles
AGE GROUPS 18-29 30-39 40-49 50-59 60-69 70-79 80+
Mean 78.1 81.4 81.3 76.9 78.0 72.8 63.5
- Std Dev 17.1 12.1 14.7 16.5 17.6 17.2 9.2
MEN Median 80 80 83 80 80 78 64
- 25th 70 75 70 70 70 60 57
- 75th 90 90 90 90 90 80 70
Mean 79.2 78.5 75.8 77.9 78.5 72.3 74.1
- Std Dev 14.8 17.7 17.2 15.6 14.6 16.9 15.3
WOMEN Median 80 80 80 80 80 80 80
- 25th 70 70 70 70 70 50 65
- 75th 90 90 90 90 90 80 80
Mean 78.7 79.9 77.6 77.5 78.3 72.5 72.2
- Std Dev 15.8 15.2 16.5 15.9 16.2 16.8 14.6
TOTAL Median 80 80 80 80 80 80 80
- 25th 70 75 70 70 70 60 57
- 75th 90 90 90 90 90 80 80

85
JAPAN
Cont.
MOBILITY – Percentage (%) reporting each level of problem
SELF-CARE – Percentage (%) reporting each level of problem
AGE GROUPS 18-29 30-39 40-49 50-59 60-69 70-79 80+
Level 1 97.5 98.1 100.0 92.6 85.7 75.0 100.0
MEN Level 2 2.5 1.9 0.0 7.4 14.3 25.0 0.0
Level 3 0.0 0.0 0.0 0.0 0.0 0.0 0.0
Level 1 100.0 98.2 98.8 92.7 92.3 61.5 55.6
WOMEN Level 2 0.0 1.8 1.2 7.3 7.7 38.5 44.4
Level 3 0.0 0.0 0.0 0.0 0.0 0.0 0.0
Level 1 98.9 98.1 99.2 92.6 88.9 67.4 63.6
TOTAL Level 2 1.1 1.9 0.8 7.4 11.1 32.6 36.4
Level 3 0.0 0.0 0.0 0.0 0.0 0.0 0.0
AGE GROUPS 18-29 30-39 40-49 50-59 60-69 70-79 80+
Level 1 97.5 100.0 100.0 98.1 100.0 95.0 100.0
MEN Level 2 2.5 0.0 0.0 1.9 0.0 5.0 0.0
Level 3 0.0 0.0 0.0 0.0 0.0 0.0 0.0
Level 1 100.0 100.0 98.8 98.8 96.2 88.5 88.9
WOMEN Level 2 0.0 0.0 1.2 1.2 3.8 11.5 11.1
Level 3 0.0 0.0 0.0 0.0 0.0 0.0 0.0
Level 1 98.9 100.0 99.2 98.5 98.1 91.3 90.9
TOTAL Level 2 1.1 0.0 0.8 1.5 1.9 8.7 9.1
Level 3 0.0 0.0 0.0 0.0 0.0 0.0 0.0

86
JAPAN
Cont.
USUAL ACTIVITY – Percentage (%) reporting each level of problem
PAIN / DISCOMFORT – Percentage (%) reporting each level of problem
AGE GROUPS 18-29 30-39 40-49 50-59 60-69 70-79 80+
Level 1 97.5 100.0 97.5 96.3 91.1 85.0 100.0
MEN Level 2 2.5 0.0 2.5 3.7 8.9 15.0 0.0
Level 3 0.0 0.0 0.0 0.0 0.0 0.0 0.0
Level 1 98.0 100.0 98.8 93.9 92.3 76.9 66.7
WOMEN Level 2 2.0 0.0 0.0 6.1 7.7 23.1 11.1
Level 3 0.0 0.0 1.2 0.0 0.0 0.0 22.2
Level 1 97.8 100.0 98.3 94.9 91.7 80.4 72.7
TOTAL Level 2 2.2 0.0 0.8 5.1 8.3 19.6 9.1
Level 3 0.0 0.0 0.8 0.0 0.0 0.0 18.2
AGE GROUPS 18-29 30-39 40-49 50-59 60-69 70-79 80+
Level 1 90.0 96.2 92.5 87.0 78.6 70.0 50.0
MEN Level 2 7.5 3.8 5.0 11.1 21.4 30.0 50.0
Level 3 2.5 0.0 2.5 1.9 0.0 0.0 0.0
Level 1 90.0 89.1 80.2 68.3 73.1 30.8 55.6
WOMEN Level 2 10.0 7.3 18.5 29.3 25.0 69.2 33.3
Level 3 0.0 3.6 1.2 2.4 1.9 0.0 11.1
Level 1 90.0 92.6 84.3 75.7 75.9 47.8 54.5
TOTAL Level 2 8.9 5.6 14.0 22.1 23.1 52.2 36.4
Level 3 1.1 1.9 1.7 2.2 0.9 0.0 9.1

87
JAPAN
Cont.
ANXIETY / DEPRESSION – Percentage (%) reporting each level of problem
AGE GROUPS 18-29 30-39 40-49 50-59 60-69 70-79 80+
Level 1 97.5 96.2 92.5 88.9 94.6 85.0 100.0
MEN Level 2 2.5 3.8 5.0 7.4 5.4 15.0 0.0
Level 3 0.0 0.0 2.5 3.7 0.0 0.0 0.0
Level 1 90.0 90.9 92.6 95.1 86.5 73.1 88.9
WOMEN Level 2 10.0 9.1 6.2 3.7 13.5 26.9 11.1
Level 3 0.0 0.0 1.2 1.2 0.0 0.0 0.0
Level 1 93.3 93.5 92.6 92.6 90.7 78.3 90.9
TOTAL Level 2 6.7 6.5 5.8 5.1 9.3 21.7 9.1
Level 3 0.0 0.0 1.7 2.2 0.0 0.0 0.0

88
THE NETHERLANDS
Source: Essink-Bot et al, 1993
Number of respondents
EQ VAS – Mean + Standard Deviation and Median + Percentiles
AGE 18-29 30-39 40-49 50-59 60-69 70-79 80+ TOTAL
GROUPS
MEN 53 71 38 34 60 73 55 384
WOMEN 60 88 71 69 74 74 31 467
TOTAL 113 159 109 103 134 147 86 851
AGE GROUPS 18-29 30-39 40-49 50-59 60-69 70-79 80+
Mean 84.4 81.2 82.8 83.9 80.3 79.1 68.5
- Std Dev 11.2 15.5 13.8 11.4 16.7 17.2 19.7
MEN Median 85 85 85 85 84 80 70
- 25th 75 70 75 79 70 70 50
- 75th 95 95 95 94 95 90 80
Mean 82.5 80.8 83.7 80.3 79.3 79.7 78.1
- Std Dev 11.3 14.2 15.5 19.1 15.4 15.8 20.1
WOMEN Median 80 85 86 89 84 80 80
- 25th 75 70 76 71 70 65 64
- 75th 90 91 95 95 90 94 95
Mean 83.4 81.0 83.4 81.5 79.7 79.4 72.5
- Std Dev 11.2 14.8 14.9 17.0 15.9 16.4 20.3
TOTAL Median 82 85 85 86 84 80 79
- 25th 75 70 75 75 70 70 60
- 75th 92 92 95 95 91 93 90

89
THE NETHERLANDS
Cont.
MOBILITY – Percentage (%) reporting each level of problem
SELF-CARE – Percentage (%) reporting each level of problem
AGE GROUPS 18-29 30-39 40-49 50-59 60-69 70-79 80+
Level 1 100.0 98.6 100.0 97.1 84.5 78.8 55.6
MEN Level 2 0.0 1.4 0.0 2.9 13.8 21.2 44.4
Level 3 0.0 0.0 0.0 0.0 1.7 0.0 0.0
Level 1 98.3 100.0 98.6 97.0 94.3 88.7 80.8
WOMEN Level 2 1.7 0.0 1.4 3.0 5.7 11.3 19.2
Level 3 0.0 0.0 0.0 0.0 0.0 0.0 0.0
Level 1 99.1 99.4 99.0 97.0 89.8 83.9 63.8
TOTAL Level 2 0.9 0.6 1.0 3.0 9.4 16.1 36.3
Level 3 0.0 0.0 0.0 0.0 0.8 0.0 0.0
AGE GROUPS 18-29 30-39 40-49 50-59 60-69 70-79 80+
Level 1 100.0 100.0 97.4 100.0 91.4 92.5 74.1
MEN Level 2 0.0 0.0 2.6 0.0 6.9 7.5 24.1
Level 3 0.0 0.0 0.0 0.0 1.7 0.0 1.9
Level 1 98.3 100.0 98.6 97.0 95.8 89.0 86.2
WOMEN Level 2 1.7 0.0 1.4 3.0 4.2 9.6 13.8
Level 3 0.0 0.0 0.0 0.0 0.0 1.4 0.0
Level 1 99.1 100.0 98.1 98.0 93.8 90.7 78.3
TOTAL Level 2 0.9 0.0 1.9 2.0 5.4 8.6 20.5
Level 3 0.0 0.0 0.0 0.0 0.8 0.7 1.2

90
THE NETHERLANDS
Cont.
USUAL ACTIVITY – Percentage (%) reporting each level of problem
PAIN / DISCOMFORT – Percentage (%) reporting each level of problem
AGE GROUPS 18-29 30-39 40-49 50-59 60-69 70-79 80+
Level 1 90.6 90.0 86.8 82.4 75.9 64.7 44.4
MEN Level 2 9.4 7.1 13.2 14.7 22.4 30.9 42.6
Level 3 0.0 2.9 0.0 2.9 1.7 4.4 13.0
Level 1 98.3 86.2 89.7 78.3 80.3 80.6 80.0
WOMEN Level 2 1.7 12.6 7.4 13.0 18.3 11.1 12.0
Level 3 0.0 1.1 2.9 8.7 1.4 8.3 8.0
Level 1 94.7 87.9 88.7 79.6 78.3 72.9 55.7
TOTAL Level 2 5.3 10.2 9.4 13.6 20.2 20.7 32.9
Level 3 0.0 1.9 1.9 6.8 1.6 6.4 11.4
AGE GROUPS 18-29 30-39 40-49 50-59 60-69 70-79 80+
Level 1 75.5 77.1 71.1 58.8 50.0 43.5 35.8
MEN Level 2 24.5 22.9 28.9 38.2 48.3 53.6 58.5
Level 3 0.0 0.0 0.0 2.9 1.7 2.9 5.7
Level 1 88.1 81.4 72.9 60.9 54.2 53.4 56.7
WOMEN Level 2 11.9 17.4 24.3 34.8 44.4 45.2 40.0
Level 3 0.0 1.2 2.9 4.3 1.4 1.4 3.3
Level 1 82.1 79.5 72.2 60.2 52.3 48.6 43.4
TOTAL Level 2 17.9 19.9 25.9 35.9 46.2 49.3 51.8
Level 3 0.0 0.6 1.9 3.9 1.5 2.1 4.8

91
THE NETHERLANDS
Cont.
ANXIETY / DEPRESSION – Percentage (%) reporting each level of problem
AGE GROUPS 18-29 30-39 40-49 50-59 60-69 70-79 80+
Level 1 79.2 71.8 81.6 79.4 82.5 67.1 67.9
MEN Level 2 20.8 26.8 15.8 20.6 14.0 31.4 26.4
Level 3 0.0 1.4 2.6 0.0 3.5 1.4 5.7
Level 1 90.0 85.1 90.0 87.0 85.9 81.4 86.7
WOMEN Level 2 10.0 12.6 10.0 13.0 12.7 18.6 13.3
Level 3 0.0 2.3 0.0 0.0 1.4 0.0 0.0
Level 1 85.0 79.1 87.0 84.5 84.4 74.3 74.7
TOTAL Level 2 15.0 19.0 12.0 15.5 13.3 25.0 21.7
Level 3 0.0 1.9 0.9 0.0 2.3 0.7 3.6

92
NEW ZEALAND
Source: Devlin et al, 2000
Number of respondents
EQ VAS – Mean + Standard Deviation and Median + Percentiles
AGE 18-29 30-39 40-49 50-59 60-69 70-79 80+ TOTAL
GROUPS
MEN 74 100 110 100 102 61 27 574
WOMEN 95 138 154 144 114 79 29 753
TOTAL 169 238 264 244 216 140 56 1327
AGE GROUPS 18-29 30-39 40-49 50-59 60-69 70-79 80+
Mean 81.6 81.6 82.6 80.6 79.8 76.8 73.0
- Std Dev 13.2 14.2 13.4 17.2 16.3 19.0 20.2
MEN Median 81 85 85 85 80 80 77
- 25th 72 75 77 70 70 63 60
- 75th 94 90 90 94 91 95 89
Mean 82.4 83.5 83.4 83.0 80.9 75.3 62.1
- Std Dev 12.6 12.9 13.9 16.6 16.3 16.1 19.8
WOMEN Median 85 85 88 90 88 80 60
- 25th 75 78 80 78 73 70 50
- 75th 90 92 93 95 90 90 80
Mean 82.0 82.7 83.0 82.0 80.4 76.0 67.3
- Std Dev 12.9 13.5 13.7 16.8 16.3 17.4 20.5
TOTAL Median 85 85 85 87 85 80 70
- 25th 75 76 78 75 70 70 50
- 75th 90 90 90 95 90 90 80

93
NEW ZEALAND
Cont.
MOBILITY – Percentage (%) reporting each level of problem
SELF-CARE – Percentage (%) reporting each level of problem
AGE GROUPS 18-29 30-39 40-49 50-59 60-69 70-79 80+
Level 1 94.4 89.7 90.0 84.7 71.1 46.7 51.9
MEN Level 2 5.6 9.3 10.0 15.3 28.9 51.7 48.1
Level 3 0.0 1.0 0.0 0.0 0.0 1.7 0.0
Level 1 95.7 90.4 91.5 78.2 73.9 55.8 20.7
WOMEN Level 2 4.3 9.6 8.5 21.8 25.2 44.2 75.9
Level 3 0.0 0.0 0.0 0.0 0.9 0.0 3.4
Level 1 95.2 90.1 90.9 80.8 72.6 51.8 35.7
TOTAL Level 2 4.8 9.4 9.1 19.2 26.9 47.4 62.5
Level 3 0.0 0.4 0.0 0.0 0.5 0.7 1.8
AGE GROUPS 18-29 30-39 40-49 50-59 60-69 70-79 80+
Level 1 100.0 99.0 97.2 91.8 91.8 89.7 88.9
MEN Level 2 0.0 0.0 2.8 8.2 8.2 6.9 11.1
Level 3 0.0 1.0 0.0 0.0 0.0 3.4 0.0
Level 1 97.8 98.5 99.3 96.5 95.4 95.9 63.0
WOMEN Level 2 2.2 1.5 0.7 3.5 4.6 4.1 29.6
Level 3 0.0 0.0 0.0 0.0 0.0 0.0 7.4
Level 1 98.8 98.7 98.5 94.6 93.7 93.2 75.9
TOTAL Level 2 1.2 0.9 1.5 5.4 6.3 5.3 20.4
Level 3 0.0 0.4 0.0 0.0 0.0 1.5 3.7

94
NEW ZEALAND
Cont.
USUAL ACTIVITY – Percentage (%) reporting each level of problem
PAIN / DISCOMFORT – Percentage (%) reporting each level of problem
AGE GROUPS 18-29 30-39 40-49 50-59 60-69 70-79 80+
Level 1 91.7 91.8 88.2 81.6 66.3 55.0 50.0
MEN Level 2 8.3 7.1 10.9 17.3 32.7 41.7 46.2
Level 3 0.0 1.0 0.9 1.0 1.0 3.3 3.8
Level 1 90.3 87.5 85.6 79.0 72.5 61.5 17.2
WOMEN Level 2 9.7 12.5 14.4 20.3 27.5 38.5 72.4
Level 3 0.0 0.0 0.0 0.7 0.0 0.0 10.3
Level 1 90.9 89.3 86.7 80.1 69.6 58.7 32.7
TOTAL Level 2 9.1 10.3 12.9 19.1 30.0 39.9 60.0
Level 3 0.0 0.4 0.4 0.8 0.5 1.4 7.3
AGE GROUPS 18-29 30-39 40-49 50-59 60-69 70-79 80+
Level 1 81.9 74.5 70.9 53.6 45.4 31.7 40.7
MEN Level 2 16.7 24.5 28.2 42.3 50.5 63.3 59.3
Level 3 1.4 1.0 0.9 4.1 4.1 5.0 0.0
Level 1 76.4 73.3 66.9 54.2 45.5 38.5 20.7
WOMEN Level 2 22.5 25.2 32.5 45.1 51.8 59.0 69.0
Level 3 1.1 1.5 0.7 0.7 2.7 2.6 10.3
Level 1 78.9 73.8 68.6 54.0 45.4 35.5 30.4
TOTAL Level 2 19.9 24.9 30.7 43.9 51.2 60.9 64.3
Level 3 1.2 1.3 0.8 2.1 3.4 3.6 5.4

95
NEW ZEALAND
Cont.
ANXIETY / DEPRESSION – Percentage (%) reporting each level of problem
AGE GROUPS 18-29 30-39 40-49 50-59 60-69 70-79 80+
Level 1 84.7 85.7 87.2 78.4 75.5 80.7 76.0
MEN Level 2 15.3 13.3 12.8 19.6 23.5 19.3 24.0
Level 3 0.0 1.0 0.0 2.1 1.0 0.0 0.0
Level 1 83.9 77.0 74.7 82.3 72.9 71.8 55.6
WOMEN Level 2 16.1 23.0 24.0 16.3 26.2 28.2 40.7
Level 3 0.0 0.0 1.3 1.4 0.9 0.0 3.7
Level 1 84.2 80.7 79.9 80.7 74.1 75.6 65.4
TOTAL Level 2 15.8 18.9 19.3 17.6 24.9 24.4 32.7
Level 3 0.0 0.4 0.8 1.7 1.0 0.0 1.9

96
SLOVENIA
Source: Prevolnik Rupel and Rebolj 2001
Number of respondents
EQ VAS – Mean + Standard Deviation and Median + Percentiles
AGE 18-29 30-39 40-49 50-59 60-69 70-79 80+ TOTAL
GROUPS
MEN 82 53 63 57 36 29 4 324
WOMEN 116 90 60 59 45 37 11 418
TOTAL 198 143 123 116 81 66 15 742
AGE GROUPS 18-29 30-39 40-49 50-59 60-69 70-79 80+
Mean 83.9 79.4 77.8 69.4 67.8 65.0 45.0
- Std Dev 13.1 15.0 18.7 20.7 16.3 17.9 20.4
MEN Median 87 80 80 72 70 65 38
- 25th 75 77 70 60 60 50 31
- 75th 95 85 90 85 80 80 66
Mean 85.2 82.5 79.6 72.4 66.7 61.4 47.7
- Std Dev 14.0 16.5 18.1 21.7 17.8 19.7 15.9
WOMEN Median 90 89 80 80 70 60 45
- 25th 80 76 70 60 50 50 40
- 75th 95 95 94 90 80 71 60
Mean 84.6 81.4 78.7 70.9 67.2 63.0 46.9
- Std Dev 13.6 16.0 18.3 21.1 17.0 18.9 16.5
TOTAL Median 90 85 80 79 70 60 40
- 25th 80 77 70 60 59 50 35
- 75th 95 90 90 89 80 75 60

97
SLOVENIA
Cont.
MOBILITY – Percentage (%) reporting each level of problem
SELF-CARE – Percentage (%) reporting each level of problem
AGE GROUPS 18-29 30-39 40-49 50-59 60-69 70-79 80+
Level 1 95.1 81.1 65.1 52.6 41.7 37.0 25.0
MEN Level 2 4.9 17.0 34.9 47.4 58.3 63.0 75.0
Level 3 0.0 1.9 0.0 0.0 0.0 0.0 0.0
Level 1 96.6 87.6 76.7 61.0 40.0 25.0 9.1
WOMEN Level 2 3.4 12.4 23.3 37.3 60.0 72.2 90.9
Level 3 0.0 0.0 0.0 1.7 0.0 2.8 0.0
Level 1 96.0 85.2 70.7 56.9 40.7 30.2 13.3
TOTAL Level 2 4.0 14.1 29.3 42.2 59.3 68.3 86.7
Level 3 0.0 0.7 0.0 0.9 0.0 1.6 0.0
AGE GROUPS 18-29 30-39 40-49 50-59 60-69 70-79 80+
Level 1 98.8 92.5 88.9 75.4 80.6 63.0 50.0
MEN Level 2 1.2 5.7 11.1 24.6 19.4 33.3 50.0
Level 3 0.0 1.9 0.0 0.0 0.0 3.7 0.0
Level 1 98.3 88.8 95.0 79.7 77.8 63.9 27.3
WOMEN Level 2 1.7 11.2 5.0 18.6 22.2 33.3 72.7
Level 3 0.0 0.0 0.0 1.7 0.0 2.8 0.0
Level 1 98.5 90.1 91.9 77.6 79.0 63.5 33.3
TOTAL Level 2 1.5 9.2 8.1 21.6 21.0 33.3 66.7
Level 3 0.0 0.7 0.0 0.9 0.0 3.2 0.0

98
SLOVENIA
Cont.
USUAL ACTIVITY – Percentage (%) reporting each level of problem
PAIN / DISCOMFORT – Percentage (%) reporting each level of problem
AGE GROUPS 18-29 30-39 40-49 50-59 60-69 70-79 80+
Level 1 82.9 69.8 68.3 57.9 55.6 48.1 25.0
MEN Level 2 17.1 28.3 31.7 36.8 44.4 51.9 75.0
Level 3 0.0 1.9 0.0 5.3 0.0 0.0 0.0
Level 1 86.2 79.8 75.0 59.3 37.8 32.4 9.1
WOMEN Level 2 13.8 18.0 25.0 35.6 62.2 62.2 81.8
Level 3 0.0 2.2 0.0 5.1 0.0 5.4 9.1
Level 1 84.8 76.1 71.5 58.6 45.7 39.1 13.3
TOTAL Level 2 15.2 21.8 28.5 36.2 54.3 57.8 80.0
Level 3 0.0 2.1 0.0 5.2 0.0 3.1 6.7
AGE GROUPS 18-29 30-39 40-49 50-59 60-69 70-79 80+
Level 1 70.7 60.4 60.3 42.1 36.1 22.2 25.0
MEN Level 2 28.0 34.0 36.5 52.6 63.9 77.8 75.0
Level 3 1.2 5.7 3.2 5.3 0.0 0.0 0.0
Level 1 76.7 65.2 50.0 32.2 31.8 18.9 9.1
WOMEN Level 2 22.4 33.7 50.0 61.0 68.2 78.4 81.8
Level 3 0.9 1.1 0.0 6.8 0.0 2.7 9.1
Level 1 74.2 63.4 55.3 37.1 33.8 20.3 13.3
TOTAL Level 2 24.7 33.8 43.1 56.9 66.3 78.1 80.0
Level 3 1.0 2.8 1.6 6.0 0.0 1.6 6.7

99
SLOVENIA
Cont.
ANXIETY / DEPRESSION – Percentage (%) reporting each level of problem
AGE GROUPS 18-29 30-39 40-49 50-59 60-69 70-79 80+
Level 1 70.7 60.4 77.8 57.9 52.8 66.7 50.0
MEN Level 2 26.8 39.6 20.6 40.4 47.2 33.3 50.0
Level 3 2.4 0.0 1.6 1.8 0.0 0.0 0.0
Level 1 73.3 64.0 71.7 47.5 53.3 47.2 36.4
WOMEN Level 2 26.7 33.7 28.3 45.8 44.4 52.8 63.6
Level 3 0.0 2.2 0.0 6.8 2.2 0.0 0.0
Level 1 72.2 62.7 74.8 52.6 53.1 55.6 40.0
TOTAL Level 2 26.8 35.9 24.4 43.1 45.7 44.4 60.0
Level 3 1.0 1.4 0.8 4.3 1.2 0.0 0.0

100
SPAIN
Source: Badia et al, 2001; Gaminde et al, 1996; Gaminde et al, 2001
Tables are based on pooled data from three studies
Number of respondents
EQ VAS – Mean + Standard Deviation and Median + Percentiles
AGE 18-29 30-39 40-49 50-59 60-69 70-79 80+ TOTAL
GROUPS
MEN 315 216 201 221 183 110 45 315
WOMEN 323 241 247 201 223 154 61 323
TOTAL 638 457 448 422 406 264 106 638
AGE GROUPS 18-29 30-39 40-49 50-59 60-69 70-79 80+
Mean 82.3 79.6 78.3 75.5 72.0 70.3 66.8
- Std Dev 13.9 16.6 16.5 18.8 18.4 18.5 17.7
MEN Median 82 80 80 80 75 70 70
- 25th 75 70 70 70 50 58 50
- 75th 90 90 90 90 90 81 80
Mean 81.8 78.2 77.7 70.7 68.9 68.4 63.5
- Std Dev 14.4 19.2 16.9 19.7 19.6 18.9 23.7
WOMEN Median 80 80 80 75 70 70 60
- 25th 75 70 70 50 50 50 50
- 75th 90 90 90 85 80 80 80
Mean 82.0 78.9 78.0 73.2 70.3 69.2 64.9
- Std Dev 14.2 18.0 16.7 19.4 19.1 18.7 21.4
TOTAL Median 80 80 80 80 70 70 70
- 25th 75 70 70 60 50 50 50
- 75th 90 90 90 90 80 80 80

101
SPAIN
Cont.
MOBILITY – Percentage (%) reporting each level of problem
SELF-CARE – Percentage (%) reporting each level of problem
AGE GROUPS 18-29 30-39 40-49 50-59 60-69 70-79 80+
Level 1 96.8 97.2 95.0 85.1 77.6 75.5 44.4
MEN Level 2 2.9 2.8 5.0 14.9 22.4 24.5 55.6
Level 3 0.3 0.0 0.0 0.0 0.0 0.0 0.0
Level 1 97.8 93.8 94.3 81.1 69.1 64.3 55.7
WOMEN Level 2 1.9 6.3 5.7 18.4 30.5 35.1 41.0
Level 3 0.3 0.0 0.0 0.5 0.4 0.6 3.3
Level 1 97.3 95.4 94.6 83.2 72.9 68.9 50.9
TOTAL Level 2 2.4 4.6 5.4 16.6 26.8 30.7 47.2
Level 3 0.3 0.0 0.0 0.2 0.2 0.4 1.9
AGE GROUPS 18-29 30-39 40-49 50-59 60-69 70-79 80+
Level 1 98.4 99.1 99.0 96.8 97.3 96.4 77.8
MEN Level 2 1.3 0.5 1.0 2.7 2.7 2.7 20.0
Level 3 0.3 0.5 0.0 0.5 0.0 0.9 2.2
Level 1 99.7 100.0 99.6 98.5 94.2 90.3 82.0
WOMEN Level 2 0.3 0.0 0.4 1.5 5.8 9.1 13.1
Level 3 0.0 0.0 0.0 0.0 0.0 0.6 4.9
Level 1 99.1 99.6 99.3 97.6 95.6 92.8 80.2
TOTAL Level 2 0.8 0.2 0.7 2.1 4.4 6.4 16.0
Level 3 0.2 0.2 0.0 0.2 0.0 0.8 3.8

102
SPAIN
Cont.
USUAL ACTIVITY – Percentage (%) reporting each level of problem
PAIN / DISCOMFORT – Percentage (%) reporting each level of problem
AGE GROUPS 18-29 30-39 40-49 50-59 60-69 70-79 80+
Level 1 95.2 95.4 91.5 86.4 86.9 90.9 73.3
MEN Level 2 4.1 4.2 8.0 11.3 12.6 8.2 24.4
Level 3 0.6 0.5 0.5 2.3 0.5 0.9 2.2
Level 1 97.2 94.6 93.1 85.1 78.9 71.4 59.0
WOMEN Level 2 2.5 5.4 6.5 14.4 20.2 26.0 31.1
Level 3 0.3 0.0 0.4 0.5 0.9 2.6 9.8
Level 1 96.2 95.0 92.4 85.8 82.5 79.5 65.1
TOTAL Level 2 3.3 4.8 7.1 12.8 16.7 18.6 28.3
Level 3 0.5 0.2 0.4 1.4 0.7 1.9 6.6
AGE GROUPS 18-29 30-39 40-49 50-59 60-69 70-79 80+
Level 1 82.9 79.2 78.6 72.9 66.1 59.1 55.6
MEN Level 2 16.5 18.5 19.9 24.4 29.5 37.3 35.6
Level 3 0.6 2.3 1.5 2.7 4.4 3.6 8.9
Level 1 83.6 77.9 68.4 58.2 49.3 54.5 50.8
WOMEN Level 2 16.1 18.8 28.3 35.8 42.2 38.3 32.8
Level 3 0.3 3.3 3.2 6.0 8.5 7.1 16.4
Level 1 83.2 78.5 73.0 65.9 56.9 56.4 52.8
TOTAL Level 2 16.3 18.6 24.6 29.9 36.5 37.9 34.0
Level 3 0.5 2.9 2.5 4.3 6.7 5.7 13.2

103
SPAIN
Cont.
ANXIETY / DEPRESSION – Percentage (%) reporting each level of problem
AGE GROUPS 18-29 30-39 40-49 50-59 60-69 70-79 80+
Level 1 90.2 88.4 88.1 85.9 92.3 92.7 80.0
MEN Level 2 9.5 10.7 10.0 13.2 7.7 7.3 17.8
Level 3 0.3 0.9 2.0 0.9 0.0 0.0 2.2
Level 1 85.0 80.8 79.8 74.0 74.9 71.9 75.4
WOMEN Level 2 14.6 17.5 19.4 20.5 21.5 20.9 16.4
Level 3 0.3 1.7 0.8 5.5 3.6 7.2 8.2
Level 1 87.6 84.4 83.5 80.2 82.7 80.6 77.4
TOTAL Level 2 12.1 14.3 15.2 16.7 15.3 15.2 17.0
Level 3 0.3 1.3 1.3 3.1 2.0 4.2 5.7

104
SWEDEN
Source: Björk et al, 1999; Burström et al, 2001
Tables are based on pooled data from two studies
Number of respondents
EQ VAS† – Mean + Standard Deviation and Median + Percentiles
AGE 18-29 30-39 40-49 50-59 60-69 70-79 80+ TOTAL
GROUPS
MEN 313 380 346 372 237 215 81 1944
WOMEN 277 304 296 333 226 182 41 1659
TOTAL 590 684 642 705 463 397 122 3603
AGE GROUPS 18-29 30-39 40-49 50-59 60-69 70-79 80+
Mean 85.3 87.2 83.9 82.2 83.0 84.2 .
- Std Dev 12.7 14.0 12.5 18.3 16.7 12.8 .
MEN Median 86 90 85 88 89 88 .
- 25th 80 80 75 76 79 70 .
- 75th 95 98 95 96 95 96 .
Mean 83.3 89.8 79.8 84.3 80.4 71.7 .
- Std Dev 17.8 10.8 18.9 18.2 19.4 21.0 .
WOMEN Median 90 92 80 90 85 75 .
- 25th 75 85 70 80 70 55 .
- 75th 95 99 95 98 95 90 .
Mean 84.3 88.5 81.9 83.2 81.8 76.9 .
- Std Dev 15.5 12.5 16.0 18.2 17.9 19.0 .
TOTAL Median 90 90 85 90 89 80 .
- 25th 79 85 75 80 75 60 .
- 75th 95 99 95 96 95 95 .† EQ VAS ratings have been calculated using data from the study by Björk et al only
(Nmen
= 264, Nwomen
= 270, Ntotal
= 534).

105
SWEDEN
Cont.
MOBILITY – Percentage (%) reporting each level of problem
SELF-CARE – Percentage (%) reporting each level of problem
AGE GROUPS 18-29 30-39 40-49 50-59 60-69 70-79 80+
Level 1 97.4 96.5 93.8 89.2 83.3 70.6 56.4
MEN Level 2 2.6 3.5 6.2 10.3 16.2 28.9 43.6
Level 3 0.0 0.0 0.0 0.5 0.4 0.5 0.0
Level 1 98.9 97.3 93.2 89.4 82.9 74.2 51.2
WOMEN Level 2 1.1 2.3 6.8 10.3 17.1 24.7 48.8
Level 3 0.0 0.3 0.0 0.3 0.0 1.1 0.0
Level 1 98.1 96.9 93.5 89.3 83.1 72.2 54.6
TOTAL Level 2 1.9 3.0 6.5 10.3 16.7 27.0 45.4
Level 3 0.0 0.1 0.0 0.4 0.2 0.8 0.0
AGE GROUPS 18-29 30-39 40-49 50-59 60-69 70-79 80+
Level 1 100.0 98.9 99.1 97.6 98.7 98.6 91.0
MEN Level 2 0.0 0.5 0.9 2.2 0.9 1.0 6.4
Level 3 0.0 0.5 0.0 0.3 0.4 0.5 2.6
Level 1 99.3 99.3 98.3 98.2 99.1 92.7 80.0
WOMEN Level 2 0.4 0.3 0.7 1.8 0.9 5.6 17.5
Level 3 0.4 0.3 1.0 0.0 0.0 1.7 2.5
Level 1 99.7 99.1 98.7 97.9 98.9 95.9 87.3
TOTAL Level 2 0.2 0.4 0.8 2.0 0.9 3.1 10.2
Level 3 0.2 0.4 0.5 0.1 0.2 1.0 2.5

106
SWEDEN
Cont.
USUAL ACTIVITY – Percentage (%) reporting each level of problem
PAIN / DISCOMFORT – Percentage (%) reporting each level of problem
AGE GROUPS 18-29 30-39 40-49 50-59 60-69 70-79 80+
Level 1 96.8 94.2 90.9 87.1 89.3 89.4 77.2
MEN Level 2 2.6 4.2 7.1 10.2 9.0 9.6 17.7
Level 3 0.6 1.6 2.1 2.7 1.7 1.0 5.1
Level 1 98.2 96.0 92.9 90.9 93.7 89.3 79.5
WOMEN Level 2 1.1 3.6 5.1 6.0 5.4 7.3 15.4
Level 3 0.7 0.3 2.0 3.0 0.9 3.4 5.1
Level 1 97.4 95.0 91.8 88.9 91.4 89.4 78.0
TOTAL Level 2 1.9 4.0 6.1 8.3 7.2 8.6 16.9
Level 3 0.7 1.0 2.0 2.8 1.3 2.1 5.1
AGE GROUPS 18-29 30-39 40-49 50-59 60-69 70-79 80+
Level 1 67.4 63.1 58.3 51.4 34.1 42.2 25.6
MEN Level 2 31.9 34.7 38.5 44.0 62.5 52.1 70.5
Level 3 0.6 2.1 3.3 4.6 3.4 5.7 3.8
Level 1 76.4 70.9 61.9 54.1 41.3 39.8 32.5
WOMEN Level 2 22.9 28.1 34.4 41.1 57.0 56.3 62.5
Level 3 0.7 1.0 3.7 4.8 1.8 4.0 5.0
Level 1 71.6 66.6 60.0 52.6 37.6 41.1 28.0
TOTAL Level 2 27.7 31.8 36.6 42.6 59.8 54.0 67.8
Level 3 0.7 1.6 3.5 4.7 2.6 4.9 4.2

107
SWEDEN
Cont.
ANXIETY / DEPRESSION – Percentage (%) reporting each level of problem
AGE GROUPS 18-29 30-39 40-49 50-59 60-69 70-79 80+
Level 1 64.1 69.5 70.0 68.1 65.9 71.8 61.5
MEN Level 2 34.3 28.6 29.1 29.2 32.3 27.3 38.5
Level 3 1.6 1.9 0.9 2.7 1.7 1.0 0.0
Level 1 73.5 76.9 74.8 75.2 74.1 74.0 62.5
WOMEN Level 2 25.1 22.1 23.5 23.6 25.5 23.2 37.5
Level 3 1.5 1.0 1.7 1.2 0.5 2.8 0.0
Level 1 68.5 72.8 72.3 71.5 69.9 72.8 61.9
TOTAL Level 2 30.0 25.7 26.5 26.5 29.0 25.4 38.1
Level 3 1.5 1.5 1.3 2.0 1.1 1.8 0.0

108
UNITED KINGDOM
Source: Kind, 1998
Number of respondents
EQ VAS – Mean + Standard Deviation and Median + Percentiles
AGE 18-29 30-39 40-49 50-59 60-69 70-79 80+ TOTAL
GROUPS
MEN 287 301 247 205 212 170 47 1469
WOMEN 387 383 298 258 267 238 95 1926
TOTAL 674 684 545 463 479 408 142 3395
AGE GROUPS 18-29 30-39 40-49 50-59 60-69 70-79 80+
Mean 87.3 86.7 85.4 82.9 78.9 76.5 70.7
- Std Dev 13.9 13.8 14.7 67.3 18.1 17.7 18.6
MEN Median 90 90 90 90 85 80 78
- 25th 80 80 80 70 70 70 58
- 75th 98 95 95 92 93 90 85
Mean 86.9 85.9 84.8 80.0 80.5 74.5 73.3
- Std Dev 13.8 15.2 16.1 18.1 16.9 19.0 18.1
WOMEN Median 90 90 90 85 85 80 75
- 25th 80 80 80 70 75 60 60
- 75th 97 96 95 95 94 90 90
Mean 87.0 86.2 85.1 81.3 79.8 75.3 72.5
- Std Dev 13.8 14.6 15.5 46.8 17.5 18.5 18.2
TOTAL Median 90 90 90 86 85 80 75
- 25th 80 80 80 70 70 65 60
- 75th 98 95 95 95 93 90 88

109
UNITED KINGDOM
Cont.
MOBILITY – Percentage (%) reporting each level of problem
SELF-CARE – Percentage (%) reporting each level of problem
AGE GROUPS 18-29 30-39 40-49 50-59 60-69 70-79 80+
Level 1 94.8 92.0 90.7 74.1 65.4 66.5 54.3
MEN Level 2 5.2 7.7 8.5 25.9 34.6 33.5 45.7
Level 3 0.0 0.3 0.8 0.0 0.0 0.0 0.0
Level 1 95.8 92.4 88.9 81.3 74.9 55.7 37.9
WOMEN Level 2 4.2 7.6 11.1 18.7 25.1 44.3 62.1
Level 3 0.0 0.0 0.0 0.0 0.0 0.0 0.0
Level 1 95.4 92.2 89.7 78.1 70.7 60.2 43.3
TOTAL Level 2 4.6 7.6 9.9 21.9 29.3 39.8 56.7
Level 3 0.0 0.1 0.4 0.0 0.0 0.0 0.0
AGE GROUPS 18-29 30-39 40-49 50-59 60-69 70-79 80+
Level 1 99.0 98.0 96.0 93.7 92.9 92.4 89.1
MEN Level 2 1.0 1.7 4.0 6.3 6.6 7.1 10.9
Level 3 0.0 0.3 0.0 0.0 0.5 0.6 0.0
Level 1 99.2 98.7 95.6 95.7 95.5 92.8 81.1
WOMEN Level 2 0.8 1.3 4.0 4.3 4.5 7.2 17.9
Level 3 0.0 0.0 0.3 0.0 0.0 0.0 1.1
Level 1 99.1 98.4 95.8 94.8 94.3 92.6 83.7
TOTAL Level 2 0.9 1.5 4.0 5.2 5.5 7.1 15.6
Level 3 0.0 0.1 0.2 0.0 0.2 0.2 0.7

110
UNITED KINGDOM
Cont.
USUAL ACTIVITY – Percentage (%) reporting each level of problem
AGE GROUPS 18-29 30-39 40-49 50-59 60-69 70-79 80+
Level 1 91.6 92.7 90.7 75.0 71.1 75.3 58.7
MEN Level 2 7.7 6.3 7.3 18.6 24.2 20.0 34.8
Level 3 0.7 1.0 2.0 6.4 4.7 4.7 6.5
Level 1 94.5 90.3 87.9 80.6 78.6 72.6 54.7
WOMEN Level 2 5.2 9.1 11.1 19.0 19.5 23.6 40.0
Level 3 0.3 0.5 1.0 0.4 1.9 3.8 5.3
Level 1 93.3 91.4 89.2 78.1 75.3 73.7 56.0
TOTAL Level 2 6.3 7.9 9.4 18.8 21.6 22.1 38.3
Level 3 0.4 0.7 1.5 3.0 3.1 4.2 5.7
PAIN / DISCOMFORT – Percentage (%) reporting each level of problem
AGE GROUPS 18-29 30-39 40-49 50-59 60-69 70-79 80+
Level 1 83.6 81.3 76.0 58.5 50.2 49.4 45.7
MEN Level 2 16.4 16.7 21.5 34.6 43.6 44.1 43.5
Level 3 0.0 2.0 2.4 6.8 6.2 6.5 10.9
Level 1 84.2 80.2 72.5 54.5 56.6 40.1 36.8
WOMEN Level 2 15.3 18.5 23.8 40.9 38.2 51.5 52.6
Level 3 0.5 1.3 3.7 4.7 5.2 8.4 10.5
Level 1 83.9 80.7 74.1 56.3 53.8 44.0 39.7
TOTAL Level 2 15.8 17.7 22.8 38.1 40.6 48.4 49.6
Level 3 0.3 1.6 3.1 5.6 5.6 7.6 10.6

111
UNITED KINGDOM
Cont.
ANXIETY / DEPRESSION – Percentage (%) reporting each level of problem
AGE GROUPS 18-29 30-39 40-49 50-59 60-69 70-79 80+
Level 1 89.5 84.7 84.2 74.1 74.4 82.9 82.6
MEN Level 2 9.4 14.0 13.4 23.4 22.3 12.9 15.2
Level 3 1.0 1.3 2.4 2.4 3.3 4.1 2.2
Level 1 84.2 80.9 78.9 71.7 70.0 68.8 71.6
WOMEN Level 2 15.1 18.3 19.8 25.2 27.3 29.5 28.4
Level 3 0.8 0.8 1.3 3.1 2.6 1.7 0.0
Level 1 86.5 82.6 81.3 72.8 72.0 74.7 75.2
TOTAL Level 2 12.6 16.4 16.9 24.4 25.1 22.6 24.1
Level 3 0.9 1.0 1.8 2.8 2.9 2.7 0.7

112
ZIMBABWE
Source: Jelsma, 2003
Number of respondents
EQ VAS – Mean + Standard Deviation and Median + Percentiles
AGE 18-29 30-39 40-49 50-59 60-69 70-79 80+ TOTAL
GROUPS
MEN 313 380 346 372 237 215 81 1944
WOMEN 277 304 296 333 226 182 41 1659
TOTAL 590 684 642 705 463 397 122 3603
AGE GROUPS 18-29 30-39 40-49 50-59 60-69 70-79 80+
Mean 83.0 81.7 77.9 79.0 79.9 65.2 .
- Std Dev 16.1 14.3 19.5 16.5 12.2 17.7 .
MEN Median 90 84 84 84 80 60 .
- 25th 72 70 70 68 80 50 .
- 75th 96 92 92 91 86 76 .
Mean 81.2 78.6 75.8 72.8 64.1 58.3 .
- Std Dev 17.4 16.7 18.9 19.8 17.1 15.5 .
WOMEN Median 88 80 80 76 58 66 .
- 25th 70 70 60 50 50 40 .
- 75th 96 90 90 90 80 72 .
Mean 81.8 79.8 76.6 75.1 70.5 61.5 .
- Std Dev 16.9 15.9 19.1 18.8 17.0 16.2 .
TOTAL Median 90 80 80 80 78 65 .
- 25th 70 70 62 60 50 50 .
- 75th 96 91 90 90 82 72 .

113
ZIMBABWE
Cont.
MOBILITY – Percentage (%) reporting each level of problem
SELF-CARE – Percentage (%) reporting each level of problem
AGE GROUPS 18-29 30-39 40-49 50-59 60-69 70-79 80+
Level 1 96.0 94.2 89.4 85.5 88.9 50.0 .
MEN Level 2 4.0 5.4 10.6 14.5 11.1 50.0 .
Level 3 0.0 0.4 0.0 0.0 0.0 0.0 .
Level 1 92.3 91.9 83.8 65.9 42.3 28.6 .
WOMEN Level 2 7.7 7.9 16.2 34.1 57.7 57.1 .
Level 3 0.0 0.2 0.0 0.0 0.0 14.3 .
Level 1 93.6 92.8 85.8 73.4 61.4 38.5 .
TOTAL Level 2 6.4 6.9 14.2 26.6 38.6 53.8 .
Level 3 0.0 0.3 0.0 0.0 0.0 7.7 .
AGE GROUPS 18-29 30-39 40-49 50-59 60-69 70-79 80+
Level 1 96.2 98.2 90.5 92.7 94.4 100.0 .
MEN Level 2 3.8 1.5 9.5 7.3 5.6 0.0 .
Level 3 0.0 0.4 0.0 0.0 0.0 0.0 .
Level 1 97.5 97.9 98.0 94.3 80.8 57.1 .
WOMEN Level 2 2.4 2.1 2.0 5.7 19.2 28.6 .
Level 3 0.2 0.0 0.0 0.0 0.0 14.3 .
Level 1 97.0 98.0 95.3 93.7 86.4 75.0 .
TOTAL Level 2 2.9 1.8 4.7 6.3 13.6 16.7 .
Level 3 0.1 0.1 0.0 0.0 0.0 8.3 .

114
ZIMBABWE
Cont.
USUAL ACTIVITY – Percentage (%) reporting each level of problem
PAIN / DISCOMFORT – Percentage (%) reporting each level of problem
AGE GROUPS 18-29 30-39 40-49 50-59 60-69 70-79 80+
Level 1 93.5 90.6 81.2 87.3 94.4 83.3 .
MEN Level 2 6.5 8.7 17.6 10.9 5.6 16.7 .
Level 3 0.0 0.7 1.2 1.8 0.0 0.0 .
Level 1 92.2 89.3 85.0 73.6 42.3 42.9 .
WOMEN Level 2 7.4 10.2 15.0 24.1 57.7 42.9 .
Level 3 0.3 0.5 0.0 2.3 0.0 14.3 .
Level 1 92.7 89.8 83.6 78.9 63.6 61.5 .
TOTAL Level 2 7.1 9.6 16.0 19.0 36.4 30.8 .
Level 3 0.2 0.6 0.4 2.1 0.0 7.7 .
AGE GROUPS 18-29 30-39 40-49 50-59 60-69 70-79 80+
Level 1 79.9 74.3 63.5 61.8 61.1 33.3 .
MEN Level 2 17.2 23.9 29.4 38.2 38.9 50.0 .
Level 3 2.9 1.8 7.1 0.0 0.0 16.7 .
Level 1 71.6 69.5 61.7 39.8 30.8 14.3 .
WOMEN Level 2 25.1 25.6 28.6 52.3 57.7 71.4 .
Level 3 3.3 4.9 9.7 8.0 11.5 14.3 .
Level 1 74.7 71.3 62.3 48.3 43.2 23.1 .
TOTAL Level 2 22.2 25.0 28.9 46.9 50.0 61.5 .
Level 3 3.2 3.7 8.8 4.9 6.8 15.4 .
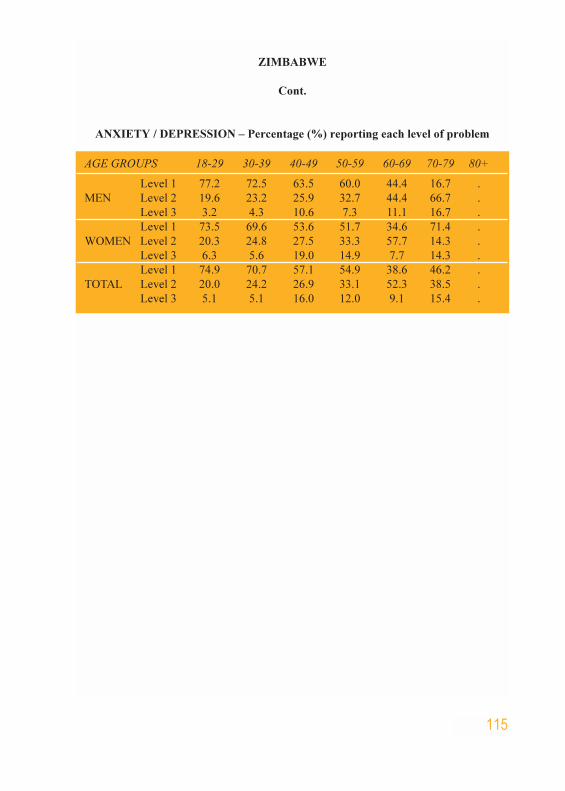
115
ZIMBABWE
Cont.
ANXIETY / DEPRESSION – Percentage (%) reporting each level of problem
AGE GROUPS 18-29 30-39 40-49 50-59 60-69 70-79 80+
Level 1 77.2 72.5 63.5 60.0 44.4 16.7 .
MEN Level 2 19.6 23.2 25.9 32.7 44.4 66.7 .
Level 3 3.2 4.3 10.6 7.3 11.1 16.7 .
Level 1 73.5 69.6 53.6 51.7 34.6 71.4 .
WOMEN Level 2 20.3 24.8 27.5 33.3 57.7 14.3 .
Level 3 6.3 5.6 19.0 14.9 7.7 14.3 .
Level 1 74.9 70.7 57.1 54.9 38.6 46.2 .
TOTAL Level 2 20.0 24.2 26.9 33.1 52.3 38.5 .
Level 3 5.1 5.1 16.0 12.0 9.1 15.4 .