Embed Size (px)
Citation preview
Measuring Resilience as an Education Outcome – Appendix
Danielle Patry and Reuben Ford, Social
Research and Demonstration Corporation
Measuring Resilience as an Education Outcome
Higher Education Quality Council of Ontario 2
Published by
The Higher Education Quality Council of Ontario
1 Yonge Street, Suite 2402 Toronto, ON Canada, M5E 1E5 Phone: (416) 212-3893 Fax: (416) 212-3899 Web: www.heqco.ca E-mail: [email protected]
Cite this publication in the following format:
Patry, D., & Ford, R. (2016). Measuring Resilience as an Education Outcome – Appendix. Toronto: Higher Education Quality Council of Ontario.
The opinions expressed in this research document are those of the authors and do not necessarily represent the views or official policies of the Higher Education Quality Council of Ontario or other agencies or organizations that may have provided support, financial or otherwise, for this project. © Queen’s Printer for Ontario, 2016
Measuring Resilience as an Education Outcome – Appendix
Higher Education Quality Council of Ontario 1
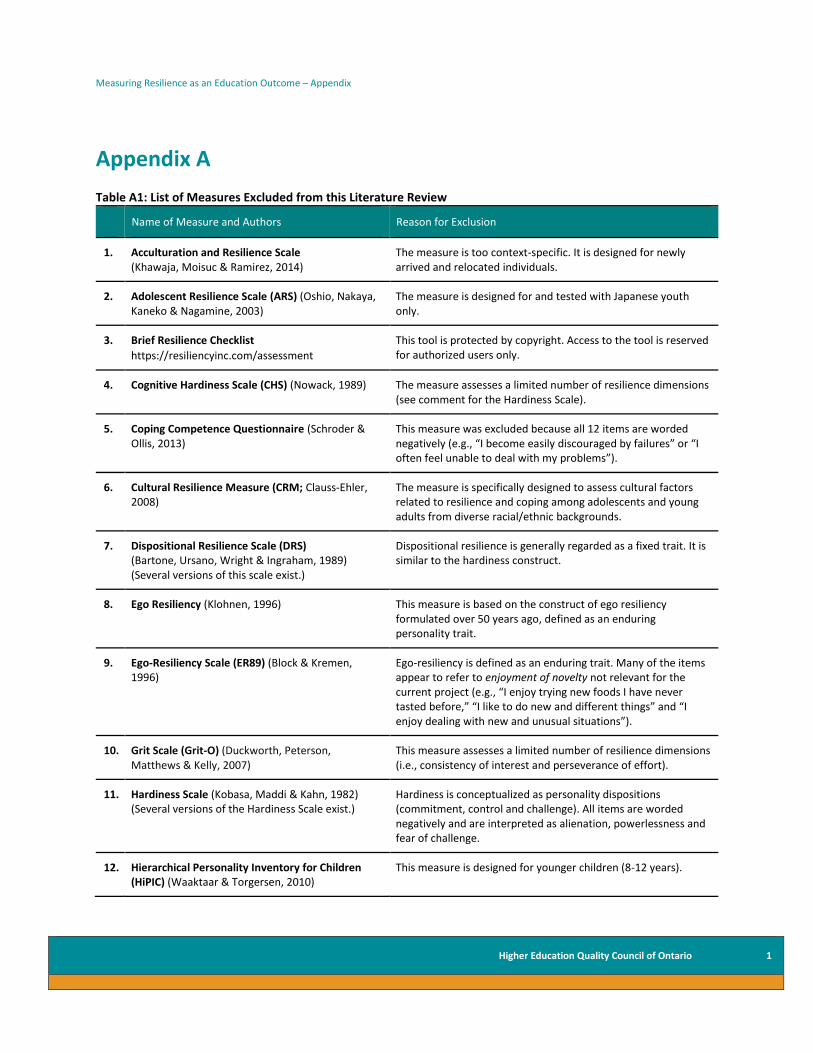
Appendix A Table A1: List of Measures Excluded from this Literature Review
Name of Measure and Authors Reason for Exclusion
1. Acculturation and Resilience Scale (Khawaja, Moisuc & Ramirez, 2014)
The measure is too context-specific. It is designed for newly arrived and relocated individuals.
2. Adolescent Resilience Scale (ARS) (Oshio, Nakaya, Kaneko & Nagamine, 2003)
The measure is designed for and tested with Japanese youth only.
3. Brief Resilience Checklist
https://resiliencyinc.com/assessment
This tool is protected by copyright. Access to the tool is reserved for authorized users only.
4. Cognitive Hardiness Scale (CHS) (Nowack, 1989) The measure assesses a limited number of resilience dimensions (see comment for the Hardiness Scale).
5. Coping Competence Questionnaire (Schroder & Ollis, 2013)
This measure was excluded because all 12 items are worded negatively (e.g., “I become easily discouraged by failures” or “I often feel unable to deal with my problems”).
6. Cultural Resilience Measure (CRM; Clauss-Ehler, 2008)
The measure is specifically designed to assess cultural factors related to resilience and coping among adolescents and young adults from diverse racial/ethnic backgrounds.
7. Dispositional Resilience Scale (DRS) (Bartone, Ursano, Wright & Ingraham, 1989) (Several versions of this scale exist.)
Dispositional resilience is generally regarded as a fixed trait. It is similar to the hardiness construct.
8. Ego Resiliency (Klohnen, 1996)
This measure is based on the construct of ego resiliency formulated over 50 years ago, defined as an enduring personality trait.
9. Ego-Resiliency Scale (ER89) (Block & Kremen, 1996)
Ego-resiliency is defined as an enduring trait. Many of the items appear to refer to enjoyment of novelty not relevant for the current project (e.g., “I enjoy trying new foods I have never tasted before,” “I like to do new and different things” and “I enjoy dealing with new and unusual situations”).
10. Grit Scale (Grit-O) (Duckworth, Peterson, Matthews & Kelly, 2007)
This measure assesses a limited number of resilience dimensions (i.e., consistency of interest and perseverance of effort).
11. Hardiness Scale (Kobasa, Maddi & Kahn, 1982) (Several versions of the Hardiness Scale exist.)
Hardiness is conceptualized as personality dispositions (commitment, control and challenge). All items are worded negatively and are interpreted as alienation, powerlessness and fear of challenge.
12. Hierarchical Personality Inventory for Children (HiPIC) (Waaktaar & Torgersen, 2010)
This measure is designed for younger children (8-12 years).
Measuring Resilience as an Education Outcome – Appendix
Higher Education Quality Council of Ontario 2
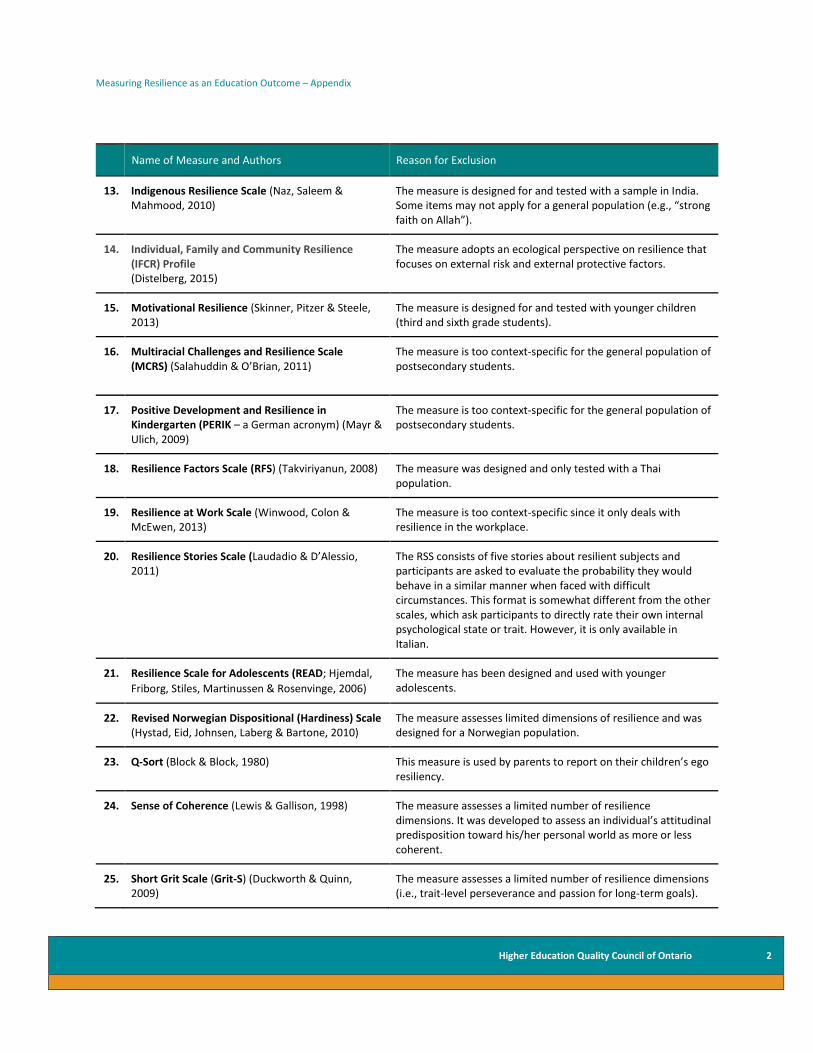
Name of Measure and Authors Reason for Exclusion
13. Indigenous Resilience Scale (Naz, Saleem & Mahmood, 2010)
The measure is designed for and tested with a sample in India. Some items may not apply for a general population (e.g., “strong faith on Allah”).
14. Individual, Family and Community Resilience (IFCR) Profile (Distelberg, 2015)
The measure adopts an ecological perspective on resilience that focuses on external risk and external protective factors.
15. Motivational Resilience (Skinner, Pitzer & Steele, 2013)
The measure is designed for and tested with younger children (third and sixth grade students).
16. Multiracial Challenges and Resilience Scale (MCRS) (Salahuddin & O’Brian, 2011)
The measure is too context-specific for the general population of postsecondary students.
17. Positive Development and Resilience in Kindergarten (PERIK – a German acronym) (Mayr & Ulich, 2009)
The measure is too context-specific for the general population of postsecondary students.
18. Resilience Factors Scale (RFS) (Takviriyanun, 2008) The measure was designed and only tested with a Thai population.
19. Resilience at Work Scale (Winwood, Colon & McEwen, 2013)
The measure is too context-specific since it only deals with resilience in the workplace.
20. Resilience Stories Scale (Laudadio & D’Alessio, 2011)
The RSS consists of five stories about resilient subjects and participants are asked to evaluate the probability they would behave in a similar manner when faced with difficult circumstances. This format is somewhat different from the other scales, which ask participants to directly rate their own internal psychological state or trait. However, it is only available in Italian.
21. Resilience Scale for Adolescents (READ; Hjemdal,
Friborg, Stiles, Martinussen & Rosenvinge, 2006)
The measure has been designed and used with younger adolescents.
22. Revised Norwegian Dispositional (Hardiness) Scale (Hystad, Eid, Johnsen, Laberg & Bartone, 2010)
The measure assesses limited dimensions of resilience and was designed for a Norwegian population.
23. Q-Sort (Block & Block, 1980)
This measure is used by parents to report on their children’s ego resiliency.
24. Sense of Coherence (Lewis & Gallison, 1998)
The measure assesses a limited number of resilience dimensions. It was developed to assess an individual’s attitudinal predisposition toward his/her personal world as more or less coherent.
25. Short Grit Scale (Grit-S) (Duckworth & Quinn, 2009)
The measure assesses a limited number of resilience dimensions (i.e., trait-level perseverance and passion for long-term goals).
Measuring Resilience as an Education Outcome – Appendix
Higher Education Quality Council of Ontario 3
Name of Measure and Authors Reason for Exclusion
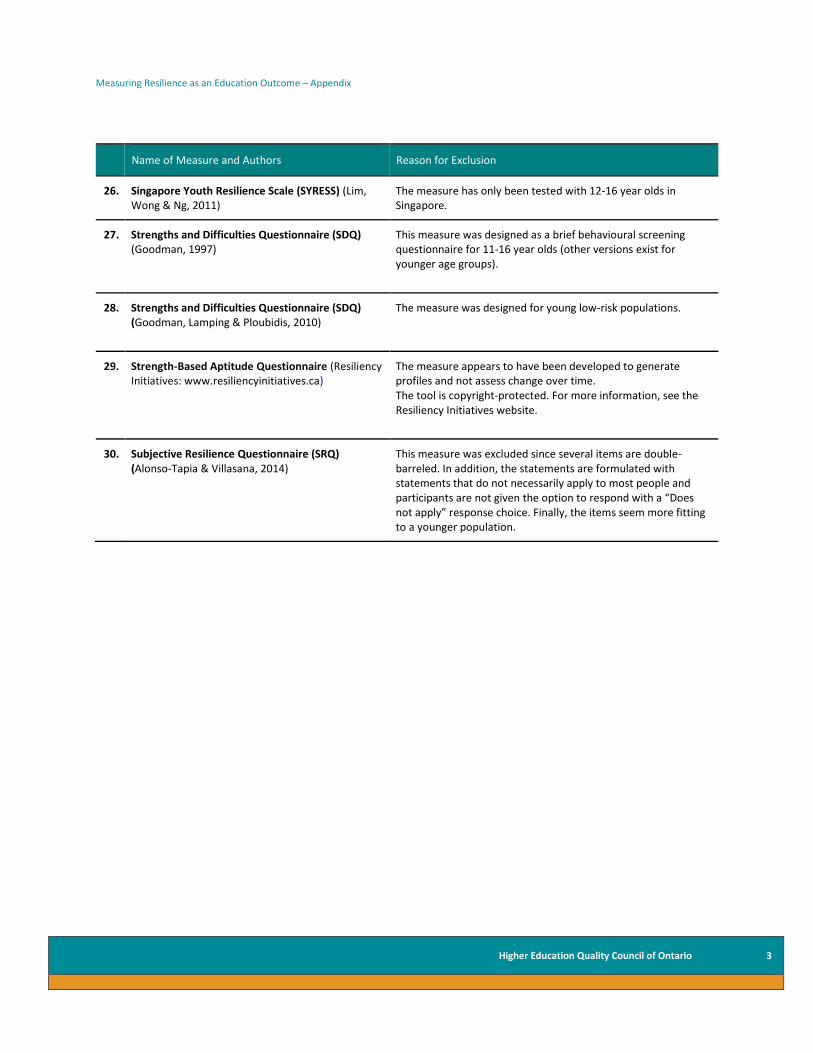
26. Singapore Youth Resilience Scale (SYRESS) (Lim, Wong & Ng, 2011)
The measure has only been tested with 12-16 year olds in Singapore.
27. Strengths and Difficulties Questionnaire (SDQ) (Goodman, 1997)
This measure was designed as a brief behavioural screening questionnaire for 11-16 year olds (other versions exist for younger age groups).
28. Strengths and Difficulties Questionnaire (SDQ) (Goodman, Lamping & Ploubidis, 2010)
The measure was designed for young low-risk populations.
29. Strength-Based Aptitude Questionnaire (Resiliency Initiatives: www.resiliencyinitiatives.ca)
The measure appears to have been developed to generate profiles and not assess change over time. The tool is copyright-protected. For more information, see the Resiliency Initiatives website.
30. Subjective Resilience Questionnaire (SRQ) (Alonso-Tapia & Villasana, 2014)
This measure was excluded since several items are double-barreled. In addition, the statements are formulated with statements that do not necessarily apply to most people and participants are not given the option to respond with a “Does not apply” response choice. Finally, the items seem more fitting to a younger population.
Measuring Resilience as an Education Outcome – Appendix
Higher Education Quality Council of Ontario 4
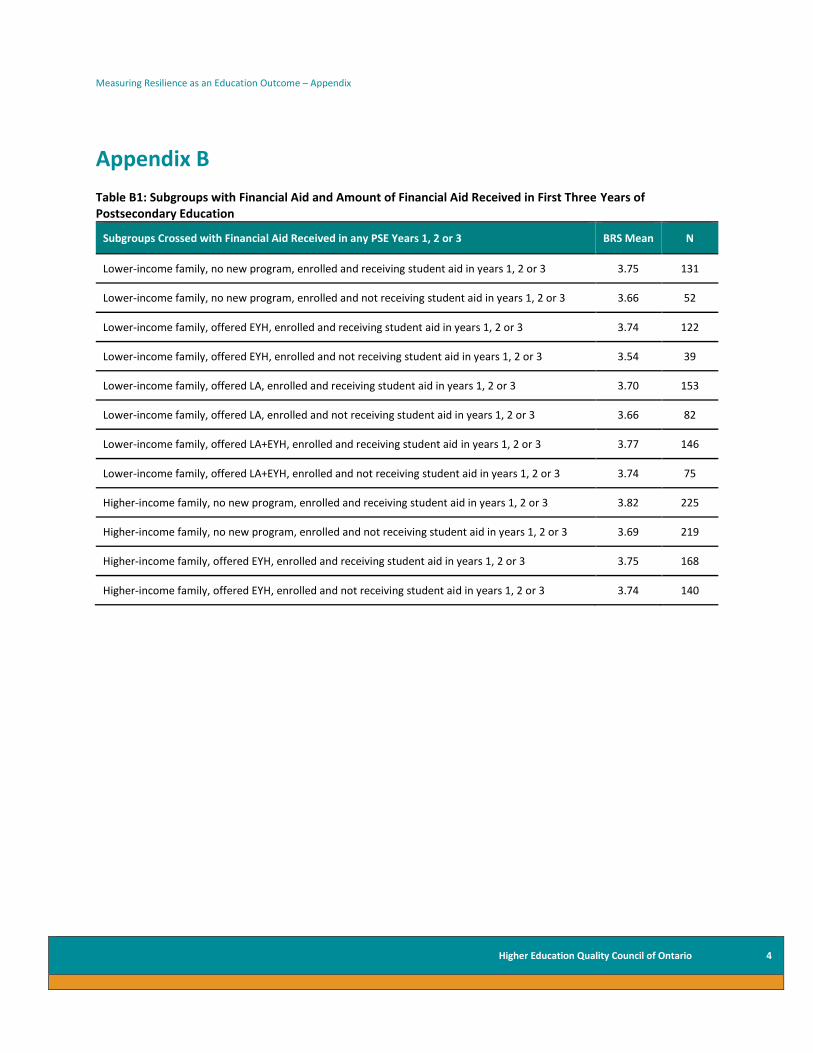
Appendix B Table B1: Subgroups with Financial Aid and Amount of Financial Aid Received in First Three Years of Postsecondary Education
Subgroups Crossed with Financial Aid Received in any PSE Years 1, 2 or 3 BRS Mean N
Lower-income family, no new program, enrolled and receiving student aid in years 1, 2 or 3 3.75 131
Lower-income family, no new program, enrolled and not receiving student aid in years 1, 2 or 3 3.66 52
Lower-income family, offered EYH, enrolled and receiving student aid in years 1, 2 or 3 3.74 122
Lower-income family, offered EYH, enrolled and not receiving student aid in years 1, 2 or 3 3.54 39
Lower-income family, offered LA, enrolled and receiving student aid in years 1, 2 or 3 3.70 153
Lower-income family, offered LA, enrolled and not receiving student aid in years 1, 2 or 3 3.66 82
Lower-income family, offered LA+EYH, enrolled and receiving student aid in years 1, 2 or 3 3.77 146
Lower-income family, offered LA+EYH, enrolled and not receiving student aid in years 1, 2 or 3 3.74 75
Higher-income family, no new program, enrolled and receiving student aid in years 1, 2 or 3 3.82 225
Higher-income family, no new program, enrolled and not receiving student aid in years 1, 2 or 3 3.69 219
Higher-income family, offered EYH, enrolled and receiving student aid in years 1, 2 or 3 3.75 168
Higher-income family, offered EYH, enrolled and not receiving student aid in years 1, 2 or 3 3.74 140
Measuring Resilience as an Education Outcome – Appendix
Higher Education Quality Council of Ontario 5
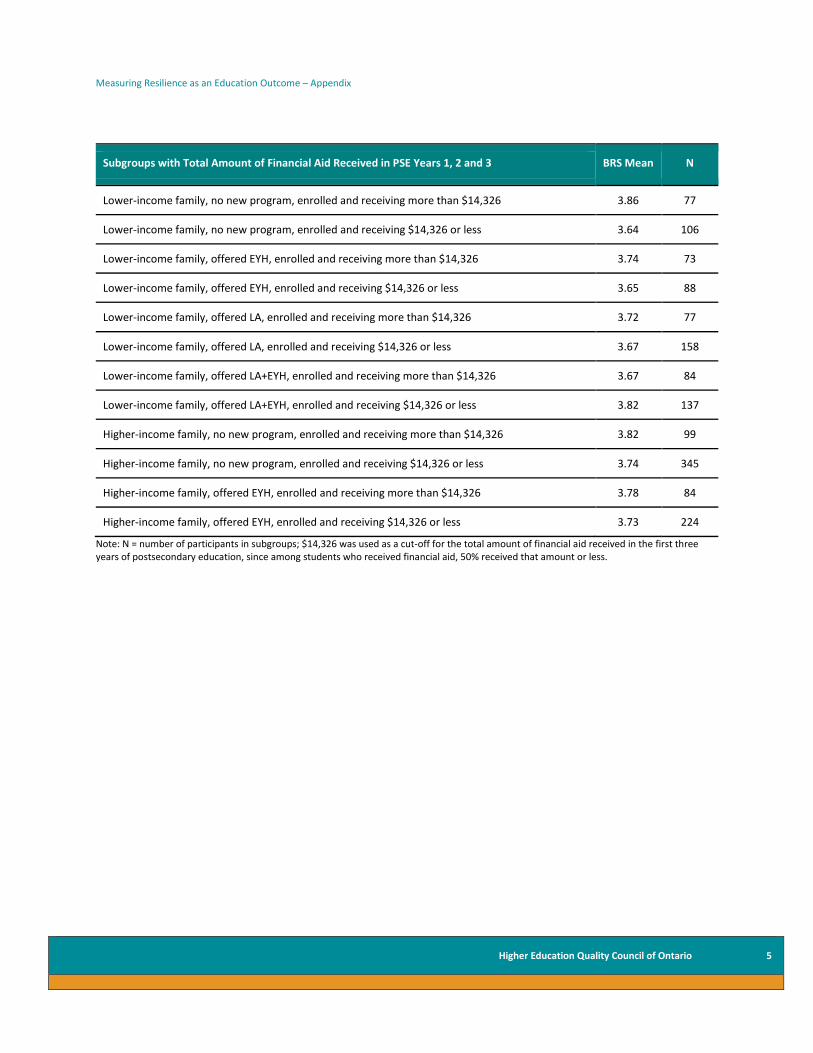
Subgroups with Total Amount of Financial Aid Received in PSE Years 1, 2 and 3 BRS Mean N
Lower-income family, no new program, enrolled and receiving more than $14,326 3.86 77
Lower-income family, no new program, enrolled and receiving $14,326 or less 3.64 106
Lower-income family, offered EYH, enrolled and receiving more than $14,326 3.74 73
Lower-income family, offered EYH, enrolled and receiving $14,326 or less 3.65 88
Lower-income family, offered LA, enrolled and receiving more than $14,326 3.72 77
Lower-income family, offered LA, enrolled and receiving $14,326 or less 3.67 158
Lower-income family, offered LA+EYH, enrolled and receiving more than $14,326 3.67 84
Lower-income family, offered LA+EYH, enrolled and receiving $14,326 or less 3.82 137
Higher-income family, no new program, enrolled and receiving more than $14,326 3.82 99
Higher-income family, no new program, enrolled and receiving $14,326 or less 3.74 345
Higher-income family, offered EYH, enrolled and receiving more than $14,326 3.78 84
Higher-income family, offered EYH, enrolled and receiving $14,326 or less 3.73 224
Note: N = number of participants in subgroups; $14,326 was used as a cut-off for the total amount of financial aid received in the first three years of postsecondary education, since among students who received financial aid, 50% received that amount or less.
Measuring Resilience as an Education Outcome – Appendix
Higher Education Quality Council of Ontario 2
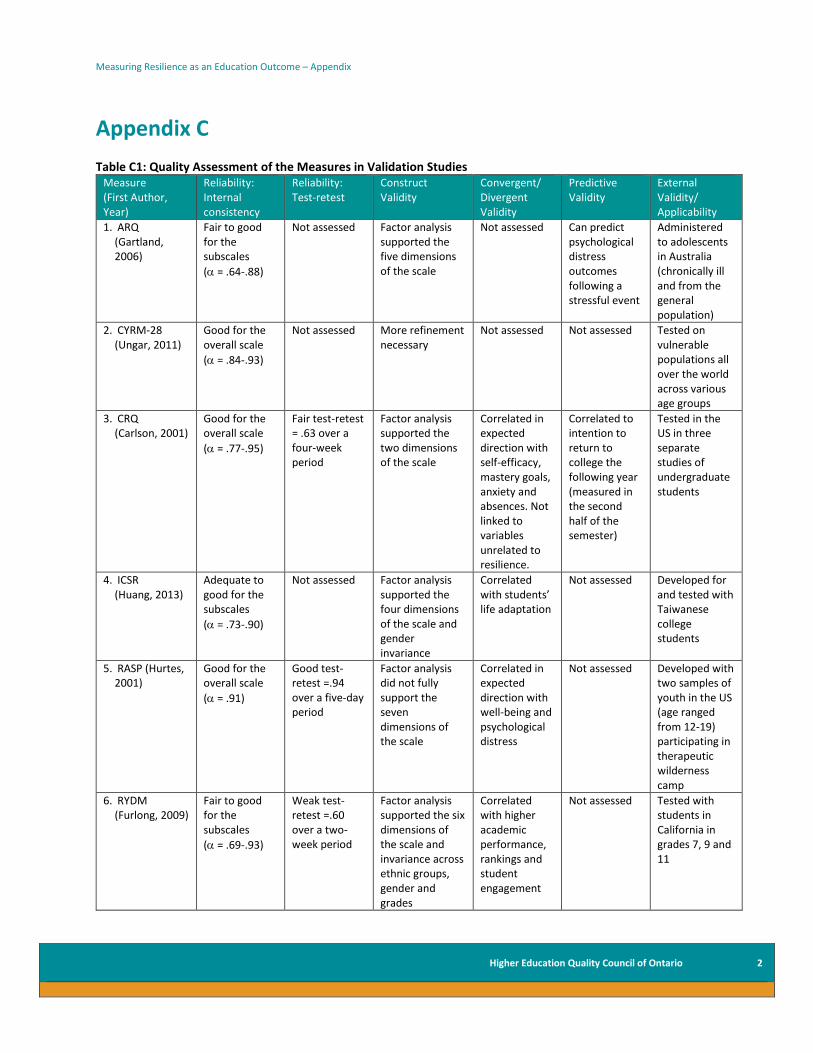
Appendix C Table C1: Quality Assessment of the Measures in Validation Studies
Measure (First Author, Year)
Reliability: Internal consistency
Reliability: Test-retest
Construct Validity
Convergent/ Divergent Validity
Predictive Validity
External Validity/ Applicability
1. ARQ (Gartland, 2006)
Fair to good for the subscales
( = .64-.88)
Not assessed Factor analysis supported the five dimensions of the scale
Not assessed Can predict psychological distress outcomes following a stressful event
Administered to adolescents in Australia (chronically ill and from the general population)
2. CYRM-28 (Ungar, 2011)
Good for the overall scale
( = .84-.93)
Not assessed More refinement necessary
Not assessed Not assessed Tested on vulnerable populations all over the world across various age groups
3. CRQ (Carlson, 2001)
Good for the overall scale
( = .77-.95)
Fair test-retest = .63 over a four-week period
Factor analysis supported the two dimensions of the scale
Correlated in expected direction with self-efficacy, mastery goals, anxiety and absences. Not linked to variables unrelated to resilience.
Correlated to intention to return to college the following year (measured in the second half of the semester)
Tested in the US in three separate studies of undergraduate students
4. ICSR (Huang, 2013)
Adequate to good for the subscales
( = .73-.90)
Not assessed Factor analysis supported the four dimensions of the scale and gender invariance
Correlated with students’ life adaptation
Not assessed Developed for and tested with Taiwanese college students
5. RASP (Hurtes, 2001)
Good for the overall scale
( = .91)
Good test-retest =.94 over a five-day period
Factor analysis did not fully support the seven dimensions of the scale
Correlated in expected direction with well-being and psychological distress
Not assessed Developed with two samples of youth in the US (age ranged from 12-19) participating in therapeutic wilderness camp
6. RYDM (Furlong, 2009)
Fair to good for the subscales
( = .69-.93)
Weak test-retest =.60 over a two-week period
Factor analysis supported the six dimensions of the scale and invariance across ethnic groups, gender and grades
Correlated with higher academic performance, rankings and student engagement
Not assessed Tested with students in California in grades 7, 9 and 11
Measuring Resilience as an Education Outcome – Appendix
Higher Education Quality Council of Ontario 3
Measure (First Author, Year)
Reliability: Internal consistency
Reliability: Test-retest
Construct Validity
Convergent/ Divergent Validity
Predictive Validity
External Validity/ Applicability
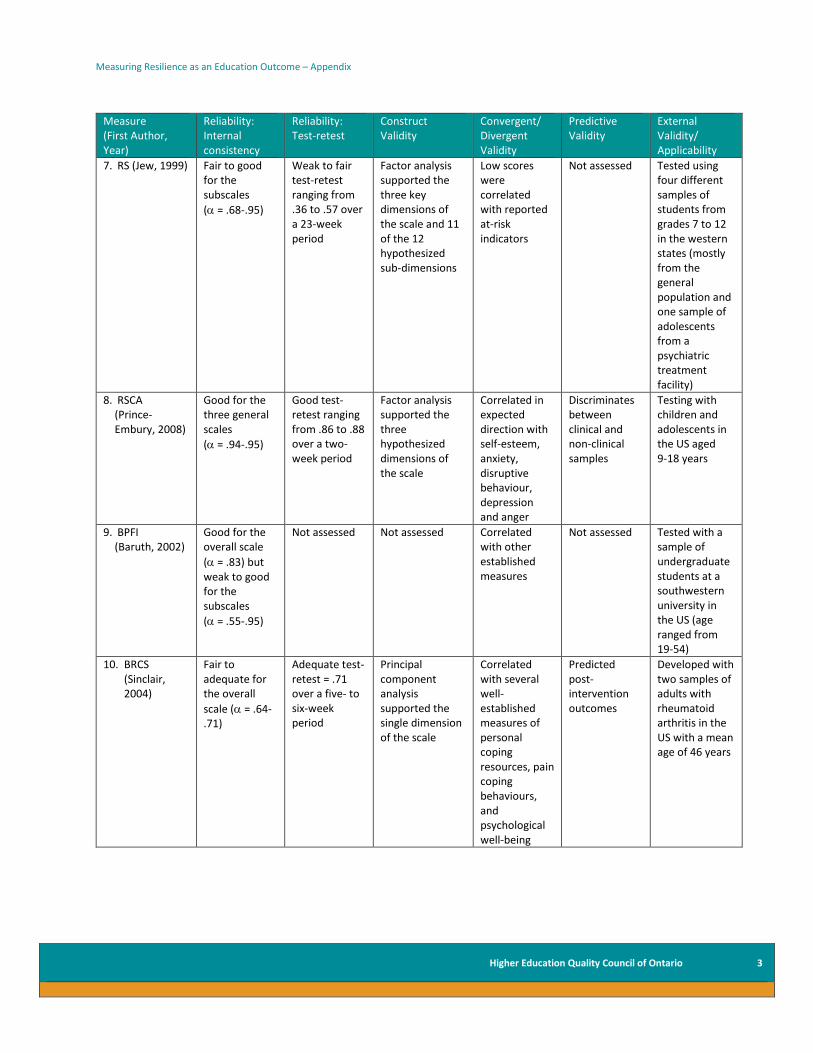
7. RS (Jew, 1999) Fair to good for the subscales
( = .68-.95)
Weak to fair test-retest ranging from .36 to .57 over a 23-week period
Factor analysis supported the three key dimensions of the scale and 11 of the 12 hypothesized sub-dimensions
Low scores were correlated with reported at-risk indicators
Not assessed Tested using four different samples of students from grades 7 to 12 in the western states (mostly from the general population and one sample of adolescents from a psychiatric treatment facility)
8. RSCA (Prince-Embury, 2008)
Good for the three general scales
( = .94-.95)
Good test-retest ranging from .86 to .88 over a two-week period
Factor analysis supported the three hypothesized dimensions of the scale
Correlated in expected direction with self-esteem, anxiety, disruptive behaviour, depression and anger
Discriminates between clinical and non-clinical samples
Testing with children and adolescents in the US aged 9-18 years
9. BPFI (Baruth, 2002)
Good for the overall scale
( = .83) but weak to good for the subscales
( = .55-.95)
Not assessed Not assessed Correlated with other established measures
Not assessed Tested with a sample of undergraduate students at a southwestern university in the US (age ranged from 19-54)
10. BRCS (Sinclair, 2004)
Fair to adequate for the overall
scale ( = .64-.71)
Adequate test-retest = .71 over a five- to six-week period
Principal component analysis supported the single dimension of the scale
Correlated with several well-established measures of personal coping resources, pain coping behaviours, and psychological well-being
Predicted post-intervention outcomes
Developed with two samples of adults with rheumatoid arthritis in the US with a mean age of 46 years
Measuring Resilience as an Education Outcome – Appendix
Higher Education Quality Council of Ontario 4
Measure (First Author, Year)
Reliability: Internal consistency
Reliability: Test-retest
Construct Validity
Convergent/ Divergent Validity
Predictive Validity
External Validity/ Applicability
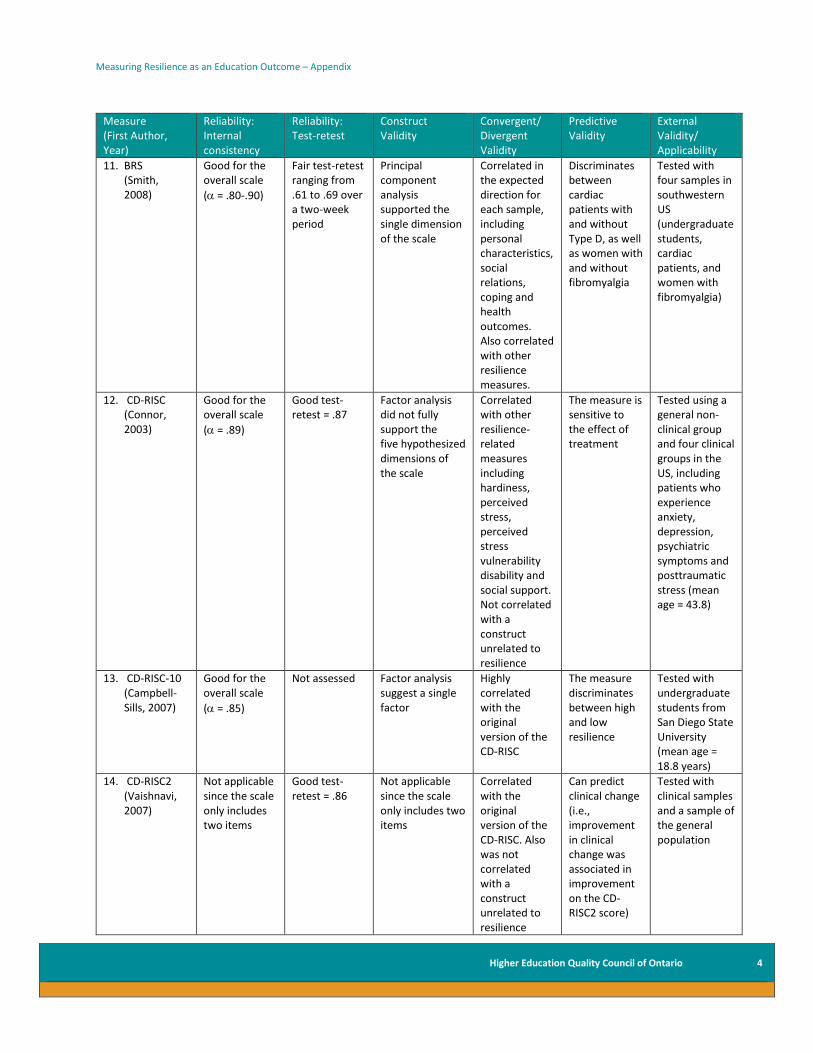
11. BRS (Smith, 2008)
Good for the overall scale
( = .80-.90)
Fair test-retest ranging from .61 to .69 over a two-week period
Principal component analysis supported the single dimension of the scale
Correlated in the expected direction for each sample, including personal characteristics, social relations, coping and health outcomes. Also correlated with other resilience measures.
Discriminates between cardiac patients with and without Type D, as well as women with and without fibromyalgia
Tested with four samples in southwestern US (undergraduate students, cardiac patients, and women with fibromyalgia)
12. CD-RISC (Connor, 2003)
Good for the overall scale
( = .89)
Good test-retest = .87
Factor analysis did not fully support the five hypothesized dimensions of the scale
Correlated with other resilience-related measures including hardiness, perceived stress, perceived stress vulnerability disability and social support. Not correlated with a construct unrelated to resilience
The measure is sensitive to the effect of treatment
Tested using a general non-clinical group and four clinical groups in the US, including patients who experience anxiety, depression, psychiatric symptoms and posttraumatic stress (mean age = 43.8)
13. CD-RISC-10 (Campbell-Sills, 2007)
Good for the overall scale
( = .85)
Not assessed Factor analysis suggest a single factor
Highly correlated with the original version of the CD-RISC
The measure discriminates between high and low resilience
Tested with undergraduate students from San Diego State University (mean age = 18.8 years)
14. CD-RISC2 (Vaishnavi, 2007)
Not applicable since the scale only includes two items
Good test-retest = .86
Not applicable since the scale only includes two items
Correlated with the original version of the CD-RISC. Also was not correlated with a construct unrelated to resilience
Can predict clinical change (i.e., improvement in clinical change was associated in improvement on the CD-RISC2 score)
Tested with clinical samples and a sample of the general population
Measuring Resilience as an Education Outcome – Appendix
Higher Education Quality Council of Ontario 5
Measure (First Author, Year)
Reliability: Internal consistency
Reliability: Test-retest
Construct Validity
Convergent/ Divergent Validity
Predictive Validity
External Validity/ Applicability
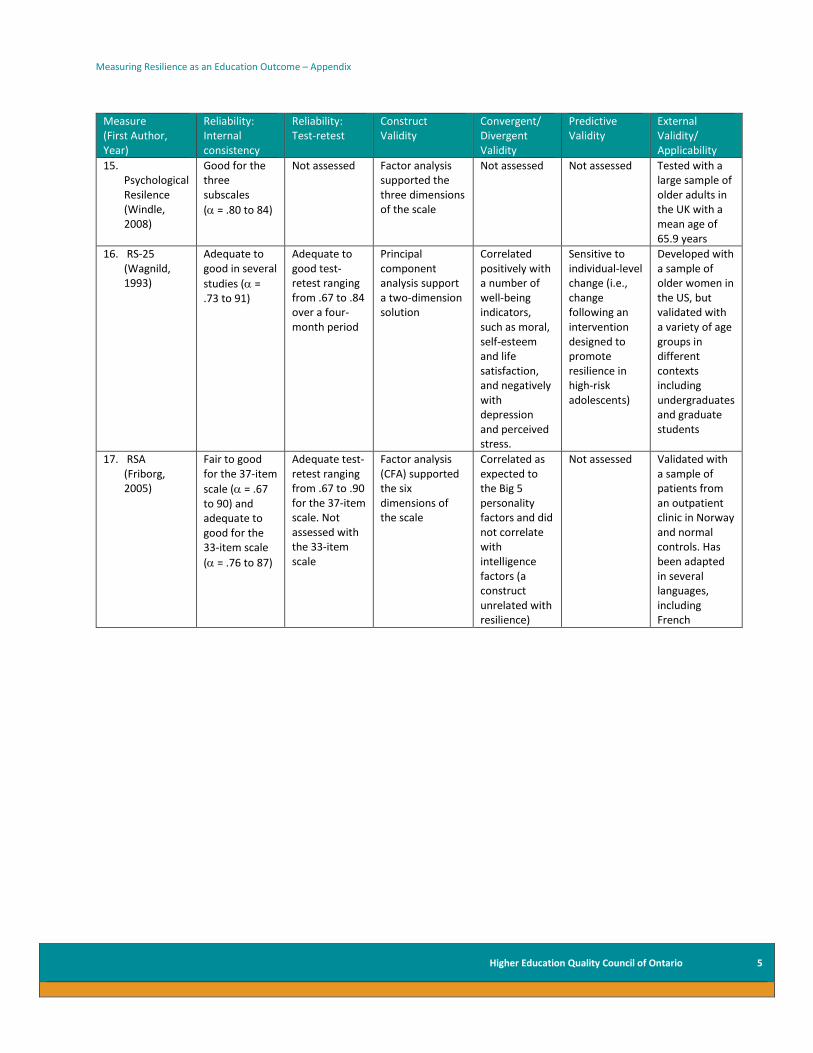
15. Psychological Resilence (Windle, 2008)
Good for the three subscales
( = .80 to 84)
Not assessed Factor analysis supported the three dimensions of the scale
Not assessed Not assessed Tested with a large sample of older adults in the UK with a mean age of 65.9 years
16. RS-25 (Wagnild, 1993)
Adequate to good in several
studies ( = .73 to 91)
Adequate to good test-retest ranging from .67 to .84 over a four-month period
Principal component analysis support a two-dimension solution
Correlated positively with a number of well-being indicators, such as moral, self-esteem and life satisfaction, and negatively with depression and perceived stress.
Sensitive to individual-level change (i.e., change following an intervention designed to promote resilience in high-risk adolescents)
Developed with a sample of older women in the US, but validated with a variety of age groups in different contexts including undergraduates and graduate students
17. RSA (Friborg, 2005)
Fair to good for the 37-item
scale ( = .67 to 90) and adequate to good for the 33-item scale
( = .76 to 87)
Adequate test-retest ranging from .67 to .90 for the 37-item scale. Not assessed with the 33-item scale
Factor analysis (CFA) supported the six dimensions of the scale
Correlated as expected to the Big 5 personality factors and did not correlate with intelligence factors (a construct unrelated with resilience)
Not assessed Validated with a sample of patients from an outpatient clinic in Norway and normal controls. Has been adapted in several languages, including French