Embed Size (px)
Citation preview

Measuring RecyclingA Guide for State and LocalGovernments
United States Environmental Protection Agency
EPA530-R-97-011September 1997http://www.epa.gov
1EPA
Solid Wasteand Emergency Response(5306W)
2Printed on paper that contains at least 20 percent postconsumer fiber.
Measuring RecyclingA Guide for State and Local
Governments
List of Tables . . . . . . . . . . . . . . . . . . . . . . . . . . . . . . . . . . . . . . . . . . . . . .iii
About This Guide . . . . . . . . . . . . . . . . . . . . . . . . . . . . . . . . . . . . . . . . . . .v
Acknowledgments . . . . . . . . . . . . . . . . . . . . . . . . . . . . . . . . . . . . . . . . .vii
Section 1 Introduction . . . . . . . . . . . . . . . . . . . . . . . . . . . . . . . . . . . . .1
Section 2 Elements of Standardization . . . . . . . . . . . . . . . . . . . . . . . .5
Standard elements . . . . . . . . . . . . . . . . . . . . . . . . . . . . . . . . . . . . . . . . . . . . .6
Flexible elements . . . . . . . . . . . . . . . . . . . . . . . . . . . . . . . . . . . . . . . . . . . . . .7
Section 3 Planning . . . . . . . . . . . . . . . . . . . . . . . . . . . . . . . . . . . . . . . .15
Define your program goals . . . . . . . . . . . . . . . . . . . . . . . . . . . . . . . . . . . . . .15
Determine if useful data are already being collected . . . . . . . . . . . . . . . . . . . .16
Ascertain your authority to survey and collect data . . . . . . . . . . . . . . . . . . . .16
Determine who will collect recycling measurement data . . . . . . . . . . . . . . . . .17
Decide on reporting requirements . . . . . . . . . . . . . . . . . . . . . . . . . . . . . . . . .18
Establish program staff and budget . . . . . . . . . . . . . . . . . . . . . . . . . . . . . . . .19
Establish a timeframe for system development . . . . . . . . . . . . . . . . . . . . . . . .19
Section 4 Design . . . . . . . . . . . . . . . . . . . . . . . . . . . . . . . . . . . . . . . . .23
Learn about your terrain . . . . . . . . . . . . . . . . . . . . . . . . . . . . . . . . . . . . . . .23
Solicit input into the design of your system . . . . . . . . . . . . . . . . . . . . . . . . . .25
Determine what type of information is needed . . . . . . . . . . . . . . . . . . . . . . .25
Determine whom to survey . . . . . . . . . . . . . . . . . . . . . . . . . . . . . . . . . . . . .26
Address confidentiality guarantees . . . . . . . . . . . . . . . . . . . . . . . . . . . . . . . . .33
Determine how to manage and analyze the information . . . . . . . . . . . . . . . . .33
iContents
Contents
Contentsii
Section 5 Implementation . . . . . . . . . . . . . . . . . . . . . . . . . . . . . . . . . .37
Institute measures to increase your survey response rate . . . . . . . . . . . . . . . .37
Educate survey respondents . . . . . . . . . . . . . . . . . . . . . . . . . . . . . . . . . . . . .38
Distribute survey forms . . . . . . . . . . . . . . . . . . . . . . . . . . . . . . . . . . . . . . . .39
Maintain frequent communication with survey respondents . . . . . . . . . . . . . . .40
Compile data and calculate an MSW recycling rate . . . . . . . . . . . . . . . . . . . . .41
Verify and double-check data . . . . . . . . . . . . . . . . . . . . . . . . . . . . . . . . . . . .43
Share information . . . . . . . . . . . . . . . . . . . . . . . . . . . . . . . . . . . . . . . . . . . .44
Section 6 Enhancement . . . . . . . . . . . . . . . . . . . . . . . . . . . . . . . . . . .45
Expand or change data collection efforts . . . . . . . . . . . . . . . . . . . . . . . . . . . .45
Refine and modify the survey forms . . . . . . . . . . . . . . . . . . . . . . . . . . . . . . .45
Consider measuring source reduction . . . . . . . . . . . . . . . . . . . . . . . . . . . . . .46
Take advantage of electronic reporting . . . . . . . . . . . . . . . . . . . . . . . . . . . . . .46
Appendices
Appendix A: Glossary . . . . . . . . . . . . . . . . . . . . . . . . . . . . . . . . . . . . . . .49
Appendix B: Standard Volume-to-Weight Conversion Factors . . . . . . .59
Appendix C: Survey Forms . . . . . . . . . . . . . . . . . . . . . . . . . . . . . . . . . .63
Appendix D: Recycling Rate Worksheets . . . . . . . . . . . . . . . . . . . . . . .107
Appendix E: Resources . . . . . . . . . . . . . . . . . . . . . . . . . . . . . . . . . . . . .137
Appendix F: Sample Language for Freedom of Information . . . . . . . .143Act Exemption
Appendix G: Sample Cover Letters . . . . . . . . . . . . . . . . . . . . . . . . . . .145
Appendix H: Adjusting Waste Generation . . . . . . . . . . . . . . . . . . . . . .149
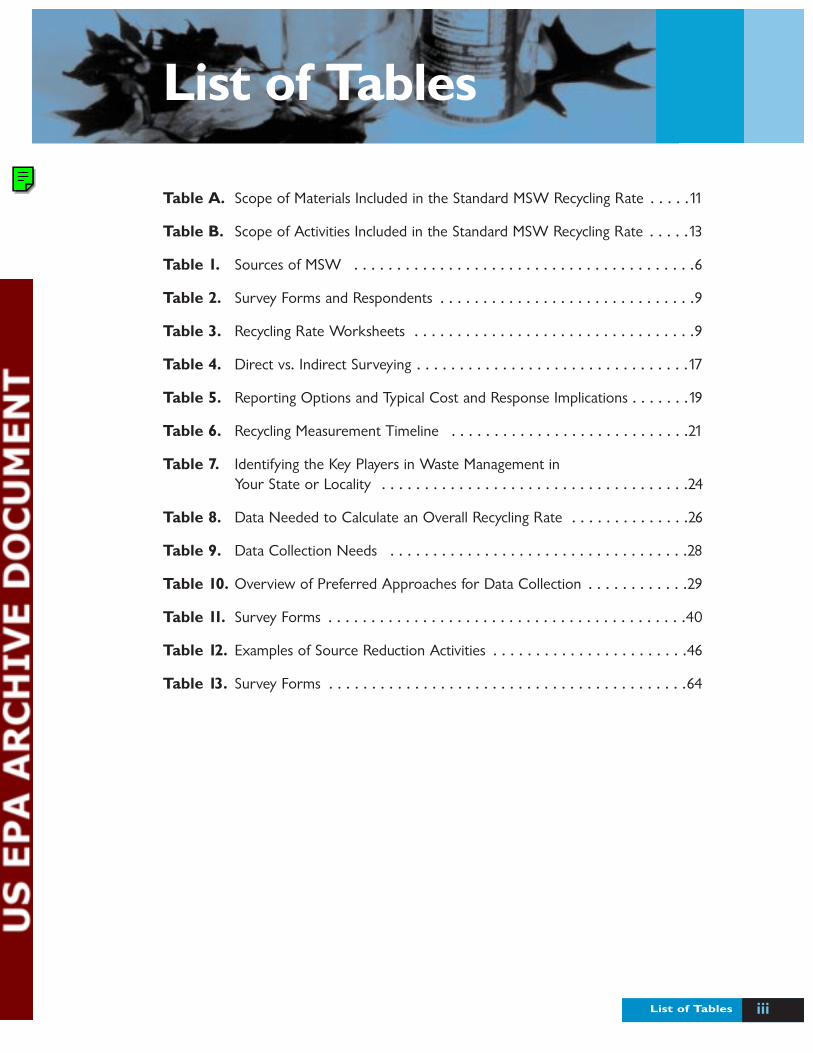
iiiList of Tables
Table A. Scope of Materials Included in the Standard MSW Recycling Rate . . . . .11
Table B. Scope of Activities Included in the Standard MSW Recycling Rate . . . . .13
Table 1. Sources of MSW . . . . . . . . . . . . . . . . . . . . . . . . . . . . . . . . . . . . . . . .6
Table 2. Survey Forms and Respondents . . . . . . . . . . . . . . . . . . . . . . . . . . . . . .9
Table 3. Recycling Rate Worksheets . . . . . . . . . . . . . . . . . . . . . . . . . . . . . . . . .9
Table 4. Direct vs. Indirect Surveying . . . . . . . . . . . . . . . . . . . . . . . . . . . . . . . .17
Table 5. Reporting Options and Typical Cost and Response Implications . . . . . . .19
Table 6. Recycling Measurement Timeline . . . . . . . . . . . . . . . . . . . . . . . . . . . .21
Table 7. Identifying the Key Players in Waste Management in Your State or Locality . . . . . . . . . . . . . . . . . . . . . . . . . . . . . . . . . . . .24
Table 8. Data Needed to Calculate an Overall Recycling Rate . . . . . . . . . . . . . .26
Table 9. Data Collection Needs . . . . . . . . . . . . . . . . . . . . . . . . . . . . . . . . . . .28
Table 10. Overview of Preferred Approaches for Data Collection . . . . . . . . . . . .29
Table 11. Survey Forms . . . . . . . . . . . . . . . . . . . . . . . . . . . . . . . . . . . . . . . . . .40
Table 12. Examples of Source Reduction Activities . . . . . . . . . . . . . . . . . . . . . . .46
Table 13. Survey Forms . . . . . . . . . . . . . . . . . . . . . . . . . . . . . . . . . . . . . . . . . .64
List of Tables
vAbout This Guide
This guide is designed to help state and local
agencies measure municipal solid waste (MSW)
recycling. It contains instructions, definitions, case
studies, tips, forms, and worksheets to help calculate an
MSW recycling rate. Information is provided to help track
broad categories of recycled materials and commodity-
specific categories, if desired. All features of the guide,
including the survey forms and worksheets, can be used by
both state and local governments that measure recycling.
For more information, or to order documents on
issues related to recycling measurement, call the
U.S. Environmental Protection Agency’s RCRA/Superfund
Hotline at 800 424-9346.
About This Guide
viiAcknowledgments
Council of State GovernmentsLaura Kliewer Foster, Midwestern Office
Ellen Pratt, Northeast Recycling Council
Peer Review GroupKip Eagles, Washington Department ofEcology
Tony Hainault, Minnesota Office ofEnvironmental Assistance
Carl Hursh, Pennsylvania Department ofEnvironmental Protection
Mark Lennon, New Hampshire Departmentof Environmental Services
Edgar Miller, National Recycling Coalition
Seth Phillips and Sharon Edgar, MichiganDepartment of Environmental Quality
Woody Raine and Bill Carter, Texas NaturalResources Conservation Commission
Joan Rohlfs, Metropolitan WashingtonCouncil of Governments
Focus GroupHarry Benson, Wellman, Inc.
Tim Breneisen, Lancaster County Solid WasteManagement Authority, Pennsylvania
Phil Carnevale, Schiavone-Bonomo
Pablo Collins, The Davidson Colling Group
Robert Davis, Browning-Ferris Industries
Michael Poland, Environmental Recycling, Inc.
Bob Reichard, Laidlaw Waste Systems
Carlos Rovelo, Rock-Tenn Company
Nathan Tyler, Glass Packaging Institute
Acknowledgments
Many state and local officials, solid waste profes-
sionals, and recycling experts with extensive expe-
rience in the recycling measurement field
contributed to the development of this guide. The guide
also builds upon work initiated by the State Data Collection
Project, conducted from 1992 through 1994 by the
Council of State Governments under a grant from the
U.S. Environmental Protection Agency (EPA).
EPA would like to thank the following individuals for their
assistance in developing this guide:
Acknowledgmentsviii
National Recycling CoalitionWorkshopNancy Carr, California Integrated WasteManagement Board
Ron Henricks, Florida Department ofEnvironmental Protection
Mitra Khazi, Indiana Department ofEnvironmental Management
Peter Spendaloe, Oregon Department ofEnvironmental Quality
Vicki Viens, Vermont Department ofEnvironmental Conservation
Other State and Local GovernmentRepresentatives Who AssistedDave Benke, Minnesota Office ofEnvironmental Assistance
Ann Bernstein, Minnesota Office ofEnvironmental Assistance
Esther Bowring, Montgomery County,Maryland, Department of EnvironmentalProtection
William Colden, New York Department ofEnvironmental Conservation
Gerry Geiger, Indiana Department ofEnvironmental Management
Rodney Glotfelty, Garrett County, Maryland,Office of Solid Waste and Recycling
Karen Harrington, Minnesota Office ofEnvironmental Assistance
Ed Harris, Fairfax County, Virginia,Department of Public Works
Judy Henderson, Oregon Department ofEnvironmental Quality
Suzanne Laland, Onondaga County, NewYork, Resource Recovery Agency
Virginia Lipscomb, Maryland Department ofthe Environment
Jacquie Moon, Oregon Department ofEnvironmental Quality
Raymond Moreau, Florida Department ofEnvironmental Protection
Scott Mouw, North Carolina Office of WasteReduction
Kerry Overlee, Mecklenberg County, NorthCarolina, Department of Engineering andBuilding Standards
Lynn Schramel, Monroe County, New York,Department of Environmental Services
Caroline Smith, Anoka County, Minnesota,Integrated Waste Management Unit
Phil Spranger, Wisconsin Department ofNatural Resources
David White, Ohio Environmental ProtectionAgency
In recent years, many state andlocal governments have set recy-cling goals and implementedsystems for determining theirprogress in meeting those goals. Asof 1993, approximately 40 stateswere collecting and maintainingdata on recycling; 26 of these calcu-lated an actual recycling rate.1
“Measuring recycling” typicallyentails surveying generators, collectors, processors, and endusers of MSW and recyclables tocollect data on one or more of thefollowing:
■ Overall tonnages of municipalwaste discarded and materialsrecycled.
■ Tonnages of broad categories of materials, such as paper, recycled.
■ Tonnages of specific categoriesof materials, such as newsprint,recycled.
Recycling measurement is dif-ferent from the measurement ofwaste diversion in that data are col-lected on the amount of materialsrecycled or composted rather thanon the amount of disposed solidwaste.
Currently, not everyone definesrecycling or the processes that con-stitute recycling in the same way.Definitions of MSW also vary.There is no standard approach forhow or where to collect the neededdata. The methods used to calcu-late a recycling rate also differ fromone area to another. All of these fac-tors can make it difficult to collectand analyze data and to compare
the effectiveness of recycling pro-grams from one region to another.
From 1992 to 1994, the Councilof State Governments conductedthe State Data Collection projectunder a U.S. EnvironmentalProtection Agency (EPA) grant.The project identified current andfuture state plans for data collec-tion and opportunities for consis-tency in recycling measurement.The project concluded that auniform, national method formeasuring recycling rates be devel-oped. Subsequent interviews withstate officials indicated states areopen to switching to a standard
1Introduction
Recycling is an important part of integrated solid
waste management (ISWM)—the complementary
use of source reduction, recycling, combustion,
and landfilling to manage municipal solid waste (MSW). In
the ISWM hierarchy, recycling (including composting) is the
preferred waste management option, after source reduc-
tion, to reduce potential risks to human health and the
environment, divert wastes from landfills and combustors,
conserve energy, and slow the depletion of nonrenewable
natural resources. This guide can help you measure your
progress in recycling and promote consistency among
states and localities.
1Council of State Governments. 1993. DataCollection for Recyclable Materials Collection andMarketing: Interim Report.
SE
CT
ION
1Introduction
Section 12
national system if the newapproach gives them flexibility andguidance on important data collec-tion and measurement issues.Moreover, state officials bound totheir existing data collection sys-tems, generally due to legislatedrequirements, indicated they werewilling to recalculate their recy-cling rate using a standardmethodology if one were devel-oped. Officials in states that do notcurrently collect data indicated thatthe development of standard recy-cling measurement techniquescould assist in convincing decision-makers to support future data col-lection efforts and would providean off-the-shelf tool for creating arecycling measurement program.As a result of these conclusions,EPA worked with state and localofficials to develop this recyclingmeasurement guide.
This guide is designed to helppromote consistency in the wayrecycling data are collected, mea-sured, and reported by state andlocal governments. In order toachieve uniformity and addresswide variations in what is countedas MSW and recycling from onearea to another, a standard scope ofmaterials to be measured is need-ed. EPA reviewed a wide range ofscopes when developing the stan-dard measurement methodologypresented in this guide. The select-ed scope relies on EPA’s historicaldefinition of MSW as contained inthe EPA report, Characterization ofMunicipal Solid Waste in the UnitedStates. This scope was chosenbecause it is broadly accepted andunderstood, the data are familiarand accessible throughout the 50states, and default values can beextracted from the report if mea-surers have incomplete data. Forpractical purposes, the standard
scope is wholly consistent with thedefinitions and distinctions madein this report.
Not all types of solid waste areincluded in the scope. Variousitems, including construction anddemolition debris, manufacturingwaste, and overissue newspapersto name a few, are excluded fromthe standard scope. Althoughrecovery of these materials is notfactored into the standard calcula-tion used to determine a recyclingrate, EPA encourages state andlocal governments to continue theirefforts to promote the recycling ofthese items. In addition, space forcollecting these data is provided onthe survey forms included withthis guide, which are designed tohelp obtain data on MSW disposaland recycling.
For those agencies desiring toperform recycling measurementfor the first time, this guide pro-vides a straightforward, cost-effec-tive, and standardized system forcompiling and calculating the nec-essary data. A step-by-step processfor developing a recycling mea-surement program is outlined,complete with tips and case stud-ies. This guide also provides infor-mation for those agencies with ameasurement program already inplace but interested in switching tothe standardized approach. Inaddition, agencies interested insimply recalculating an overallrecycling rate to be consistent withthe standardized methodology willfind this guide helpful.
Although numerous tips areoffered in the guide for obtainingaccurate data, EPA recognizes theneed to balance the resources spenton recycling measurement againstthe larger goal of advancing inte-grated solid waste management.
For this reason, EPA allows for theestimation of data in certaininstances, providing that estimatesare based on good, solid knowl-edge of the sources and flow ofMSW within a region.
The methodology and recom-mendations presented in this guiderepresent the practical experienceof many states and localities cur-rently measuring recycling. Asidefrom establishing a voluntary, uni-form method for calculating recy-cling rates, this guide offers stateand local governments a number ofbenefits, including advice and rec-ommendations for:
■ Obtaining accurate data.
■ Minimizing double counting.
■ Identifying possible errors oromissions in data.
■ Establishing relationships withthe private sector to obtain com-mercial recycling information.
■ Ensuring the private sector’sconfidentiality when reportingdata.
■ Using national waste characteri-zation data to estimate wastegeneration when disposal dataare not available.
■ Accounting for imports andexports of MSW and recyclablematerials.
■ Streamlining and improvingdata collection.
■ Reducing recycling measure-ment costs.
Although state and local gov-ernments can benefit from theinformation contained in this guidewithout adopting the standardrecycling measurement methodol-ogy, doing so has many advan-tages. Standard data collection andcalculation methods (including the
3Introduction
use of the survey forms includedwith this guide) can help achieve:
■ Greater cooperation from infor-mation sources supplying data,who appreciate efforts to stream-line and standardize reportingrequirements.
■ More opportunities to exchangeinformation and advance recy-cling measurement techniques,since similar methods areemployed nationwide.
■ Fewer opportunities for manipu-lation of recycling data in order tomeet recycling goals.
■ Time and cost savings for every-one involved in data collectionand analysis.
■ Enhanced ability to improvewaste handling and recyclingprograms, since standard recy-cling rates are produced that can be tracked against otherprograms.
In addition, standardization ben-efits the businesses and industryrepresentatives that supply recy-cling and waste disposal data tostate and local agencies. A recyclingmeasurement system that involvesstandard definitions, survey forms,and reporting requirements simpli-fies and streamlines the reportingprocess for these data sources andreduces the amount of time andresources they must expend.
5Elements of Standardization
In order to produce comparable recycling rates, certain elements of
recycling measurement must be consistent from one jurisdiction to another.
These required elements of standardization are as follows:
■ Include only the standard scope of MSW.
■ Include only standard recycling activities.
■ Use the standard equation for calculating a recycling rate.
■ Account for imports and exports of materials.
■ Obtain data on a calendar year basis.
■ Report data in tons.
Even though the standardized recycling measurement system presented in this
guide is voluntary, if you choose to implement this system in your state or locality,
these components must be included in order for standardization to occur.
Other aspects of recycling measurement are flexible. These include:
■ WHY to measure recycling.
■ WHEN to collect the necessary data.
■ WHO should collect and compile the information.
■ WHERE to collect the information.
■ HOW to collect, organize, and maintain the data.
This guide suggests preferred strategies for handling these flexible aspects of
measurement, but since every jurisdiction is different, techniques that work effectively
in one region may require modification in another.S
EC
TIO
N
2Elements ofStandardization
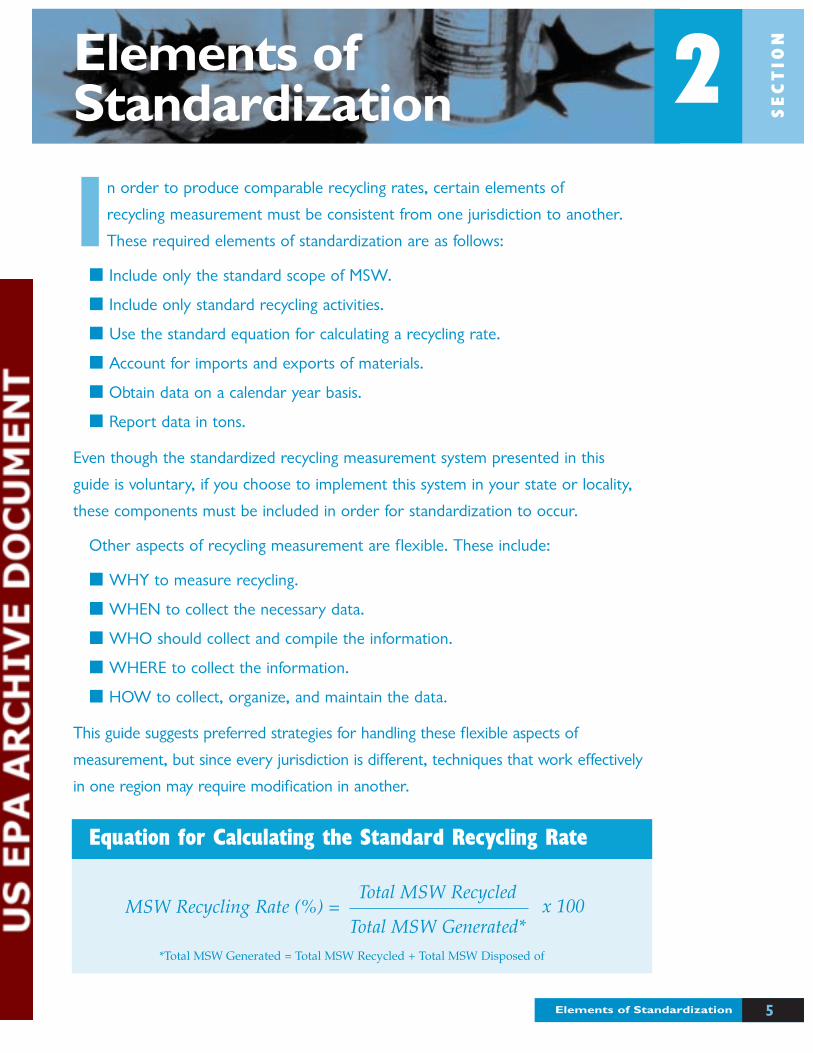
MSW Recycling Rate (%) =Total MSW Recycled
Total MSW Generated*x 100
Equation for Calculating the Standard Recycling Rate
*Total MSW Generated = Total MSW Recycled + Total MSW Disposed of
Section 26
StandardElements
The six elements detailed belowcomprise the standard methodolo-gy for measuring recycling. Assuch, they are required for statesand localities that choose to imple-ment the methodology.
1. Include only thestandard scope ofMSW.
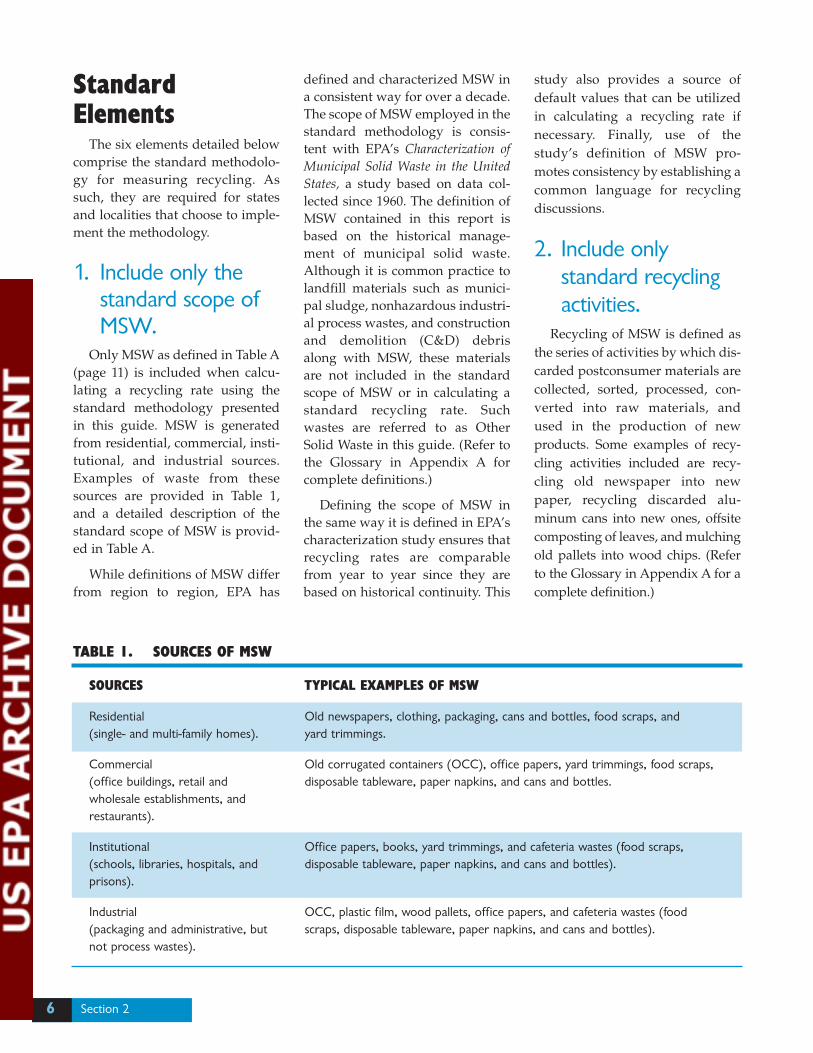
Only MSW as defined in Table A(page 11) is included when calcu-lating a recycling rate using thestandard methodology presentedin this guide. MSW is generatedfrom residential, commercial, insti-tutional, and industrial sources.Examples of waste from thesesources are provided in Table 1,and a detailed description of thestandard scope of MSW is provid-ed in Table A.
While definitions of MSW differfrom region to region, EPA has
defined and characterized MSW ina consistent way for over a decade.The scope of MSW employed in thestandard methodology is consis-tent with EPA’s Characterization ofMunicipal Solid Waste in the UnitedStates, a study based on data col-lected since 1960. The definition ofMSW contained in this report isbased on the historical manage-ment of municipal solid waste.Although it is common practice tolandfill materials such as munici-pal sludge, nonhazardous industri-al process wastes, and constructionand demolition (C&D) debrisalong with MSW, these materialsare not included in the standardscope of MSW or in calculating astandard recycling rate. Suchwastes are referred to as OtherSolid Waste in this guide. (Refer tothe Glossary in Appendix A forcomplete definitions.)
Defining the scope of MSW inthe same way it is defined in EPA’scharacterization study ensures thatrecycling rates are comparablefrom year to year since they arebased on historical continuity. This
study also provides a source ofdefault values that can be utilizedin calculating a recycling rate ifnecessary. Finally, use of thestudy’s definition of MSW pro-motes consistency by establishing acommon language for recyclingdiscussions.
2. Include onlystandard recyclingactivities.
Recycling of MSW is defined asthe series of activities by which dis-carded postconsumer materials arecollected, sorted, processed, con-verted into raw materials, andused in the production of newproducts. Some examples of recy-cling activities included are recy-cling old newspaper into newpaper, recycling discarded alu-minum cans into new ones, offsitecomposting of leaves, and mulchingold pallets into wood chips. (Referto the Glossary in Appendix A for acomplete definition.)
TABLE 1. SOURCES OF MSW
SOURCES TYPICAL EXAMPLES OF MSW
Residential Old newspapers, clothing, packaging, cans and bottles, food scraps, and (single- and multi-family homes). yard trimmings.
Commercial Old corrugated containers (OCC), office papers, yard trimmings, food scraps, (office buildings, retail and disposable tableware, paper napkins, and cans and bottles.wholesale establishments, and restaurants).
Institutional Office papers, books, yard trimmings, and cafeteria wastes (food scraps, (schools, libraries, hospitals, and disposable tableware, paper napkins, and cans and bottles).prisons).
Industrial OCC, plastic film, wood pallets, office papers, and cafeteria wastes (food (packaging and administrative, but scraps, disposable tableware, paper napkins, and cans and bottles).not process wastes).
7Elements of Standardization
Preconsumer recycling, such asrecycling trimmings from paperconverting operations, is notincluded in calculating a standardrecycling rate. Also omitted is therecycling of all non-MSW materi-als, such as C&D debris and usedoil. Source reduction activities,including reuse practices and back-yard composting, also are excludedfrom the standard recycling rate.Combustion for energy recovery,like other types of MSW disposal, isexcluded. The scope of MSW recy-cling is described in detail in Table B(page 13).
The definition of recyclingemployed by the standard method-ology is consistent with the defini-tion used in EPA’s Characterizationof Municipal Solid Waste in theUnited States. The use of the samedefinition over time promotes con-sistency and comparability amongrecycling rates.
3. Use the standardequation forcalculating arecycling rate.
The standard methodology usesthe equation shown on page 5 forcalculating a recycling rate.
The MSW recycling rate is calcu-lated by dividing the total amountof MSW recycled (including offsitecomposting) in the measurementyear (the previous calendar year)by the total amount of MSW gener-ated. MSW generation is equal tothe total amount of MSW recycledplus the total amount of MSW dis-posed of, in tons. Both MSW gener-ation and recycling totals areadjusted to account for importsand exports of waste and recy-clables. Methods for obtainingrecycling and waste disposal data
are described in Section 4. Also,methods for using waste character-ization data to estimate MSW gen-eration (when disposal data are notavailable or reliable) are providedin Section 5.
4. Account forimports andexports of MSWand recyclables.
MSW and recyclables oftenmove across jurisdictional lines foreconomic and practical reasons.Current recycling measurementsystems do not always account forthe exporting and importing ofmaterials resulting from the freemovement of waste and recy-clables between states or localities.
The standard methodologyrequires that your recycling rateinclude only materials generated inyour state or locality. This allowsfor a more accurate account ofwaste generated and materialsrecycled within your jurisdiction.For this reason, when calculatingthe amount of MSW recycled, besure to add to the total any recy-clable materials that were exportedfrom your state or locality, and sub-tract any recyclables that wereimported into your state or locality.Likewise, when calculating theamount of MSW disposed of, anyMSW that was exported from yourjurisdiction should be added to thetotal, and any MSW importedshould be subtracted. Section 4 ofthis guide provides suggestions forhow to track exports and imports.
5. Obtain data on acalendar year basis.
Some existing measurement sys-tems use calendar year data, while
other systems employ fiscal yeardata. An important aspect of stan-dardization, therefore, is setting auniform measurement year.Private recyclers and disposal facil-ities supplying more than onejurisdiction with data will appreci-ate such uniformity. To be consis-tent, the standard methodologyrequires collection of data for theprevious calendar year (January toDecember).
6. Report data in tons.Another important aspect of
standardization is a uniform unitof measurement. Data sources areasked to report quantities in tonsand to use conversion factors if thetonnage is not available. Volume-to-weight conversion factors areprovided to allow for standardconversions (see Appendix B).Alternatively, respondents can usetheir own conversion factors pro-vided they are based on actual dataand not estimates.
Flexible ElementsBelow are the elements of recy-
cling measurement that will differamong jurisdictions. Although thestandard methodology does notprescribe a single method foraddressing these elements, thisguide does provide preferredapproaches based on the experi-ence of many state and localgovernments.
1. When to collectdata.
Although the standard method-ology requires you to collect datafrom the previous calendar year,exactly when you choose to collectand compile these data is entirely
Section 28
up to you. Section 3 contains a rec-ommended timeline that suggestsdates for distributing survey formsand requesting responses. Whileyou can adjust this schedule tomeet your needs, keep in mind thatcompanies serving more than onestate or locality will appreciatehaving only one due date toremember.
2. How to obtain thenecessary data.
Survey forms are typically usedfor obtaining the data needed tocalculate a recycling rate. Althoughthere are many benefits to all statesand localities using the samesurvey form, this is not alwayspractical. Some state and local gov-ernments have developed a formover years of surveying that workswell for them, while others haveunique information needs that pre-clude using a standard form.Therefore, the use of a standard formis not a required element of standardization.
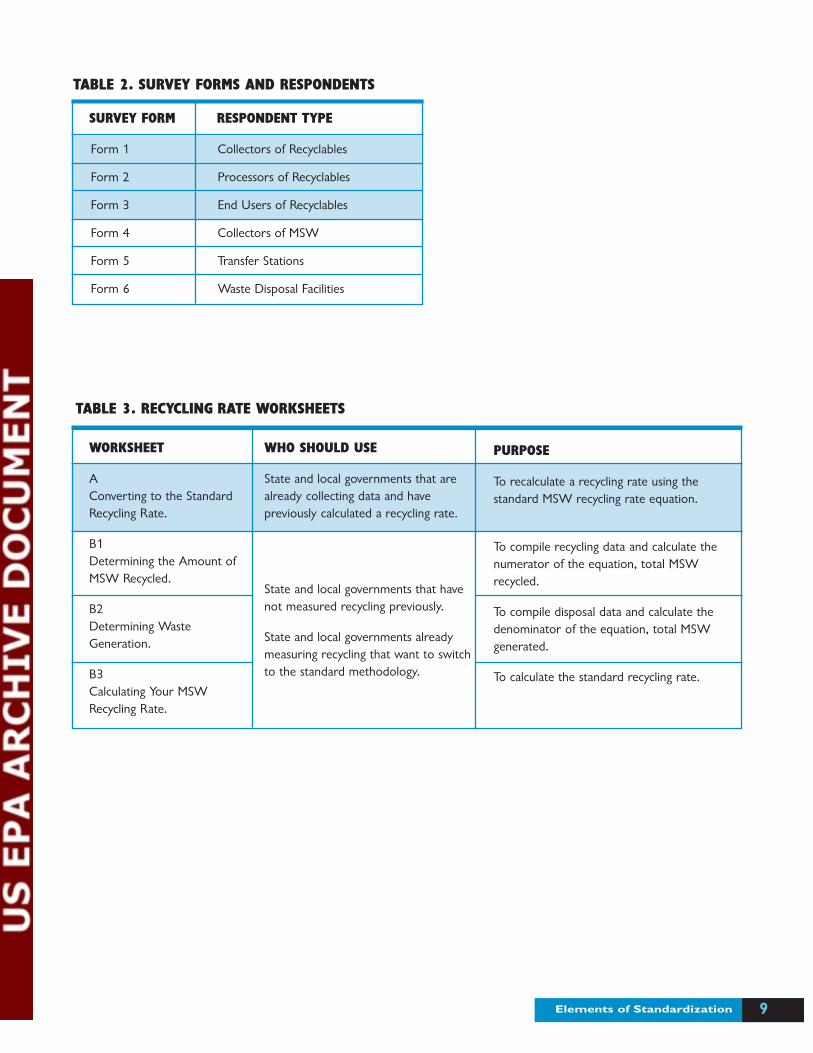
Appendix C contains six surveyforms (see Table 2 on page 9). Youcan reproduce these forms directly,modify them to fit your needs, oruse your own forms. The first threesurvey forms seek data from spe-cific points in the recycling chain—collection, processing, andremanufacturing. The remainingthree survey forms seek waste dis-posal information from wastehaulers, transfer stations, and dis-posal facility operators. In each setof three, one or more of the formscan be used depending on whereyou choose to get your data.
Appendix D contains four recy-cling rate worksheets (see Table 3on page 9). The worksheets aredesigned for state and local gov-ernments that have never mea-
sured recycling as well as thosealready collecting data who wantto either switch to the standardmethodology or recalculate theirrecycling rate according to thestandard method.
3. Who is responsiblefor collecting thedata.
Any entity within a state orlocality can collect recycling andwaste disposal information fromdata sources. Typically, the depart-ment in charge of recycling takeson the data collection responsibili-ty. However, state or local recyclingorganizations, trade associations,or other government agencies(such as permitting divisions thatare compiling data from annualpermit reports) also can collect thenecessary data. Alternatively, somestates enlist the help of their city orcounty governments, who surveydata sources and then report back.Who is responsible for directly sur-veying data sources will not affectyour ability to calculate a standardrecycling rate for MSW.
4. Where to surveyfor the needed data.
The recycling and waste dispos-al data needed to calculate a recy-cling rate can be obtained fromnumerous sources, including collectors, processors, recyclingplants, and disposal facilities.Section 4 explains the differentoptions for surveying thesesources. While there are advan-tages and disadvantages to survey-ing each of the sources, where youchoose to obtain your data is not arequired element of the standardmeasurement methodology.
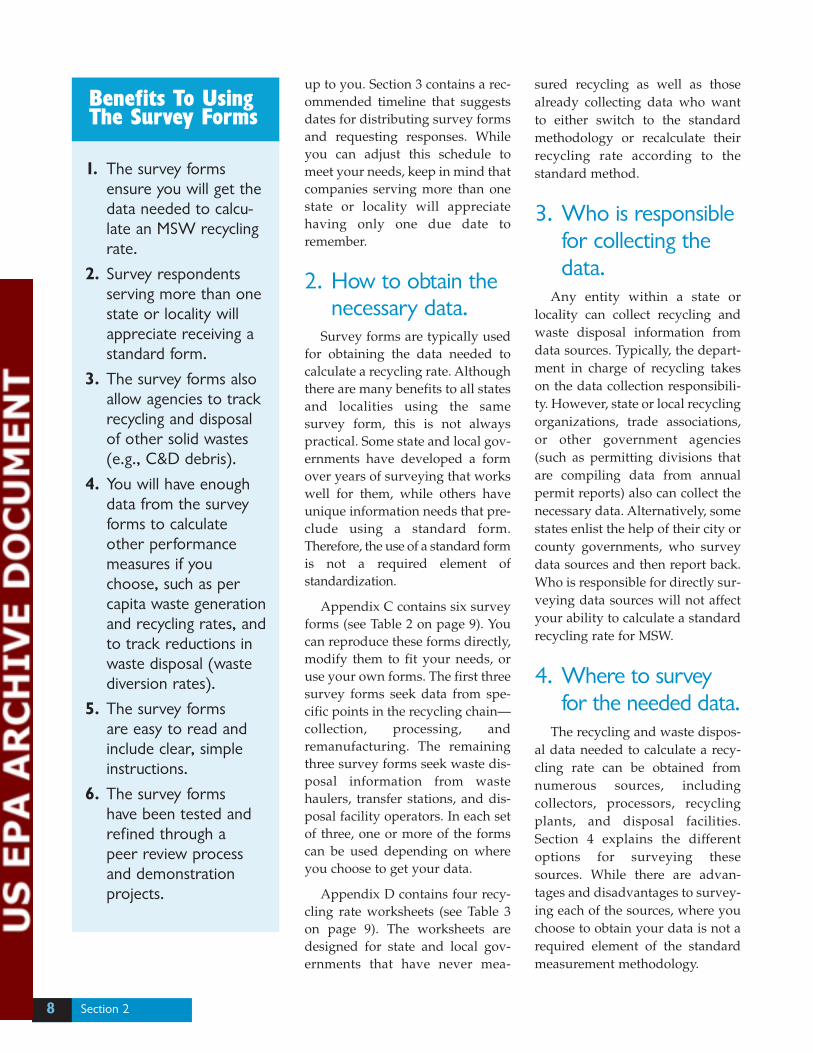
Benefits To UsingThe Survey Forms
1. The survey formsensure you will get thedata needed to calcu-late an MSW recyclingrate.
2. Survey respondentsserving more than onestate or locality willappreciate receiving astandard form.
3. The survey forms alsoallow agencies to trackrecycling and disposalof other solid wastes(e.g., C&D debris).
4. You will have enoughdata from the surveyforms to calculateother performancemeasures if youchoose, such as percapita waste generationand recycling rates, andto track reductions inwaste disposal (wastediversion rates).
5. The survey forms are easy to read andinclude clear, simpleinstructions.
6. The survey forms have been tested andrefined through a peer review processand demonstrationprojects.
9Elements of Standardization
TABLE 2. SURVEY FORMS AND RESPONDENTS
SURVEY FORM RESPONDENT TYPE
Form 1 Collectors of Recyclables
Form 2 Processors of Recyclables
Form 3 End Users of Recyclables
Form 4 Collectors of MSW
Form 5 Transfer Stations
Form 6 Waste Disposal Facilities
TABLE 3. RECYCLING RATE WORKSHEETS
WORKSHEET
AConverting to the StandardRecycling Rate.
B1Determining the Amount ofMSW Recycled.
B2Determining WasteGeneration.
B3Calculating Your MSWRecycling Rate.
WHO SHOULD USE
State and local governments that arealready collecting data and havepreviously calculated a recycling rate.
State and local governments that havenot measured recycling previously.
State and local governments alreadymeasuring recycling that want to switchto the standard methodology.
PURPOSE
To recalculate a recycling rate using thestandard MSW recycling rate equation.
To compile recycling data and calculate thenumerator of the equation, total MSWrecycled.
To compile disposal data and calculate thedenominator of the equation, total MSWgenerated.
To calculate the standard recycling rate.
Section 210
Using the Scope Tables
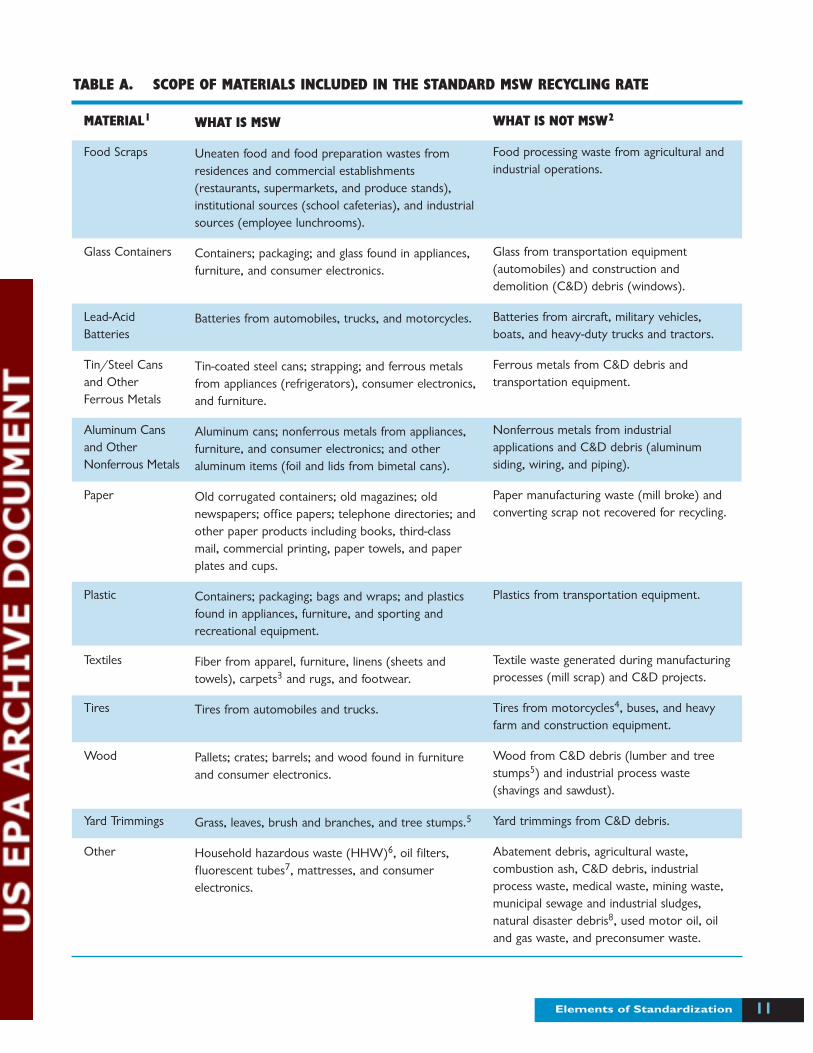
Tables A and B should be used in conjunction with each other to help
you understand what is included in the standard municipal solid waste
(MSW) recycling rate and what is excluded. First, use Table A, Scope
of Materials Included in the Standard MSW Recycling Rate, to identify which
materials are defined as MSW (Column 2, What Is MSW) and which materials
are defined as Other Solid Waste (Column 3, What Is Not MSW). The materi-
als outlined in column 2, What Is MSW, are included in both the recycling and
waste generation totals of the standard recycling rate.
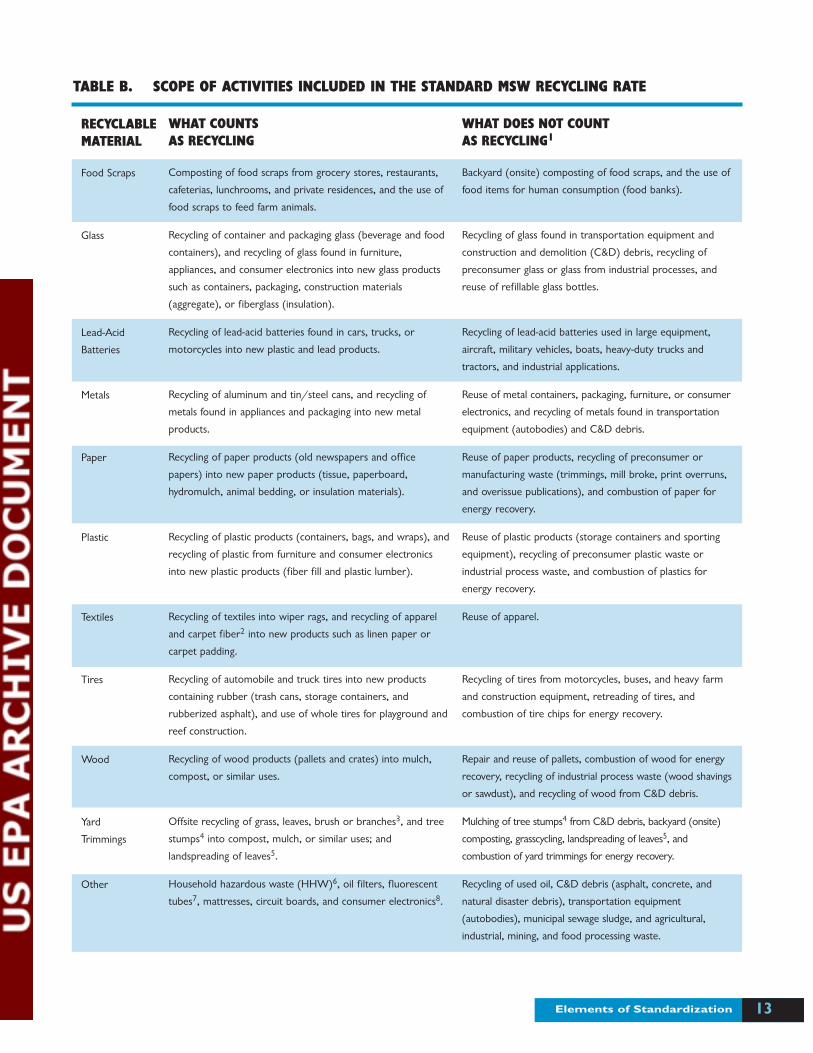
After you have determined which materials are included in the standard recy-
cling rate, use Table B, Scope of Activities Included in the Standard MSW
Recycling Rate, to further refine the scope based on whether the recycling of the
materials defined in Table A meets the standard definition of recycling outlined in
Table B. As an example, tires from automobiles are defined as MSW according to
Table A, so the disposal of such tires may be included in your waste generation
total. If these tires are retreaded, however, they may not be included in your
recycling total since retreading is considered reuse rather than recycling according
to Table B.
11Elements of Standardization
MATERIAL1
Food Scraps
Glass Containers
Lead-AcidBatteries
Tin/Steel Cansand OtherFerrous Metals
Aluminum Cansand OtherNonferrous Metals
Paper
Plastic
Textiles
Tires
Wood
Yard Trimmings
Other
WHAT IS MSW
Uneaten food and food preparation wastes fromresidences and commercial establishments(restaurants, supermarkets, and produce stands),institutional sources (school cafeterias), and industrialsources (employee lunchrooms).
Containers; packaging; and glass found in appliances,furniture, and consumer electronics.
Batteries from automobiles, trucks, and motorcycles.
Tin-coated steel cans; strapping; and ferrous metalsfrom appliances (refrigerators), consumer electronics,and furniture.
Aluminum cans; nonferrous metals from appliances,furniture, and consumer electronics; and otheraluminum items (foil and lids from bimetal cans).
Old corrugated containers; old magazines; oldnewspapers; office papers; telephone directories; andother paper products including books, third-classmail, commercial printing, paper towels, and paperplates and cups.
Containers; packaging; bags and wraps; and plasticsfound in appliances, furniture, and sporting andrecreational equipment.
Fiber from apparel, furniture, linens (sheets andtowels), carpets3 and rugs, and footwear.
Tires from automobiles and trucks.
Pallets; crates; barrels; and wood found in furnitureand consumer electronics.
Grass, leaves, brush and branches, and tree stumps.5
Household hazardous waste (HHW)6, oil filters,fluorescent tubes7, mattresses, and consumerelectronics.
WHAT IS NOT MSW2
Food processing waste from agricultural andindustrial operations.
Glass from transportation equipment(automobiles) and construction anddemolition (C&D) debris (windows).
Batteries from aircraft, military vehicles,boats, and heavy-duty trucks and tractors.
Ferrous metals from C&D debris andtransportation equipment.
Nonferrous metals from industrialapplications and C&D debris (aluminumsiding, wiring, and piping).
Paper manufacturing waste (mill broke) andconverting scrap not recovered for recycling.
Plastics from transportation equipment.
Textile waste generated during manufacturingprocesses (mill scrap) and C&D projects.
Tires from motorcycles4, buses, and heavyfarm and construction equipment.
Wood from C&D debris (lumber and treestumps5) and industrial process waste(shavings and sawdust).
Yard trimmings from C&D debris.
Abatement debris, agricultural waste,combustion ash, C&D debris, industrialprocess waste, medical waste, mining waste,municipal sewage and industrial sludges,natural disaster debris8, used motor oil, oiland gas waste, and preconsumer waste.
TABLE A. SCOPE OF MATERIALS INCLUDED IN THE STANDARD MSW RECYCLING RATE
Section 212
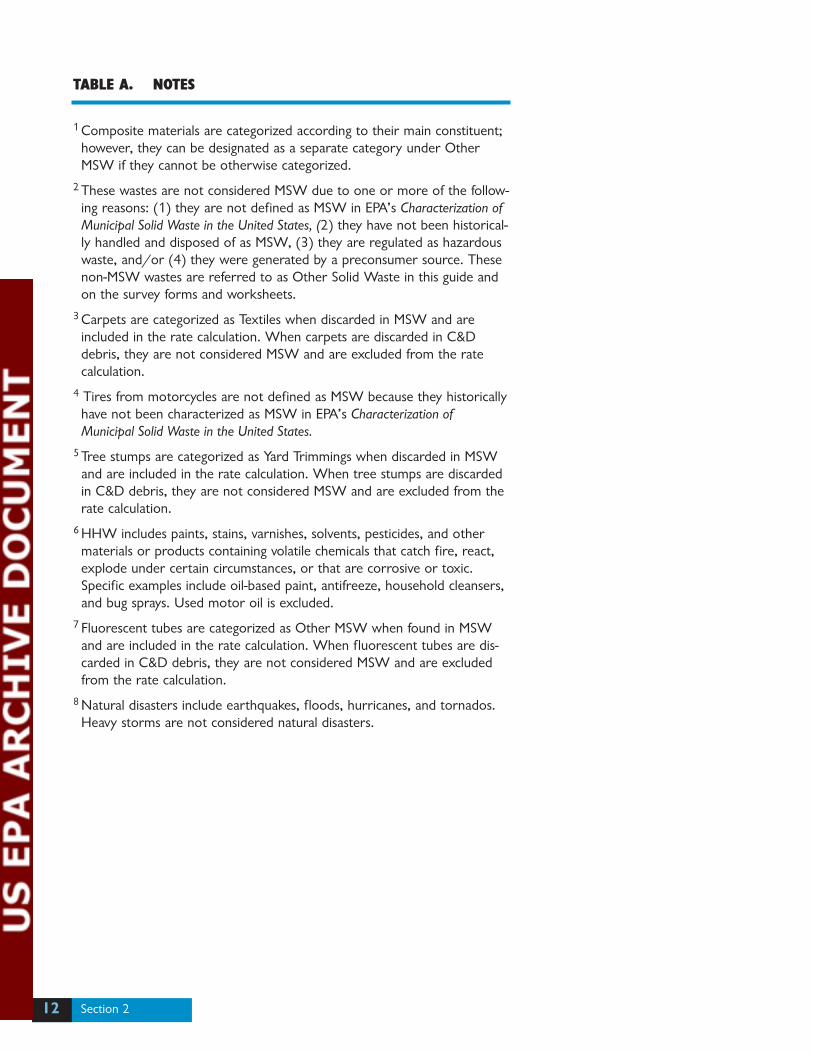
1 Composite materials are categorized according to their main constituent;however, they can be designated as a separate category under OtherMSW if they cannot be otherwise categorized.
2 These wastes are not considered MSW due to one or more of the follow-ing reasons: (1) they are not defined as MSW in EPA’s Characterization ofMunicipal Solid Waste in the United States, (2) they have not been historical-ly handled and disposed of as MSW, (3) they are regulated as hazardouswaste, and/or (4) they were generated by a preconsumer source. Thesenon-MSW wastes are referred to as Other Solid Waste in this guide andon the survey forms and worksheets.
3 Carpets are categorized as Textiles when discarded in MSW and areincluded in the rate calculation. When carpets are discarded in C&Ddebris, they are not considered MSW and are excluded from the rate calculation.
4 Tires from motorcycles are not defined as MSW because they historicallyhave not been characterized as MSW in EPA’s Characterization ofMunicipal Solid Waste in the United States.
5 Tree stumps are categorized as Yard Trimmings when discarded in MSWand are included in the rate calculation. When tree stumps are discardedin C&D debris, they are not considered MSW and are excluded from therate calculation.
6 HHW includes paints, stains, varnishes, solvents, pesticides, and othermaterials or products containing volatile chemicals that catch fire, react,explode under certain circumstances, or that are corrosive or toxic.Specific examples include oil-based paint, antifreeze, household cleansers,and bug sprays. Used motor oil is excluded.
7 Fluorescent tubes are categorized as Other MSW when found in MSWand are included in the rate calculation. When fluorescent tubes are dis-carded in C&D debris, they are not considered MSW and are excludedfrom the rate calculation.
8 Natural disasters include earthquakes, floods, hurricanes, and tornados.Heavy storms are not considered natural disasters.
TABLE A. NOTES
13Elements of Standardization
RECYCLABLEMATERIAL
Food Scraps
Glass
Lead-Acid
Batteries
Metals
Paper
Plastic
Textiles
Tires
Wood
Yard
Trimmings
Other
WHAT COUNTSAS RECYCLING
Composting of food scraps from grocery stores, restaurants,
cafeterias, lunchrooms, and private residences, and the use of
food scraps to feed farm animals.
Recycling of container and packaging glass (beverage and food
containers), and recycling of glass found in furniture,
appliances, and consumer electronics into new glass products
such as containers, packaging, construction materials
(aggregate), or fiberglass (insulation).
Recycling of lead-acid batteries found in cars, trucks, or
motorcycles into new plastic and lead products.
Recycling of aluminum and tin/steel cans, and recycling of
metals found in appliances and packaging into new metal
products.
Recycling of paper products (old newspapers and office
papers) into new paper products (tissue, paperboard,
hydromulch, animal bedding, or insulation materials).
Recycling of plastic products (containers, bags, and wraps), and
recycling of plastic from furniture and consumer electronics
into new plastic products (fiber fill and plastic lumber).
Recycling of textiles into wiper rags, and recycling of apparel
and carpet fiber2 into new products such as linen paper or
carpet padding.
Recycling of automobile and truck tires into new products
containing rubber (trash cans, storage containers, and
rubberized asphalt), and use of whole tires for playground and
reef construction.
Recycling of wood products (pallets and crates) into mulch,
compost, or similar uses.
Offsite recycling of grass, leaves, brush or branches3, and tree
stumps4 into compost, mulch, or similar uses; and
landspreading of leaves5.
Household hazardous waste (HHW)6, oil filters, fluorescent
tubes7, mattresses, circuit boards, and consumer electronics8.
WHAT DOES NOT COUNTAS RECYCLING1
Backyard (onsite) composting of food scraps, and the use of
food items for human consumption (food banks).
Recycling of glass found in transportation equipment and
construction and demolition (C&D) debris, recycling of
preconsumer glass or glass from industrial processes, and
reuse of refillable glass bottles.
Recycling of lead-acid batteries used in large equipment,
aircraft, military vehicles, boats, heavy-duty trucks and
tractors, and industrial applications.
Reuse of metal containers, packaging, furniture, or consumer
electronics, and recycling of metals found in transportation
equipment (autobodies) and C&D debris.
Reuse of paper products, recycling of preconsumer or
manufacturing waste (trimmings, mill broke, print overruns,
and overissue publications), and combustion of paper for
energy recovery.
Reuse of plastic products (storage containers and sporting
equipment), recycling of preconsumer plastic waste or
industrial process waste, and combustion of plastics for
energy recovery.
Reuse of apparel.
Recycling of tires from motorcycles, buses, and heavy farm
and construction equipment, retreading of tires, and
combustion of tire chips for energy recovery.
Repair and reuse of pallets, combustion of wood for energy
recovery, recycling of industrial process waste (wood shavings
or sawdust), and recycling of wood from C&D debris.
Mulching of tree stumps4 from C&D debris, backyard (onsite)
composting, grasscycling, landspreading of leaves5, and
combustion of yard trimmings for energy recovery.
Recycling of used oil, C&D debris (asphalt, concrete, and
natural disaster debris), transportation equipment
(autobodies), municipal sewage sludge, and agricultural,
industrial, mining, and food processing waste.
TABLE B. SCOPE OF ACTIVITIES INCLUDED IN THE STANDARD MSW RECYCLING RATE
Section 214
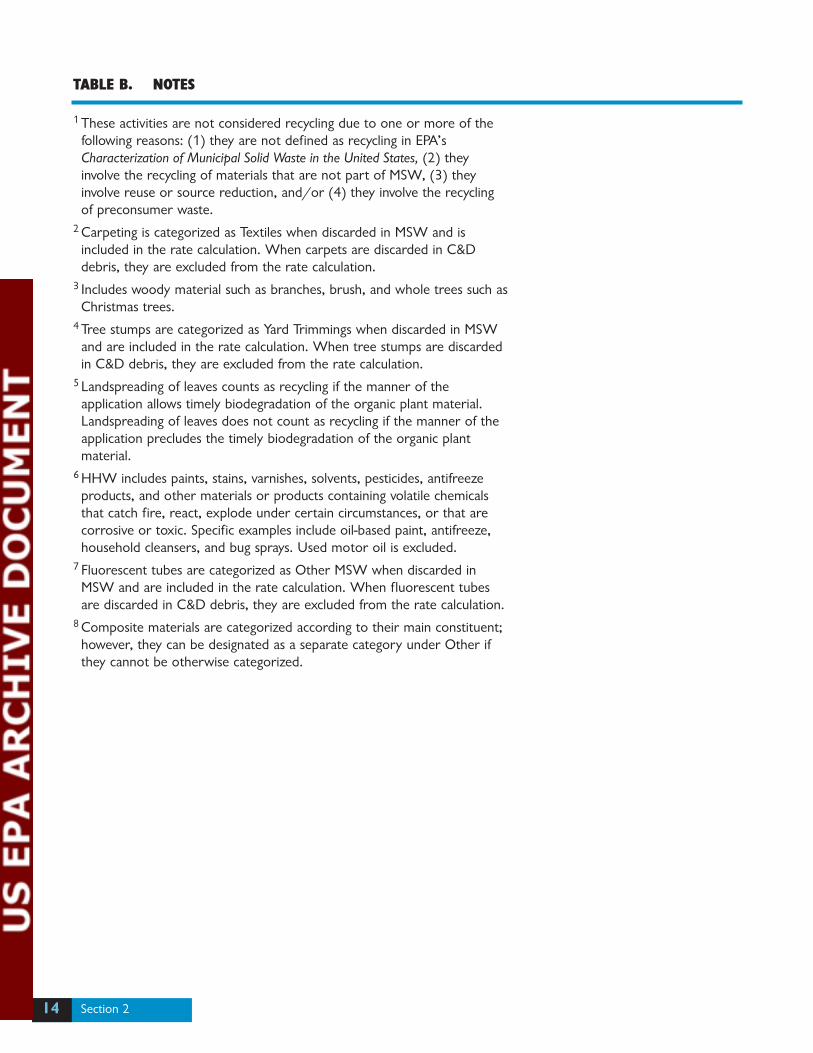
1 These activities are not considered recycling due to one or more of thefollowing reasons: (1) they are not defined as recycling in EPA’sCharacterization of Municipal Solid Waste in the United States, (2) theyinvolve the recycling of materials that are not part of MSW, (3) theyinvolve reuse or source reduction, and/or (4) they involve the recyclingof preconsumer waste.
2 Carpeting is categorized as Textiles when discarded in MSW and is included in the rate calculation. When carpets are discarded in C&Ddebris, they are excluded from the rate calculation.
3 Includes woody material such as branches, brush, and whole trees such asChristmas trees.
4 Tree stumps are categorized as Yard Trimmings when discarded in MSWand are included in the rate calculation. When tree stumps are discardedin C&D debris, they are excluded from the rate calculation.
5 Landspreading of leaves counts as recycling if the manner of theapplication allows timely biodegradation of the organic plant material.Landspreading of leaves does not count as recycling if the manner of theapplication precludes the timely biodegradation of the organic plantmaterial.
6 HHW includes paints, stains, varnishes, solvents, pesticides, antifreezeproducts, and other materials or products containing volatile chemicalsthat catch fire, react, explode under certain circumstances, or that arecorrosive or toxic. Specific examples include oil-based paint, antifreeze,household cleansers, and bug sprays. Used motor oil is excluded.
7 Fluorescent tubes are categorized as Other MSW when discarded inMSW and are included in the rate calculation. When fluorescent tubesare discarded in C&D debris, they are excluded from the rate calculation.
8 Composite materials are categorized according to their main constituent;however, they can be designated as a separate category under Other ifthey cannot be otherwise categorized.
TABLE B. NOTES

Step OneDefine Your ProgramGoals.
State and local governmentsmeasure recycling for a number ofreasons. One of the key reasons tocollect recycling and waste genera-tion data is to assist with planningand decision-making. Such datacan help solid waste managers:
■ Set waste reduction or diversiongoals and track progress towardachieving those goals.
■ Identify trends in waste genera-tion and recycling that couldimpact local, state, or regionalplanning.
■ Make decisions or changes incollection crews, route sched-ules, and equipment needed forwaste pickups and recyclingcollection.
■ Assess and choose among wastemanagement options based on
the amount and type of wasteand recyclable materials.
■ Determine the viability andcapacity of existing solid wasterecycling and disposal facilities,including transfer stations andmaterial recovery facilities(MRFs).
Measurement can also assistwith market development by pro-viding a clear understanding of thesupply and demand of differentrecyclable materials in a givenarea. Specific information on thetype and amount of recyclablesbeing generated within a jurisdic-tion might be useful in a variety ofways, such as:
■ Linking buyers and sellers of aparticular material.
■ Identifying the need for addedprocessing capacity at the localor regional level.
■ Indicating that marketing effortsneed to be increased for a partic-ular recyclable material.
15Planning
Like any other integrated waste management pro-
gram, a recycling measurement system must be
carefully planned, designed, and implemented.
The first step in this process is to define program goals and
plan the basic elements of the system, including staff and
resources needed. The steps described in this section will
help you conduct the initial planning that is critical to the
success of your overall recycling measurement system.
SE
CT
ION
3Planning
Planning Steps
1. Define your programgoals.
2. Determine if usefuldata are already beingcollected.
3. Ascertain yourauthority to surveyand collect data.
4. Determine who willcollect recyclingmeasurement data.
5. Decide on reportingrequirements.
6. Establish program staffand budget.
7. Establish a timeframefor systemdevelopment.
■ Attracting an established recy-cling industry to locate a facilityin the area.
■ Assisting local entrepreneurs instarting small-scale recyclingbusinesses.
■ Encouraging local manufactur-ers to use or to increase their useof locally generated recycledmaterials in their products.
Collecting recycling measure-ment data also can help officialsestablish or expand communitycollection programs. Reporting therecycling progress being achievedwithin a particular state or commu-nity can help raise public aware-ness of recycling, encourageparticipation in collection efforts,and promote buy recycled cam-paigns. The data might also sug-gest a need to expand residential orcommercial collection programs,particularly if there are large gener-ators of certain recyclable materialsin the area.
Step TwoDetermine if UsefulData Are AlreadyBeing Collected.
Once you have determined yourmeasurement goals, investigatewhich departments, agencies, ororganizations are already collect-ing data. Sometimes differentagencies collect similar data.Identifying and eliminating suchredundancies can streamline yourrecycling measurement efforts.
For instance, in states with abottle deposit law, the revenue ortax department might have data onthe number of bottles returned for redemption. Similarly, thehealth department might have dataon household hazardous waste collections.
Step ThreeAscertain YourAuthority to Surveyand Collect Data.
Since compiling data ofteninvolves soliciting informationfrom private and public sources,establishing your authority toengage in data collection might berequired. First, consult with theappropriate counsel within youragency or examine statutes such assolid waste and recycling laws todetermine if special authority isrequired. If so, work within yourdepartment, mayor’s or governor’soffice, or legislative body to gainthe authority you need. Also, con-sider contacting states or localitiesalready engaged in recycling mea-surement for advice. Appendix Elists the states and their recyclingagencies.
In lieu of direct authority to col-lect data, consider contacting solidwaste and recycling facility permit-ting offices. They might already be
Section 316
TIP
Your reasons formeasuring recyclingwill determine the
kind of information youcollect. (See Section 4, step 3, for furtherdetails.)
TIP
Compile a list of allother agencies,departments, or
organizations that arecollecting data related torecycling measurementand consider thepossibility of combiningefforts.
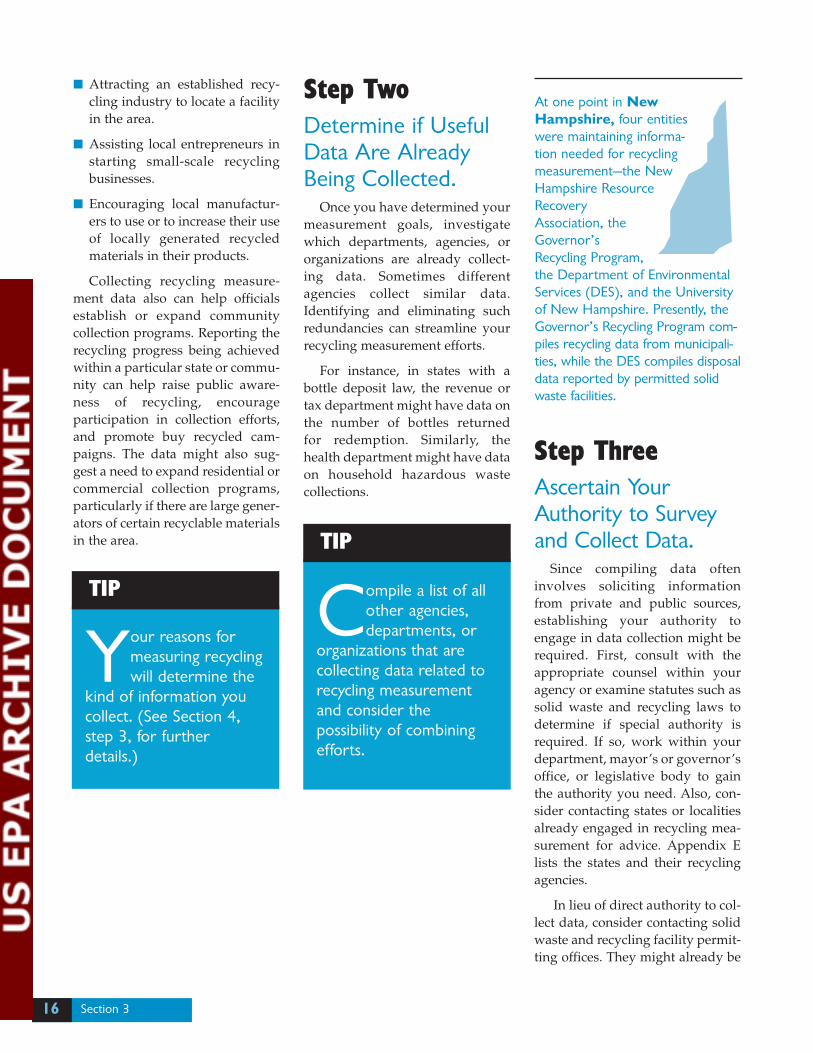
At one point in NewHampshire, four entitieswere maintaining informa-tion needed for recyclingmeasurement—the NewHampshire ResourceRecoveryAssociation, theGovernor’sRecycling Program,the Department of EnvironmentalServices (DES), and the Universityof New Hampshire. Presently, theGovernor’s Recycling Program com-piles recycling data from municipali-ties, while the DES compiles disposaldata reported by permitted solidwaste facilities.
17
compiling some of the data youneed. Local or regional solid wastemanagement plans are also a goodsource of data. Another possibilityis to approach your state or localrecycling organization or relatedtrade associations about taking onrecycling measurement.
Step FourDetermine Who WillCollect RecyclingMeasurement Data.
There are two basic options forcollecting data: 1) go directly torecycling and disposal facilities forthe information, or 2) work withthe appropriate local governmentunits to compile data and reportback. Often, a combination of theseapproaches is used. While there isno prescribed method for who col-lects and compiles data, there aredefinite advantages and disadvan-tages to the different approaches,which are detailed below and inTable 4.
Direct SurveyingIn some areas, the private sector
and local government agenciesreport directly to the principalmeasuring agency. Since theoverall costs of recycling measure-ment increase when many agencies
are engaged in data collection, it isoften more cost-efficient for themeasuring agency to distributesurveys and compile data directly.This approach has the addedadvantage of reducing the paper-work burden on recycling anddisposal facilities. When the mea-suring agency surveys data sourcesdirectly, this can result in more staffcosts, but it also reduces the bur-den on local government agenciesand streamlines the reportingprocess for the private sector.
Planning
TIP
If you do not currentlyhave authority tocollect the data you
need, research thereporting requirementssolid waste and recyclingfacilities already complywith to help youdetermine what types ofdata you can accessthrough these means.
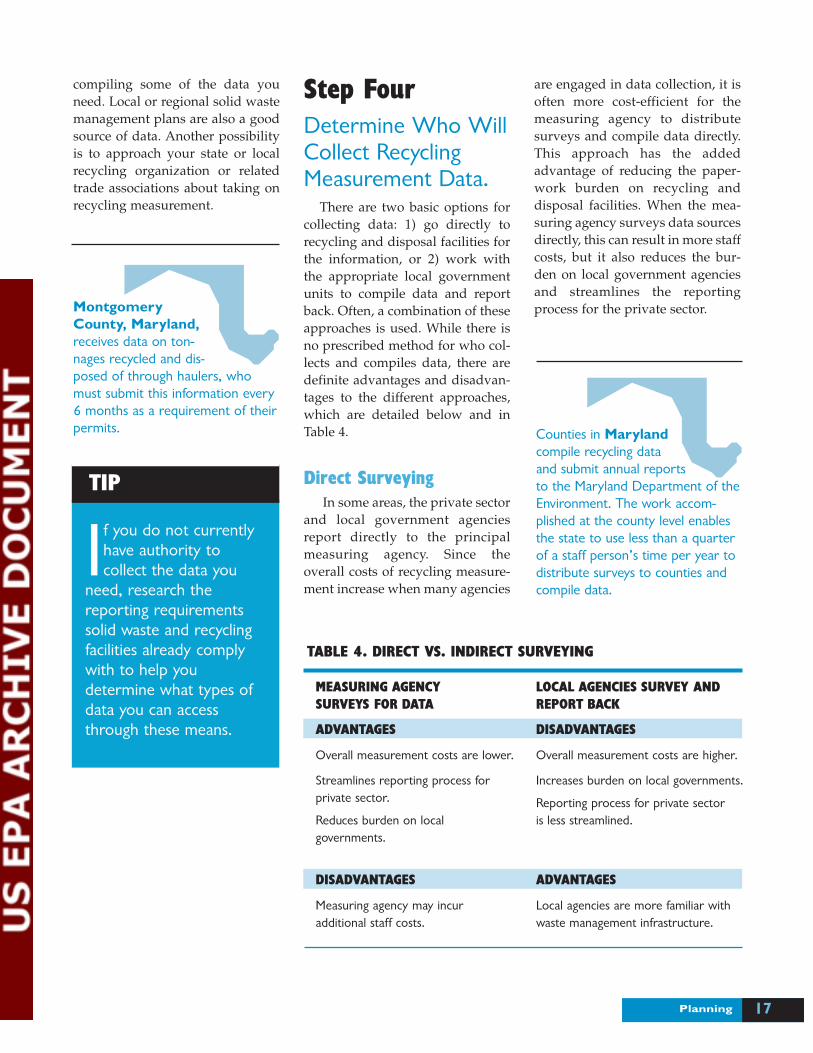
MontgomeryCounty, Maryland,receives data on ton-nages recycled and dis-posed of through haulers, whomust submit this information every6 months as a requirement of theirpermits.
TABLE 4. DIRECT VS. INDIRECT SURVEYING
MEASURING AGENCYSURVEYS FOR DATA
ADVANTAGES
Overall measurement costs are lower.
Streamlines reporting process forprivate sector.
Reduces burden on localgovernments.
DISADVANTAGES
Measuring agency may incuradditional staff costs.
LOCAL AGENCIES SURVEY ANDREPORT BACK
DISADVANTAGES
Overall measurement costs are higher.
Increases burden on local governments.
Reporting process for private sectoris less streamlined.
ADVANTAGES
Local agencies are more familiar withwaste management infrastructure.
Counties in Marylandcompile recycling dataand submit annual reportsto the Maryland Department of theEnvironment. The work accom-plished at the county level enablesthe state to use less than a quarterof a staff person’s time per year todistribute surveys to counties andcompile data.
Section 318
Indirect Surveying City or county governments can
survey data sources and report thedata to the principal measuringagency. Local governments oftenare in the best position to collectdata directly since they are morefamiliar with how waste flows intheir area and who the key playersare. The disadvantages of thisapproach are that the overall costof recycling measurement goes upand data collection may overbur-den local governments. In addi-tion, survey respondents (recyclingand disposal facilities) must dealwith many requests for similarinformation from every jurisdictionthey service. This problem, howev-er, can be alleviated somewhat byusing standard survey forms andreporting deadlines.
Other OptionsIn addition to the two approach-
es discussed above, many otheroptions for data collection exist.For example, the measuring agencycan collect some data directly, suchas waste disposal facility data,while local governments could sur-vey waste haulers for informationon waste exports. Or, the measur-ing agency can compile those datamost easily obtained within theiragency, such as information on tireand lead-acid battery recycling (inthe case of states), and completethis portion of the survey form forthe local governments. The mea-suring agency also could distributesurvey forms to processors onbehalf of local governments. In thiscase, respondents can be asked tofill out a separate form for eachjurisdiction they service. Thisapproach is useful when local-levelrecycling rates are also beingsought. Local governments canalso collect and analyze data on
their own if their state program isnew or undeveloped.
Step FiveDecide on ReportingRequirements.
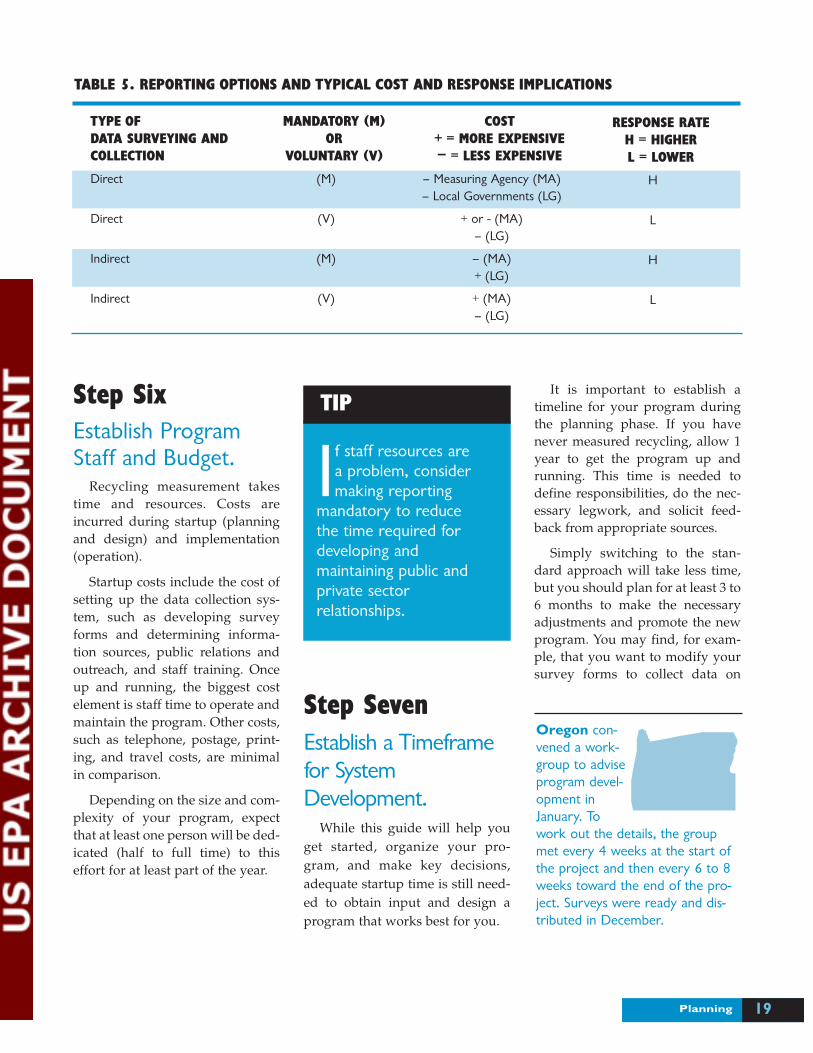
The reporting requirements ofyour recycling measurement pro-gram can be voluntary or mandato-ry. Legislation often dictates whatyour reporting requirements willbe. If you can choose the kind ofprogram to implement, availableresources will be a chief considera-tion, but other issues must beweighed as well (see Table 5 onpage 19).
Mandatory reporting is general-ly less expensive and usually leadsto a higher response rate, but canresult in less accurate data andfewer opportunities to interactwith the recycling community.Voluntary reporting, on the otherhand, requires additional staff andresources, but generally providesbenefits beyond simple data collec-tion such as chances to build posi-tive relationships with surveyrespondents.
The decision to adopt a volun-tary or mandatory program canalso be affected by resource avail-ability. States and localities withmandatory indirect surveying andreporting have the lowest programimplementation costs (at the mea-suring agency level). This approachis beneficial for agencies with min-imal resources for recycling mea-surement. The local governments,however, shoulder high implemen-tation costs because they bear theburden of data collection.
Agencies with voluntary indi-rect data collection incur relativelyhigh costs because such programsrequire extensive follow-up. Thecost burden to local governments,however, is lower than withmandatory data collection becausethey can gather whatever data theirresources allow. If you institute avoluntary program and contactdata sources directly, costs can varydepending on the number ofreporting entities. In this approach,local governments bear negligiblecosts.
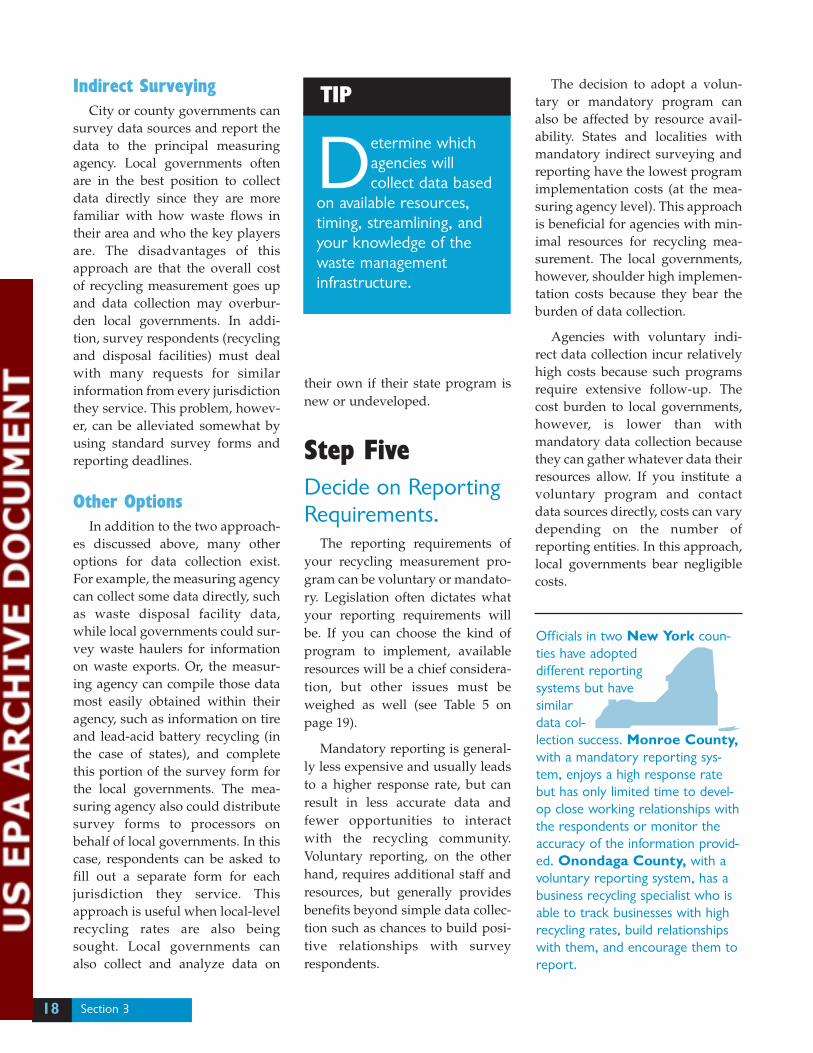
Officials in two New York coun-ties have adopteddifferent reportingsystems but havesimilardata col-lection success. Monroe County,with a mandatory reporting sys-tem, enjoys a high response ratebut has only limited time to devel-op close working relationships withthe respondents or monitor theaccuracy of the information provid-ed. Onondaga County, with avoluntary reporting system, has abusiness recycling specialist who isable to track businesses with highrecycling rates, build relationshipswith them, and encourage them toreport.
TIP
Determine whichagencies willcollect data based
on available resources,timing, streamlining, andyour knowledge of thewaste managementinfrastructure.
19Planning
Step SixEstablish ProgramStaff and Budget.
Recycling measurement takestime and resources. Costs areincurred during startup (planningand design) and implementation(operation).
Startup costs include the cost ofsetting up the data collection sys-tem, such as developing surveyforms and determining informa-tion sources, public relations andoutreach, and staff training. Onceup and running, the biggest costelement is staff time to operate andmaintain the program. Other costs,such as telephone, postage, print-ing, and travel costs, are minimalin comparison.
Depending on the size and com-plexity of your program, expectthat at least one person will be ded-icated (half to full time) to thiseffort for at least part of the year.
Step SevenEstablish a Timeframefor SystemDevelopment.
While this guide will help youget started, organize your pro-gram, and make key decisions,adequate startup time is still need-ed to obtain input and design aprogram that works best for you.
It is important to establish atimeline for your program duringthe planning phase. If you havenever measured recycling, allow 1year to get the program up andrunning. This time is needed todefine responsibilities, do the nec-essary legwork, and solicit feed-back from appropriate sources.
Simply switching to the stan-dard approach will take less time,but you should plan for at least 3 to6 months to make the necessaryadjustments and promote the newprogram. You may find, for exam-ple, that you want to modify yoursurvey forms to collect data on
TIP
If staff resources are a problem, considermaking reporting
mandatory to reduce the time required fordeveloping andmaintaining public andprivate sectorrelationships.
TABLE 5. REPORTING OPTIONS AND TYPICAL COST AND RESPONSE IMPLICATIONS
TYPE OF DATA SURVEYING ANDCOLLECTION
Direct
Direct
Indirect
Indirect
MANDATORY (M) OR
VOLUNTARY (V)
(M)
(V)
(M)
(V)
COST+ = MORE EXPENSIVE– = LESS EXPENSIVE
– Measuring Agency (MA)– Local Governments (LG)
+ or - (MA)– (LG)
– (MA)+ (LG)
+ (MA)– (LG)
RESPONSE RATEH = HIGHERL = LOWER
H
L
H
L
Oregon con-vened a work-group to adviseprogram devel-opment inJanuary. Towork out the details, the groupmet every 4 weeks at the start ofthe project and then every 6 to 8weeks toward the end of the pro-ject. Surveys were ready and dis-tributed in December.
Section 320
recyclable materials counted in theMSW recycling rate but excludedfrom your own. On the other hand,if you decide to continue with yourexisting approach, it could requireas little as 1 day to make adjust-ments and recalculate your recy-cling rate according to the standardmethod.
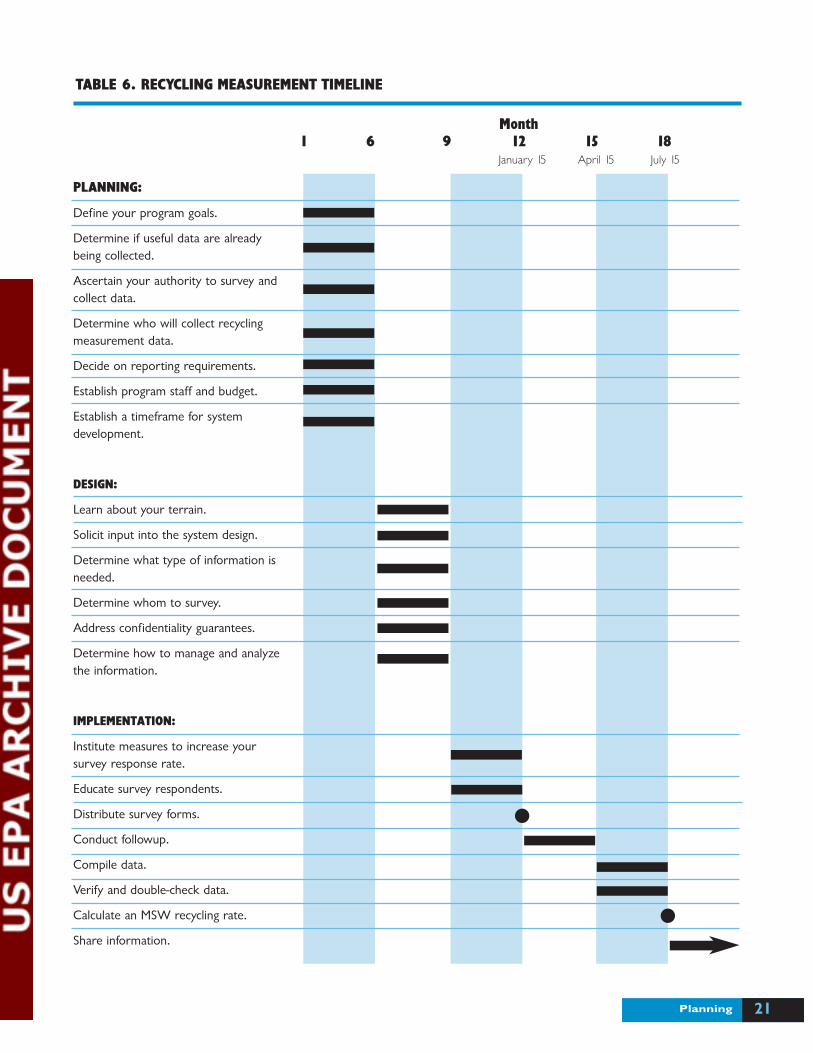
The sample timeline in Table 6on page 21 illustrates the amountof time needed to complete theplanning, design, and implementa-tion phases of a typical recyclingmeasurement system. While theexact steps and allotted times willvary from one jurisdiction to
another, the timeline serves as aguide to help you establish a time-frame of your own.
The sample timeline suggestsdistributing survey forms onJanuary 15 and asking that they bereturned by April 15. While notrequired, adhering to these dateswill help to improve the efficiencywith which data are collectedacross the United States. Surveyrespondents servicing more thanone jurisdiction will become accus-tomed to when they receive surveyforms and when they need toreturn them.
TIP
Allow at least 1 yearfor planning anddesigning a new
recycling measurementsystem before sending outsurvey forms.
21Planning
TABLE 6. RECYCLING MEASUREMENT TIMELINE
PLANNING:
Define your program goals.
Determine if useful data are alreadybeing collected.
Ascertain your authority to survey andcollect data.
Determine who will collect recyclingmeasurement data.
Decide on reporting requirements.
Establish program staff and budget.
Establish a timeframe for systemdevelopment.
DESIGN:
Learn about your terrain.
Solicit input into the system design.
Determine what type of information isneeded.
Determine whom to survey.
Address confidentiality guarantees.
Determine how to manage and analyzethe information.
IMPLEMENTATION:
Institute measures to increase yoursurvey response rate.
Educate survey respondents.
Distribute survey forms.
Conduct followup.
Compile data.
Verify and double-check data.
Calculate an MSW recycling rate.
Share information.
Month1 6 9 12 15 18
January 15 April 15 July 15

Step OneLearn About YourTerrain.
The more you know about thewaste management infrastructurein your state or locality, the easier itwill be to design a recycling mea-surement program that meets yourspecific needs. MSW and recy-clables can flow in many directionsthrough a region. The more com-plicated the flow, the greater therisk that materials will be countedmore than once in your survey(double counting) or missed entire-ly (leakage). These risks can beavoided by developing a thoroughunderstanding of the major playersthat handle MSW and recyclablesin your area. Many agenciesdevelop a database of the key play-ers in solid waste management
and recycling in their area to assist in measuring efforts. At aminimum, make a list of the keyplayers detailed in Table 7 on page 24.
Many information sources canhelp you better understand thewaste management infrastructurein your state or locality and locatekey players. These include:
■ Trade associations. National recy-cling and solid waste manage-ment associations can providedetails on their state and localchapters. These chapters usuallyoffer technical assistance andresources that can help you bet-ter understand your terrain.They can also identify upcom-ing conferences that might pro-vide networking opportunitiesfor identifying key players andsoliciting information.
23Design
This section provides an overview of the recycling
measurement design process. Designing an effec-
tive recycling measurement system entails learning
about how MSW and recyclables flow through your region in
order to conduct an effective survey. At this stage of the
process, you will also make critical decisions about the type
of data to compile, where to acquire these data, and how to
manage the information collected.
SE
CT
ION
4Design
Design Steps
1. Learn about yourterrain.
2. Solicit input into thesystem design.
3. Determine what typeof information isneeded.
4. Determine whom tosurvey.
5. Address confidentialityguarantees.
6. Determine how tomanage and analyzethe information.
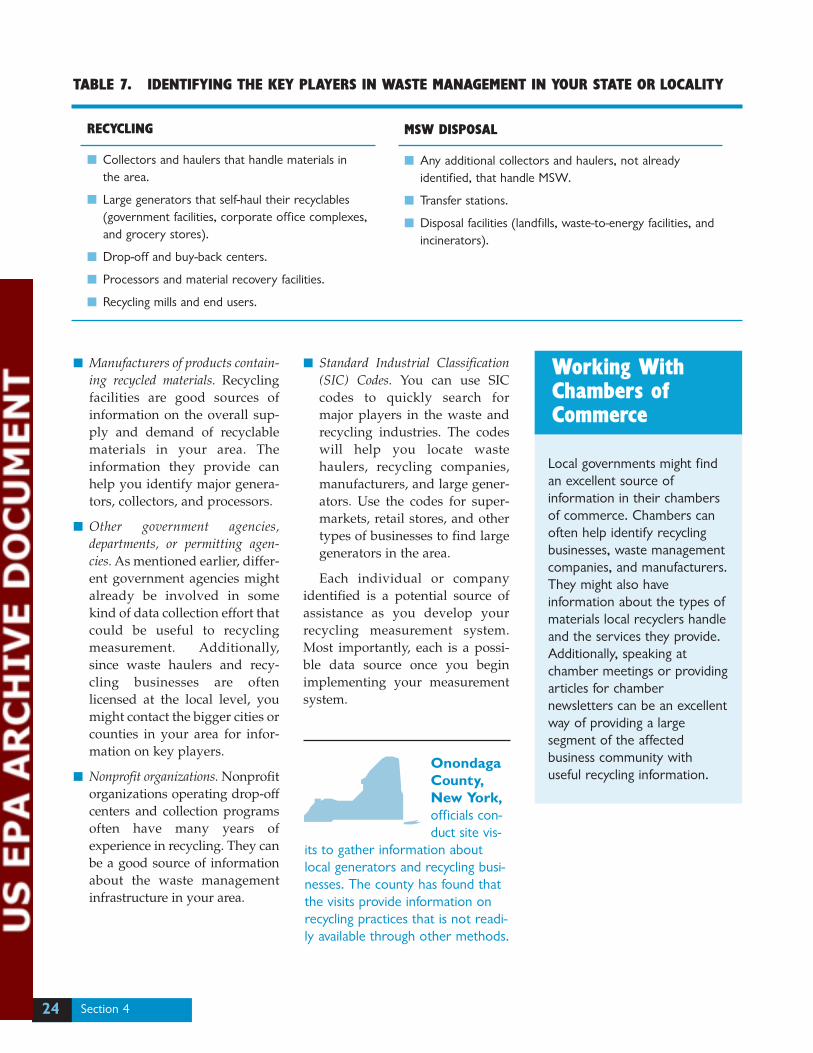
■ Manufacturers of products contain-ing recycled materials. Recyclingfacilities are good sources ofinformation on the overall sup-ply and demand of recyclablematerials in your area. Theinformation they provide canhelp you identify major genera-tors, collectors, and processors.
■ Other government agencies,departments, or permitting agen-cies. As mentioned earlier, differ-ent government agencies mightalready be involved in somekind of data collection effort thatcould be useful to recyclingmeasurement. Additionally,since waste haulers and recy-cling businesses are oftenlicensed at the local level, youmight contact the bigger cities orcounties in your area for infor-mation on key players.
■ Nonprofit organizations. Nonprofitorganizations operating drop-offcenters and collection programsoften have many years of experience in recycling. They canbe a good source of informationabout the waste managementinfrastructure in your area.
■ Standard Industrial Classification(SIC) Codes. You can use SICcodes to quickly search formajor players in the waste andrecycling industries. The codeswill help you locate wastehaulers, recycling companies,manufacturers, and large gener-ators. Use the codes for super-markets, retail stores, and othertypes of businesses to find largegenerators in the area.
Each individual or companyidentified is a potential source ofassistance as you develop yourrecycling measurement system.Most importantly, each is a possi-ble data source once you beginimplementing your measurementsystem.
Section 424
RECYCLING
■ Collectors and haulers that handle materials in the area.
■ Large generators that self-haul their recyclables(government facilities, corporate office complexes,and grocery stores).
■ Drop-off and buy-back centers.
■ Processors and material recovery facilities.
■ Recycling mills and end users.
TABLE 7. IDENTIFYING THE KEY PLAYERS IN WASTE MANAGEMENT IN YOUR STATE OR LOCALITY
MSW DISPOSAL
■ Any additional collectors and haulers, not alreadyidentified, that handle MSW.
■ Transfer stations.
■ Disposal facilities (landfills, waste-to-energy facilities, andincinerators).
Working WithChambers ofCommerce
Local governments might findan excellent source ofinformation in their chambersof commerce. Chambers canoften help identify recyclingbusinesses, waste managementcompanies, and manufacturers.They might also haveinformation about the types ofmaterials local recyclers handleand the services they provide.Additionally, speaking atchamber meetings or providingarticles for chambernewsletters can be an excellentway of providing a largesegment of the affectedbusiness community withuseful recycling information.
OnondagaCounty,New York,officials con-duct site vis-
its to gather information aboutlocal generators and recycling busi-nesses. The county has found thatthe visits provide information onrecycling practices that is not readi-ly available through other methods.
Step TwoSolicit Input Into theDesign of Your System.
To gain support for your system,solicit input from key stakeholders.This can be accomplished througha formal workgroup or advisorycouncil comprised of potential sur-vey respondents and other affectedparties. Including governmentagency, nonprofit organization,recycling industry, and wasteindustry representatives in thedecision-making process will fostera cooperative spirit and theexchange of ideas. Additionally,providing potential respondentswith a sense of ownership in thereporting process might result in ahigher response rate.
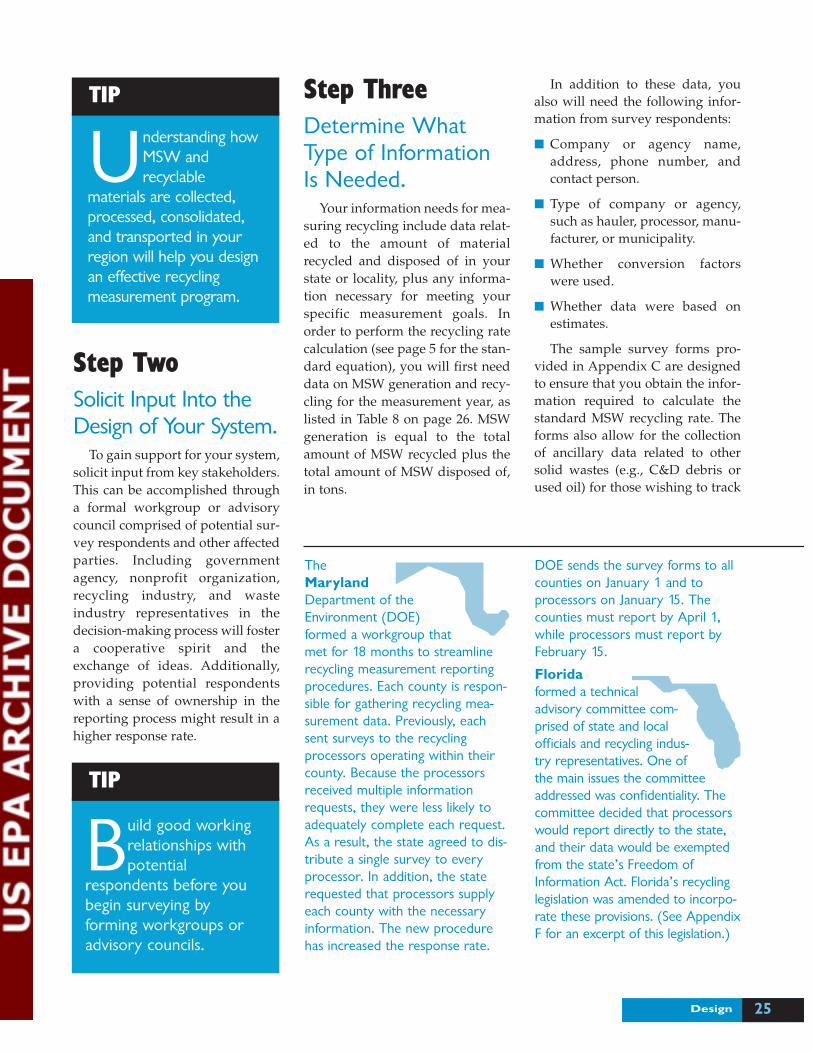
Step ThreeDetermine WhatType of InformationIs Needed.
Your information needs for mea-suring recycling include data relat-ed to the amount of materialrecycled and disposed of in yourstate or locality, plus any informa-tion necessary for meeting yourspecific measurement goals. Inorder to perform the recycling ratecalculation (see page 5 for the stan-dard equation), you will first needdata on MSW generation and recy-cling for the measurement year, aslisted in Table 8 on page 26. MSWgeneration is equal to the totalamount of MSW recycled plus thetotal amount of MSW disposed of,in tons.
In addition to these data, youalso will need the following infor-mation from survey respondents:
■ Company or agency name,address, phone number, andcontact person.
■ Type of company or agency,such as hauler, processor, manu-facturer, or municipality.
■ Whether conversion factorswere used.
■ Whether data were based onestimates.
The sample survey forms pro-vided in Appendix C are designedto ensure that you obtain the infor-mation required to calculate thestandard MSW recycling rate. Theforms also allow for the collectionof ancillary data related to othersolid wastes (e.g., C&D debris orused oil) for those wishing to track
25Design
TIP
Build good workingrelationships withpotential
respondents before youbegin surveying byforming workgroups oradvisory councils.
TIP
Understanding howMSW andrecyclable
materials are collected,processed, consolidated,and transported in yourregion will help you designan effective recyclingmeasurement program.
TheMarylandDepartment of theEnvironment (DOE)formed a workgroup that met for 18 months to streamlinerecycling measurement reportingprocedures. Each county is respon-sible for gathering recycling mea-surement data. Previously, eachsent surveys to the recyclingprocessors operating within theircounty. Because the processorsreceived multiple informationrequests, they were less likely toadequately complete each request.As a result, the state agreed to dis-tribute a single survey to everyprocessor. In addition, the staterequested that processors supplyeach county with the necessaryinformation. The new procedurehas increased the response rate.
DOE sends the survey forms to allcounties on January 1 and toprocessors on January 15. Thecounties must report by April 1,while processors must report byFebruary 15.
Floridaformed a technicaladvisory committee com-prised of state and localofficials and recycling indus-try representatives. One ofthe main issues the committeeaddressed was confidentiality. Thecommittee decided that processorswould report directly to the state,and their data would be exemptedfrom the state’s Freedom ofInformation Act. Florida’s recyclinglegislation was amended to incorpo-rate these provisions. (See AppendixF for an excerpt of this legislation.)
Section 426
this information. Some states orlocalities, for example, might desireadditional information to meet leg-islative requirements, to measureother performance criteria, or forother purposes. Be aware, howev-er, that collecting and compilingadditional information requiresmore time and resources. Lengthysurvey forms also can intimidaterespondents and, in some cases,affect their willingness to partici-pate in the effort.
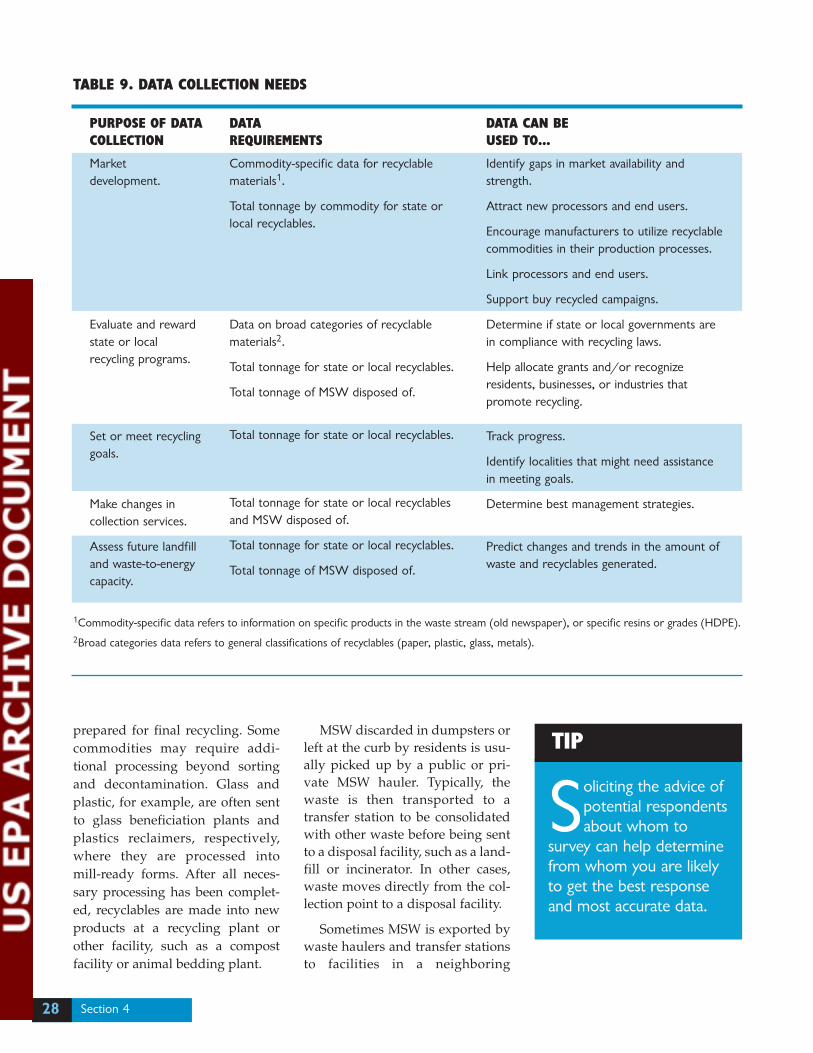
Avoid the tendency to requestmore information than you actual-ly need. For example, if you intendto use data for market develop-ment purposes, information onspecific commodities, such asnewspaper, steel cans, and plasticbottles, is essential. If, however,you are tracking your progresstoward mandated recycling goals,then collecting overall MSW andrecycling tonnages might be suffi-cient. Table 9 on page 28 providessome examples of data require-ments based on a number of differ-ent program goals and purposes.The table illustrates the importantlink between your recycling mea-surement goals and the types ofdata that must be collected in orderto meet those goals. To help defineyour data needs, consider con-structing a similar table based onyour identified goals.
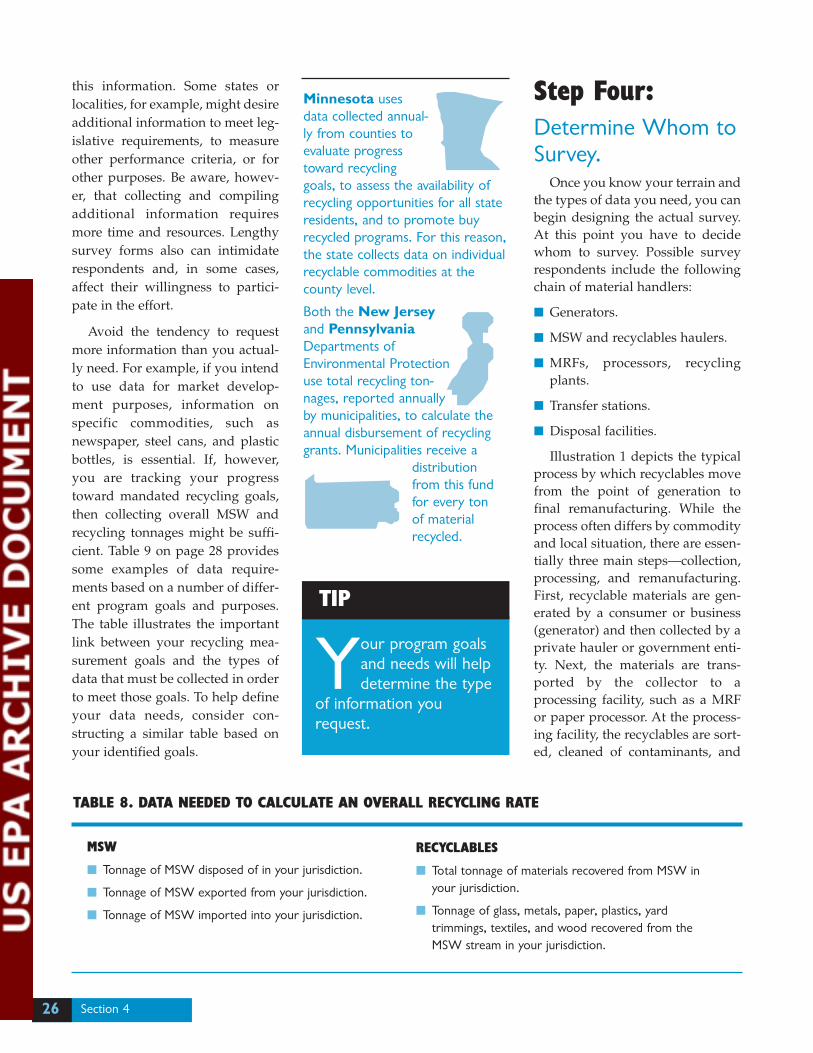
Step Four:Determine Whom toSurvey.
Once you know your terrain andthe types of data you need, you canbegin designing the actual survey.At this point you have to decidewhom to survey. Possible surveyrespondents include the followingchain of material handlers:
■ Generators.
■ MSW and recyclables haulers.
■ MRFs, processors, recyclingplants.
■ Transfer stations.
■ Disposal facilities.
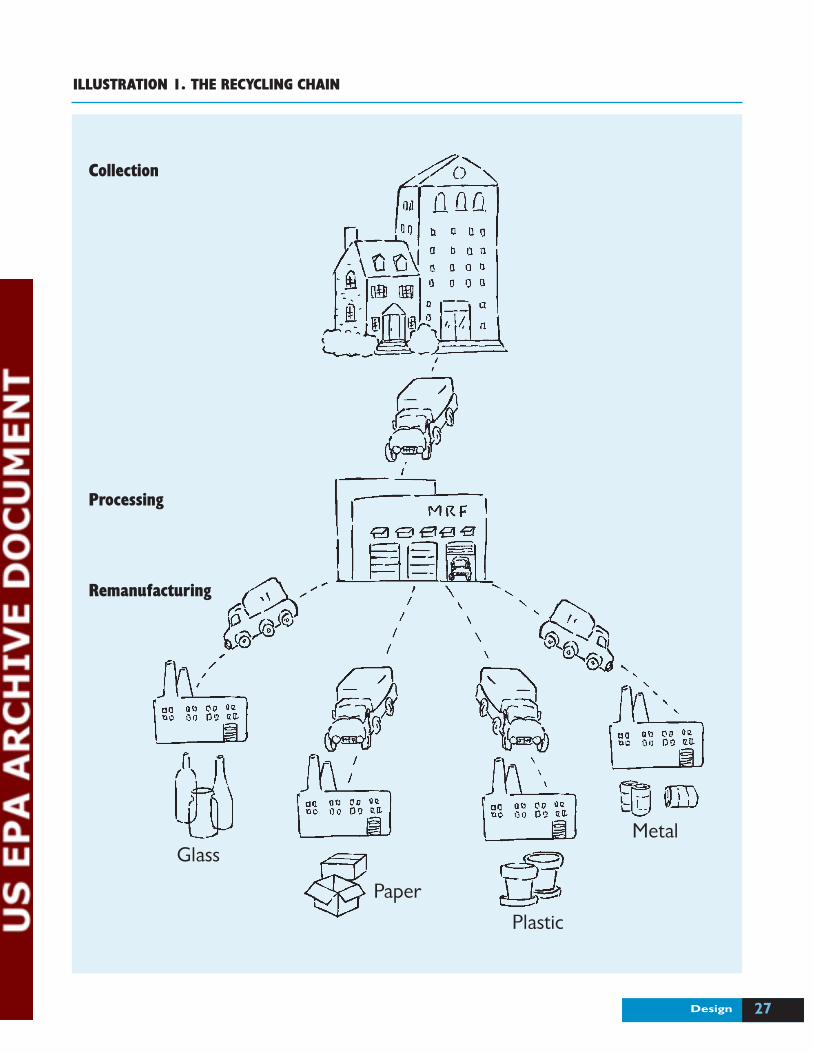
Illustration 1 depicts the typicalprocess by which recyclables movefrom the point of generation tofinal remanufacturing. While theprocess often differs by commodityand local situation, there are essen-tially three main steps—collection,processing, and remanufacturing.First, recyclable materials are gen-erated by a consumer or business(generator) and then collected by aprivate hauler or government enti-ty. Next, the materials are trans-ported by the collector to aprocessing facility, such as a MRFor paper processor. At the process-ing facility, the recyclables are sort-ed, cleaned of contaminants, and
MSW
■ Tonnage of MSW disposed of in your jurisdiction.
■ Tonnage of MSW exported from your jurisdiction.
■ Tonnage of MSW imported into your jurisdiction.
TABLE 8. DATA NEEDED TO CALCULATE AN OVERALL RECYCLING RATE
RECYCLABLES
■ Total tonnage of materials recovered from MSW inyour jurisdiction.
■ Tonnage of glass, metals, paper, plastics, yardtrimmings, textiles, and wood recovered from theMSW stream in your jurisdiction.
TIP
Your program goalsand needs will helpdetermine the type
of information yourequest.
Minnesota usesdata collected annual-ly from counties toevaluate progresstoward recyclinggoals, to assess the availability ofrecycling opportunities for all stateresidents, and to promote buyrecycled programs. For this reason,the state collects data on individualrecyclable commodities at thecounty level.
Both the New Jerseyand PennsylvaniaDepartments ofEnvironmental Protectionuse total recycling ton-nages, reported annuallyby municipalities, to calculate theannual disbursement of recyclinggrants. Municipalities receive a
distributionfrom this fundfor every ton of materialrecycled.
27Design
ILLUSTRATION 1. THE RECYCLING CHAIN
Collection
Processing
Remanufacturing
Glass
Paper
Plastic
Metal
Section 428
1Commodity-specific data refers to information on specific products in the waste stream (old newspaper), or specific resins or grades (HDPE).2Broad categories data refers to general classifications of recyclables (paper, plastic, glass, metals).
TABLE 9. DATA COLLECTION NEEDS
DATA REQUIREMENTS
Commodity-specific data for recyclablematerials1.
Total tonnage by commodity for state orlocal recyclables.
Data on broad categories of recyclablematerials2.
Total tonnage for state or local recyclables.
Total tonnage of MSW disposed of.
Total tonnage for state or local recyclables.
Total tonnage for state or local recyclablesand MSW disposed of.
Total tonnage for state or local recyclables.
Total tonnage of MSW disposed of.
PURPOSE OF DATACOLLECTION
Marketdevelopment.
Evaluate and rewardstate or localrecycling programs.
Set or meet recyclinggoals.
Make changes incollection services.
Assess future landfilland waste-to-energycapacity.
DATA CAN BE USED TO...
Identify gaps in market availability andstrength.
Attract new processors and end users.
Encourage manufacturers to utilize recyclablecommodities in their production processes.
Link processors and end users.
Support buy recycled campaigns.
Determine if state or local governments arein compliance with recycling laws.
Help allocate grants and/or recognizeresidents, businesses, or industries thatpromote recycling.
Track progress.
Identify localities that might need assistancein meeting goals.
Determine best management strategies.
Predict changes and trends in the amount ofwaste and recyclables generated.
prepared for final recycling. Somecommodities may require addi-tional processing beyond sortingand decontamination. Glass andplastic, for example, are often sentto glass beneficiation plants andplastics reclaimers, respectively,where they are processed into mill-ready forms. After all neces-sary processing has been complet-ed, recyclables are made into newproducts at a recycling plant orother facility, such as a compostfacility or animal bedding plant.
MSW discarded in dumpsters orleft at the curb by residents is usu-ally picked up by a public or pri-vate MSW hauler. Typically, thewaste is then transported to atransfer station to be consolidatedwith other waste before being sentto a disposal facility, such as a land-fill or incinerator. In other cases,waste moves directly from the col-lection point to a disposal facility.
Sometimes MSW is exported bywaste haulers and transfer stationsto facilities in a neighboring
TIP
Soliciting the advice ofpotential respondentsabout whom to
survey can help determinefrom whom you are likelyto get the best responseand most accurate data.
29Design
jurisdiction. In the same way, land-fills and other disposal facilitiesoften accept MSW imported fromother states or localities.
Determining whom to surveywill depend on:
■ Program goals and your specificdata needs.
■ Resources available for recy-cling measurement.
■ Legislative authority to surveyand collect data.
■ Likely accuracy of informationprovided.
■ Existing reporting requirementsfor haulers, processors, and endusers.
■ Type and number of recyclingoperations.
■ Type and number of disposalfacilities.
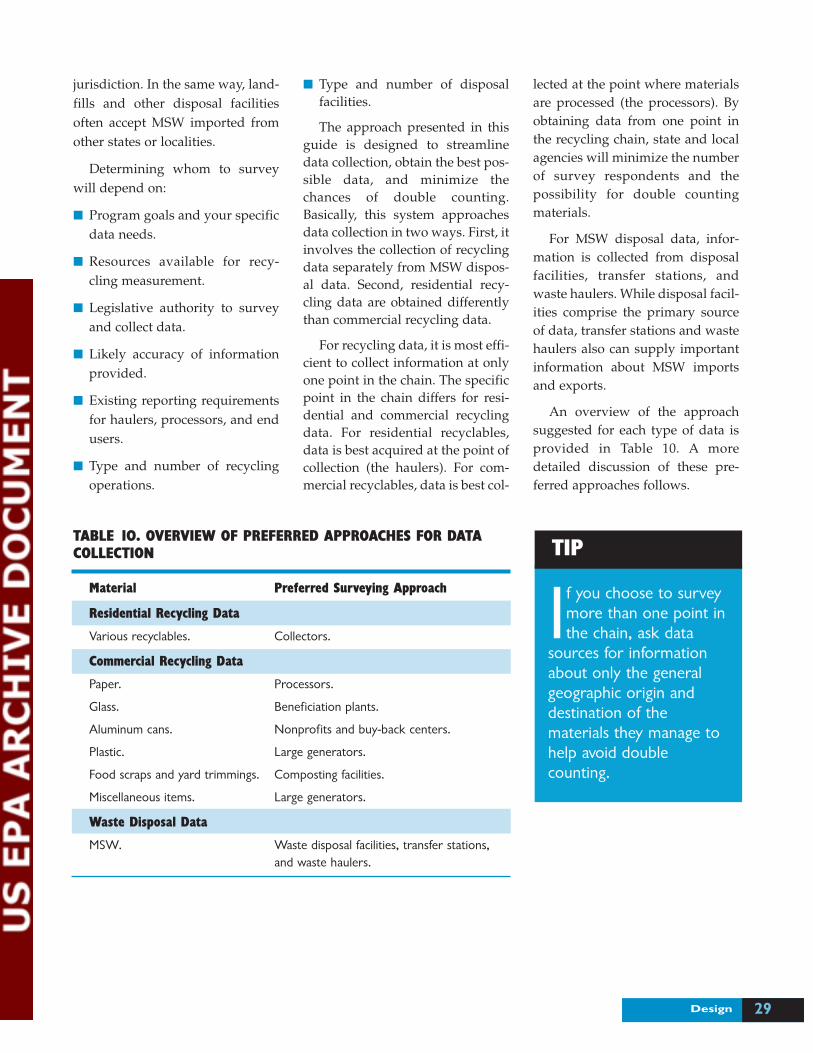
The approach presented in thisguide is designed to streamlinedata collection, obtain the best pos-sible data, and minimize thechances of double counting.Basically, this system approachesdata collection in two ways. First, itinvolves the collection of recyclingdata separately from MSW dispos-al data. Second, residential recy-cling data are obtained differentlythan commercial recycling data.
For recycling data, it is most effi-cient to collect information at onlyone point in the chain. The specificpoint in the chain differs for resi-dential and commercial recyclingdata. For residential recyclables,data is best acquired at the point ofcollection (the haulers). For com-mercial recyclables, data is best col-
lected at the point where materialsare processed (the processors). Byobtaining data from one point inthe recycling chain, state and localagencies will minimize the numberof survey respondents and thepossibility for double countingmaterials.
For MSW disposal data, infor-mation is collected from disposalfacilities, transfer stations, andwaste haulers. While disposal facil-ities comprise the primary sourceof data, transfer stations and wastehaulers also can supply importantinformation about MSW importsand exports.
An overview of the approachsuggested for each type of data isprovided in Table 10. A moredetailed discussion of these pre-ferred approaches follows.
TIP
If you choose to surveymore than one point inthe chain, ask data
sources for informationabout only the generalgeographic origin anddestination of thematerials they manage tohelp avoid doublecounting.
Material Preferred Surveying Approach
Residential Recycling Data
Various recyclables. Collectors.
Commercial Recycling Data
Paper. Processors.
Glass. Beneficiation plants.
Aluminum cans. Nonprofits and buy-back centers.
Plastic. Large generators.
Food scraps and yard trimmings. Composting facilities.
Miscellaneous items. Large generators.
Waste Disposal Data
MSW. Waste disposal facilities, transfer stations,and waste haulers.
TABLE 10. OVERVIEW OF PREFERRED APPROACHES FOR DATACOLLECTION
Recycling DataResidential
Municipally operated or con-tracted programs generally collectresidential recyclables. Such pro-grams include curbside and/ordrop-off collections. These pro-grams have grown rapidly over thepast decade, and accurate dataabout the types and quantities ofmaterials collected often are readi-ly available. For this reason, resi-dential recycling data are bestobtained from the point of collec-tion. In addition, collectors of recy-clables know better wherematerials originated than proces-sors or end users.
ResiduesNot all materials recovered
through residential collection pro-grams are recycled into new prod-ucts. Some materials are lost whenthe materials are prepared for mar-ket. These residues are difficult toaccount for and can vary in amountdepending on the specific collec-tion and processing methods used.Therefore, the standardized mea-surement methodology does notrequire that these residues betracked. While accounting forresidues results in more accuratedata, the time and resource com-mitment necessary to trackresidues for all commodities maynot be warranted.
LeakageSome residential recyclables can
escape municipal collection pro-grams. For example, nonprofitgroups and private recyclers some-times operate drop-off locations,buy-back centers, and collectionroutes outside of municipal pro-
grams. Thus, materials go directlyto the processor or end users with-out ever entering a municipal col-lection system. Being aware ofcommunity recycling activities willassist agencies in accounting forresidential recyclables collectedoutside of the municipal system.
Examples of recyclables that canescape municipal collection pro-grams, and thereby go undetectedby data collection efforts, include:
■ Newspaper collected by non-profit groups during periodicfundraising drives.
■ Beverage containers returned toredemption centers in stateswith deposit legislation (exclud-ing refillable containers).
■ Telephone directories collectedduring special drives often orga-nized by telephone companiesand nonprofit organizations.
■ Paint collected at household haz-ardous waste sites for recycling.
Commercial Materials from commercial
sources constitute a significant por-tion of the recycling stream. Forthis reason, it is important to obtaincommercial data to get an accuraterecycling rate. Materials generatedby office buildings, wholesale andretail establishments, schools, air-ports, and other institutions areoften not handled by local govern-ments and do not commonly travelthrough multimaterial operationssuch as MRFs. Instead, paper,glass, aluminum cans, and otheritems from commercial sources aregenerally handled, processed, andmarketed separately from residen-tial recyclables. Because everysurveyed material travels along a different path from collectionpoint to final use, designing anapproach specific to each materialis recommended.
In general, the preferredapproach for obtaining data oncommercial recyclables is to surveyat the processing point. If you areunable to obtain accurate data fromthe processors in your area, howev-er, consider surveying large gener-ators of recyclables or recyclingplants. Examples of large genera-tors include government facilities,corporate office complexes, grocerystores, and warehouse operations.Because these facilities recycle alarge quantity of materials, theycan be excellent sources of com-mercial recycling data. In addition,some large generators may havetheir own processing capabilities,which should not be overlookedwhen you are locating the proces-sors in your area.
An alternative to surveyingprocessors is to survey recyclingplants or other end users. Becauserecycling plants are generally
Section 430
ObtainingResidentialRecycling Data
1. Obtain data on municipalprograms from cities orcounties.
2. Contact nonprofit andprivate recyclers foradditional data.
3. Obtain data as close to thepoint of collection aspossible to ensureaccuracy.
4. Cross-check collectionfigures with data fromprocessing facilities and endusers, if necessary.
larger than processors and servicea wider area, there will be fewerplants than processors to survey.However, end users might not beable to determine the place of ori-gin of the materials they purchase.Also, if you are obtaining commer-cial data from recycling plants, it isimportant not to include data fromresidential recycling programs.Survey Form 3, for end users ofrecyclables, allows residential andcommercial data to be reportedseparately for this reason.
Approaches for gatheringcommercial data for the mostcommonly collected categories ofrecyclables are described on thefollowing pages.
Aluminum CansSurvey nonprofit recycling
facilities and buy-back centers.Restaurants, bars, airports, andlarge facilities such as shoppingmalls generate large quantities ofaluminum cans, most of which aretaken to nonprofit recycling facili-ties or buy-back centers.
If you are unable to obtain datafrom these facilities, contact alu-minum companies directly. Thesecompanies are often involved withthe collection, processing, ship-ping, and remanufacture of alu-minum cans; they also frequentlylease compaction equipment andtrailers to recycling programs.Aluminum companies can assistwith identifying large generatorsof aluminum cans in your area.
Food Scraps and YardTrimmings
Survey composting facilities.The majority of food and yardwaste collected for recycling is sentto public or private compostingfacilities. Many restaurants, super-
markets, and institutions generatefood scraps. Recycled food scrapsinclude both food scraps used aspig feed, as well as leftover foodcomposted by prisons, schools,and other facilities.
Many institutions and business-es that maintain their lawns gener-ate yard trimmings, includinggrass, leaves, and tree branches.Yard trimmings that are compostedor mulched off site should beincluded in your data. Yard trim-mings processed through backyardcomposting, grasscycling, or otheronsite efforts, however, should not,as these are considered sourcereduction activities.
Contact state or local permittingoffices to help identify permittedcomposting facilities that acceptfood scraps and yard trimmingsfrom residential or commercialsources. The permit requirementsof some localities might mandatethat the facilities report the ton-nage of material processed. Sincenot all composting facilities arepermitted, identifying all the facili-ties that process food scraps andyard trimmings might take addi-tional research. Also, a few types ofyard trimmings, namely tree trim-mings, may be sent to wood wasteprocessing facilities. These facili-ties should be contacted for data,as wood waste recycling can beincluded in the recycling rate.Remember, however, to includeonly wood from trimmings, pal-lets, and other wood packaging,like crates. Tree stumps are includ-ed only if they are recovered fromMSW; stumps from C&D projectsare excluded.
GlassSurvey beneficiation plants.
These large glass processing facili-ties convert street glass into mill-ready cullet and are the primarymarkets for glass in many regions.These processing facilities oftenhave commercial glass receiptsdetailing tonnages received fromparticular localities. Restaurantsand bars, institutions (schools),and large facilities (airports andshopping malls) all generate glassrecyclables that may be sent tothese processing facilities.
If no beneficiation plants exist inyour area, you can collect data froma variety of other sources. In someareas, municipalities pick up glassfrom commercial establishments aspart of their residential recyclingcollection program. In other areas,nonprofit recycling organizationscollect glass. Determine who col-lects commercial glass in your areaand survey these individuals usingSurvey Form 1. Remember thatonly container glass and glass frompackaging, furniture, consumerelectronics, and appliances can becounted in the recycling rate calcu-lation. Glass from transportationequipment and C&D projects isexcluded.
If you are unable to obtain accu-rate data at the collection or pro-cessing point, survey largegenerators, recycled glass plants,or appropriate trade associations.Remember, the further down therecycling chain you survey (thecloser to end use) the more difficultit will be to determine where thematerials originated and toaccount for imports or exports.
Again, make certain not toinclude glass from residential recy-cling programs with the commer-cial glass.
31Design
Section 432
PaperSurvey paper processors. Because
processors handle paper at its laststage before leaving a particularjurisdiction, they usually haveaccurate information about whichcounty or municipality generatedthe paper and can identify whatpaper has been imported.Processors collect paper from gov-ernment offices, schools, officebuildings, and a wide variety ofother institutions. The processorsclean and bale these materials, thentransport them to local recyclingplants or export them.
Keep in mind that only postcon-sumer waste paper is counted in the MSW recycling rate.Preconsumer paper, such as manu-facturing and converting wasteand overissues of newspapers andmagazines, is not counted (seeTable B on page 13). Also, onlypaper that was originally generat-ed in your jurisdiction is counted.Ask processors to exclude allimports of paper received fromoutside your area. Use SurveyForm 2, for processors of recy-clables, which requests that onlydata on materials generated withina particular jurisdiction be reported.
PlasticsSurvey large generators. The
majority of commercial plastics recy-cling is conducted by businesseswith multiple locations who gener-ate large quantities of a particularplastic item and self-haul directly toprocessors or end users. Examples ofplastic items commonly recycled bycommercial sources include stretchwrap, grocery sacks, and dry clean-ing bags. Stretch wrap is the materi-al used by product manufacturersand distributors to bind shippingcartons to pallets. Retail store distri-
bution centers and manufacturingplants generate large amounts ofstretch wrap and should be contact-ed for information on recyclingefforts. For information on plasticbag recycling, contact large drycleaners and grocery store chains.
If you are unable to obtain accu-rate data from large generators,survey plastics reclaimers or endusers. Trade associations may beable to help you locate reclaimersand end users in your area.
Other Miscellaneous ItemsSurvey large generators. As
recycling technology develops,more and more items are recoveredfrom MSW and developed intonew products. Many companieshave taken the lead and areexpanding their recycling pro-grams to include such items ascomputer parts, microfilm, poly-styrene, and other materials.Examples include governmentagencies (office products), univer-sities and schools (polystyrene andcomputers), and manufacturingplants (pallets). While some ofthese materials may be a small per-centage of the waste stream,including them will increase theaccuracy of your recycling rate andhelp remind recycling officials thatthese materials can be part of a newor expanded recycling program.
Waste Disposal DataIn order to determine total MSW
generation for the recycling ratecalculation, data are needed on theamount of MSW disposed of inyour jurisdiction. Because eachcommunity’s waste stream isdifferent, surveying local disposalfacilities can ensure accurate wastedisposal data and help you accountfor imports of waste. Disposal facil-ities include private and publiclandfills, waste-to-energy facilities,and incinerators. It is critical toinclude only MSW.
In addition, be careful to accountfor imports and exports of waste,and exclude from the data anynatural disaster materials and wastedefined as Other Solid Waste. (Seethe Glossary in Appendix A forcomplete definitions.)
Disposal facilities are goodsources of information on MSWimports, while transfer stationsand haulers can supply data on theamount of MSW exported fromyour jurisdiction. Disposal facilitiesand transfer stations will have aneasier time differentiating betweenMSW and other solid wastebecause they have the capability toinspect each incoming load anddetermine how much of the wasteis MSW. On the other hand, wastehaulers can estimate the percentageof MSW on the basis of customerlists. These points are important tokeep in mind as you decide whomto survey.
Other Sources of MSWDisposal Data
Disposal facilities, transfer sta-tions, and waste haulers are the mainsources of waste disposal data, butthey are not the only sources. Keep in
TIP
Staying abreast of newrecycling technologycan help you account
for additional sources ofcommercial recycling data.
mind that waste disposal data can beobtained from two additionalsources: (1) processing facilities thatare preparing recovered materials,such as tires or wood waste, for fuelmarkets, and (2) large generatorsthat dispose of waste on site or self-haul waste to facilities out of yourjurisdiction. While they might notsignificantly impact your recyclingrate, knowing the extent of theseactivities will help you in your plan-ning efforts.
Step FiveAddressConfidentialityGuarantees.
Understanding and addressingthe confidentiality concerns of therecycling and MSW industries iscritical to ensuring a high responserate, especially if you are relyingon a voluntary reporting system.Confidentiality is an important
concern to many haulers andprocessors who might be reluctantto share proprietary information.Although confidentiality concernspresent potential roadblocks, anumber of programs have success-fully addressed this issue. Somesuggestions for ensuring confiden-tiality include:
■ Avoid asking for customer listson survey forms.
■ Obtain a legislative exemptionfrom your state’s Freedom ofInformation Act. (See AppendixF for sample legislation from thestate of Florida.)
■ Agree not to release proprietaryinformation used to compute arecycling rate.
■ Ask survey respondents to mark sensitive information as“confidential.”
■ Use a third-party (accountingfirm or trade association) toaggregate data, while keeping thesources of material confidential.
If necessary, collect recyclinginformation from recycling plants,which tend to be less reluctant thanother data sources to share aggre-gate tonnage information.
Step SixDetermine How toManage and Analyzethe Information.
Information is not useful unlessit is meaningful and easy to access.Be sure to invest sufficient timeand effort into developing an infor-mation management system thatallows you to use the informationyou gather. There are numerous
software packages, including data-bases and spreadsheets, that canhelp you manage and analyze thedata you collect.
Using computers to compile andmaintain data improves the efficien-cy of data analysis and management.They streamline the process andminimize the level of effort requiredto manage the data. Governmentagencies use software packagessuch as Foxpro, Paradox, andExcel. (EPA does not endorse anyparticular product.) All of thesepackages can be operated on a PCwith standard components—DOSor Windows, a 486 PC, 8 MB RAM,and an 850 MB hard drive. While adatabase system is more adept atorganizing information, it usuallyhas greater design requirementsand calls for a substantial dataentry effort. Also, a database typi-cally requires that one staff personbe dedicated to its operation due toits highly technical nature, whereasseveral staff members can betrained to operate a spreadsheet. A spreadsheet system managesnumerical data more efficiently,
33Design
In several states and locali-ties, disposal facilities arerequired to report tonnageinformation in orderto hold a permit. InMinnesota,Texas, Ohio, andNew York, for exam-ple, disposal facilitiesreport the quantity ofwaste handled to fulfillpermit requirements.In Oregon, landfilloperators reporttonnage data in con-junction with a perton disposal fee leviedby the state.
Many state and localagencies use database andspreadsheet systems to compile and manage data. Florida uses a spreadsheet andhas advised counties to purchaseExcel using state grant money. Thisenables Florida to send each coun-ty a disk to use for reporting data.The state ofWashington usesa combination system of both adatabase and a spreadsheet. Thedatabase is used for data entrypurposes, while the spreadsheet isused to perform calculations.
Section 434
Exports and Imports
The standard measurementmethodology requires that export-ed MSW and recyclables be includ-ed in your recycling ratecalculation, while imported MSWand recyclables be excluded. Whendeciding whom to survey, it isimportant to consider how you willtrack exports and imports. Trackingexports and imports will provideyou with an accurate picture of thetotal amount of MSW generatedand recycled in your jurisdiction.Below are some suggestions forhow to accurately account for themovement of materials in and outof your state or locality.
Recyclables
Obtaining residential recycling data from the point of collectionminimizes the danger of missingexported materials or countingmaterials that were imported fromoutside your jurisdiction.
If you choose to survey processingfacilities and end users, be awarethat data from these sources aremore likely to include materialsfrom outside your jurisdiction(imports). When surveying thesefacilities, be very clear in yourinstructions that you are seekinginformation only on materials thatoriginated in your state or locality.The survey forms included with thisguide ask respondents to report
only materials from a particularjurisdiction.
The best way to obtain commercialrecycling export data is to surveylarge generators, because theymight be collecting, consolidating,or transporting recyclables on theirown. These generators often recy-cle large quantities of office paperand old corrugated containers,yard trimmings, wood packaging(pallets and crates), scrap metal,and miscellaneous items such asmicrofilm, computers, and furniture.
If you survey only processors, youmight miss some materials collectedby private haulers and processedoutside of your jurisdiction(exports). If you have theresources, consider contactingprivate recycling haulers to estimatethe amount of material exportedfrom your state or locality for pro-cessing or remanufacture.
MSW
Determining quantities of exportsand imports requires an under-standing of the waste flow in yourarea. If you know the waste man-agement infrastructure in yourarea, you will have a sense of theamount of exporting and importingtaking place. A good place to startin determining the amount ofMSW being exported is to surveywaste haulers, since they are thefirst point in the disposal chain.Transfer stations are also good
sources of information on wasteexports.
For imports, accurate data can beobtained by surveying landfills,incinerators, and waste-to-energyfacilities. State and local govern-ments that ask for import datafrom disposal facilities have foundthat the facilities are not hesitant toprovide this information.
The survey forms included with thisguide are designed to make it easyfor data sources to report informa-tion on MSW imports and exports.
States gather information aboutexports from a variety of sources.Minnesota deter-mined the majority ofwaste leaving the statewas going throughtransfer stations, sothese facilities were surveyed forthis information. Washingtonknows that onlyone landfill in thestate receives imported waste andthat all waste exported from thestate is taken to a landfill inOregon. Officials inMecklenburgCounty,North Carolina, decided tolicense waste haulers as a way totrack exports. A court ruling inAlabama concluded the state couldrequire reporting of information onthe destination of waste, but couldnot mandate where the haulers dis-posed of waste.
and it allows agencies to mergeinformation from individual disksreceived from reporting entitiesonto a master file, thus minimizingthe need for data entry. A spread-sheet system, however, does notallow for the easy manipulation of
text. Therefore, database programshave emerged as the leading soft-ware application for recycling mea-surement.
An alternative to using only aspreadsheet or a database is to use
a combination of both types of software. For example, surveyrespondents could report data on aspreadsheet, and you could use a computer program to convert the data for importation into adatabase.
35Design
EstimationUnder the standard methodology,estimation of data on MSW recy-cling and disposal is acceptable aslong as the estimates are based ongood, solid knowledge of thesources and flow of MSW in yourarea, and the estimates are noted.Collecting raw data is the preferredapproach for obtaining all data nec-essary to calculate a recycling rate.In some cases, however, datasources may be unable to provideinformation on certain materialsthat cannot be easily measured dueto the way they are managed. Forexample, commercial MSW is oftencollected in the same vehicles as
MSW from multifamily residentialbuildings due to the use of similarwaste containers. Also, MSW andmaterials classified as Other SolidWaste (C&D debris) are some-times mixed together during collec-tion and sent to disposal facilities inthe same vehicle or container. Inthese cases, it may be necessary toestimate separate totals for the dif-ferent types of waste.
In Arlington County, Virginia,MSW from multifamily residences(apartments and condominiums)and commercial businesses isaggregated togetherduringcollection.
Waste haulers are therefore unableto differentiate between residentialand commercial waste. To estimatethe amount of MSW from multi-family residences disposed of attheir waste-to-energy facility, offi-cials multiply the total multifamilypopulation (obtained from censusdata) by the average number ofpounds of MSW generated perperson (obtained from a localstudy). This number is added tothe amount of MSW generated bysingle-family homes, which is moreeasily tracked because it is collectedseparately, to arrive at a total resi-dential MSW figure.
Double CountingIn an attempt to collect compre-hensive, accurate data on recyclingand waste disposal, many agencieshave encountered instances of dou-ble counting of data. The best wayto avoid double counting is to col-lect data from only one point inthe chain—either collectors, proces-sors, or end users (disposal facilitiesor recycling plants).
Florida surveysonly large processorsthat handle more than 600tons of recyclables per year.Since most of the recyclablesultimately pass through these largeprocessors before leaving the state,complete data are captured with-out having to consider doublecounting.
Washington’s approach of onlysurveying at the collection point
avoids doublecounting while atthe same time pro-
duces reliable information on thesource of materials, which is usefulfor tracking recycling at the countylevel.
In New Jersey, the scrapmetal industry has developeda mechanism for reportingrecycling data to the statethat avoids double counting,streamlines data collection, andalso ensures confidentiality. TheNew Jersey chapter of the Instituteof Scrap Recycling Industries (anational trade association) sends asurvey form that it developed to allits members, employs an account-ing firm to aggregate the data, andreports the total to the statedirectly. The survey form includesthe names of the six major scrapprocessors and end users in thestate, through which most of thescrap metal in the state eventuallypasses. These six companies reportthe total amount of scrap metalreceived from sources within NewJersey. Other companies report
data only if the metal was sent to acompany other than the six majorprocessors and end users.
As a result of this system, data isnot counted twice, businesses havea greater incentive to report accu-rate data since they do not have toreveal proprietary information, andcomplete data is captured since allthe major players are surveyed. Inaddition, the state’s recycling mea-surement costs are reduced. A dis-advantage of this system, however,is that the state is unable to verifythe accuracy of the data. In addi-tion to being used in New Jersey,this system was recently codified bythe Tennessee legislature.
Step OneInstitute Measures toIncrease Your SurveyResponse Rate.
Mailing survey forms to poten-tial respondents does not guaran-tee they will comply with yourinformation request. A variety oftechniques can be employed toincrease your survey response rate,and you should pick those thatmeet your particular needs. Someexamples include:
■ Send a cover letter. Attach a coverletter to the survey formsexplaining the what, why, andhow of your program. Samplecover letters for three types ofrespondents are provided inAppendix G.
■ Designate a contact person. Offerassistance to respondents byproviding a contact name andtelephone number to call if they have questions. Space is provided on the survey
forms in Appendix C for thisinformation.
■ Fill out survey information inadvance. Filling out as much ofthe information on the surveyform for the respondents as pos-sible will help expedite the sur-vey process.
■ Use the media. The media alsocan be used to enhance report-ing. Special events are anotheropportunity to showcase posi-tive results.
■ Send survey forms with grantapplications. If applicable, attachsurvey forms to recycling grantapplications. Indicate that recy-cling grant applications must besubmitted with a completed sur-vey form in order to be eligible.
37Implementation
Now that you have planned and designed your
recycling measurement system, you are ready to
distribute the survey forms, compile the data,
and calculate your annual recycling rate. This section outlines
the steps involved in implementing your measurement system
after it has been developed.
SE
CT
ION
5Implementation
Implementation Steps
1. Institute measures toincrease your surveyresponse rate.
2. Educate surveyrespondents.
3. Distribute survey forms.4. Maintain frequent
communication withsurvey respondents.
5. Compile data andcalculate an MSWrecycling rate.
6. Verify and double-checkdata.
7. Share information.
Minnesota merges its survey mailing list with its survey form sothat the respondent information is already filled in. The state alsofills in recycling data for certain materials, such as lead-acid batteries,based on statewide figures. If the local government has better data,
it can revise the state’s estimate.
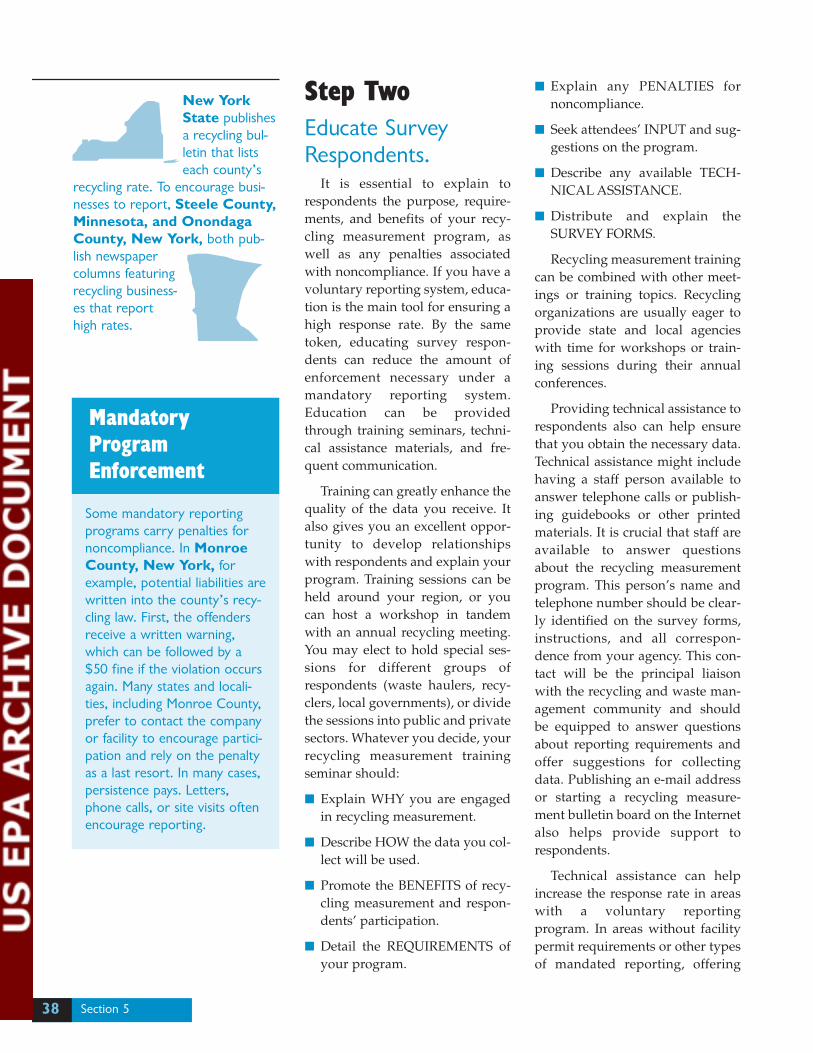
Step TwoEducate SurveyRespondents.
It is essential to explain torespondents the purpose, require-ments, and benefits of your recy-cling measurement program, aswell as any penalties associatedwith noncompliance. If you have avoluntary reporting system, educa-tion is the main tool for ensuring ahigh response rate. By the sametoken, educating survey respon-dents can reduce the amount ofenforcement necessary under amandatory reporting system.Education can be providedthrough training seminars, techni-cal assistance materials, and fre-quent communication.
Training can greatly enhance thequality of the data you receive. Italso gives you an excellent oppor-tunity to develop relationshipswith respondents and explain yourprogram. Training sessions can beheld around your region, or youcan host a workshop in tandemwith an annual recycling meeting.You may elect to hold special ses-sions for different groups ofrespondents (waste haulers, recy-clers, local governments), or dividethe sessions into public and privatesectors. Whatever you decide, yourrecycling measurement trainingseminar should:
■ Explain WHY you are engagedin recycling measurement.
■ Describe HOW the data you col-lect will be used.
■ Promote the BENEFITS of recy-cling measurement and respon-dents’ participation.
■ Detail the REQUIREMENTS ofyour program.
■ Explain any PENALTIES fornoncompliance.
■ Seek attendees’ INPUT and sug-gestions on the program.
■ Describe any available TECH-NICAL ASSISTANCE.
■ Distribute and explain theSURVEY FORMS.
Recycling measurement trainingcan be combined with other meet-ings or training topics. Recyclingorganizations are usually eager toprovide state and local agencieswith time for workshops or train-ing sessions during their annualconferences.
Providing technical assistance torespondents also can help ensurethat you obtain the necessary data.Technical assistance might includehaving a staff person available toanswer telephone calls or publish-ing guidebooks or other printedmaterials. It is crucial that staff areavailable to answer questionsabout the recycling measurementprogram. This person’s name andtelephone number should be clear-ly identified on the survey forms,instructions, and all correspon-dence from your agency. This con-tact will be the principal liaisonwith the recycling and waste man-agement community and shouldbe equipped to answer questionsabout reporting requirements andoffer suggestions for collectingdata. Publishing an e-mail addressor starting a recycling measure-ment bulletin board on the Internetalso helps provide support torespondents.
Technical assistance can helpincrease the response rate in areaswith a voluntary reportingprogram. In areas without facilitypermit requirements or other typesof mandated reporting, offering
Section 538
New YorkState publishesa recycling bul-letin that listseach county’s
recycling rate. To encourage busi-nesses to report, Steele County,Minnesota, and OnondagaCounty, New York, both pub-lish newspapercolumns featuringrecycling business-es that reporthigh rates.
Mandatory ProgramEnforcement
Some mandatory reportingprograms carry penalties fornoncompliance. In MonroeCounty, New York, forexample, potential liabilities arewritten into the county’s recy-cling law. First, the offendersreceive a written warning,which can be followed by a$50 fine if the violation occursagain. Many states and locali-ties, including Monroe County,prefer to contact the companyor facility to encourage partici-pation and rely on the penaltyas a last resort. In many cases,persistence pays. Letters,phone calls, or site visits oftenencourage reporting.
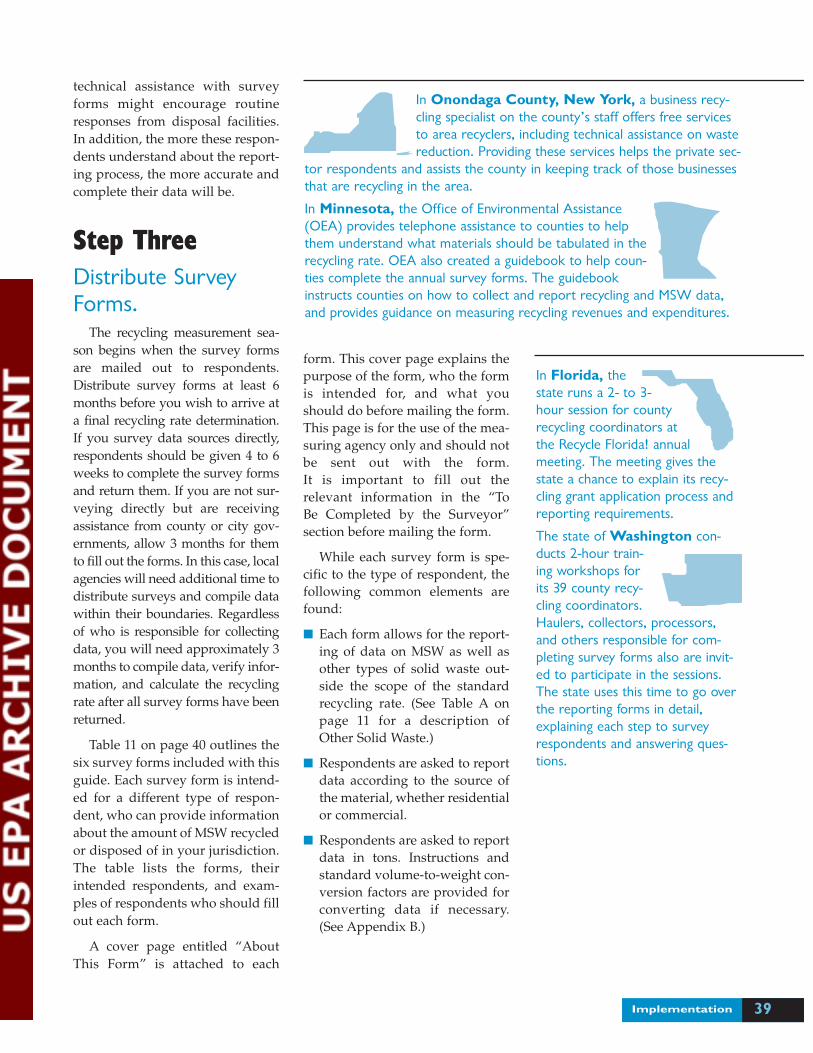
39
technical assistance with surveyforms might encourage routineresponses from disposal facilities.In addition, the more these respon-dents understand about the report-ing process, the more accurate andcomplete their data will be.
Step ThreeDistribute SurveyForms.
The recycling measurement sea-son begins when the survey formsare mailed out to respondents.Distribute survey forms at least 6months before you wish to arrive ata final recycling rate determination.If you survey data sources directly,respondents should be given 4 to 6weeks to complete the survey formsand return them. If you are not sur-veying directly but are receivingassistance from county or city gov-ernments, allow 3 months for themto fill out the forms. In this case, localagencies will need additional time todistribute surveys and compile datawithin their boundaries. Regardlessof who is responsible for collectingdata, you will need approximately 3months to compile data, verify infor-mation, and calculate the recyclingrate after all survey forms have beenreturned.
Table 11 on page 40 outlines thesix survey forms included with thisguide. Each survey form is intend-ed for a different type of respon-dent, who can provide informationabout the amount of MSW recycledor disposed of in your jurisdiction.The table lists the forms, theirintended respondents, and exam-ples of respondents who should fillout each form.
A cover page entitled “AboutThis Form” is attached to each
form. This cover page explains thepurpose of the form, who the formis intended for, and what youshould do before mailing the form.This page is for the use of the mea-suring agency only and should notbe sent out with the form. It is important to fill out the relevant information in the “To Be Completed by the Surveyor” section before mailing the form.
While each survey form is spe-cific to the type of respondent, thefollowing common elements arefound:
■ Each form allows for the report-ing of data on MSW as well asother types of solid waste out-side the scope of the standardrecycling rate. (See Table A onpage 11 for a description ofOther Solid Waste.)
■ Respondents are asked to reportdata according to the source ofthe material, whether residentialor commercial.
■ Respondents are asked to reportdata in tons. Instructions andstandard volume-to-weight con-version factors are provided forconverting data if necessary.(See Appendix B.)
Implementation
In Onondaga County, New York, a business recy-cling specialist on the county’s staff offers free servicesto area recyclers, including technical assistance on wastereduction. Providing these services helps the private sec-
tor respondents and assists the county in keeping track of those businessesthat are recycling in the area.
In Minnesota, the Office of Environmental Assistance(OEA) provides telephone assistance to counties to helpthem understand what materials should be tabulated in therecycling rate. OEA also created a guidebook to help coun-ties complete the annual survey forms. The guidebookinstructs counties on how to collect and report recycling and MSW data,and provides guidance on measuring recycling revenues and expenditures.
In Florida, thestate runs a 2- to 3-hour session for countyrecycling coordinators atthe Recycle Florida! annualmeeting. The meeting gives thestate a chance to explain its recy-cling grant application process andreporting requirements.
The state of Washington con-ducts 2-hour train-ing workshops forits 39 county recy-cling coordinators.Haulers, collectors, processors,and others responsible for com-pleting survey forms also are invit-ed to participate in the sessions.The state uses this time to go overthe reporting forms in detail,explaining each step to surveyrespondents and answering ques-tions.
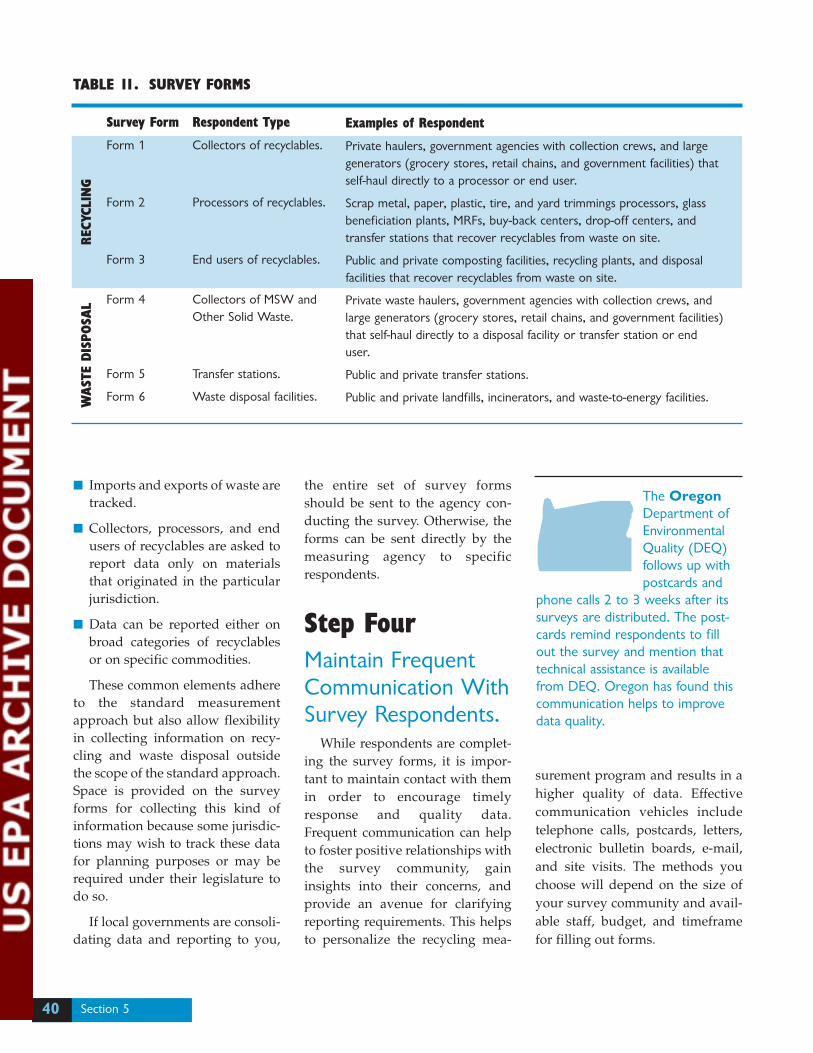
Section 540
■ Imports and exports of waste aretracked.
■ Collectors, processors, and endusers of recyclables are asked toreport data only on materialsthat originated in the particularjurisdiction.
■ Data can be reported either onbroad categories of recyclablesor on specific commodities.
These common elements adhereto the standard measurementapproach but also allow flexibilityin collecting information on recy-cling and waste disposal outsidethe scope of the standard approach.Space is provided on the surveyforms for collecting this kind ofinformation because some jurisdic-tions may wish to track these datafor planning purposes or may berequired under their legislature todo so.
If local governments are consoli-dating data and reporting to you,
the entire set of survey formsshould be sent to the agency con-ducting the survey. Otherwise, theforms can be sent directly by themeasuring agency to specificrespondents.
Step FourMaintain FrequentCommunication WithSurvey Respondents.
While respondents are complet-ing the survey forms, it is impor-tant to maintain contact with themin order to encourage timelyresponse and quality data.Frequent communication can helpto foster positive relationships withthe survey community, gaininsights into their concerns, andprovide an avenue for clarifyingreporting requirements. This helpsto personalize the recycling mea-
surement program and results in ahigher quality of data. Effectivecommunication vehicles includetelephone calls, postcards, letters,electronic bulletin boards, e-mail,and site visits. The methods youchoose will depend on the size ofyour survey community and avail-able staff, budget, and timeframefor filling out forms.
Examples of Respondent
Private haulers, government agencies with collection crews, and largegenerators (grocery stores, retail chains, and government facilities) thatself-haul directly to a processor or end user.
Scrap metal, paper, plastic, tire, and yard trimmings processors, glassbeneficiation plants, MRFs, buy-back centers, drop-off centers, andtransfer stations that recover recyclables from waste on site.
Public and private composting facilities, recycling plants, and disposalfacilities that recover recyclables from waste on site.
Private waste haulers, government agencies with collection crews, andlarge generators (grocery stores, retail chains, and government facilities)that self-haul directly to a disposal facility or transfer station or enduser.
Public and private transfer stations.
Public and private landfills, incinerators, and waste-to-energy facilities.
TABLE 11. SURVEY FORMS
Survey Form
Form 1
Form 2
Form 3
Form 4
Form 5
Form 6
Respondent Type
Collectors of recyclables.
Processors of recyclables.
End users of recyclables.
Collectors of MSW andOther Solid Waste.
Transfer stations.
Waste disposal facilities.
The OregonDepartment ofEnvironmentalQuality (DEQ)follows up withpostcards and
phone calls 2 to 3 weeks after itssurveys are distributed. The post-cards remind respondents to fillout the survey and mention thattechnical assistance is availablefrom DEQ. Oregon has found thiscommunication helps to improvedata quality.
WA
STE
DIS
POSA
L
REC
YCLI
NG
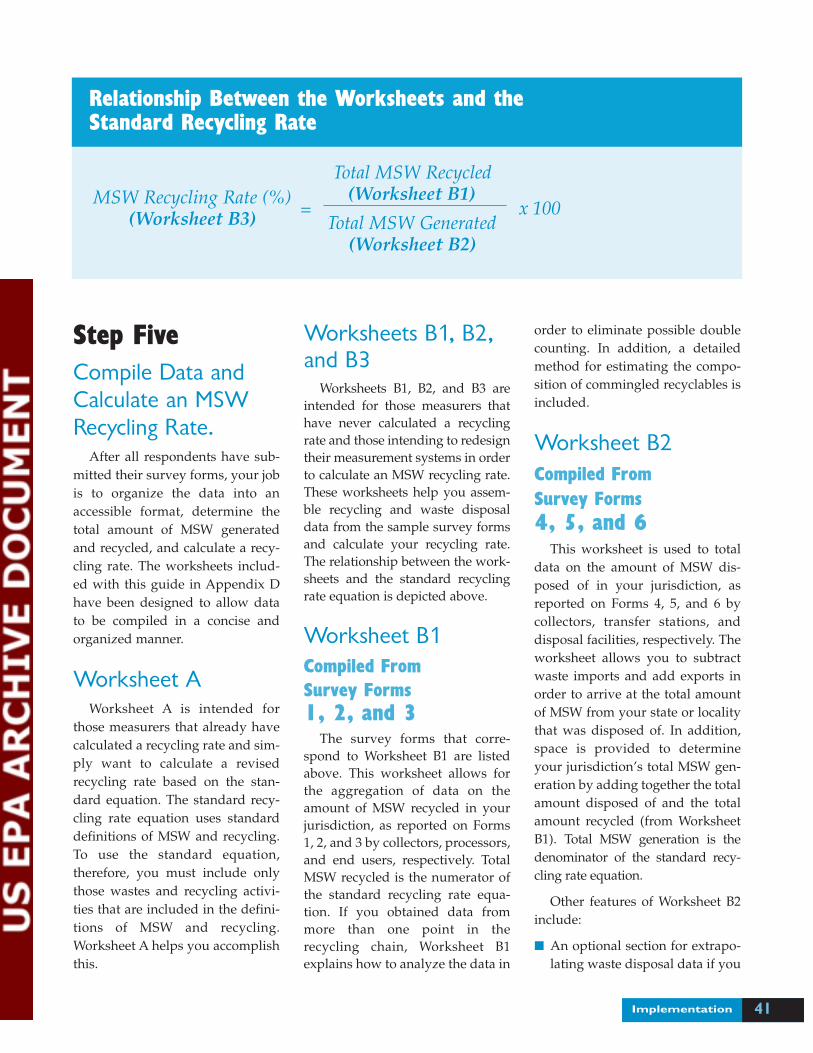
41Implementation
Step FiveCompile Data andCalculate an MSWRecycling Rate.
After all respondents have sub-mitted their survey forms, your jobis to organize the data into anaccessible format, determine thetotal amount of MSW generatedand recycled, and calculate a recy-cling rate. The worksheets includ-ed with this guide in Appendix Dhave been designed to allow datato be compiled in a concise andorganized manner.
Worksheet AWorksheet A is intended for
those measurers that already havecalculated a recycling rate and sim-ply want to calculate a revisedrecycling rate based on the stan-dard equation. The standard recy-cling rate equation uses standarddefinitions of MSW and recycling.To use the standard equation,therefore, you must include onlythose wastes and recycling activi-ties that are included in the defini-tions of MSW and recycling.Worksheet A helps you accomplishthis.
Worksheets B1, B2,and B3
Worksheets B1, B2, and B3 areintended for those measurers thathave never calculated a recyclingrate and those intending to redesigntheir measurement systems in orderto calculate an MSW recycling rate.These worksheets help you assem-ble recycling and waste disposaldata from the sample survey formsand calculate your recycling rate.The relationship between the work-sheets and the standard recyclingrate equation is depicted above.
Worksheet B1Compiled From Survey Forms 1, 2, and 3
The survey forms that corre-spond to Worksheet B1 are listedabove. This worksheet allows forthe aggregation of data on theamount of MSW recycled in yourjurisdiction, as reported on Forms1, 2, and 3 by collectors, processors,and end users, respectively. TotalMSW recycled is the numerator ofthe standard recycling rate equa-tion. If you obtained data frommore than one point in therecycling chain, Worksheet B1explains how to analyze the data in
order to eliminate possible doublecounting. In addition, a detailedmethod for estimating the compo-sition of commingled recyclables isincluded.
Worksheet B2Compiled From Survey Forms 4, 5, and 6
This worksheet is used to totaldata on the amount of MSW dis-posed of in your jurisdiction, asreported on Forms 4, 5, and 6 bycollectors, transfer stations, anddisposal facilities, respectively. Theworksheet allows you to subtractwaste imports and add exports inorder to arrive at the total amountof MSW from your state or localitythat was disposed of. In addition,space is provided to determineyour jurisdiction’s total MSW gen-eration by adding together the totalamount disposed of and the totalamount recycled (from WorksheetB1). Total MSW generation is thedenominator of the standard recy-cling rate equation.
Other features of Worksheet B2include:
■ An optional section for extrapo-lating waste disposal data if you
Relationship Between the Worksheets and the Standard Recycling Rate
MSW Recycling Rate (%)(Worksheet B3)
Total MSW Recycled(Worksheet B1)
Total MSW Generated(Worksheet B2)
x 100=
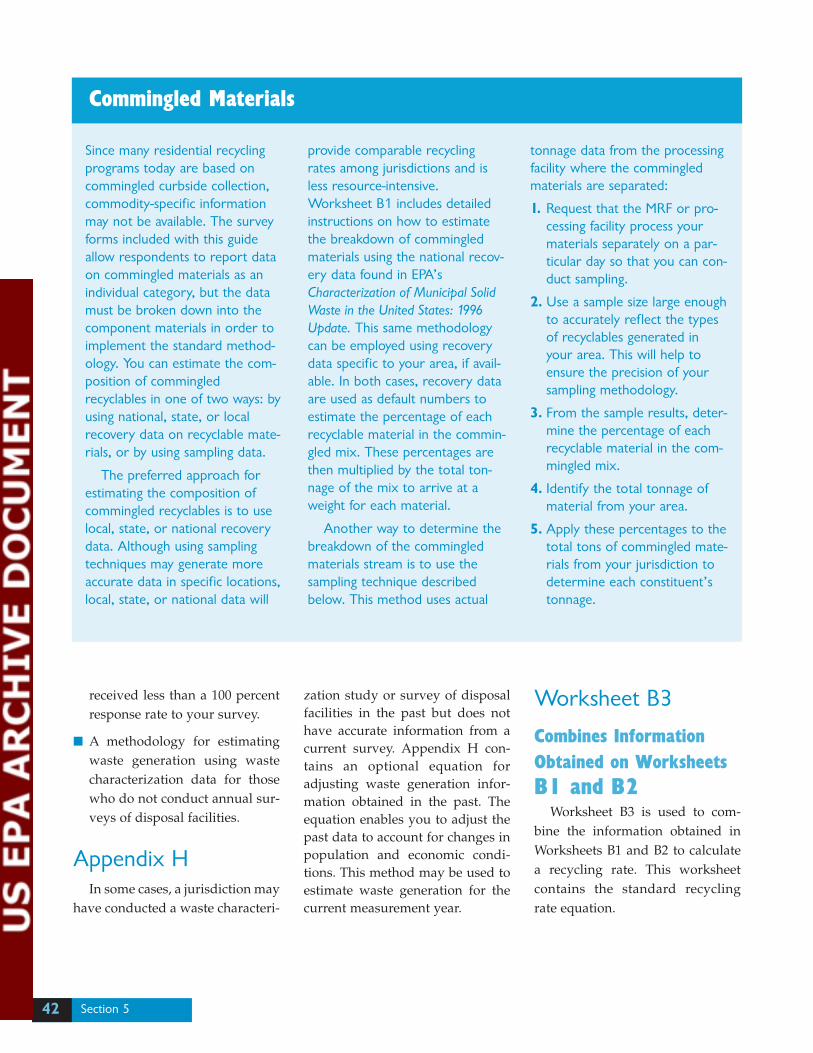
Section 542
Commingled Materials
Since many residential recyclingprograms today are based oncommingled curbside collection,commodity-specific informationmay not be available. The surveyforms included with this guideallow respondents to report dataon commingled materials as anindividual category, but the datamust be broken down into thecomponent materials in order toimplement the standard method-ology. You can estimate the com-position of commingledrecyclables in one of two ways: byusing national, state, or localrecovery data on recyclable mate-rials, or by using sampling data.
The preferred approach forestimating the composition ofcommingled recyclables is to uselocal, state, or national recoverydata. Although using samplingtechniques may generate moreaccurate data in specific locations,local, state, or national data will
provide comparable recyclingrates among jurisdictions and isless resource-intensive.Worksheet B1 includes detailedinstructions on how to estimatethe breakdown of commingledmaterials using the national recov-ery data found in EPA’sCharacterization of Municipal SolidWaste in the United States: 1996Update. This same methodologycan be employed using recoverydata specific to your area, if avail-able. In both cases, recovery dataare used as default numbers toestimate the percentage of eachrecyclable material in the commin-gled mix. These percentages arethen multiplied by the total ton-nage of the mix to arrive at aweight for each material.
Another way to determine thebreakdown of the commingledmaterials stream is to use thesampling technique describedbelow. This method uses actual
tonnage data from the processingfacility where the commingledmaterials are separated:
1. Request that the MRF or pro-cessing facility process yourmaterials separately on a par-ticular day so that you can con-duct sampling.
2. Use a sample size large enoughto accurately reflect the typesof recyclables generated inyour area. This will help toensure the precision of yoursampling methodology.
3. From the sample results, deter-mine the percentage of eachrecyclable material in the com-mingled mix.
4. Identify the total tonnage ofmaterial from your area.
5. Apply these percentages to thetotal tons of commingled mate-rials from your jurisdiction todetermine each constituent’stonnage.
received less than a 100 percentresponse rate to your survey.
■ A methodology for estimatingwaste generation using wastecharacterization data for thosewho do not conduct annual sur-veys of disposal facilities.
Appendix HIn some cases, a jurisdiction may
have conducted a waste characteri-
zation study or survey of disposalfacilities in the past but does nothave accurate information from acurrent survey. Appendix H con-tains an optional equation foradjusting waste generation infor-mation obtained in the past. Theequation enables you to adjust thepast data to account for changes inpopulation and economic condi-tions. This method may be used toestimate waste generation for thecurrent measurement year.
Worksheet B3
Combines InformationObtained on WorksheetsB1 and B2
Worksheet B3 is used to com-bine the information obtained inWorksheets B1 and B2 to calculatea recycling rate. This worksheetcontains the standard recyclingrate equation.
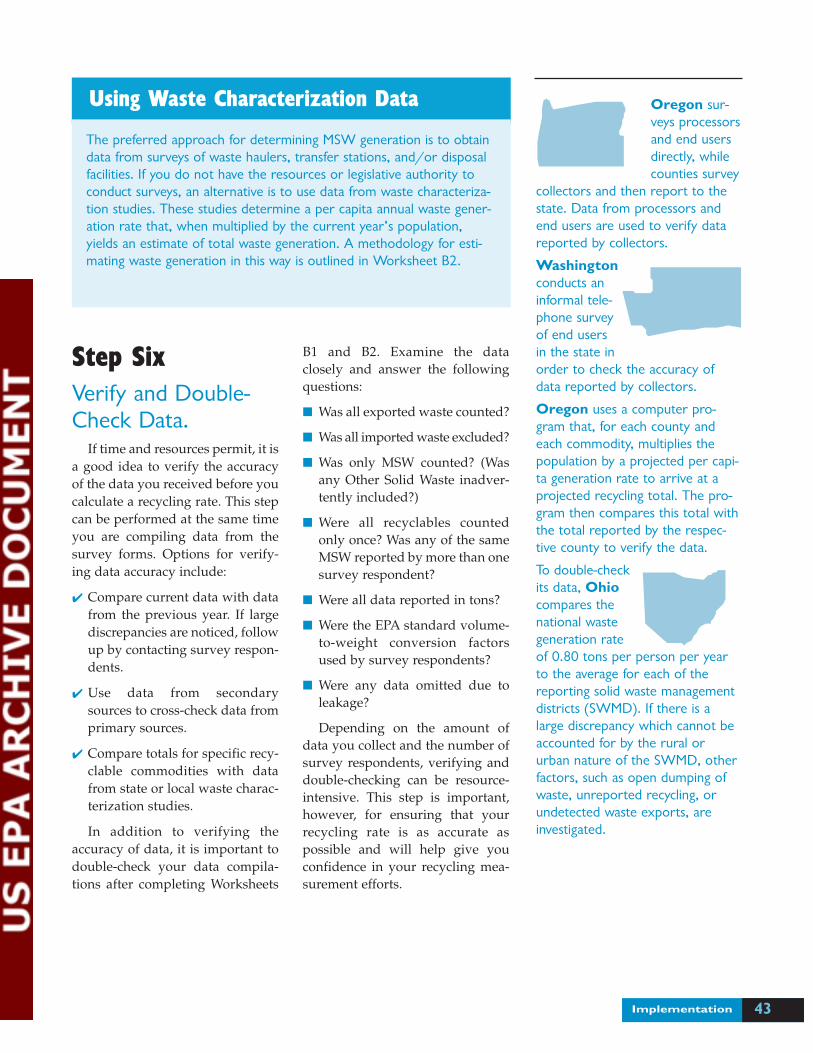
Step SixVerify and Double-Check Data.
If time and resources permit, it isa good idea to verify the accuracyof the data you received before youcalculate a recycling rate. This stepcan be performed at the same timeyou are compiling data from thesurvey forms. Options for verify-ing data accuracy include:
✔ Compare current data with datafrom the previous year. If largediscrepancies are noticed, followup by contacting survey respon-dents.
✔ Use data from secondarysources to cross-check data fromprimary sources.
✔ Compare totals for specific recy-clable commodities with datafrom state or local waste charac-terization studies.
In addition to verifying theaccuracy of data, it is important todouble-check your data compila-tions after completing Worksheets
B1 and B2. Examine the dataclosely and answer the followingquestions:
■ Was all exported waste counted?
■ Was all imported waste excluded?
■ Was only MSW counted? (Wasany Other Solid Waste inadver-tently included?)
■ Were all recyclables countedonly once? Was any of the sameMSW reported by more than onesurvey respondent?
■ Were all data reported in tons?
■ Were the EPA standard volume-to-weight conversion factorsused by survey respondents?
■ Were any data omitted due toleakage?
Depending on the amount ofdata you collect and the number ofsurvey respondents, verifying anddouble-checking can be resource-intensive. This step is important,however, for ensuring that yourrecycling rate is as accurate aspossible and will help give youconfidence in your recycling mea-surement efforts.
43Implementation
Oregon sur-veys processorsand end usersdirectly, whilecounties survey
collectors and then report to thestate. Data from processors andend users are used to verify datareported by collectors.
Washingtonconducts aninformal tele-phone surveyof end usersin the state inorder to check the accuracy ofdata reported by collectors.
Oregon uses a computer pro-gram that, for each county andeach commodity, multiplies thepopulation by a projected per capi-ta generation rate to arrive at aprojected recycling total. The pro-gram then compares this total withthe total reported by the respec-tive county to verify the data.
To double-checkits data, Ohiocompares thenational wastegeneration rateof 0.80 tons per person per yearto the average for each of thereporting solid waste managementdistricts (SWMD). If there is alarge discrepancy which cannot beaccounted for by the rural orurban nature of the SWMD, otherfactors, such as open dumping ofwaste, unreported recycling, orundetected waste exports, areinvestigated.
Using Waste Characterization Data
The preferred approach for determining MSW generation is to obtaindata from surveys of waste haulers, transfer stations, and/or disposalfacilities. If you do not have the resources or legislative authority toconduct surveys, an alternative is to use data from waste characteriza-tion studies. These studies determine a per capita annual waste gener-ation rate that, when multiplied by the current year’s population,yields an estimate of total waste generation. A methodology for esti-mating waste generation in this way is outlined in Worksheet B2.

Section 544
Step SevenShare Information.
After you have calculated yourMSW recycling rate, it is importantto share the results of your recy-cling measurement efforts. Notonly is it professional and courte-ous to share the final results withsurvey respondents, but there arealso tangible benefits to providingsuch feedback. Communication onthe status of state or local recyclingefforts helps officials assess theirrecycling programs and theirprogress in meeting recyclinggoals. It also can identify potentialareas of improvement and helpcommunities learn about recycling
activities beyond their immediatejurisdiction, which could proveuseful in areas such as marketdevelopment. Information sharingalso provides opportunities toshare new ideas about recyclingmeasurement.
Sharing the results of your mea-surement effort with the public isalso beneficial. If you would likeyour recycling rate to be higher,use the results to educate citizensand businesses about the impor-tance of recycling. If, on the otherhand, your measurement resultsindicate that recycling is high inyour area, build on that momen-tum by recognizing people’s effortsand encouraging additional oppor-tunities for waste reduction.
Florida, astate that collectsdata directly from sources,keeps in close touch withlocal governments throughoutthe year via phone, e-mail, meet-ings, and conferences. Throughthese vehicles, the state updateslocal officials on measurementresults, state policy decisions, fund-ing, and other news.
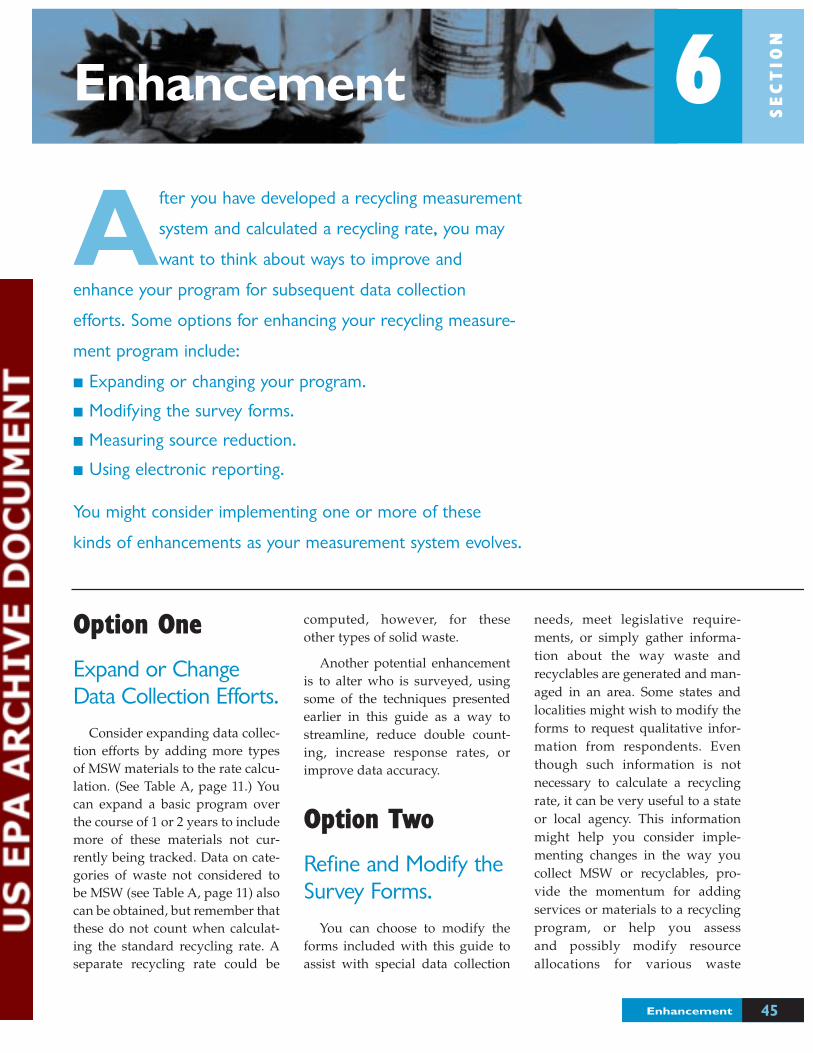
Option One
Expand or ChangeData Collection Efforts.
Consider expanding data collec-tion efforts by adding more typesof MSW materials to the rate calcu-lation. (See Table A, page 11.) Youcan expand a basic program overthe course of 1 or 2 years to includemore of these materials not cur-rently being tracked. Data on cate-gories of waste not considered tobe MSW (see Table A, page 11) alsocan be obtained, but remember thatthese do not count when calculat-ing the standard recycling rate. Aseparate recycling rate could be
computed, however, for theseother types of solid waste.
Another potential enhancementis to alter who is surveyed, usingsome of the techniques presentedearlier in this guide as a way tostreamline, reduce double count-ing, increase response rates, orimprove data accuracy.
Option Two
Refine and Modify theSurvey Forms.
You can choose to modify theforms included with this guide toassist with special data collection
needs, meet legislative require-ments, or simply gather informa-tion about the way waste andrecyclables are generated and man-aged in an area. Some states andlocalities might wish to modify theforms to request qualitative infor-mation from respondents. Eventhough such information is notnecessary to calculate a recyclingrate, it can be very useful to a stateor local agency. This informationmight help you consider imple-menting changes in the way youcollect MSW or recyclables, pro-vide the momentum for addingservices or materials to a recycling program, or help you assess and possibly modify resourceallocations for various waste
45Enhancement
After you have developed a recycling measurement
system and calculated a recycling rate, you may
want to think about ways to improve and
enhance your program for subsequent data collection
efforts. Some options for enhancing your recycling measure-
ment program include:
■ Expanding or changing your program.
■ Modifying the survey forms.
■ Measuring source reduction.
■ Using electronic reporting.
You might consider implementing one or more of these
kinds of enhancements as your measurement system evolves.
SE
CT
ION
6Enhancement
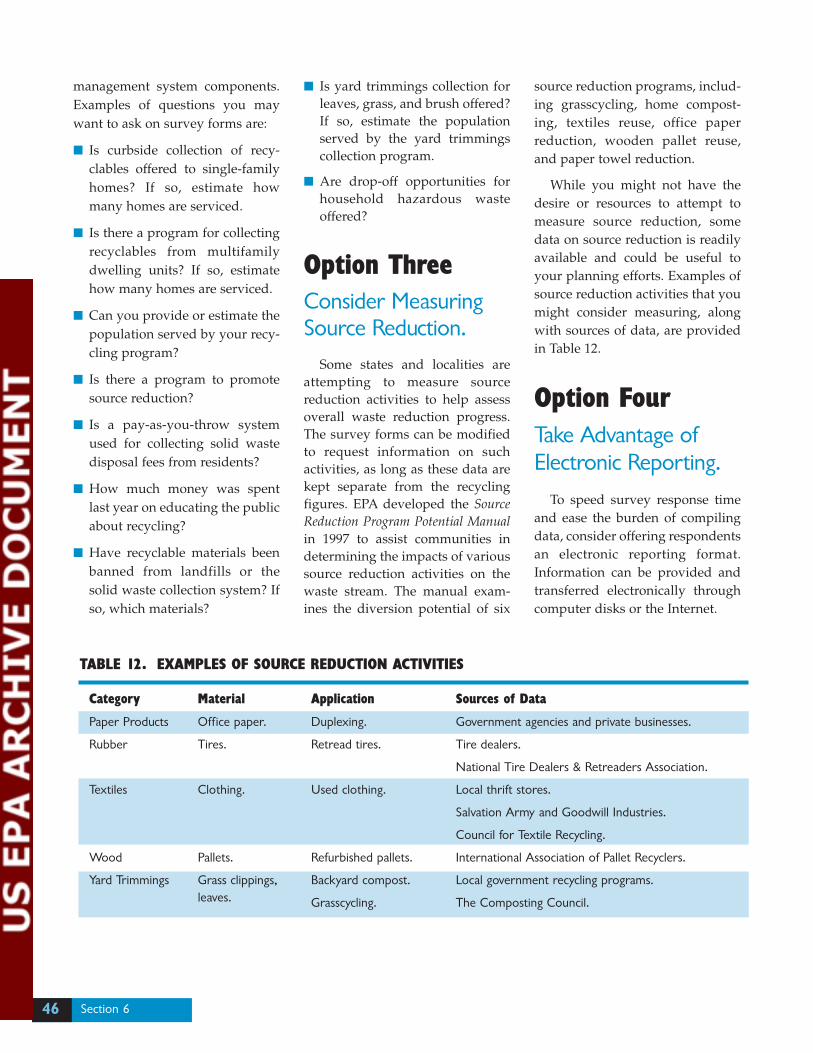
management system components.Examples of questions you maywant to ask on survey forms are:
■ Is curbside collection of recy-clables offered to single-familyhomes? If so, estimate howmany homes are serviced.
■ Is there a program for collectingrecyclables from multifamilydwelling units? If so, estimatehow many homes are serviced.
■ Can you provide or estimate thepopulation served by your recy-cling program?
■ Is there a program to promotesource reduction?
■ Is a pay-as-you-throw systemused for collecting solid wastedisposal fees from residents?
■ How much money was spentlast year on educating the publicabout recycling?
■ Have recyclable materials beenbanned from landfills or thesolid waste collection system? Ifso, which materials?
■ Is yard trimmings collection forleaves, grass, and brush offered?If so, estimate the populationserved by the yard trimmingscollection program.
■ Are drop-off opportunities forhousehold hazardous wasteoffered?
Option ThreeConsider MeasuringSource Reduction.
Some states and localities areattempting to measure sourcereduction activities to help assessoverall waste reduction progress.The survey forms can be modifiedto request information on suchactivities, as long as these data arekept separate from the recyclingfigures. EPA developed the SourceReduction Program Potential Manualin 1997 to assist communities indetermining the impacts of varioussource reduction activities on thewaste stream. The manual exam-ines the diversion potential of six
source reduction programs, includ-ing grasscycling, home compost-ing, textiles reuse, office paperreduction, wooden pallet reuse,and paper towel reduction.
While you might not have thedesire or resources to attempt tomeasure source reduction, somedata on source reduction is readilyavailable and could be useful toyour planning efforts. Examples ofsource reduction activities that youmight consider measuring, alongwith sources of data, are providedin Table 12.
Option FourTake Advantage ofElectronic Reporting.
To speed survey response timeand ease the burden of compilingdata, consider offering respondentsan electronic reporting format.Information can be provided andtransferred electronically throughcomputer disks or the Internet.
Section 646
Sources of Data
Government agencies and private businesses.
Tire dealers.
National Tire Dealers & Retreaders Association.
Local thrift stores.
Salvation Army and Goodwill Industries.
Council for Textile Recycling.
International Association of Pallet Recyclers.
Local government recycling programs.
The Composting Council.
TABLE 12. EXAMPLES OF SOURCE REDUCTION ACTIVITIES
Category
Paper Products
Rubber
Textiles
Wood
Yard Trimmings
Material
Office paper.
Tires.
Clothing.
Pallets.
Grass clippings,leaves.
Application
Duplexing.
Retread tires.
Used clothing.
Refurbished pallets.
Backyard compost.
Grasscycling.
47
Before beginning, first deter-mine if respondents are comfort-able with an electronic format.Electronic reporting also can beoffered as an option, as a way togradually introduce it to respon-dents. If you choose to offer elec-tronic reporting as an option, makesure people can still respond bycompleting and mailing in surveyforms if they are not equipped orinclined to do otherwise.
Many state and
local govern-
ments are
finding that the benefits of
recycling measurement are
worth the time and effort
required to plan and design
an effective system. By fol-
lowing the suggestions in
this guide, you can devise
and implement a successful
recycling measurement pro-
gram that is right for you.
Not only can such a pro-
gram advance the status of
recycling in your area, but it
also can reflect well on
your organization overall!
Enhancement
Electronic ReportingMany states and localities areexperimenting with or are nowusing electronic reporting. InMaryland, the state sendscomputer disksto counties who reportin a WordPerfect file.State officials read thecounty reports and then com-pile the information using adBase IV database program.
In May 1996,Pennsylvaniabegan Internettraining ses-
sions. The goal of these sessionsis to allow counties to report viae-mail. Several training sessionswere held around the state andwere open to all counties andcities. In addition, the state pro-
vided free modems to trainingsession participants. The trainingcovered basic Internet facts andhow to set up a homepage.Once local governments becomeaccustomed to the Internet, thestate will develop a reportingprocedure.
Washingtonconsidereddeveloping aversion of itsdatabase to be distributed ondisk, but is opting instead todesign something for theInternet in time to collect 1997data. One possibility is toinclude a form on the state’shomepage. Local officials wouldbe able to download the form,enter the data, and send theinformation back electronically
to be downloaded into a data-base.
Florida is alsojumping on theInternet, but only afterspending several years get-ting counties accustomed tosubmitting data on computerdisks. As of September 1, 1996,Florida counties are required togain Internet access and an e-mail address as a condition forreceiving grant monies. Thestate is considering developing aform for their Web site, similarto what the state of Washingtonis proposing, so that countiescan download the file, fill intheir data, and return the infor-mation via computer disk, hardcopy, or e-mail.
Note: Definitions marked with a “1” were devel-oped specifically to be used in the context of thisguide, the survey forms, and the worksheets.
Abatement Debris: refers to waste resulting fromremediation activities. (U.S. EPA, 1994d)
Agricultural Waste: refers to solid waste that isgenerated by the rearing of animals or the pro-duction and harvest of crops or trees. (Sullivan,1993)
Aluminum Cans: refers to containers and pack-aging such as beverage cans or food and othernonfood cans. Examples of recycling includeprocessing cans into new aluminum products(containers or foil). (U.S. EPA, 1995d)
Backyard Composting: refers to the diversion offood scraps and yard trimmings from themunicipal waste stream through the onsite con-trolled decomposition of organic matter bymicro-organisms (mainly bacteria and fungi)into a humus-like product. Backyard compost-ing is excluded from recycling activities. Rather,it is considered source reduction because thecomposted materials never enter the municipalsolid waste stream. (U.S. EPA, 1991a)
Broad Categories1: refers to general classificationsof recyclable materials (glass, paper, plastic,metals).
Broker: refers to an individual or group of indi-viduals who act as an agent or intermediarybetween the sellers and buyers of recyclablematerials. (U.S. EPA, 1989)
Brush and Branches1: refers to the natural woodymaterial collected from yard trimmings. Wholetrees, such as Christmas trees, are included.Excludes leaves and grass. Examples of recy-cling include processing brush and branchesinto compost additive or mulch.
Bulky Waste1: refers to those items that are largeenough to warrant special collection services sep-arate from regular residential curbside collection.Examples include major appliances and furniture.
Buy-Back Center: refers to a facility where indi-viduals or groups of individuals exchange recy-clables for payment. (U.S. EPA, 1989)
Collector1: refers to public or private haulers thatcollect nonhazardous waste and recyclablematerials from residential, commercial, institu-tional, and industrial sources. Also see Hauler.
Combustion Ash: refers to the residual substanceproduced during the burning, combustion, oroxidation of waste material. (U.S. EPA, 1994d)
Commercial Waste: refers to waste generated bybusinesses, such as office buildings; retail andwholesale establishments; and restaurants.Examples include old corrugated containers,food scraps, office papers, disposable table-ware, paper napkins, and yard trimmings. (U.S.EPA, 1996b)
Commingled Recyclables: refers to a mixture ofseveral recyclable materials in one container.(U.S. EPA, 1989)
Composting Facilities: refers to an offsite facilitywhere the organic component of municipalsolid scraps is biologically decomposed undercontrolled conditions; an aerobic process inwhich organic materials are ground or shred-ded and then decomposed to humus inwindrow piles or in mechanical digesters,drums, or similar enclosures. (U.S. EPA, 1991a,1994a)
Computer Paper/Printout: refers to a type ofpaper used in manifold business forms andproduced in rolls and/or fan folded. It is usedwith computers and word processors to printdata, information, letters, advertising, etc. (U.S.EPA, 1994b)
Construction and Demolition (C&D) Debris:refers to waste that is generated during the con-struction, remodeling, repair, or demolition ofbuildings, bridges, pavements, and other struc-tures. C&D debris includes concrete, asphalt,lumber, steel girders, steel rods, wiring, drywall, carpets, window glass, metal and plastic
49Glossary
AP
PE
ND
IX
AGlossary
Appendix A
piping, tree stumps, soil, and other miscella-neous items related to the activities listedabove. This category also includes natural dis-aster debris. (U.S. EPA, 1989, 1994d)
Consumer Price Index: refers to an index measur-ing the change in the cost of typical wage-earn-er purchases of goods and services expressed asa percentage of the cost of these same goodsand services in some base period. (Mish et al.,1988)
Contaminated Soil: refers to the introduction ofmicro-organisms, chemicals, toxic substances,wastes, or wastewater into soil in concentra-tions that make the soil unfit for its intendeduse. (U.S. EPA, 1994d)
Crumb Rubber: refers to ground rubber piecesthe size of sand or silt used in rubber or plasticproducts, or processed further into reclaimedrubber or asphalt products. (U.S. EPA, 1991c)
Disposal Facilities: refers to repositories for solidwaste including landfills and combustorsintended for permanent containment ordestruction of waste materials. Excludes transferstations and composting facilities. (U.S. EPA,1991b and National Recycling Coalition, 1995)
Drop-Off Center: refers to a method of collectionwhereby recyclable or compostable materialsare taken by individuals to a collection site andplaced in designated containers. (U.S. EPA,1989)
End User1: refers to facilities that purchase orsecure recovered materials for the purpose ofrecycling. Examples include recycling plantsand composting facilities. Excludes wastedisposal facilities.
Exports1: refers to municipal solid waste and recy-clables that are transported outside the state orlocality where they originated.
Ferrous Metals: refers to magnetic metals derivedfrom iron (steel). (U.S. EPA, 1995d) Productsmade from ferrous metals include major andsmall appliances, furniture, and containers andpackaging (steel drums and barrels). Examplesof recycling include processing tin/steel cans,strapping, and ferrous metals from appliancesinto new products. (U.S. EPA, 1995d)
Food Processing Waste1: refers to food residuesproduced during agricultural and industrialoperations.
Food Scraps1: refers to uneaten food and foodpreparation wastes from residences and com-mercial establishments (grocery stores, restau-rants, and produce stands), institutionalsources (school cafeterias), and industrialsources (employee lunchrooms). Excludes foodprocessing waste from agricultural and indus-trial operations. Examples of recycling includecomposting and using food scraps to feed pigs,but excludes source reduction activities such asbackyard (onsite) composting and use of fooditems for human consumption (food banks).
Generators1: refers to producers of municipalsolid waste such as residences, institutions,commercial businesses, and industry.
Glass Beneficiation Plant: refers to a glass pro-cessing facility where recovered glass cullet iscleaned of contaminants and processed into aform that is ready to be manufactured into anew product (mill-ready). (U.S. EPA, 1995c)
Glass Containers: refers to containers and pack-aging such as beer and soft drink bottles, wineand liquor bottles, and bottles and jars for food,cosmetics, and other products. For the purposeof recycling, container glass is generally sepa-rated into color categories (clear, green, andamber or brown). Examples of recyclinginclude processing glass into new containers,construction materials (aggregate), or fiberglass(insulation). (U.S. EPA, 1995d)
Grass: refers to lawn clippings. Excludes leaves,brush, and branches. (Mish et al., 1988)
Grasscycling1: refers to the source reduction activ-ity whereby grass clippings are left on the lawnafter mowing.
Gross Sales Receipts1: taxable transactions, or thetotal dollar value of goods sold in a state thatare subject to state sales tax. The specific goodssubjected to sales tax vary from state to state.
Hauler: refers to a waste collection company thatprovides complete refuse removal services.Many will also collect recyclables. Includesboth private and public entities. Also seeCollector. (U.S. EPA, 1994d)
50
Glossary
HDPE (High Density Polyethylene): refers to aplastic product in which the ethylene moleculesare linked in long chains with few side branch-es. Examples of products made from HDPEinclude milk jugs, detergent bottles, margarinetubs, and garbage containers. (U.S. EPA, 1995c)
Household Hazardous Waste (HHW): refers tohazardous products that are used and disposedof by residential—rather than industrial—con-sumers. These products include some paints,stains, varnishes, solvents, and pesticides, andother materials or products containing volatilechemicals that catch fire, react, explode undercertain circumstances, or that are corrosive ortoxic. HHW is derived from municipal solidwaste (MSW) with the exception of used oilwhich is excluded from the category of MSW.Examples of recycling include processingHHW components into new products afterthey have been diverted from the waste stream.Diversion from the waste stream only does notconstitute recycling (i.e., through collection ordrop-off programs). (U.S. EPA, 1992, 1993b)
Imports1: refers to municipal solid waste andrecyclables that have been transported to astate or locality for processing or final disposi-tion, but that did not originate in that state orlocality.
Incinerator: refers to a furnace for burning solidwaste under controlled conditions. (U.S. EPA,1994d)
Industrial Process Waste: refers to residues pro-duced during manufacturing operations.(Sullivan, 1993)
Industrial Sludge: refers to the semiliquidresidue remaining from the treatment of indus-trial water and wastewater. (U.S. EPA, 1989)
Industrial Waste: refers to nonhazardous wastesdiscarded at industrial sites from packagingand administrative sources. Examples includecorrugated boxes, plastic film, wood pallets,lunchroom wastes, and office paper. Excludesindustrial process wastes from manufacturingoperations. (U.S. EPA, 1996b)
Institutional Waste: refers to waste generated atinstitutions, such as schools, libraries, hospi-tals, and prisons. Examples include cafeteriaand restroom trashcan wastes, office papers,
classroom wastes, and yard trimmings. (U.S.EPA, 1996b)
Large Appliances: see Major Appliances.
Large Generator1: refers to commercial business-es, institutions, or industries that generate suf-ficient quantities of municipal solid waste andrecyclables to warrant self-management ofthese materials. Examples of large generatorsinclude supermarkets, restaurants, hardwarestores, shopping malls, warehouses, amuse-ment parks, convention centers, and office andapartment complexes.
LDPE (Low Density Polyethylene): refers to aplastic material in which the ethylene mole-cules are linked in a random fashion with themain chains of the polymer having long andshort side branches. LDPE is used for both rigidcontainers and plastic film applications. (U.S.EPA, 1995c)
Lead-Acid Batteries: refers to batteries used inautomobiles, trucks, and motorcycles. Theycontain plastic, lead (a toxic metal), and sulfu-ric acid. Excludes lead-acid batteries from largeequipment, heavy-duty trucks and tractors, air-craft, military vehicles, and boats. (U.S. EPA,1993a, 1996b)
Leakage1: refers to cases in which residential recy-clables are collected outside of a municipal col-lection system. As a result, these materials areoften undetected during the course of normaldata collection efforts.
Leaves: refers to the foliage of a plant. Excludesbrush, branches, and grass. (Mish et al., 1988)
Major (Large) Appliances: refers to many differ-ent types, sizes, and styles of ovens, microwaveovens, air-conditioners, refrigerators, freezers,washers, dryers, dishwashers, water heaters,dehumidifiers, or trash compactors manufac-tured for household, commercial, or recreation-al use. Steel is the predominant material usedin the manufacture of large appliances. Othermaterials found in appliances (in varyingamounts) include, copper, brass, aluminum,glass, rubber, and paperboard. Also see WhiteGoods and Bulky Waste. (Sullivan, 1993 andU.S. EPA, 1995d)
Material Recovery Facility (MRF): refers to afacility where recyclables are sorted into specif-
51
Appendix A
ic categories and processed, or transported toprocessors, for remanufacturing. (U.S. EPA,1994d)
Medical Waste: refers to any solid waste generat-ed in the diagnosis, treatment, or immunizationof human beings or animals, in research per-taining thereto, or in the production or testingof biologicals, excluding hazardous waste iden-tified or listed under 40 CFR Part 261 or anyhousehold waste as defined in 40 CFRSubsection 261.4 (b)(1). (U.S. EPA, 1994d)
Mill-Ready Cullet: refers to crushed and wholecontaminant-free scrap container glass thatcomplies with the proper Institute of ScrapRecycling Industries, Inc. glass specifications.(Institute of Scrap Recycling Industries, Inc.,1996)
Mining Waste: refers to residues resulting fromthe extraction of raw materials from the earth.(Sullivan, 1993)
Minor Appliances: see Small Appliances.
Mixed Glass1: refers to recovered container glassthat is not sorted into specific categories (colorand grade).
Mixed Metals1: refers to recovered metal that isnot sorted into specific categories (aluminumcans, tin/steel cans, other ferrous, and othernonferrous).
Mixed Municipal Solid Waste1: refers to munici-pal solid waste that is not sorted into specificcategories (plastics, glass, and yard trimmings).
Mixed Paper1: refers to recovered paper that is notsorted into specific categories (old magazines,old newspapers, and old corrugated contain-ers).
Mixed Plastic1: refers to recovered plastic that isnot sorted into specific categories (HDPE,LDPE, and PETE).
Mulching1: refers to the process by which the vol-ume of organic waste is reduced through shred-ding or grinding.
Municipal Sludge: refers to the semiliquidresidue remaining from the treatment of munic-ipal water and wastewater. (U.S. EPA, 1989)
Municipal Solid Waste (MSW): refers to wastessuch as durable goods, nondurable goods, con-
tainers and packaging, food scraps, yard trim-mings, and miscellaneous inorganic wastesfrom residential, commercial, institutional, andindustrial sources, such as appliances, automo-bile tires, old newspapers, clothing, disposabletableware, office and classroom paper, woodpallets, and cafeteria wastes. Excludes solidwastes from other sources, such as constructionand demolition debris, autobodies, municipalsludges, combustion ash, and industrial processwastes that might also be disposed of in munic-ipal waste landfills or incinerators. (U.S. EPA,1996b)
Natural Disaster Debris1: refers to wastes result-ing from earthquakes, floods, hurricanes, torna-dos, and other natural disasters. Excludeswastes resulting from heavy storms. Naturaldisaster debris is classified as construction anddemolition debris.
Nonferrous Metals: refers to nonmagnetic metalssuch as aluminum, lead, and copper. Productsmade from nonferrous metals include contain-ers and packaging such as beverage cans, foodand other nonfood cans; nonferrous metalsfound in appliances, furniture, electronic equip-ment; and nonpackaging aluminum products(foil, closures, and lids from bimetal cans).Excludes lead-acid batteries and nonferrousmetals from industrial applications and con-struction and demolition debris. (U.S. EPA,1996b)
Nonhazardous Industrial Process Waste: refersto waste that is neither municipal solid wastenor considered a hazardous waste underSubtitle C of the Resource Conservation andRecovery Act, such as certain types of manufac-turing wastes and wastewaters. (U.S. EPA,1996a)
Office Paper1: refers to high-grade papers such ascopier paper, computer printout, and sta-tionery. These papers are almost entirely madeof uncoated chemical pulp, although someamounts of groundwood are used. It should benoted that this category of paper also is gener-ated at locations other than offices, such ashomes and institutions (schools).
Oil and Gas Waste: refers to gas and oil drillingmuds, oil production brines, and other wastesassociated with the exploration, development,
52
Glossary
or production of crude oil or natural gas. (U.S.EPA, 1995a)
Old Corrugated Containers (OCC): refers to cor-rugated containers made from unbleached,unwaxed paper with a ruffled (corrugated)inner liner. (U.S. EPA, 1993a)
Old Magazines: refers to dry, coated magazines,catalogues, and similar printed materials.(Institute of Scrap Recycling Industries, Inc.,1996)
Old Newspaper: refers to periodicals printed onnewsprint. Includes groundwood inserts(advertisements). Examples of recyclinginclude processing old newspapers into newpaper products (newspaper, paperboard,boxboard, or animal bedding). (U.S. EPA,1996b)
Other Ferrous Metals: refers to ferrous metalsfrom strapping, furniture, and metal found intires and consumer electronics. Excludes thelarge quantities of metals found in constructionmaterials or transportation products, such asautomobiles, locomotives, and ships. (U.S.EPA, 1996b)
Other Glass: refers to glass from furniture, appli-ances, and consumer electronics. Excludes glassfrom transportation products and constructionand demolition debris. Examples of recyclinginclude processing glass into new glass prod-ucts such as containers, construction materials(aggregate), or fiberglass (insulation). (U.S.EPA, 1996b)
Other Nonferrous Metals: refers to nonferrousmetals (lead, copper, and zinc) from appliances,consumer electronics, and nonpackaging alu-minum products (foil, closures, and aluminumlids from bimetal cans). Excludes nonferrousmetals from industrial applications and con-struction and demolition debris. (U.S. EPA,1996b)
Other Paper: refers to paper from books, thirdclass mail, other commercial printing, papertowels, paper plates and cups, other nonpack-aging paper (posters, photographic papers,cards, and games), milk cartons, folding boxes(cereal boxes), bags, wrapping papers, andother paper and paperboard products. (U.S.EPA, 1996b)
Other Plastic: refers to plastic from appliances,furniture, trash bags, cups, eating utensils,sporting and recreational equipment, and othernonpackaging plastic products. (U.S. EPA,1996b)
Other Recyclables1: refers to household haz-ardous waste, oil filters, fluorescent tubes, mat-tresses, consumer electronics, circuit boards,and other miscellaneous recyclable items foundin municipal solid waste that cannot be other-wise categorized.
Other Solid Waste: refers to nonhazardous solidwastes, other than municipal solid waste, cov-ered under Subtitle D of the ResourceConservation and Recovery Act, such asmunicipal sludge, industrial nonhazardouswaste, construction and demolition waste, agri-cultural waste, oil and gas waste, and miningwaste. (U.S. EPA, 1996b)
Other Wood: refers to wood from furniture, cabi-nets from consumer electronics, and other non-packaging wood products. Excludes woodrecovered from construction and demolitionactivities (lumber and tree stumps) and indus-trial process waste (shavings and sawdust).Examples of recycling include processing woodinto mulch, compost additive, or animal bed-ding. (U.S. EPA, 1996b)
Overissue Publications (Overissues)1: refers toprinted publications, such as newspapers andmagazines, that are defined as unsold invento-ry by the publisher. Overissues are not consid-ered postconsumer waste.
Pallet: refers to a portable platform made of woodor plastic lumber used for storing or movingcargo or freight. (National Wooden Pallet andContainer Association)
Paper: refers to paper products and materialssuch as old newspapers, old magazines, officepapers, telephone directories, old corrugatedcontainers, bags, and some paperboard packag-ing. Examples of recycling include processingpaper into new paper products (tissue, paper-board, hydromulch, animal bedding, or insula-tion materials). (U.S. EPA, 1996b)
Paper Processor1: refers to an intermediate oper-ating facility where recovered paper productsand materials are sorted, cleaned of contami-
53
Appendix A
nants, and prepared for final recycling.Examples include paper stock dealers andpaper packers.
PETE (Polyethylene Terephthalate): refers to athermoplastic material used to manufactureplastic soft drink containers and rigid contain-ers. PETE has a high melting point, is clear in itsnatural state, and has a relatively high density.(U.S. EPA, 1995c)
Plastic: refers to plastic containers and packagingmade from various resins, including PETE,HDPE, PVC, LDPE, PP, and PS. Excludes plas-tics in transportation (automobiles) and con-struction products (PVC piping). (U.S. EPA,1996b)
Plastic Processor1: refers to an intermediate oper-ating facility where recovered plastic productsand materials are sorted, cleaned of contami-nants, and prepared for final recycling.Examples include plastics handlers and plasticsreclaimers.
Plastics Handler: refers to companies that preparerecyclable plastics by sorting, baling, shred-ding, granulating, and/or storing plastics untila sufficient quantity is on hand. (AmericanPlastics Council, 1996)
Plastics Reclaimer: refers to companies that fur-ther process plastics after the handling stage byperforming at least one of the following func-tions: washing/cleaning, pelletizing, or pro-ducing a new product. (American PlasticsCouncil, 1996)
Postconsumer Materials/Waste: refers to recov-ered materials that have been used as a con-sumer item and are diverted from municipalsolid waste for the purpose of collection, recy-cling, and disposition (aluminum beveragecans, plastic bottles, old newspapers, and yardtrimmings). Excludes materials from industrialprocesses that have not reached the consumer,such as glass broken in the manufacturingprocess or overissues of newspapers and maga-zines. (U.S. EPA, 1994d, 1995c)
PP (Polypropylene): refers to a plastic polymerformed by linking propylene molecules. PP hasgood resistance to heat and is used in flexibleand rigid packaging, film, and textiles. (U.S.EPA, 1995c)
Preconsumer Materials/Waste: refers to materialsgenerated in manufacturing and convertingprocesses, such as manufacturing scrap andtrimmings/cuttings. Also includes print over-runs, overissue publications (newspapers andmagazines), and obsolete inventories. (U.S.EPA, 1995c)
Print Overruns: refers to a quantity of paper thatis printed beyond the quantity specified.(Walden-Mott, 1981)
Processors1: refers to intermediate operators thathandle recyclable materials from collectors andgenerators for the purpose of preparing materi-als for recycling (material recovery facilities,scrap metal yards, paper dealers, and glass beneficiation plants). Processors act as interme-diaries between collectors and end users ofrecovered materials.
PS (Polystyrene): refers to a plastic polymerformed by linking styrene molecules. PS is usedto make a variety of products including plasticcutlery and food containers. It is often used inits foamed state. (U.S. EPA, 1995c)
PVC (Polyvinyl Chloride): refers to the family ofplastic copolymers, also known as vinyl. PVC isused to make products such as pipes, bottles,upholstery, and automotive parts. (U.S. EPA,1995c)
Recovery: refers to the diversion of materials fromthe municipal solid waste stream for the pur-pose of recycling or composting. Excludes reuseand source reduction activities such as yardtrimmings diverted to backyard (onsite) com-posting, the repair of wood pallets, and therefilling of beverage containers. (U.S. EPA1996b)
Recyclables: refers to those materials recoveredfrom the solid waste stream and transported toa processor or end user for recycling. (NationalRecycling Coalition, 1995)
Recycling: refers to the series of activities bywhich discarded materials are collected, sorted,processed, and converted into raw materialsand used in the production of new products.Excludes the use of these materials as a fuel sub-stitute or for energy production. (NationalRecycling Coalition, 1995)
54
Glossary
Recycling Plant1: refers to a facility where recov-ered materials are remanufactured into newproducts.
Redemption Program1: refers to a program whereconsumers are monetarily compensated for thecollection of recyclable materials, generallythrough pre-paid deposits or taxes on beveragecontainers. In some states or localities, legisla-tion has been passed to implement redemptionprograms to assist in the prevention of roadsidelitter (bottle bills).
Residential Waste: refers to waste generated bysingle- and multi-family homes including oldnewspapers, clothing, disposable tableware,food packaging, cans and bottles, food scraps,and yard trimmings. Excludes food scraps andyard trimmings that are diverted to backyard(onsite) composting. (U.S. EPA, 1996b)
Residues: refers to the materials remaining afterprocessing, incineration, composting, or recy-cling have been completed. Residues are usual-ly disposed of in landfills. (U.S. EPA, 1989)
Respondent1: refers to the state, locality, or indi-vidual that completes a recycling measurementsurvey form.
Reuse: refers to the use of a product or compo-nent of municipal solid waste in its originalform more than once. Examples include refill-ing glass or plastic bottles, repairing wood pal-lets, using corrugated or plastic containers forstorage, and returning milk crates. (U.S. EPA,1994d)
Scrap Metal Processor1: refers to an intermediateoperating facility where recovered metal issorted, cleaned of contaminants, and preparedfor final recycling. Examples include scrapmetal yards and scrap metal dealers.
Small (Minor) Appliances: refers to many differ-ent types, sizes, and styles of electric fans, cof-fee makers, electric irons, food mixers, etc.Aluminum and plastic are the predominantmaterials used in small appliances. (U.S. EPA,1995d)
Source Reduction: refers to the design, manufac-ture, purchase, or use of materials, such asproducts and packaging, to reduce the amountor toxicity of materials before they enter themunicipal solid waste management system,
such as redesigning products or packaging toreduce the quantity of materials or the toxicityof the materials used; reusing products or pack-aging already manufactured; and lengtheningthe life of products to postpone disposal.Examples include donating food to food banks,diverting food scraps and yard trimmingsthrough backyard (onsite) composting, andreusing plastic pallets. Also referred to as wasteprevention. (U.S. EPA 1996b)
Surveyor1: refers to the state, locality, or individ-ual responsible for the collection of recyclingmeasurement data through the use of surveyforms.
Telephone Directories1: refers to telephone direc-tories printed on paper with high groundwoodcontent. Other directories, such as zip code andarea code directories, are included in this cate-gory when they are printed on the same type ofpaper.
Textiles: refers to fibers from discarded apparel,furniture, linens (sheets and towels), and car-pets. Examples of recycling include convertingapparel and linens into wiper rags and process-ing textiles into new products (linen paper orcarpet padding). (U.S. EPA, 1996b)
Tin/Steel Cans: refers to tin-coated steel contain-ers such as cans used for food packaging. (U.S.EPA, 1993a)
Tire Processor1: refers to an intermediate operat-ing facility where recovered tires are processedin preparation for recycling.
Tires: refers to passenger car and light- andheavy-duty truck tires. Excludes high-speedindustrial tires (from airplanes), bus tires,motorcycle tires, and special service tires, suchas military, agricultural, off-road, and slow-speed industrial tires (from construction vehi-cles). Examples of recycling include processingcar and truck tires into new rubber products(trash cans, storage containers, and rubberizedasphalt), and the use of whole tires for play-ground and reef construction. (U.S. EPA, 1994b)
Transfer Station: refers to a facility where solidwaste is transferred from collection vehicles tolarger trucks or rail cars for longer distancetransport. (U.S. Congress, 1989)
55
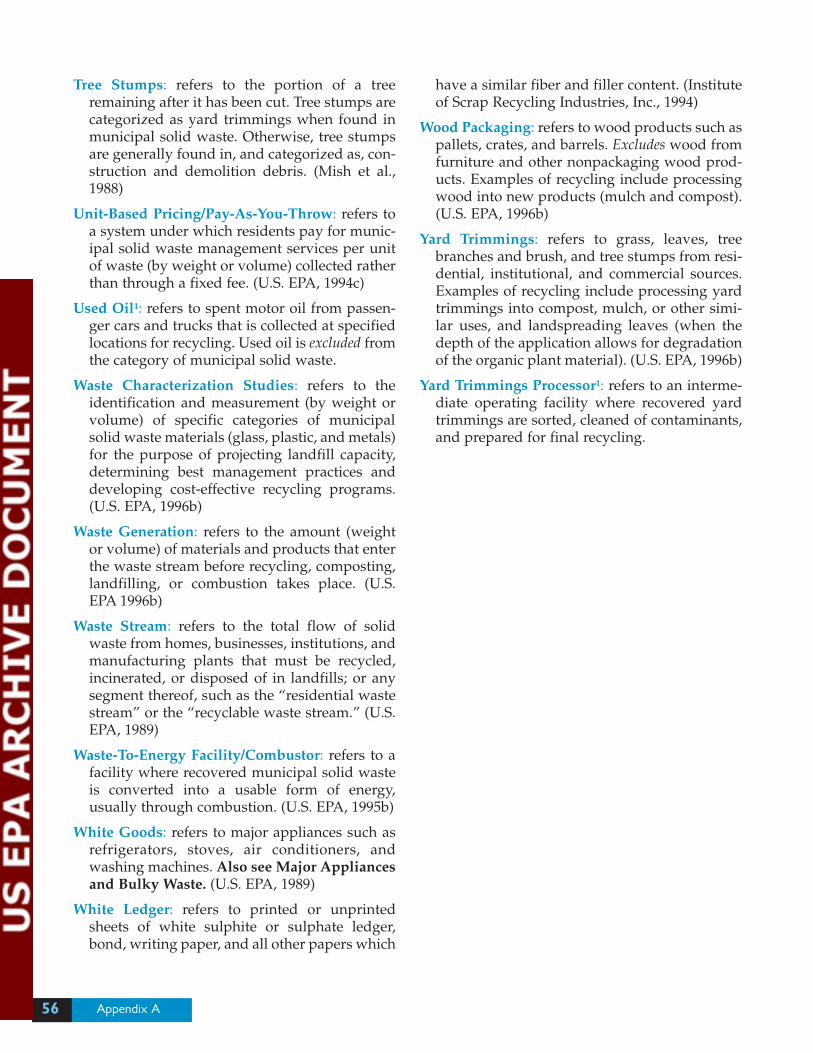
Appendix A
Tree Stumps: refers to the portion of a treeremaining after it has been cut. Tree stumps arecategorized as yard trimmings when found inmunicipal solid waste. Otherwise, tree stumpsare generally found in, and categorized as, con-struction and demolition debris. (Mish et al.,1988)
Unit-Based Pricing/Pay-As-You-Throw: refers toa system under which residents pay for munic-ipal solid waste management services per unitof waste (by weight or volume) collected ratherthan through a fixed fee. (U.S. EPA, 1994c)
Used Oil1: refers to spent motor oil from passen-ger cars and trucks that is collected at specifiedlocations for recycling. Used oil is excluded fromthe category of municipal solid waste.
Waste Characterization Studies: refers to theidentification and measurement (by weight orvolume) of specific categories of municipalsolid waste materials (glass, plastic, and metals)for the purpose of projecting landfill capacity,determining best management practices anddeveloping cost-effective recycling programs.(U.S. EPA, 1996b)
Waste Generation: refers to the amount (weightor volume) of materials and products that enterthe waste stream before recycling, composting,landfilling, or combustion takes place. (U.S.EPA 1996b)
Waste Stream: refers to the total flow of solidwaste from homes, businesses, institutions, andmanufacturing plants that must be recycled,incinerated, or disposed of in landfills; or anysegment thereof, such as the “residential wastestream” or the “recyclable waste stream.” (U.S.EPA, 1989)
Waste-To-Energy Facility/Combustor: refers to afacility where recovered municipal solid wasteis converted into a usable form of energy,usually through combustion. (U.S. EPA, 1995b)
White Goods: refers to major appliances such asrefrigerators, stoves, air conditioners, andwashing machines. Also see Major Appliancesand Bulky Waste. (U.S. EPA, 1989)
White Ledger: refers to printed or unprintedsheets of white sulphite or sulphate ledger,bond, writing paper, and all other papers which
have a similar fiber and filler content. (Instituteof Scrap Recycling Industries, Inc., 1994)
Wood Packaging: refers to wood products such aspallets, crates, and barrels. Excludes wood fromfurniture and other nonpackaging wood prod-ucts. Examples of recycling include processingwood into new products (mulch and compost).(U.S. EPA, 1996b)
Yard Trimmings: refers to grass, leaves, treebranches and brush, and tree stumps from resi-dential, institutional, and commercial sources.Examples of recycling include processing yardtrimmings into compost, mulch, or other simi-lar uses, and landspreading leaves (when thedepth of the application allows for degradationof the organic plant material). (U.S. EPA, 1996b)
Yard Trimmings Processor1: refers to an interme-diate operating facility where recovered yardtrimmings are sorted, cleaned of contaminants,and prepared for final recycling.
56
Glossary
GLOSSARY REFERENCES
American Plastics Council. 1996. Letter commu-nicating definitions. October.
Institute of Scrap Recycling Industries, Inc. 1996.Scrap Specifications Circular 1996: Guidelinesfor Nonferrous Scrap, Ferrous Scrap, GlassCullet, Paper Stock, Plastic Scrap. Institute ofScrap Recycling Industries, Washington, DC.
Mish et al., eds. 1988. Webster’s Ninth NewCollegiate Dictionary. Springfield, MA:Merriam-Webster, Inc.
National Recycling Coalition. 1995. DefinitionsApproved By the National Recycling CoalitionBoard of Directors.
National Wooden Pallet and ContainerAssociation (NWPCA). An Introduction toWood Pallets. NWPCA, Arlington, VA.
Sullivan, T.F.P. 1993. Environmental RegulatoryGlossary, Sixth Edition. Rockville, MD:Government Institutes, Inc.
U.S. Congress. 1989. Facing America’s Trash:What Next for Municipal Solid Waste. OTA-O-424. Washington, DC.
U.S. EPA. 1989. Decision-Makers Guide to SolidWaste Management. EPA530-SW-89-072.Washington, DC.
U.S. EPA. 1991a. Environmental Fact Sheet: YardWaste Composting. EPA530-SW-91-009.Washington, DC.
U.S. EPA. 1991b. Solid Waste Disposal FacilityCriteria; Final Rule. Fed. Reg. Part II: 40 CFRParts 257 and 258.56(196):50,978-51,119.October 9.
U.S. EPA. 1991c. Summary of Markets for ScrapTires. EPA530-90-074B. Washington, DC.
U.S. EPA. 1992. The Consumer’s Handbook forReducing Solid Waste. EPA530-K-92-003.Washington, DC.
U.S. EPA. 1993a. Business Guide for ReducingSolid Waste. EPA530-K-92-004. Washington, DC.
U.S. EPA. 1993b. Household Hazardous Waste: AManual for One-Day Community CollectionPrograms. EPA530-R-92-026. Washington, DC.
U.S. EPA. 1994a. Composting Yard Trimmingsand Municipal Solid Waste. EPA530-R-94-003.Washington, DC.
U.S. EPA. 1994b. Comprehensive Guideline forProcurement of Products ContainingRecovered Materials and Issuance of a DraftRecovered Materials Advisory Notice:Proposed Rule and Notice. Fed. Reg.59(76):18,852-18,887. April 20.
U.S. EPA. 1994c. Pay-As-You-Throw: LessonsLearned About Unit Pricing. EPA530-R-94-004.Washington, DC.
U.S. EPA. 1994d. Terms of the Environment:Glossary, Abbreviations, and Acronyms.EPA175-B-94-015. Washington, DC.
U.S. EPA. 1995a. Crude Oil and Natural GasExploration and Production Wastes:Exemption from RCRA Subtitle C Regulation.EPA530-K-95-003. Washington, DC.
U.S. EPA. 1995b. Decision-Makers’ Guide toSolid Waste Management, Volume II. EPA530-R-95-023. Washington, DC.
U.S. EPA. 1995c. Manufacturing fromRecyclables: 24 Case Studies of SuccessfulRecycling Enterprises. EPA530-R-95-001.Washington, DC.
U.S. EPA. 1995d. Methodology forCharacterization of Municipal Solid Waste inthe United States: 1994 Update. Report pre-pared by Franklin Associates, LTD.Washington, DC.
U.S. EPA. 1996a. Building a New State/EPAIndustrial Solid Waste Initiative. Washington,DC.
U.S. EPA. 1996b. Characterization of MunicipalSolid Waste in The United States: 1996 Update.EPA530-R-97-015. Washington, DC.
Walden-Mott Corporation. 1981. Walden’sHandbook for Paper Salespeople & Buyers ofPrinting Paper, Second Edition. Oradell, NJ:Walden-Mott Corporation.
57
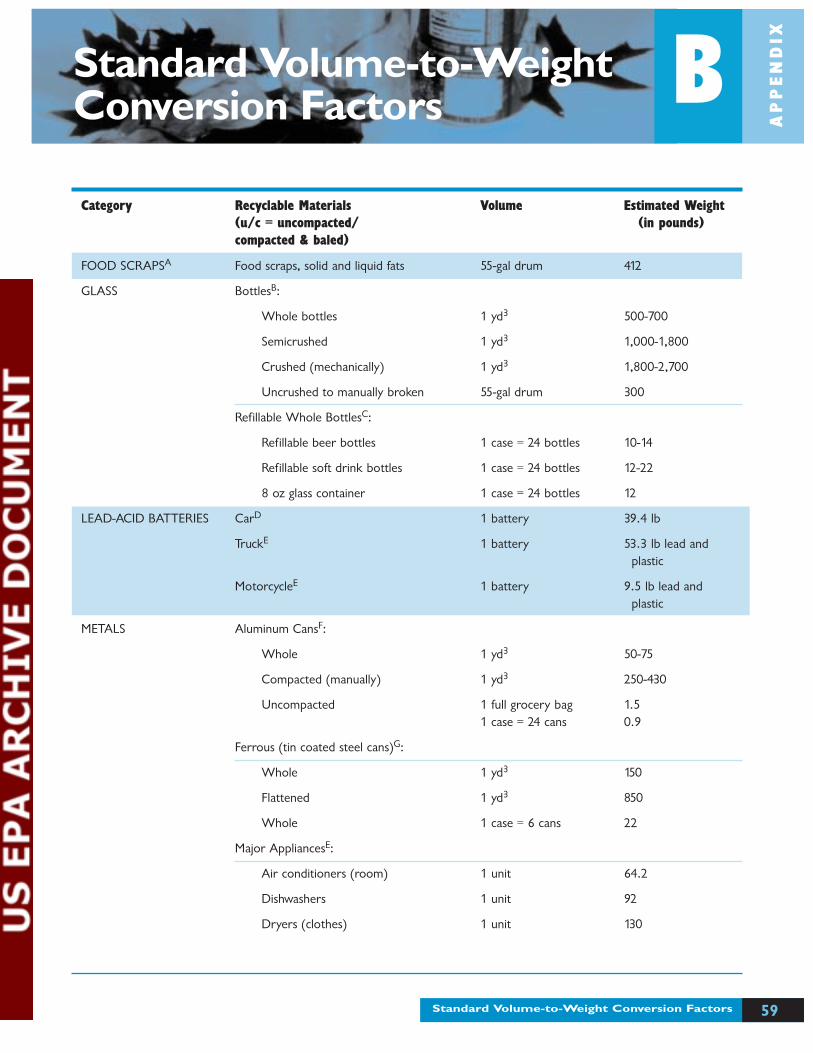
59Standard Volume-to-Weight Conversion Factors
AP
PE
ND
IX
BStandard Volume-to-WeightConversion Factors
Category Recyclable Materials Volume Estimated Weight(u/c = uncompacted/ (in pounds)compacted & baled)
FOOD SCRAPSA Food scraps, solid and liquid fats 55-gal drum 412
GLASS BottlesB:
Whole bottles 1 yd3 500-700
Semicrushed 1 yd3 1,000-1,800
Crushed (mechanically) 1 yd3 1,800-2,700
Uncrushed to manually broken 55-gal drum 300
Refillable Whole BottlesC:
Refillable beer bottles 1 case = 24 bottles 10-14
Refillable soft drink bottles 1 case = 24 bottles 12-22
8 oz glass container 1 case = 24 bottles 12
LEAD-ACID BATTERIES CarD 1 battery 39.4 lb
TruckE 1 battery 53.3 lb lead andplastic
MotorcycleE 1 battery 9.5 lb lead andplastic
METALS Aluminum CansF:
Whole 1 yd3 50-75
Compacted (manually) 1 yd3 250-430
Uncompacted 1 full grocery bag 1.51 case = 24 cans 0.9
Ferrous (tin coated steel cans)G:
Whole 1 yd3 150
Flattened 1 yd3 850
Whole 1 case = 6 cans 22
Major AppliancesE:
Air conditioners (room) 1 unit 64.2
Dishwashers 1 unit 92
Dryers (clothes) 1 unit 130
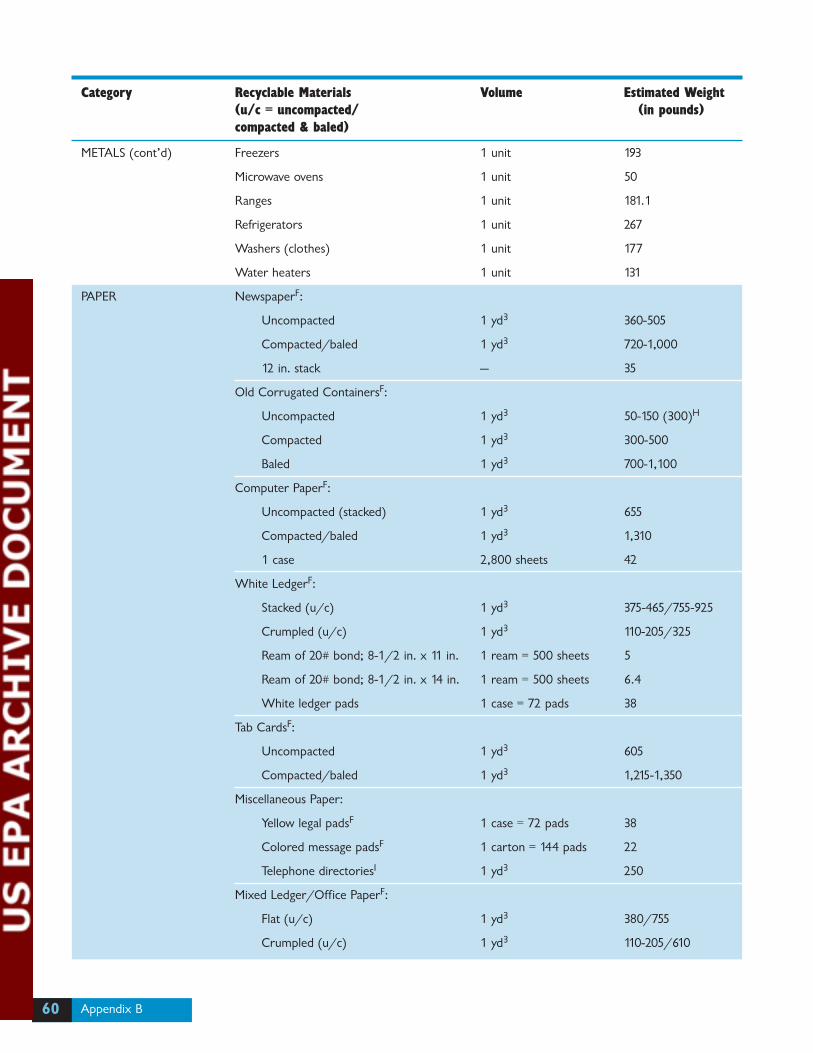
Appendix B60
Category Recyclable Materials Volume Estimated Weight(u/c = uncompacted/ (in pounds)compacted & baled)
METALS (cont’d) Freezers 1 unit 193
Microwave ovens 1 unit 50
Ranges 1 unit 181.1
Refrigerators 1 unit 267
Washers (clothes) 1 unit 177
Water heaters 1 unit 131
PAPER NewspaperF:
Uncompacted 1 yd3 360-505
Compacted/baled 1 yd3 720-1,000
12 in. stack — 35
Old Corrugated ContainersF:
Uncompacted 1 yd3 50-150 (300)H
Compacted 1 yd3 300-500
Baled 1 yd3 700-1,100
Computer PaperF:
Uncompacted (stacked) 1 yd3 655
Compacted/baled 1 yd3 1,310
1 case 2,800 sheets 42
White LedgerF:
Stacked (u/c) 1 yd3 375-465/755-925
Crumpled (u/c) 1 yd3 110-205/325
Ream of 20# bond; 8-1/2 in. x 11 in. 1 ream = 500 sheets 5
Ream of 20# bond; 8-1/2 in. x 14 in. 1 ream = 500 sheets 6.4
White ledger pads 1 case = 72 pads 38
Tab CardsF:
Uncompacted 1 yd3 605
Compacted/baled 1 yd3 1,215-1,350
Miscellaneous Paper:
Yellow legal padsF 1 case = 72 pads 38
Colored message padsF 1 carton = 144 pads 22
Telephone directoriesI 1 yd3 250
Mixed Ledger/Office PaperF:
Flat (u/c) 1 yd3 380/755
Crumpled (u/c) 1 yd3 110-205/610
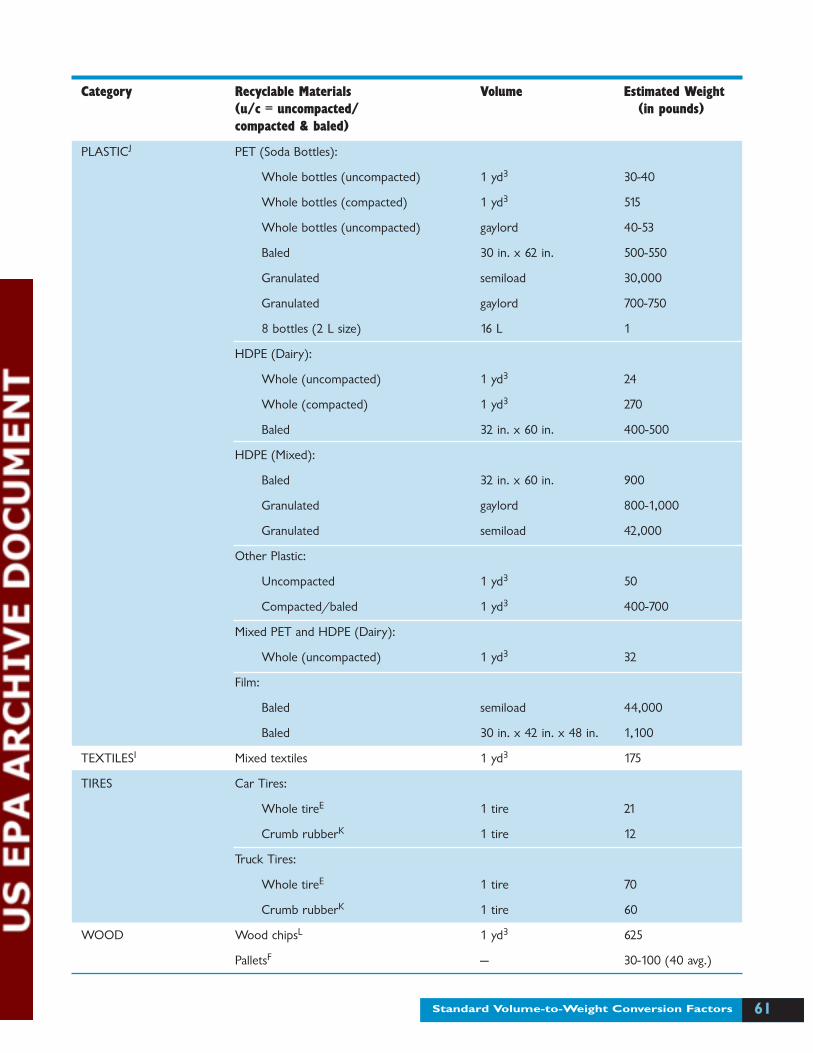
61Standard Volume-to-Weight Conversion Factors
Category Recyclable Materials Volume Estimated Weight(u/c = uncompacted/ (in pounds)compacted & baled)
PLASTICJ PET (Soda Bottles):
Whole bottles (uncompacted) 1 yd3 30-40
Whole bottles (compacted) 1 yd3 515
Whole bottles (uncompacted) gaylord 40-53
Baled 30 in. x 62 in. 500-550
Granulated semiload 30,000
Granulated gaylord 700-750
8 bottles (2 L size) 16 L 1
HDPE (Dairy):
Whole (uncompacted) 1 yd3 24
Whole (compacted) 1 yd3 270
Baled 32 in. x 60 in. 400-500
HDPE (Mixed):
Baled 32 in. x 60 in. 900
Granulated gaylord 800-1,000
Granulated semiload 42,000
Other Plastic:
Uncompacted 1 yd3 50
Compacted/baled 1 yd3 400-700
Mixed PET and HDPE (Dairy):
Whole (uncompacted) 1 yd3 32
Film:
Baled semiload 44,000
Baled 30 in. x 42 in. x 48 in. 1,100
TEXTILESI Mixed textiles 1 yd3 175
TIRES Car Tires:
Whole tireE 1 tire 21
Crumb rubberK 1 tire 12
Truck Tires:
Whole tireE 1 tire 70
Crumb rubberK 1 tire 60
WOOD Wood chipsL 1 yd3 625
PalletsF — 30-100 (40 avg.)
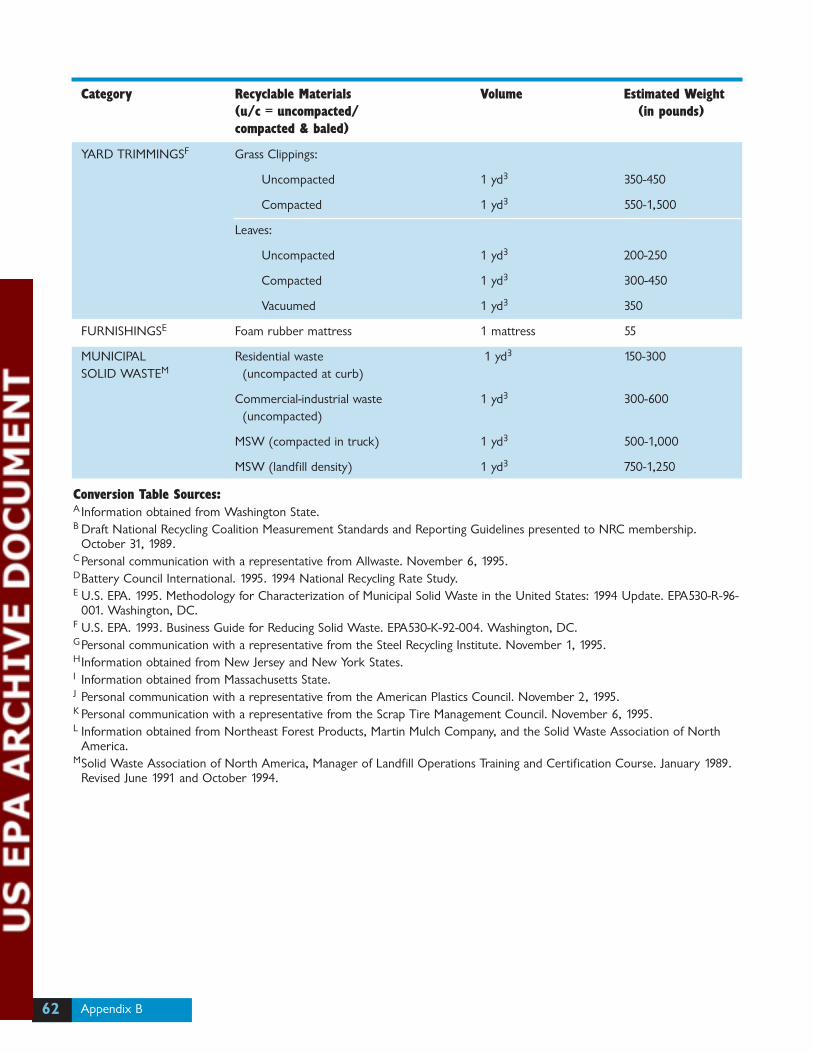
Appendix B62
Category Recyclable Materials Volume Estimated Weight(u/c = uncompacted/ (in pounds)compacted & baled)
YARD TRIMMINGSF Grass Clippings:
Uncompacted 1 yd3 350-450
Compacted 1 yd3 550-1,500
Leaves:
Uncompacted 1 yd3 200-250
Compacted 1 yd3 300-450
Vacuumed 1 yd3 350
FURNISHINGSE Foam rubber mattress 1 mattress 55
MUNICIPAL Residential waste 1 yd3 150-300SOLID WASTEM (uncompacted at curb)
Commercial-industrial waste 1 yd3 300-600(uncompacted)
MSW (compacted in truck) 1 yd3 500-1,000
MSW (landfill density) 1 yd3 750-1,250
Conversion Table Sources:AInformation obtained from Washington State.B Draft National Recycling Coalition Measurement Standards and Reporting Guidelines presented to NRC membership.
October 31, 1989.C Personal communication with a representative from Allwaste. November 6, 1995.DBattery Council International. 1995. 1994 National Recycling Rate Study.E U.S. EPA. 1995. Methodology for Characterization of Municipal Solid Waste in the United States: 1994 Update. EPA530-R-96-
001. Washington, DC.F U.S. EPA. 1993. Business Guide for Reducing Solid Waste. EPA530-K-92-004. Washington, DC.GPersonal communication with a representative from the Steel Recycling Institute. November 1, 1995.HInformation obtained from New Jersey and New York States.I Information obtained from Massachusetts State.J Personal communication with a representative from the American Plastics Council. November 2, 1995.K Personal communication with a representative from the Scrap Tire Management Council. November 6, 1995.L Information obtained from Northeast Forest Products, Martin Mulch Company, and the Solid Waste Association of North
America.MSolid Waste Association of North America, Manager of Landfill Operations Training and Certification Course. January 1989.
Revised June 1991 and October 1994.
There are six survey forms intotal, each uniquely tailored for aspecific point in the waste manage-ment system. Forms 1-3 allow forthe collection of data on theamount of MSW recycled in yourstate or locality and address collec-tors, processors, and end users ofrecyclables, respectively. Forms 4-6allow for the collection of data onthe amount of MSW disposed of inyour state or locality and addresswaste collectors, transfer stations,and disposal facilities, respectively.In addition to MSW, each surveyform also allows data to be collect-ed on materials not considered tobe MSW (referred to as “other solidwaste” and “other recyclables”).
As discussed in Section 4, deter-mining who to survey is a criticalstep in the design of your recyclingmeasurement system, and you areallowed flexibility in selectingwhich points in the chain to survey.In order to obtain data on bothMSW recycling and disposal, youwill want to use two of the surveyforms at a minimum, one fromeach group. You may choose, how-ever, to use more than two or evenall six of the survey forms, depend-ing on your particular surveyingapproach. Table 13 describes eachof the survey forms, including thepurpose and who should completethe form.
63Survey Forms
AP
PE
ND
IX
CSurvey Forms
Introduction to the Survey Forms
The survey forms contained in this appendix are
designed to help you obtain the municipal solid
waste (MSW) recycling and disposal data neces-
sary for calculating a standard recycling rate. The forms may
be used by states or localities that are measuring recycling for
the first time and want to use the standard methodology
outlined in this guide or those that wish to redesign their
current recycling measurement system according to the stan-
dard methodology.
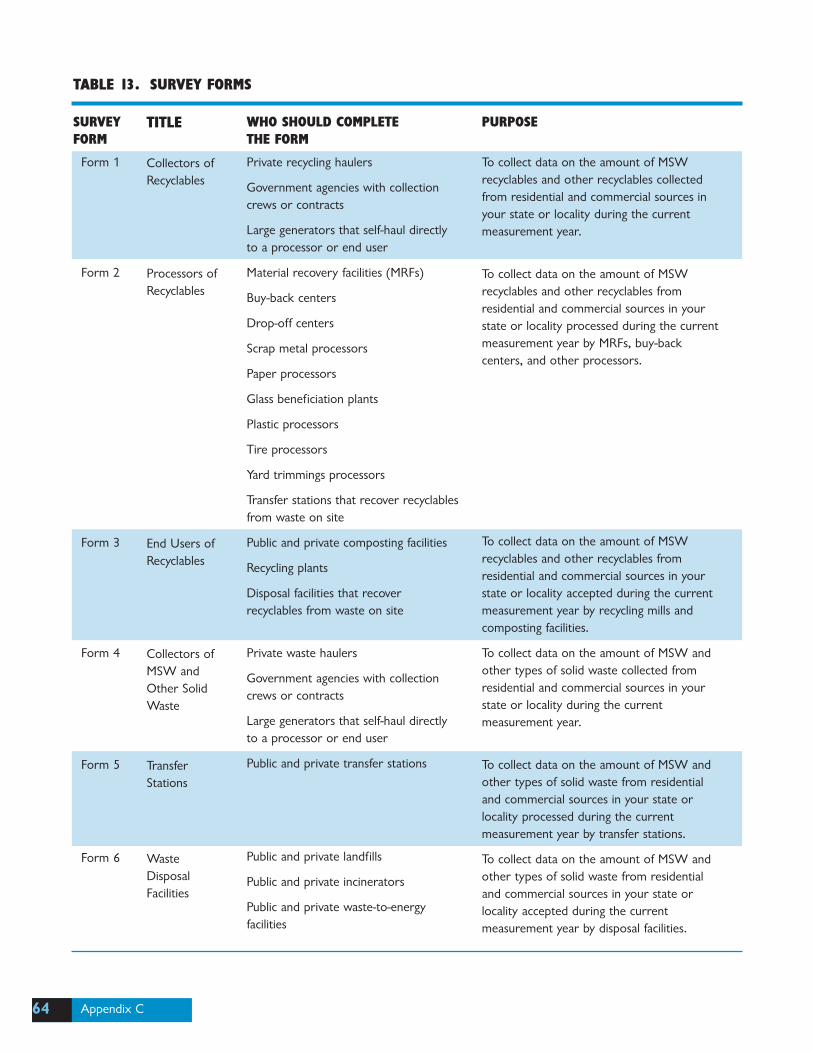
Appendix C64
SURVEYFORM
Form 1
Form 2
Form 3
Form 4
Form 5
Form 6
TITLE
Collectors ofRecyclables
Processors ofRecyclables
End Users ofRecyclables
Collectors ofMSW andOther SolidWaste
TransferStations
WasteDisposalFacilities
WHO SHOULD COMPLETE THE FORM
Private recycling haulers
Government agencies with collectioncrews or contracts
Large generators that self-haul directlyto a processor or end user
Material recovery facilities (MRFs)
Buy-back centers
Drop-off centers
Scrap metal processors
Paper processors
Glass beneficiation plants
Plastic processors
Tire processors
Yard trimmings processors
Transfer stations that recover recyclablesfrom waste on site
Public and private composting facilities
Recycling plants
Disposal facilities that recoverrecyclables from waste on site
Private waste haulers
Government agencies with collectioncrews or contracts
Large generators that self-haul directlyto a processor or end user
Public and private transfer stations
Public and private landfills
Public and private incinerators
Public and private waste-to-energyfacilities
PURPOSE
To collect data on the amount of MSWrecyclables and other recyclables collectedfrom residential and commercial sources inyour state or locality during the currentmeasurement year.
To collect data on the amount of MSWrecyclables and other recyclables fromresidential and commercial sources in yourstate or locality processed during the currentmeasurement year by MRFs, buy-backcenters, and other processors.
To collect data on the amount of MSWrecyclables and other recyclables fromresidential and commercial sources in yourstate or locality accepted during the currentmeasurement year by recycling mills andcomposting facilities.
To collect data on the amount of MSW andother types of solid waste collected fromresidential and commercial sources in yourstate or locality during the currentmeasurement year.
To collect data on the amount of MSW andother types of solid waste from residentialand commercial sources in your state orlocality processed during the currentmeasurement year by transfer stations.
To collect data on the amount of MSW andother types of solid waste from residentialand commercial sources in your state orlocality accepted during the currentmeasurement year by disposal facilities.
TABLE 13. SURVEY FORMS
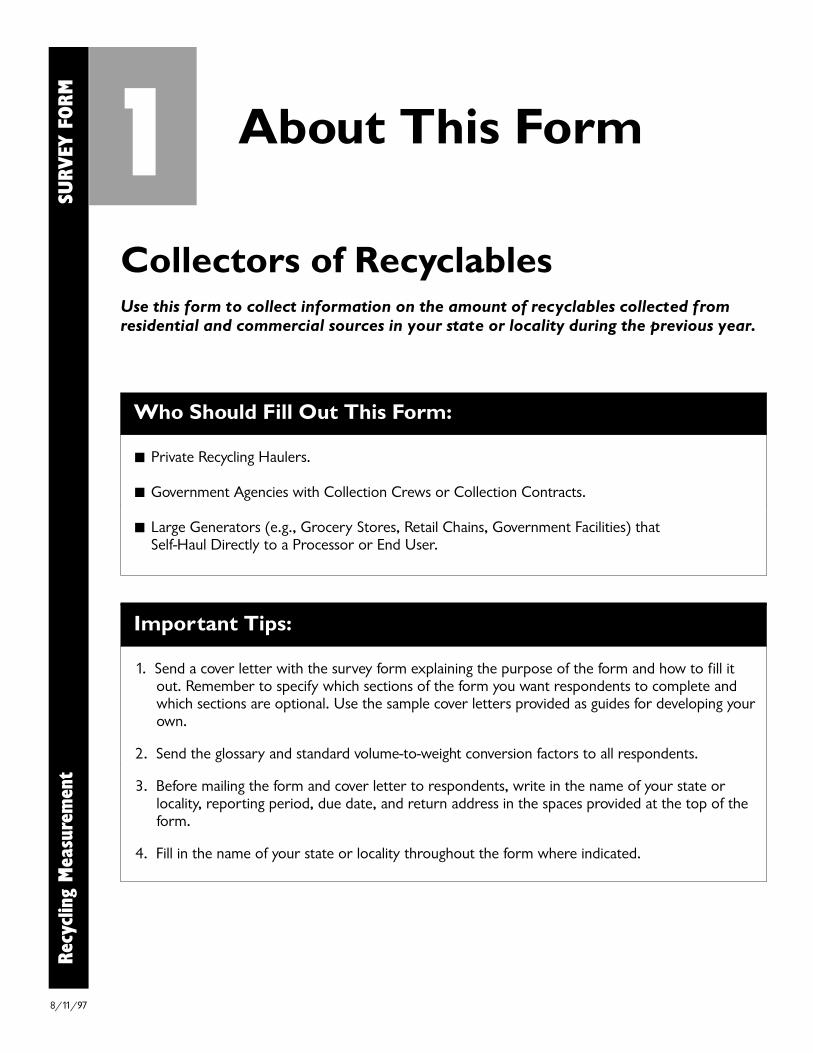
Collectors of RecyclablesUse this form to collect information on the amount of recyclables collected fromresidential and commercial sources in your state or locality during the previous year.
1
Who Should Fill Out This Form:
Private Recycling Haulers.
Government Agencies with Collection Crews or Collection Contracts.
Large Generators (e.g., Grocery Stores, Retail Chains, Government Facilities) that Self-Haul Directly to a Processor or End User.
Important Tips:
1. Send a cover letter with the survey form explaining the purpose of the form and how to fill itout. Remember to specify which sections of the form you want respondents to complete andwhich sections are optional. Use the sample cover letters provided as guides for developing yourown.
2. Send the glossary and standard volume-to-weight conversion factors to all respondents.
3. Before mailing the form and cover letter to respondents, write in the name of your state orlocality, reporting period, due date, and return address in the spaces provided at the top of theform.
4. Fill in the name of your state or locality throughout the form where indicated.
About This Form
Recy
clin
g M
easu
rem
ent
S
URV
EY F
ORM
8/11/97

Collectors of Recyclables
To Be Completed by the Surveyor:
State or Locality:
Reporting Period: ____________________ to ____________________
Return This Form to:
Return This Form by: _____ /_____ /_____
Direct All Questions to: Name _______________________ Telephone ( ) ______________
Recy
clin
g M
easu
rem
ent
SU
RVEY
FORM
Respondent Information (please type or print clearly):
Name of Company or Government Agency:
Address: Street ______________________________________________________________________
City __________________________________________________ Zip _________________
Telephone: ( ) ______________________________ FAX: ( ) _____________________________
Name of Contact: Title:
Are You a: Private Hauler Large Generator Government Agency With a Collection Crew or a Collection Contract
1
1
Certification
I certify that, to the best of my knowledge, the information reported in this form is accurate and truthful.
________________________________Name and Title
_______________________________Signature
_____________Date
8/11/97
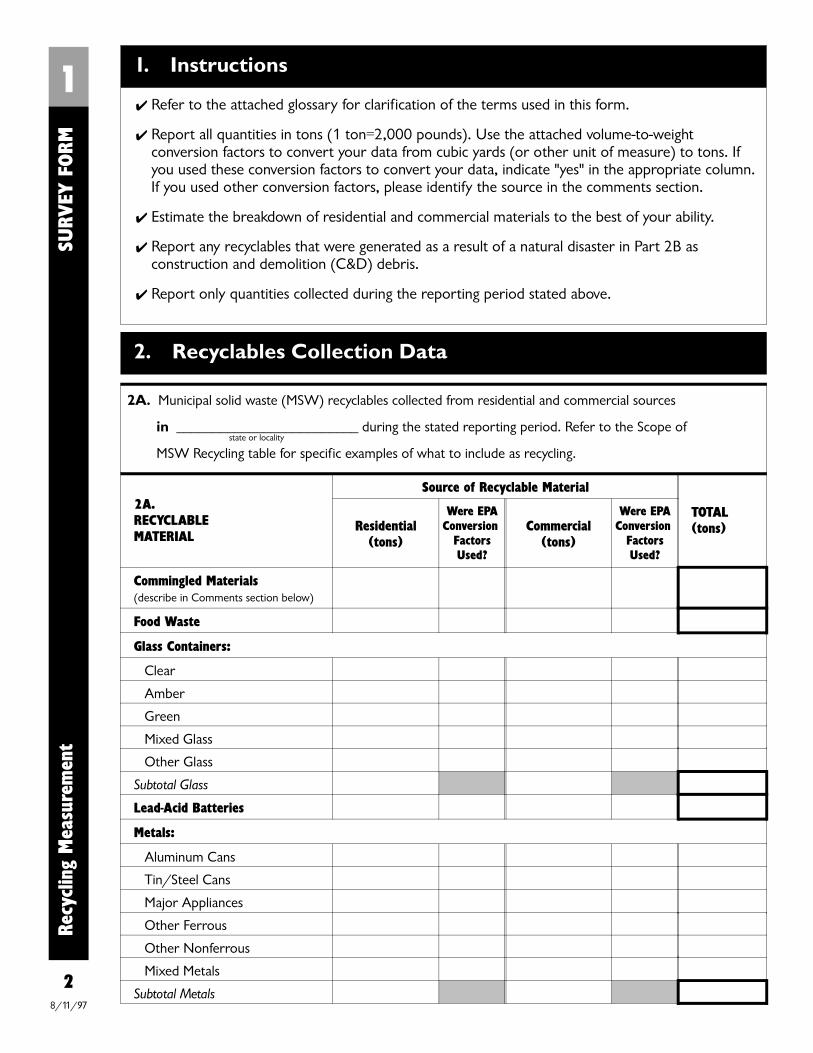
state or locality
Recy
clin
g M
easu
rem
ent
SU
RVEY
FORM
1
2
1. Instructions
✔ Refer to the attached glossary for clarification of the terms used in this form.
✔ Report all quantities in tons (1 ton=2,000 pounds). Use the attached volume-to-weightconversion factors to convert your data from cubic yards (or other unit of measure) to tons. Ifyou used these conversion factors to convert your data, indicate "yes" in the appropriate column.If you used other conversion factors, please identify the source in the comments section.
✔ Estimate the breakdown of residential and commercial materials to the best of your ability.
✔ Report any recyclables that were generated as a result of a natural disaster in Part 2B as construction and demolition (C&D) debris.
✔ Report only quantities collected during the reporting period stated above.
2. Recyclables Collection Data
2A. Municipal solid waste (MSW) recyclables collected from residential and commercial sources
in _________________________ during the stated reporting period. Refer to the Scope of
MSW Recycling table for specific examples of what to include as recycling.
2A.RECYCLABLE MATERIAL
Source of Recyclable Material
TOTAL(tons)Residential
(tons)
Were EPAConversion
FactorsUsed?
Commercial(tons)
Were EPAConversion
FactorsUsed?
Commingled Materials(describe in Comments section below)
Food Waste
Glass Containers:
Clear
Amber
Green
Mixed Glass
Other Glass
Subtotal Glass
Lead-Acid Batteries
Metals:
Aluminum Cans
Tin/Steel Cans
Major Appliances
Other Ferrous
Other Nonferrous
Mixed Metals
Subtotal Metals8/11/97
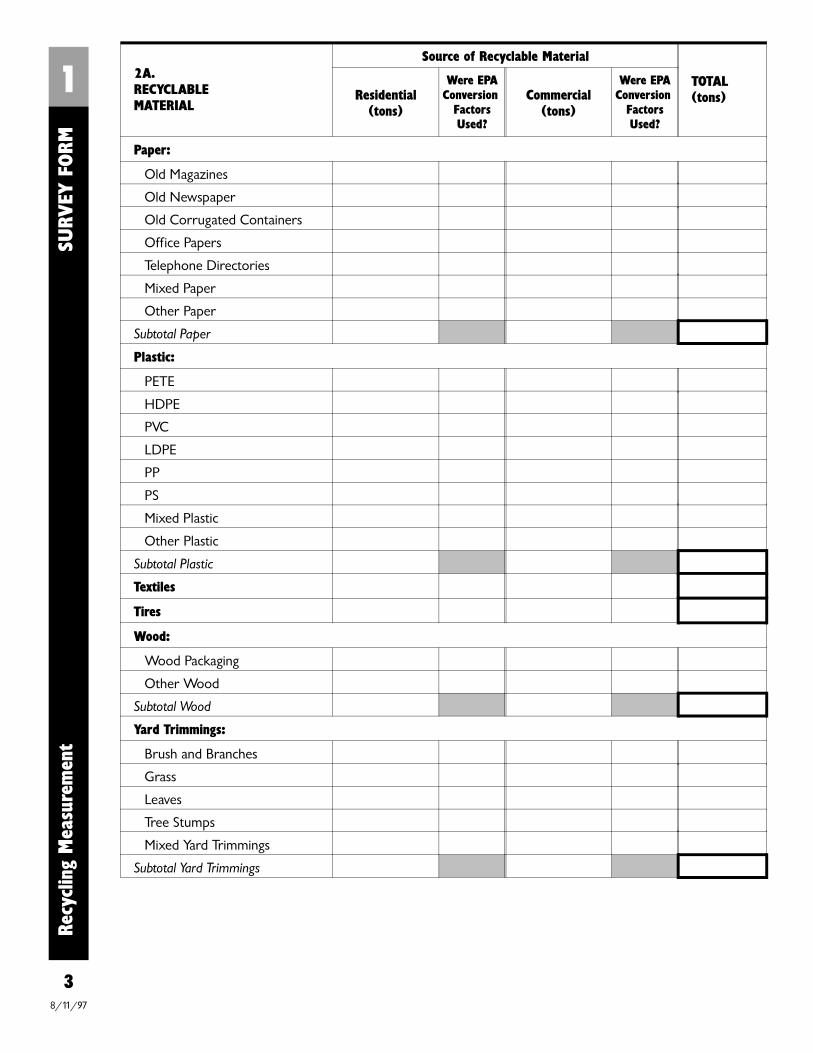
Recy
clin
g M
easu
rem
ent
SU
RVEY
FO
RM
1
3
2A.RECYCLABLE MATERIAL
Source of Recyclable Material
TOTAL(tons)Residential
(tons)
Were EPAConversion
FactorsUsed?
Commercial(tons)
Were EPAConversion
FactorsUsed?
Paper:
Old Magazines
Old Newspaper
Old Corrugated Containers
Office Papers
Telephone Directories
Mixed Paper
Other Paper
Subtotal Paper
Plastic:
PETE
HDPE
PVC
LDPE
PP
PS
Mixed Plastic
Other Plastic
Subtotal Plastic
Textiles
Tires
Wood:
Wood Packaging
Other Wood
Subtotal Wood
Yard Trimmings:
Brush and Branches
Grass
Leaves
Tree Stumps
Mixed Yard Trimmings
Subtotal Yard Trimmings
8/11/97

2A.RECYCLABLE MATERIAL
Source of Recyclable Material
TOTAL(tons)Residential
(tons)
Were EPAConversion
FactorsUsed?
Commercial(tons)
Were EPAConversion
FactorsUsed?
Other Recyclables:
___________________
___________________
___________________
Subtotal Other Recyclables
TOTAL (tons)
Are any of the reported quantities estimates, i.e., guesses? If they are estimates, explain how they were determined below.
Explanation of estimates/Comments: ______________________________________________________
____________________________________________________________________________________
____________________________________________________________________________________
Recy
clin
g M
easu
rem
ent
SU
RVEY
FORM
1
48/11/97

state or locality
5
2B. Other types of recyclables collected from sources in _______________________________________
during the stated reporting period.
RECYCLABLE MATERIALWere EPAConversion
Factors Used?AMOUNT RECEIVED (tons)
Agricultural Waste
Automobile Bodies
Combustion Ash
Construction and Demolition Debris:
Asphalt
Concrete
Metals
Natural disaster debris
Wood
Other C&D
Industrial Process Waste
Municipal Sewage Sludge
Preconsumer Waste
Used Oil
Other _________________________
TOTAL (tons)
Are any of the reported quantities estimates, i.e., guesses? If they are estimates, explain how they were determined below.
Explanation of estimates: ________________________________________________________________
____________________________________________________________________________________
____________________________________________________________________________________
Recy
clin
g M
easu
rem
ent
SU
RVEY
FORM
1
8/11/97
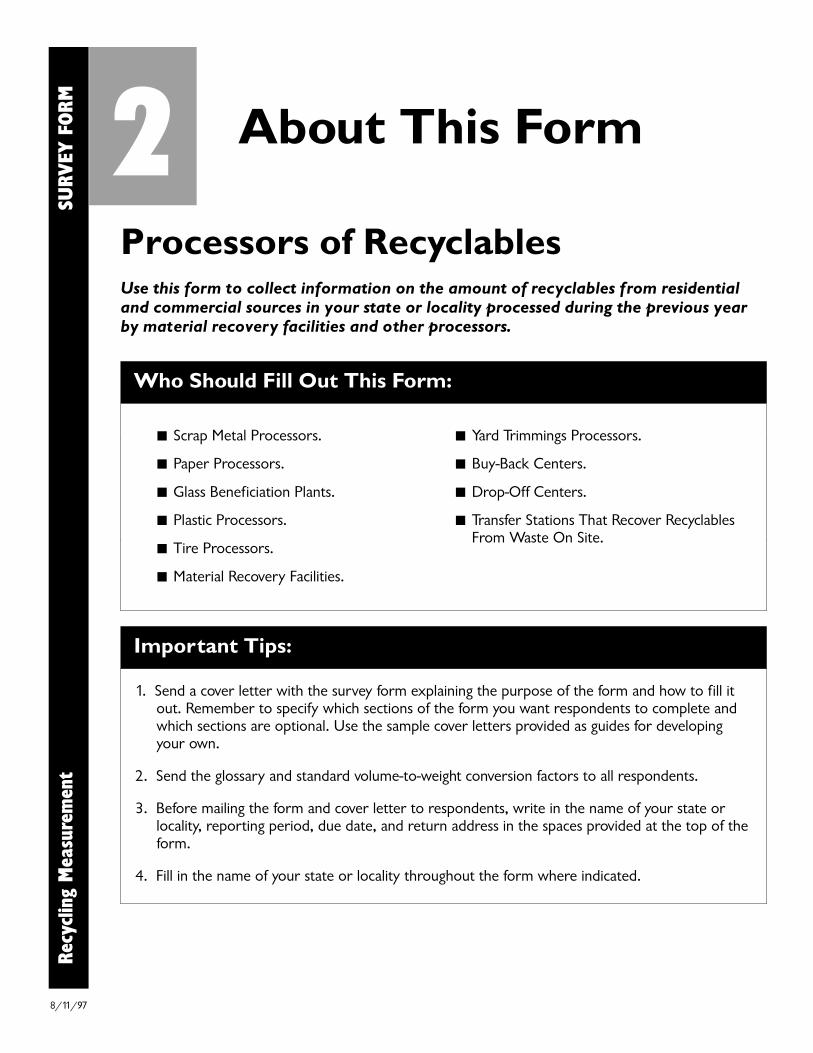
Processors of RecyclablesUse this form to collect information on the amount of recyclables from residentialand commercial sources in your state or locality processed during the previous yearby material recovery facilities and other processors.
Who Should Fill Out This Form:
Important Tips:
1. Send a cover letter with the survey form explaining the purpose of the form and how to fill itout. Remember to specify which sections of the form you want respondents to complete andwhich sections are optional. Use the sample cover letters provided as guides for developing your own.
2. Send the glossary and standard volume-to-weight conversion factors to all respondents.
3. Before mailing the form and cover letter to respondents, write in the name of your state orlocality, reporting period, due date, and return address in the spaces provided at the top of theform.
4. Fill in the name of your state or locality throughout the form where indicated.
2 About This Form
Recy
clin
g M
easu
rem
ent
SU
RVEY
FORM
Scrap Metal Processors.
Paper Processors.
Glass Beneficiation Plants.
Plastic Processors.
Tire Processors.
Material Recovery Facilities.
Yard Trimmings Processors.
Buy-Back Centers.
Drop-Off Centers.
Transfer Stations That Recover RecyclablesFrom Waste On Site.
8/11/97
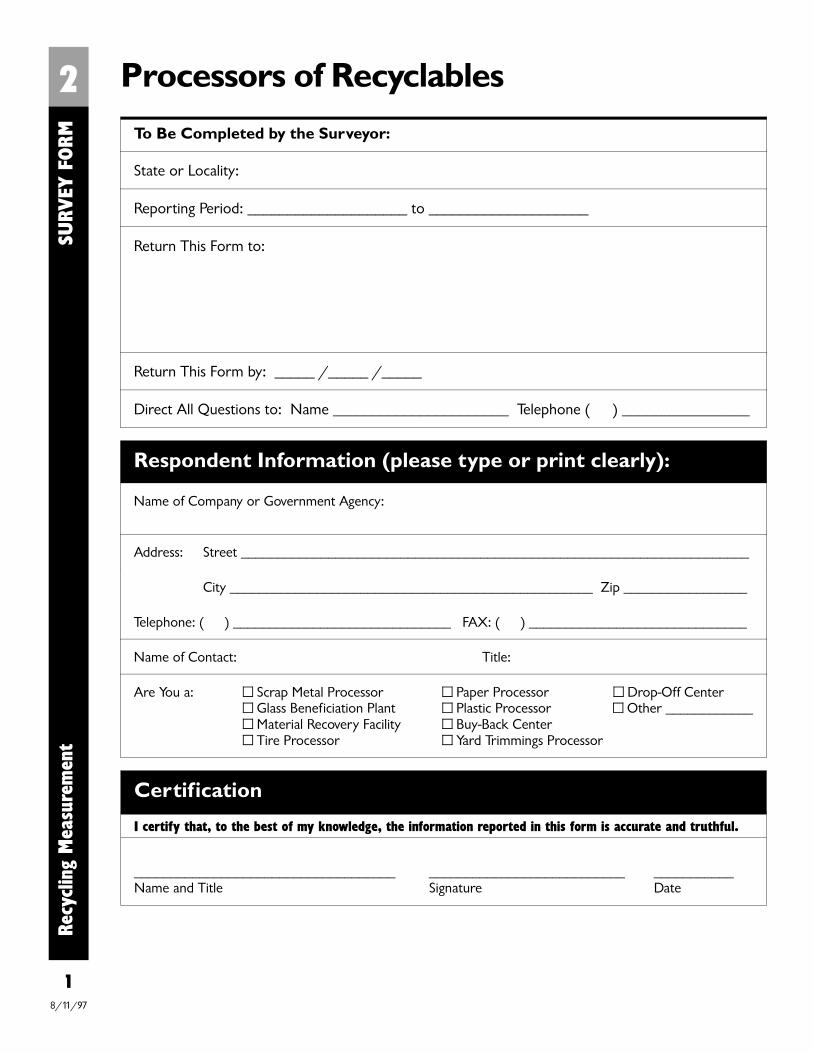
To Be Completed by the Surveyor:
State or Locality:
Reporting Period: ____________________ to ____________________
Return This Form to:
Return This Form by: _____ /_____ /_____
Direct All Questions to: Name ______________________ Telephone ( ) ________________
Processors of RecyclablesRe
cycl
ing
Mea
sure
men
t
SU
RVEY
FORM
2
1
Respondent Information (please type or print clearly):
Name of Company or Government Agency:
Address: Street ______________________________________________________________________
City __________________________________________________ Zip _________________
Telephone: ( ) ______________________________ FAX: ( ) ______________________________
Name of Contact: Title:
Are You a: Scrap Metal Processor Paper Processor Drop-Off Center Glass Beneficiation Plant Plastic Processor Other ____________ Material Recovery Facility Buy-Back Center Tire Processor Yard Trimmings Processor
Certification
I certify that, to the best of my knowledge, the information reported in this form is accurate and truthful.
____________________________________Name and Title
___________________________Signature
___________Date
8/11/97

state or locality
2Re
cycl
ing
Mea
sure
men
t
SU
RVEY
FORM
2
1. Instructions
✔ Refer to the attached glossary for clarification of the terms used in this form.
✔ Report all quantities in tons (1 ton=2,000 pounds). Use the attached volume-to-weightconversion factors to convert your data from cubic yards (or other unit of measure) to tons. Ifyou used these conversion factors to convert your data, indicate "yes" in the appropriate column.If you used other conversion factors, please identify the source in the comments section.
✔ Estimate the breakdown of residential and commercial materials to the best of your ability.
✔ Report any recyclables that were generated as a result of a natural disaster in Part 2B as construction and demolition (C&D) debris.
✔ Report only quantities received during the reporting period stated above.
2A.RECYCLABLE MATERIAL
Source of Recyclable Material
TOTAL(tons)Residential
(tons)
Were EPAConversion
FactorsUsed?
Commercial(tons)
Were EPAConversion
FactorsUsed?
Commingled Materials(describe in Comments section below)
Food Waste
Glass Containers:
Clear
Amber
Green
Mixed Glass
Other GlassSubtotal Glass
Lead-Acid Batteries
Metals:
Aluminum Cans
Tin/Steel Cans
Major Appliances
Other Ferrous
Other Nonferrous
Mixed MetalsSubtotal Metals
2. Recyclables Processing Data
2A. Municipal solid waste (MSW) recyclables received from residential and commercial sources
in __________________________ during the stated reporting period. Refer to the Scope of
MSW Recycling table for specific examples of what to include as recycling.
8/11/97
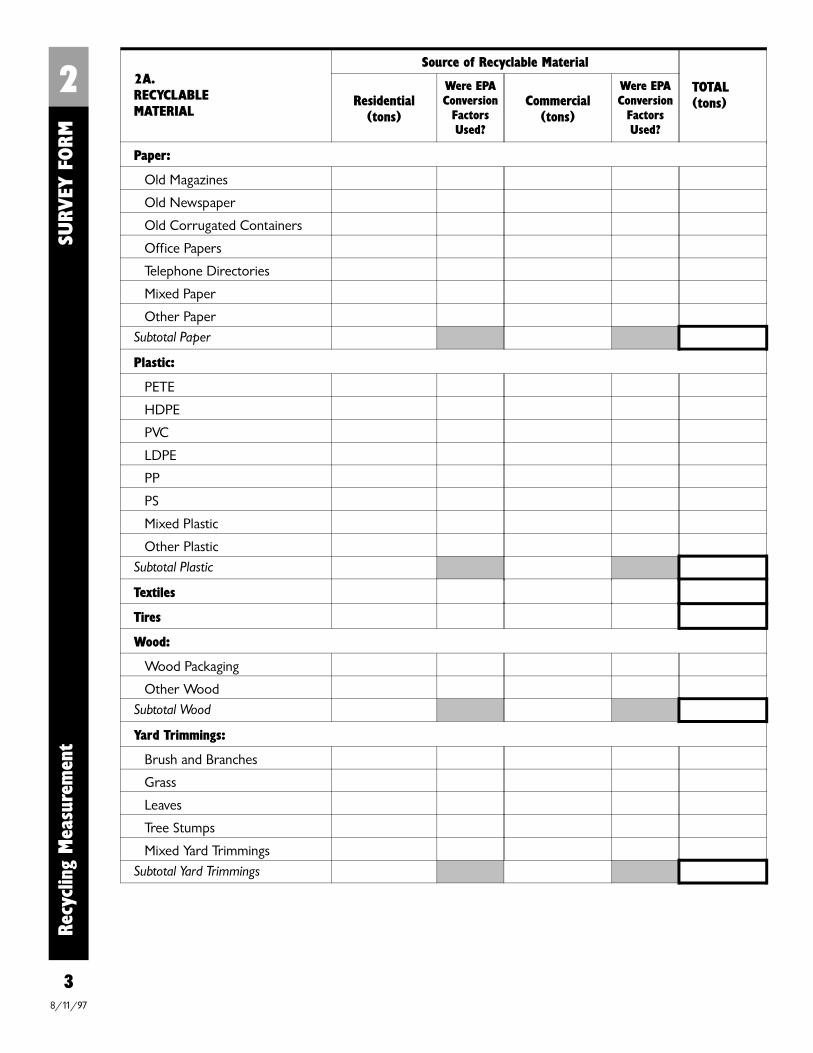
2A.RECYCLABLE MATERIAL
Source of Recyclable Material
TOTAL(tons)Residential
(tons)
Were EPAConversion
FactorsUsed?
Commercial(tons)
Were EPAConversion
FactorsUsed?
Paper:
Old Magazines
Old Newspaper
Old Corrugated Containers
Office Papers
Telephone Directories
Mixed Paper
Other PaperSubtotal Paper
Plastic:
PETE
HDPE
PVC
LDPE
PP
PS
Mixed Plastic
Other PlasticSubtotal Plastic
Textiles
Tires
Wood:
Wood Packaging
Other WoodSubtotal Wood
Yard Trimmings:
Brush and Branches
Grass
Leaves
Tree Stumps
Mixed Yard TrimmingsSubtotal Yard Trimmings
2Re
cycl
ing
Mea
sure
men
t
SU
RVEY
FORM
38/11/97
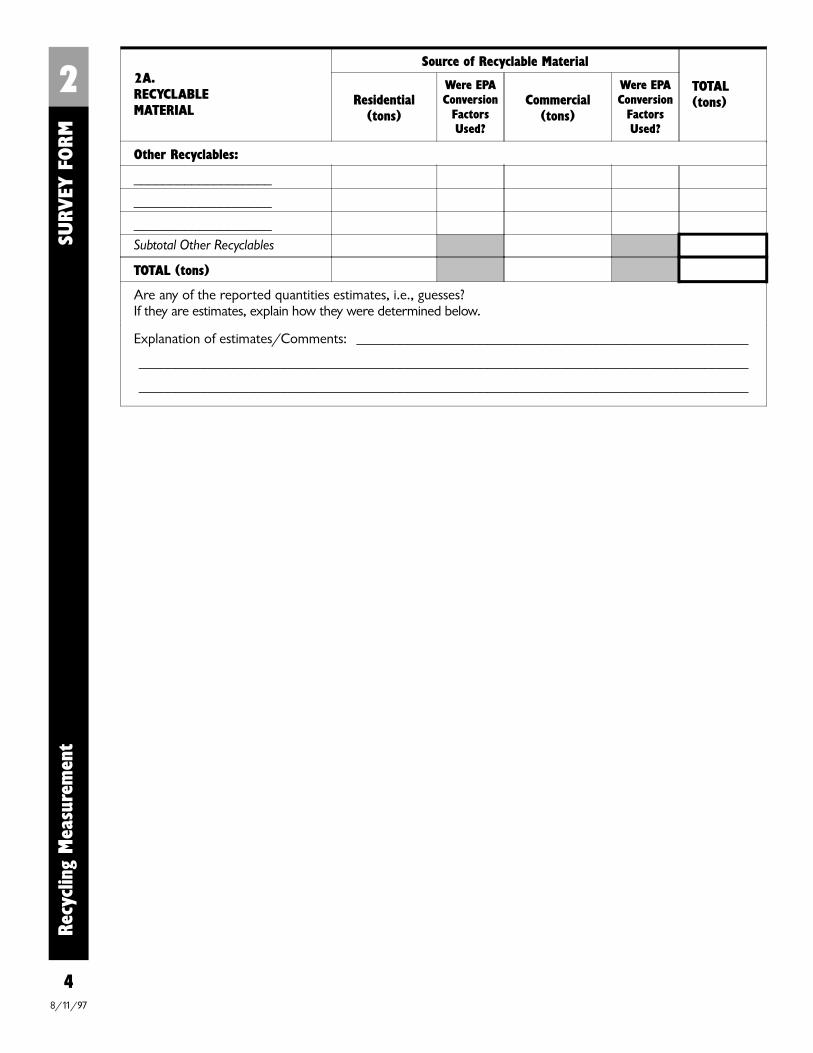
2Re
cycl
ing
Mea
sure
men
t
SU
RVEY
FORM
4
2A.RECYCLABLE MATERIAL
Source of Recyclable Material
TOTAL(tons)Residential
(tons)
Were EPAConversion
FactorsUsed?
Commercial(tons)
Were EPAConversion
FactorsUsed?
Other Recyclables:
___________________
___________________
___________________Subtotal Other Recyclables
TOTAL (tons)
Are any of the reported quantities estimates, i.e., guesses? If they are estimates, explain how they were determined below.
Explanation of estimates/Comments: ______________________________________________________
____________________________________________________________________________________
____________________________________________________________________________________
8/11/97
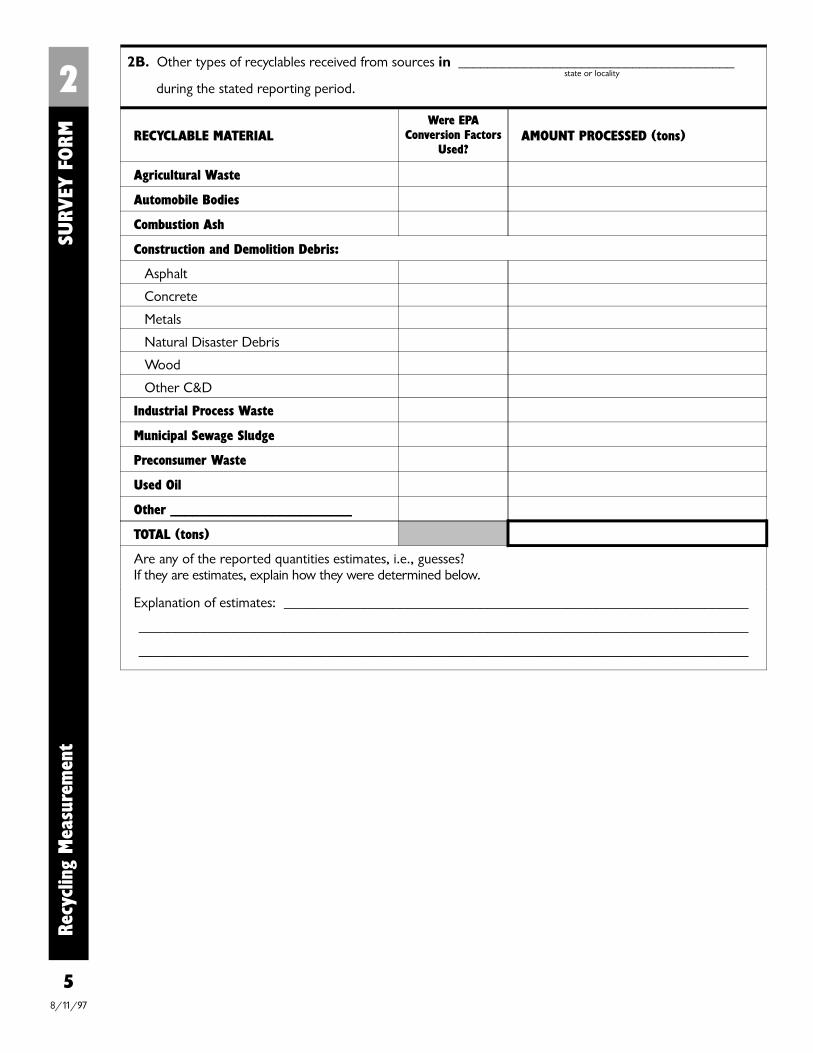
state or locality
5
2B. Other types of recyclables received from sources in ______________________________________
during the stated reporting period.
RECYCLABLE MATERIALWere EPA
Conversion FactorsUsed?
AMOUNT PROCESSED (tons)
Agricultural Waste
Automobile Bodies
Combustion Ash
Construction and Demolition Debris:
Asphalt
Concrete
Metals
Natural Disaster Debris
Wood
Other C&D
Industrial Process Waste
Municipal Sewage Sludge
Preconsumer Waste
Used Oil
Other _________________________
TOTAL (tons)
Are any of the reported quantities estimates, i.e., guesses? If they are estimates, explain how they were determined below.
Explanation of estimates: ________________________________________________________________
____________________________________________________________________________________
____________________________________________________________________________________
2Re
cycl
ing
Mea
sure
men
t
SU
RVEY
FORM
8/11/97
End Users of RecyclablesUse this form to collect information on the amount of recyclables from residentialand commercial sources in your state or locality accepted during the previous yearby recycling mills and composting facilities.
Who Should Fill Out This Form:
Public and Private Composting Facilities.
Recycling Plants and Other End Users.
Disposal Facilities That Recover Recyclables From Waste On Site.
Important Tips:
1. Send a cover letter with the survey form explaining the purpose of the form and how to fill itout. Remember to specify which sections of the form you want respondents to complete andwhich sections are optional. Use the sample cover letters provided as guides for developing yourown.
2. Send the glossary and standard volume-to-weight conversion factors to all respondents.
3. Before mailing the form and cover letter to respondents, write in the name of your state orlocality, reporting period, due date, and return address in the spaces provided at the top of theform.
4. Fill in the name of your state or locality throughout the form where indicated.
3 About This Form
Recy
clin
g M
easu
rem
ent
SU
RVEY
FORM
8/11/97
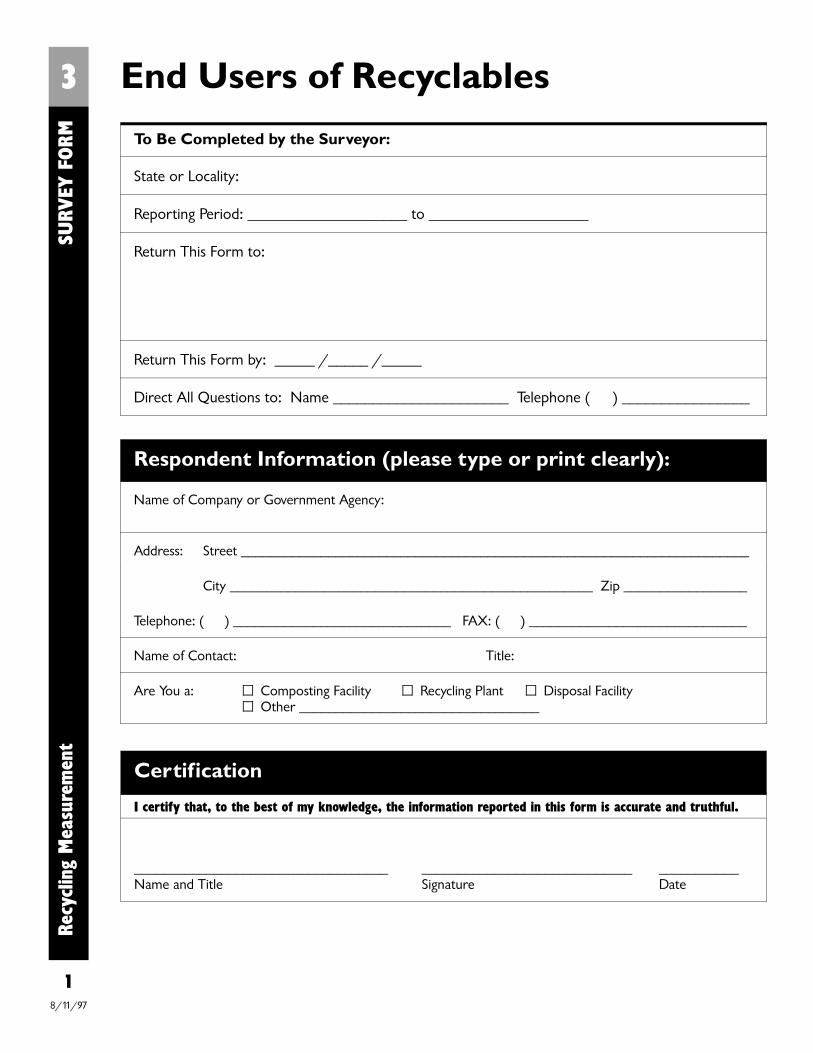
End Users of Recyclables
To Be Completed by the Surveyor:
State or Locality:
Reporting Period: ____________________ to ____________________
Return This Form to:
Return This Form by: _____ /_____ /_____
Direct All Questions to: Name ______________________ Telephone ( ) ________________
Recy
clin
g M
easu
rem
ent
S
URV
EY F
ORM
3
Respondent Information (please type or print clearly):
Name of Company or Government Agency:
Address: Street ______________________________________________________________________
City __________________________________________________ Zip _________________
Telephone: ( ) ______________________________ FAX: ( ) ______________________________
Name of Contact: Title:
Are You a: Composting Facility Recycling Plant Disposal Facility Other _________________________________
1
Certification
I certify that, to the best of my knowledge, the information reported in this form is accurate and truthful.
___________________________________Name and Title
_____________________________Signature
___________Date
8/11/97
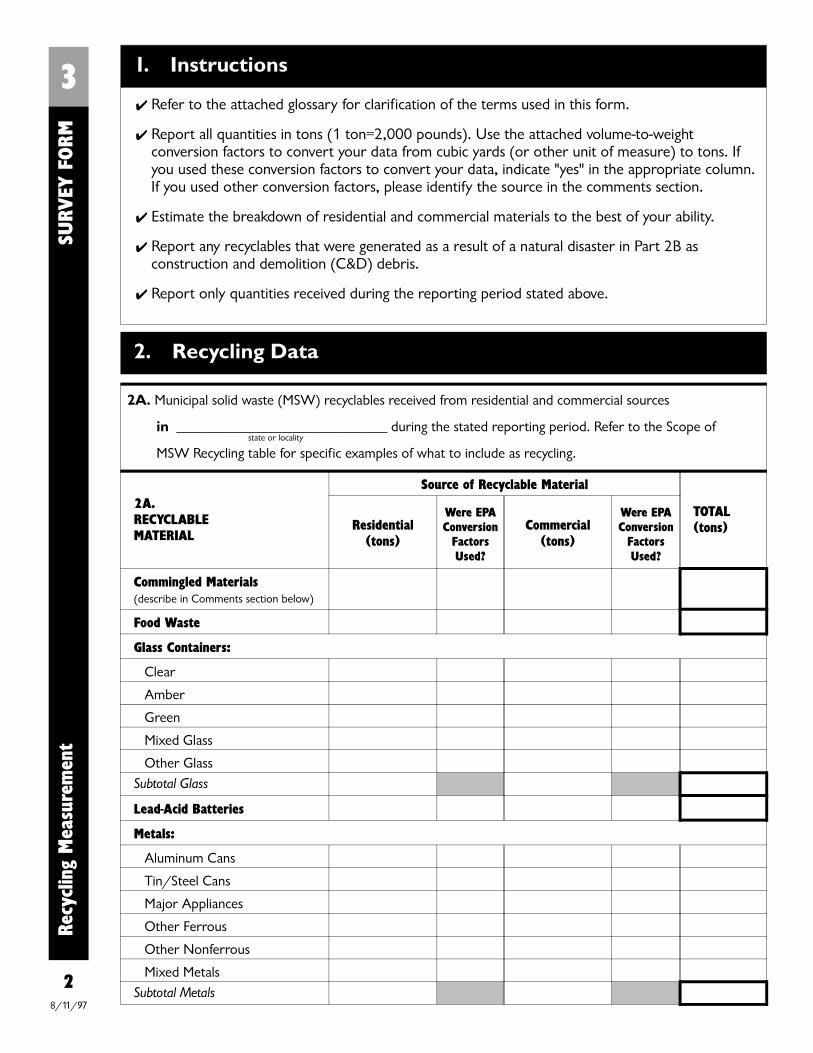
state or locality
1. Instructions
✔ Refer to the attached glossary for clarification of the terms used in this form.
✔ Report all quantities in tons (1 ton=2,000 pounds). Use the attached volume-to-weightconversion factors to convert your data from cubic yards (or other unit of measure) to tons. Ifyou used these conversion factors to convert your data, indicate "yes" in the appropriate column.If you used other conversion factors, please identify the source in the comments section.
✔ Estimate the breakdown of residential and commercial materials to the best of your ability.
✔ Report any recyclables that were generated as a result of a natural disaster in Part 2B as construction and demolition (C&D) debris.
✔ Report only quantities received during the reporting period stated above.
3Re
cycl
ing
Mea
sure
men
t
S
URV
EY F
ORM
2
2. Recycling Data
2A. Municipal solid waste (MSW) recyclables received from residential and commercial sources
in _____________________________ during the stated reporting period. Refer to the Scope of
MSW Recycling table for specific examples of what to include as recycling.
2A.RECYCLABLE MATERIAL
Source of Recyclable Material
TOTAL(tons)Residential
(tons)
Were EPAConversion
FactorsUsed?
Commercial(tons)
Were EPAConversion
FactorsUsed?
Commingled Materials(describe in Comments section below)
Food Waste
Glass Containers:
Clear
Amber
Green
Mixed Glass
Other GlassSubtotal Glass
Lead-Acid Batteries
Metals:
Aluminum Cans
Tin/Steel Cans
Major Appliances
Other Ferrous
Other Nonferrous
Mixed MetalsSubtotal Metals
8/11/97
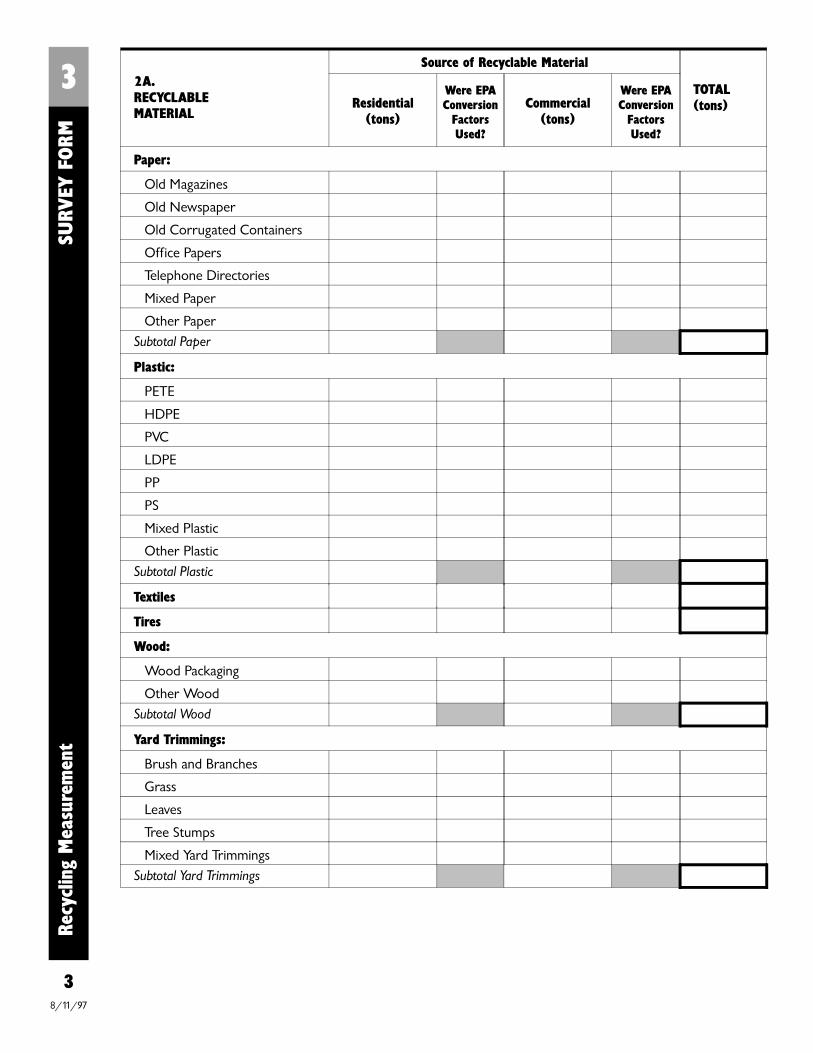
2A.RECYCLABLE MATERIAL
Source of Recyclable Material
TOTAL(tons)Residential
(tons)
Were EPAConversion
FactorsUsed?
Commercial(tons)
Were EPAConversion
FactorsUsed?
Paper:
Old Magazines
Old Newspaper
Old Corrugated Containers
Office Papers
Telephone Directories
Mixed Paper
Other PaperSubtotal Paper
Plastic:
PETE
HDPE
PVC
LDPE
PP
PS
Mixed Plastic
Other PlasticSubtotal Plastic
Textiles
Tires
Wood:
Wood Packaging
Other WoodSubtotal Wood
Yard Trimmings:
Brush and Branches
Grass
Leaves
Tree Stumps
Mixed Yard TrimmingsSubtotal Yard Trimmings
3Re
cycl
ing
Mea
sure
men
t
S
URV
EY F
ORM
38/11/97
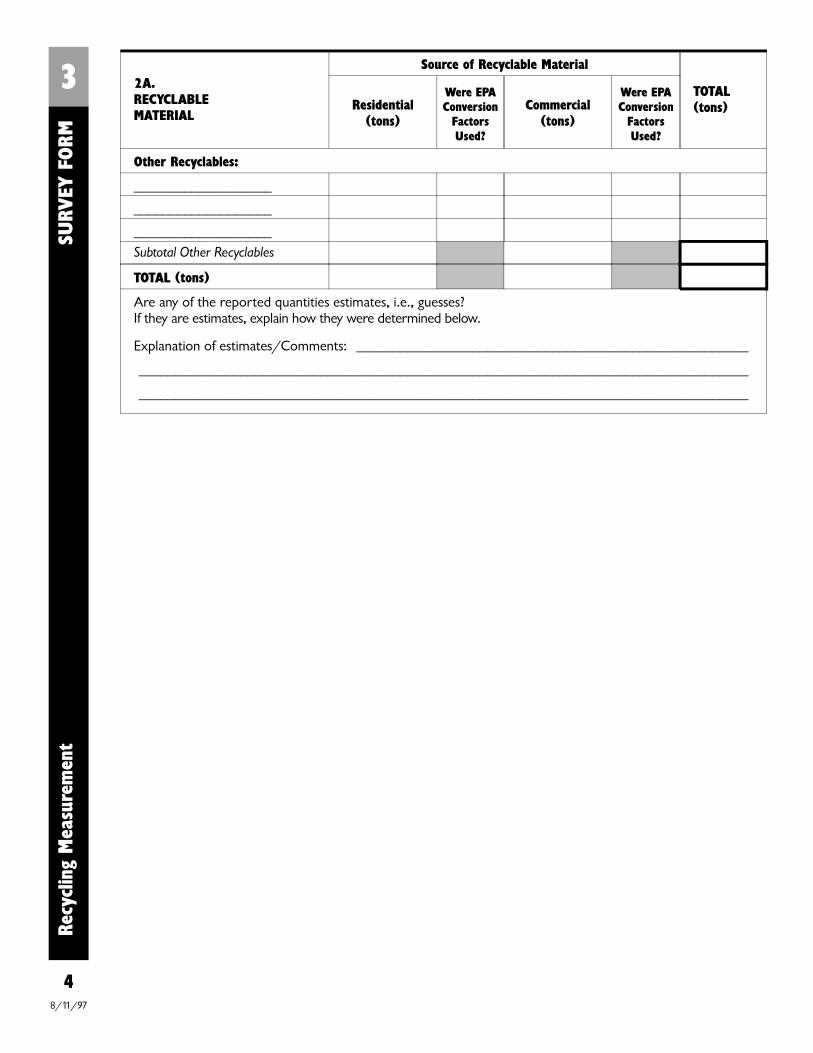
2A.RECYCLABLE MATERIAL
Source of Recyclable Material
TOTAL(tons)Residential
(tons)
Were EPAConversion
FactorsUsed?
Commercial(tons)
Were EPAConversion
FactorsUsed?
Other Recyclables:
___________________
___________________
___________________Subtotal Other Recyclables
TOTAL (tons)
Are any of the reported quantities estimates, i.e., guesses? If they are estimates, explain how they were determined below.
Explanation of estimates/Comments: ______________________________________________________
____________________________________________________________________________________
____________________________________________________________________________________
3Re
cycl
ing
Mea
sure
men
t
S
URV
EY F
ORM
48/11/97
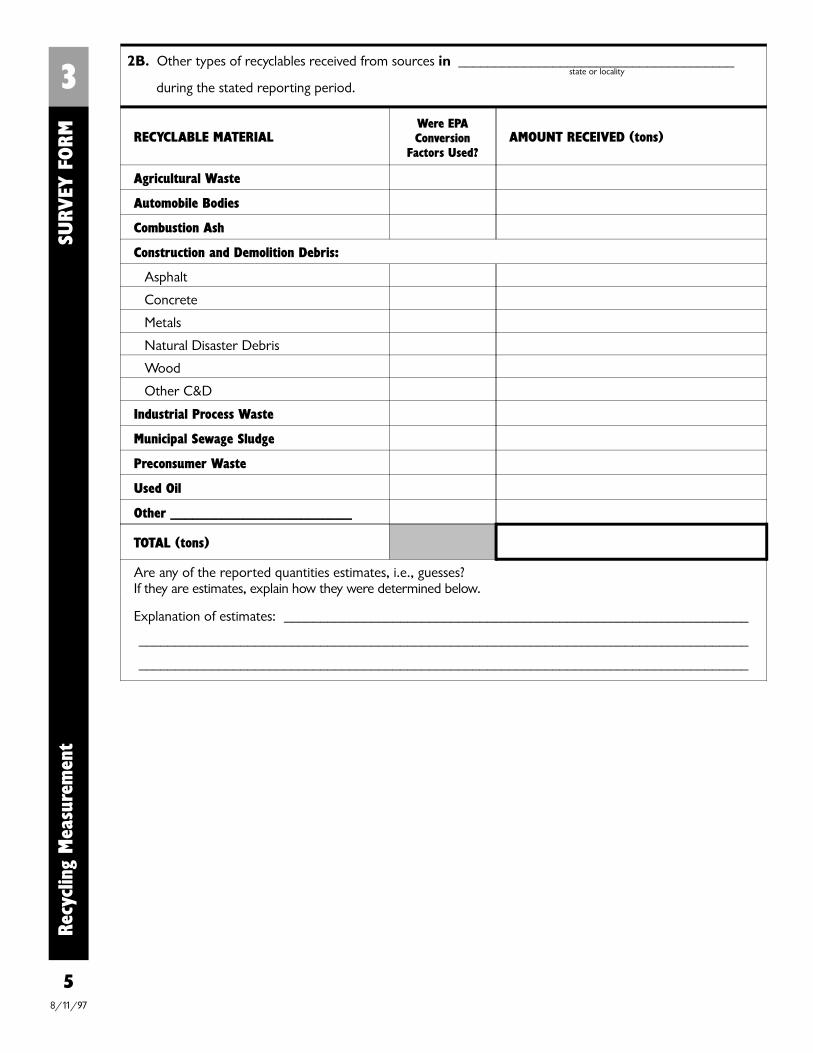
state or locality
5
2B. Other types of recyclables received from sources in ______________________________________
during the stated reporting period.
RECYCLABLE MATERIALWere EPAConversion
Factors Used?AMOUNT RECEIVED (tons)
Agricultural Waste
Automobile Bodies
Combustion Ash
Construction and Demolition Debris:
Asphalt
Concrete
Metals
Natural Disaster Debris
Wood
Other C&D
Industrial Process Waste
Municipal Sewage Sludge
Preconsumer Waste
Used Oil
Other _________________________
TOTAL (tons)
Are any of the reported quantities estimates, i.e., guesses? If they are estimates, explain how they were determined below.
Explanation of estimates: ________________________________________________________________
____________________________________________________________________________________
____________________________________________________________________________________
3Re
cycl
ing
Mea
sure
men
t
S
URV
EY F
ORM
8/11/97
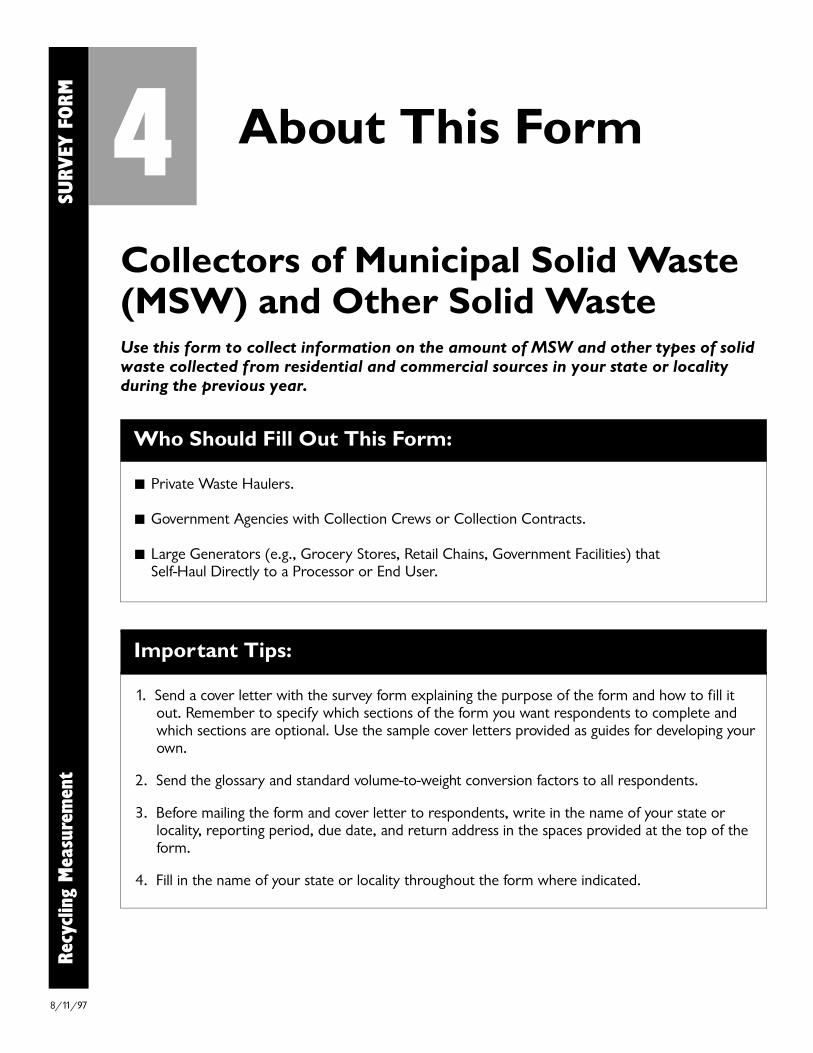
Collectors of Municipal Solid Waste(MSW) and Other Solid WasteUse this form to collect information on the amount of MSW and other types of solidwaste collected from residential and commercial sources in your state or localityduring the previous year.
4
Who Should Fill Out This Form:
Private Waste Haulers.
Government Agencies with Collection Crews or Collection Contracts.
Large Generators (e.g., Grocery Stores, Retail Chains, Government Facilities) that Self-Haul Directly to a Processor or End User.
Important Tips:
1. Send a cover letter with the survey form explaining the purpose of the form and how to fill itout. Remember to specify which sections of the form you want respondents to complete andwhich sections are optional. Use the sample cover letters provided as guides for developing yourown.
2. Send the glossary and standard volume-to-weight conversion factors to all respondents.
3. Before mailing the form and cover letter to respondents, write in the name of your state orlocality, reporting period, due date, and return address in the spaces provided at the top of theform.
4. Fill in the name of your state or locality throughout the form where indicated.
About This Form
Recy
clin
g M
easu
rem
ent
S
URV
EY F
ORM
8/11/97
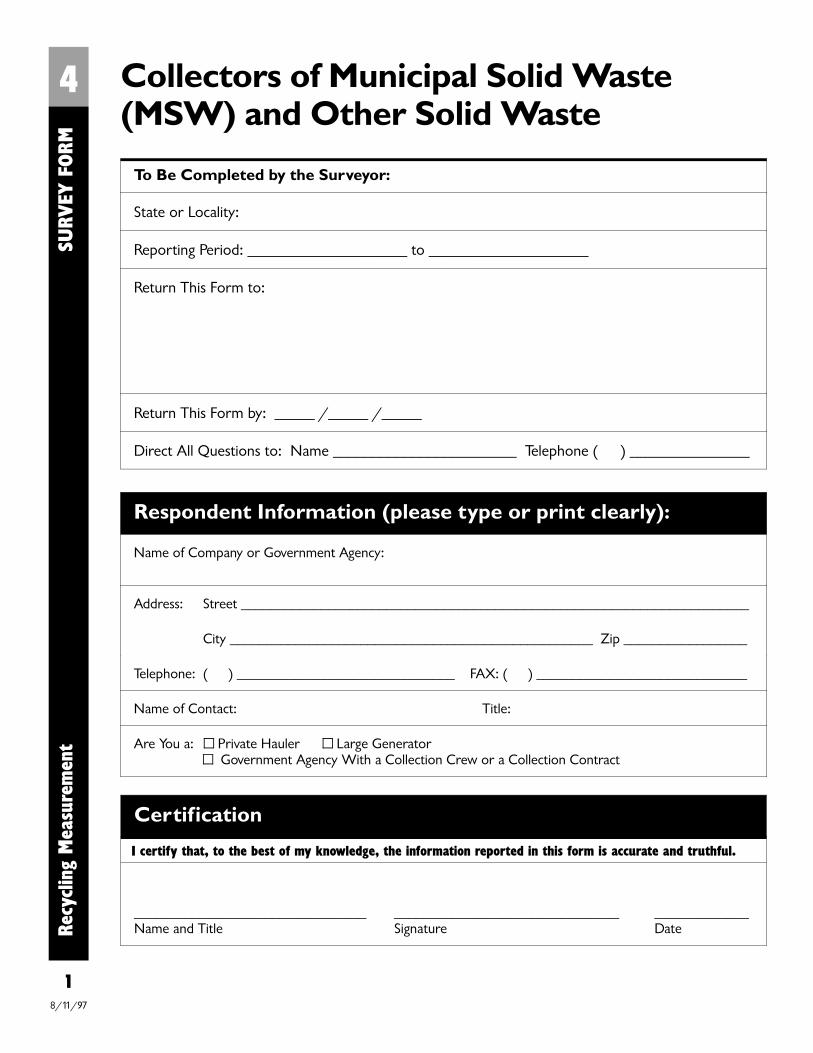
Collectors of Municipal Solid Waste(MSW) and Other Solid Waste
To Be Completed by the Surveyor:
State or Locality:
Reporting Period: ____________________ to ____________________
Return This Form to:
Return This Form by: _____ /_____ /_____
Direct All Questions to: Name _______________________ Telephone ( ) _______________
Recy
clin
g M
easu
rem
ent
SU
RVEY
FORM
Respondent Information (please type or print clearly):
Name of Company or Government Agency:
Address: Street ______________________________________________________________________
City __________________________________________________ Zip _________________
Telephone: ( ) ______________________________ FAX: ( ) _____________________________
Name of Contact: Title:
Are You a: Private Hauler Large Generator Government Agency With a Collection Crew or a Collection Contract
4
1
Certification
I certify that, to the best of my knowledge, the information reported in this form is accurate and truthful.
________________________________Name and Title
_______________________________Signature
_____________Date
8/11/97
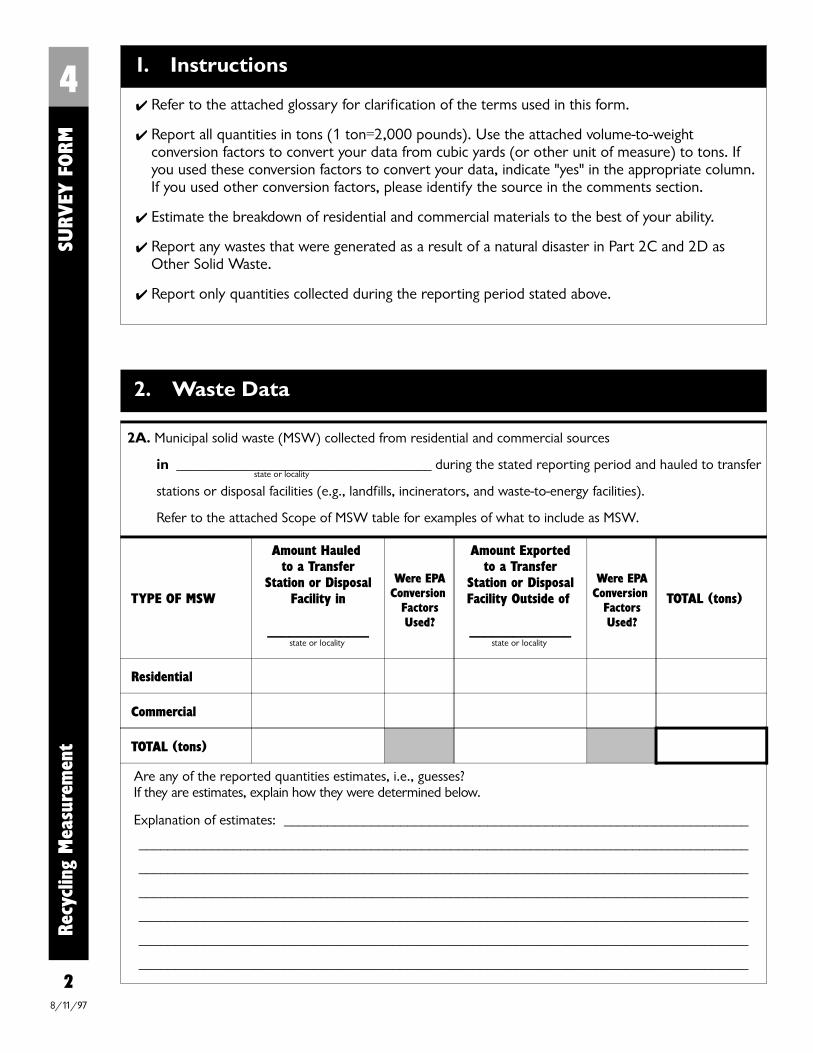
state or locality
state or locality state or locality
2. Waste Data
2A. Municipal solid waste (MSW) collected from residential and commercial sources
in ___________________________________ during the stated reporting period and hauled to transfer
stations or disposal facilities (e.g., landfills, incinerators, and waste-to-energy facilities).
Refer to the attached Scope of MSW table for examples of what to include as MSW.
TYPE OF MSW
Amount Hauled to a Transfer
Station or DisposalFacility in
______________
Were EPAConversion
FactorsUsed?
Amount Exportedto a Transfer
Station or DisposalFacility Outside of
______________
Were EPAConversion
FactorsUsed?
TOTAL (tons)
Residential
Commercial
TOTAL (tons)
Are any of the reported quantities estimates, i.e., guesses? If they are estimates, explain how they were determined below.
Explanation of estimates: ________________________________________________________________
____________________________________________________________________________________
____________________________________________________________________________________
____________________________________________________________________________________
____________________________________________________________________________________
____________________________________________________________________________________
____________________________________________________________________________________
Recy
clin
g M
easu
rem
ent
SU
RVEY
FORM
4
2
1. Instructions
✔ Refer to the attached glossary for clarification of the terms used in this form.
✔ Report all quantities in tons (1 ton=2,000 pounds). Use the attached volume-to-weightconversion factors to convert your data from cubic yards (or other unit of measure) to tons. Ifyou used these conversion factors to convert your data, indicate "yes" in the appropriate column.If you used other conversion factors, please identify the source in the comments section.
✔ Estimate the breakdown of residential and commercial materials to the best of your ability.
✔ Report any wastes that were generated as a result of a natural disaster in Part 2C and 2D asOther Solid Waste.
✔ Report only quantities collected during the reporting period stated above.
8/11/97
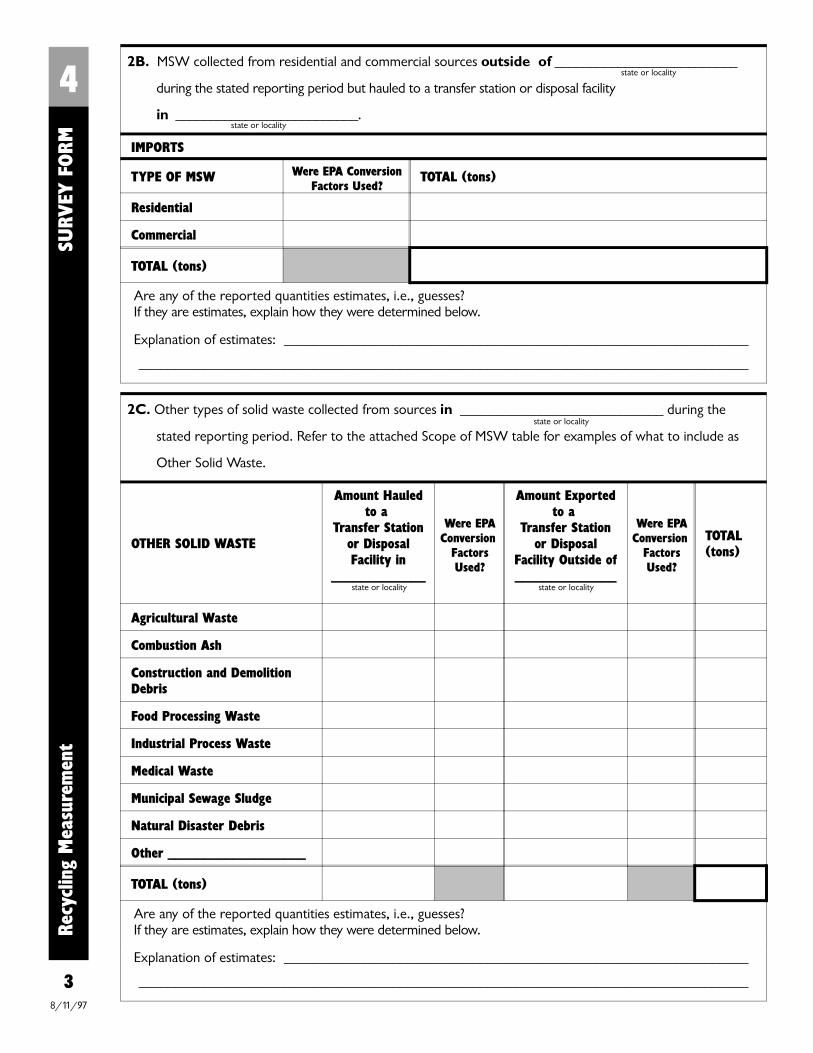
state or locality
state or locality
state or locality state or locality
state or locality
Recy
clin
g M
easu
rem
ent
SU
RVEY
FO
RM
4
3
2B. MSW collected from residential and commercial sources outside of __________________________
during the stated reporting period but hauled to a transfer station or disposal facility
in __________________________.
IMPORTS
TYPE OF MSW Were EPA ConversionFactors Used?
TOTAL (tons)
Residential
Commercial
TOTAL (tons)
Are any of the reported quantities estimates, i.e., guesses? If they are estimates, explain how they were determined below.
Explanation of estimates: ________________________________________________________________
____________________________________________________________________________________
2C. Other types of solid waste collected from sources in ____________________________ during the
stated reporting period. Refer to the attached Scope of MSW table for examples of what to include as
Other Solid Waste.
OTHER SOLID WASTE
Amount Hauledto a
Transfer Stationor DisposalFacility in
_____________
Were EPAConversion
FactorsUsed?
Amount Exportedto a
Transfer Stationor Disposal
Facility Outside of______________
Were EPAConversion
FactorsUsed?
TOTAL(tons)
Agricultural Waste
Combustion Ash
Construction and DemolitionDebris
Food Processing Waste
Industrial Process Waste
Medical Waste
Municipal Sewage Sludge
Natural Disaster Debris
Other ___________________
TOTAL (tons)
Are any of the reported quantities estimates, i.e., guesses? If they are estimates, explain how they were determined below.
Explanation of estimates: ________________________________________________________________
____________________________________________________________________________________
8/11/97
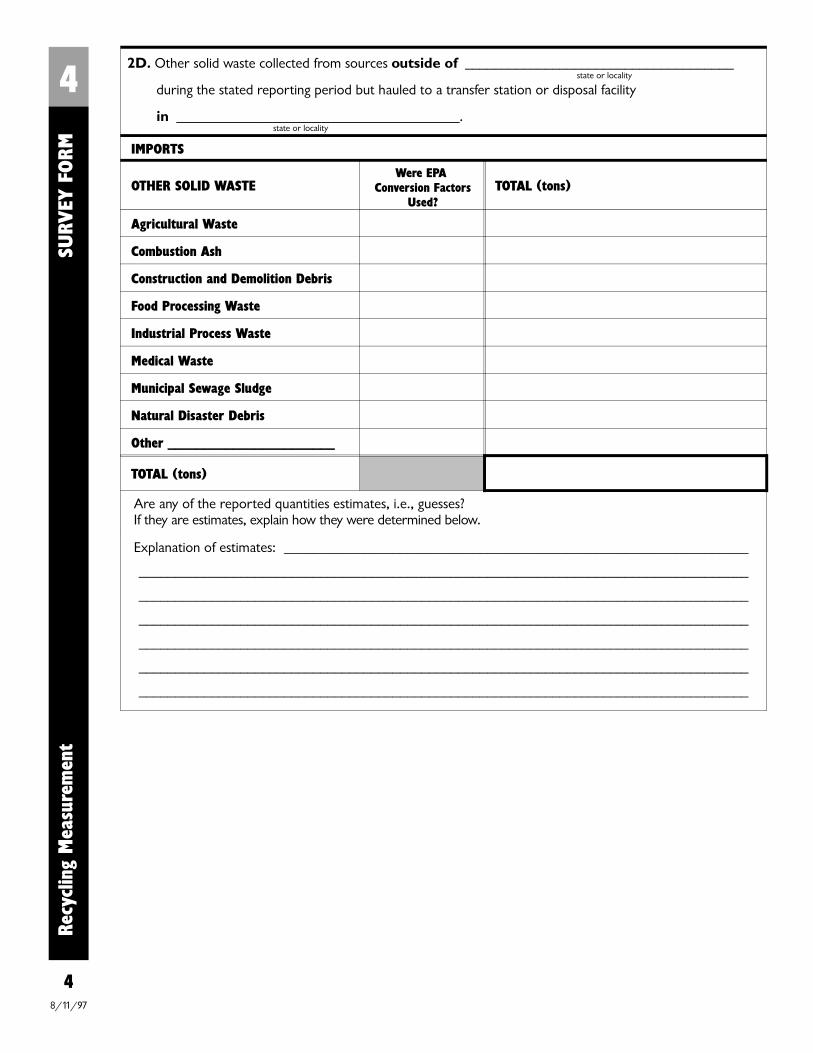
state or locality
state or locality
Recy
clin
g M
easu
rem
ent
SU
RVEY
FORM
4
4
2D. Other solid waste collected from sources outside of _____________________________________
during the stated reporting period but hauled to a transfer station or disposal facility
in _______________________________________.
IMPORTS
OTHER SOLID WASTEWere EPA
Conversion FactorsUsed?
TOTAL (tons)
Agricultural Waste
Combustion Ash
Construction and Demolition Debris
Food Processing Waste
Industrial Process Waste
Medical Waste
Municipal Sewage Sludge
Natural Disaster Debris
Other _______________________
TOTAL (tons)
Are any of the reported quantities estimates, i.e., guesses? If they are estimates, explain how they were determined below.
Explanation of estimates: ________________________________________________________________
____________________________________________________________________________________
____________________________________________________________________________________
____________________________________________________________________________________
____________________________________________________________________________________
____________________________________________________________________________________
____________________________________________________________________________________
8/11/97
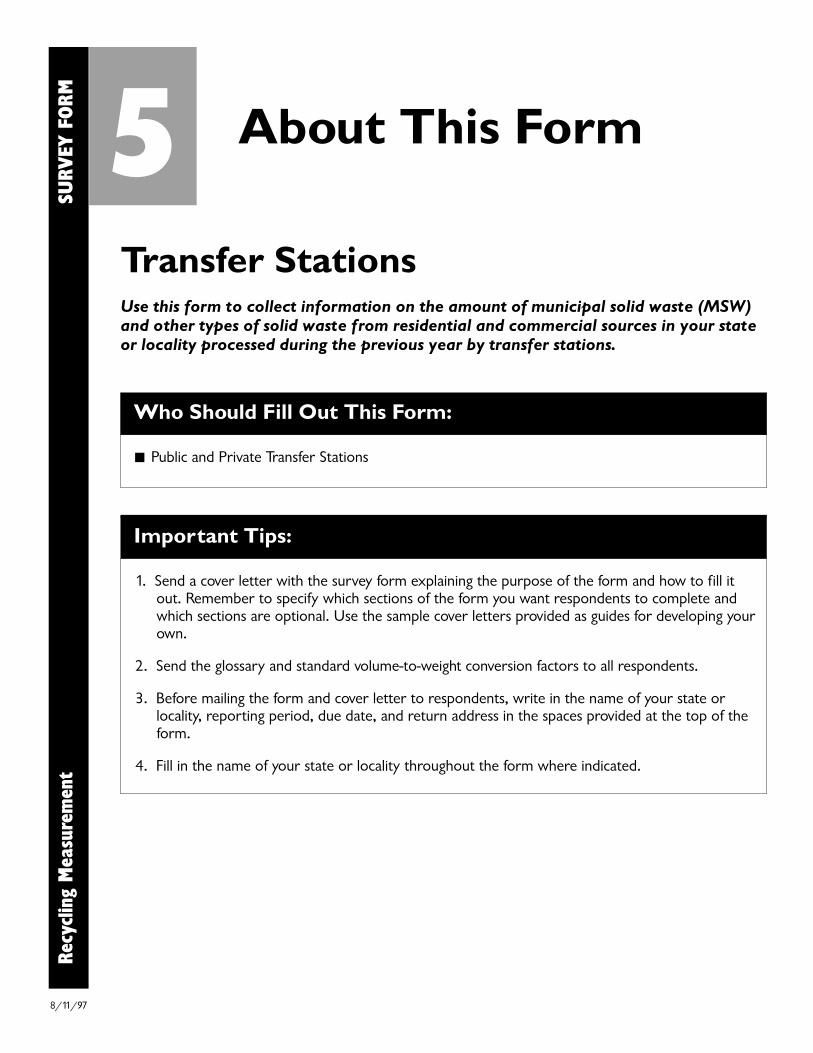
Transfer StationsUse this form to collect information on the amount of municipal solid waste (MSW)and other types of solid waste from residential and commercial sources in your stateor locality processed during the previous year by transfer stations.
5
Who Should Fill Out This Form:
Public and Private Transfer Stations
Important Tips:
1. Send a cover letter with the survey form explaining the purpose of the form and how to fill itout. Remember to specify which sections of the form you want respondents to complete andwhich sections are optional. Use the sample cover letters provided as guides for developing yourown.
2. Send the glossary and standard volume-to-weight conversion factors to all respondents.
3. Before mailing the form and cover letter to respondents, write in the name of your state orlocality, reporting period, due date, and return address in the spaces provided at the top of theform.
4. Fill in the name of your state or locality throughout the form where indicated.
About This Form
Recy
clin
g M
easu
rem
ent
S
URV
EY F
ORM
8/11/97
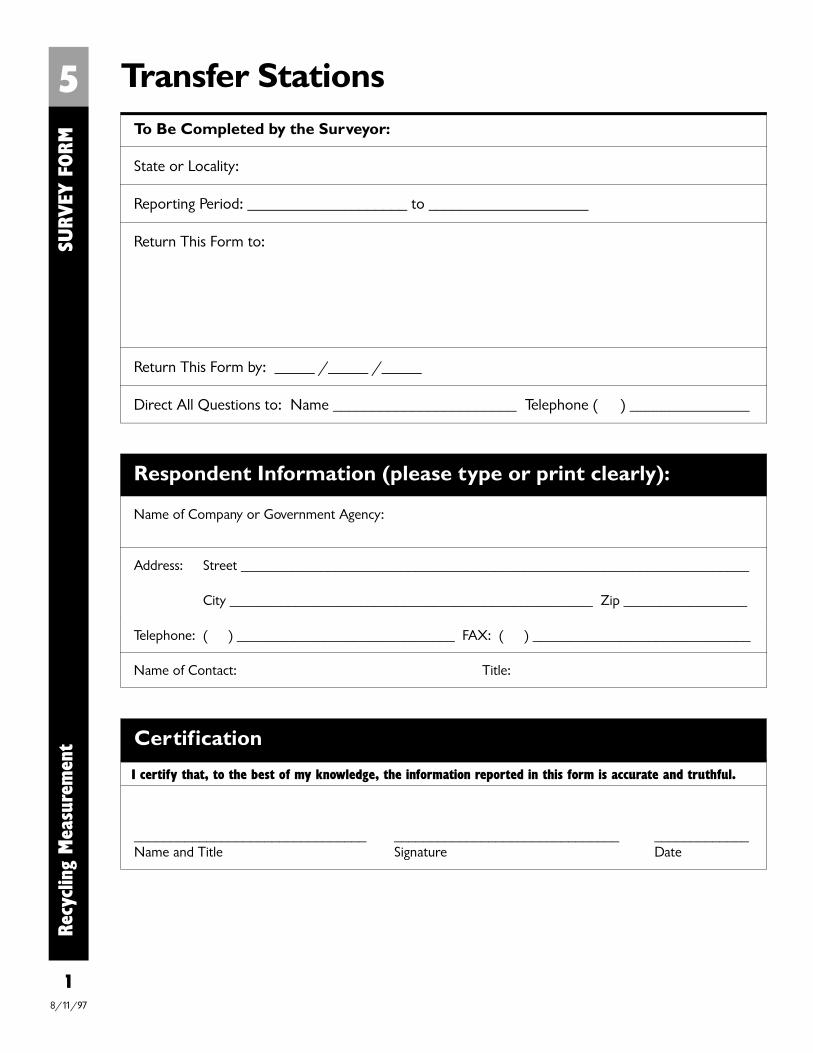
Transfer StationsTo Be Completed by the Surveyor:
State or Locality:
Reporting Period: ____________________ to ____________________
Return This Form to:
Return This Form by: _____ /_____ /_____
Direct All Questions to: Name _______________________ Telephone ( ) _______________
Recy
clin
g M
easu
rem
ent
SU
RVEY
FORM
Respondent Information (please type or print clearly):
Name of Company or Government Agency:
Address: Street ______________________________________________________________________
City __________________________________________________ Zip _________________
Telephone: ( ) ______________________________ FAX: ( ) ______________________________
Name of Contact: Title:
5
1
Certification
I certify that, to the best of my knowledge, the information reported in this form is accurate and truthful.
________________________________Name and Title
_______________________________Signature
_____________Date
8/11/97
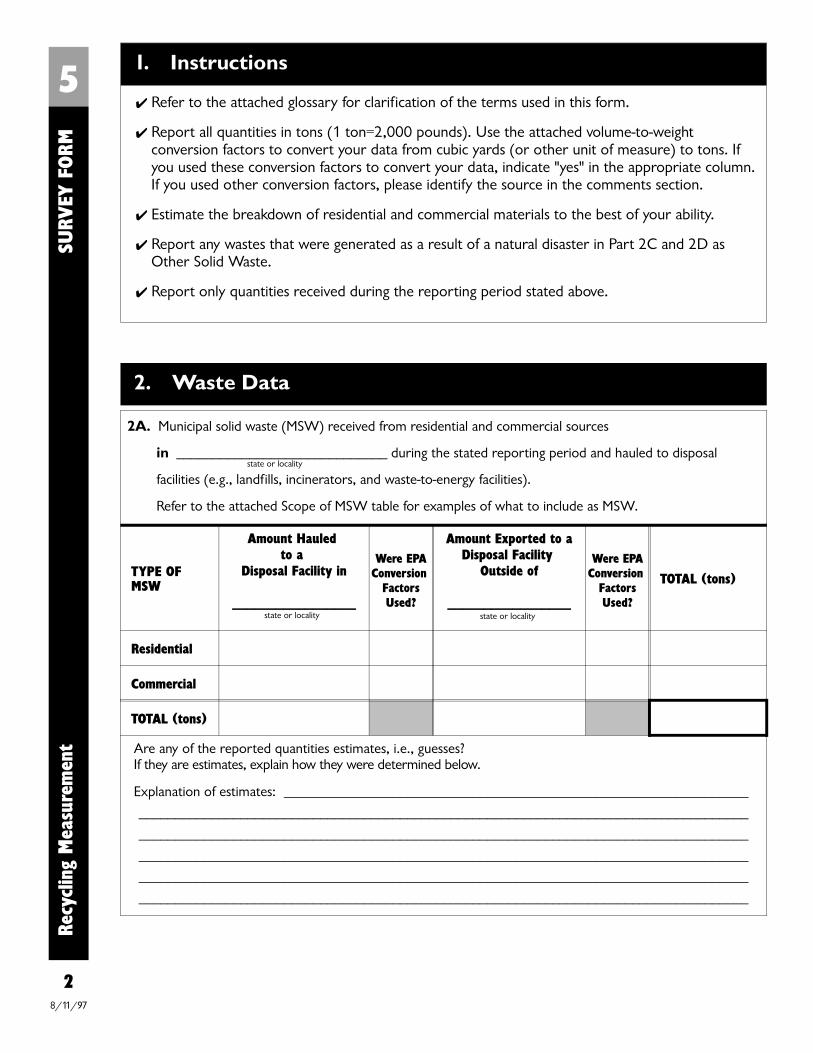
state or locality
state or locality state or locality
Recy
clin
g M
easu
rem
ent
SU
RVEY
FORM
5
2
1. Instructions
✔ Refer to the attached glossary for clarification of the terms used in this form.
✔ Report all quantities in tons (1 ton=2,000 pounds). Use the attached volume-to-weightconversion factors to convert your data from cubic yards (or other unit of measure) to tons. Ifyou used these conversion factors to convert your data, indicate "yes" in the appropriate column.If you used other conversion factors, please identify the source in the comments section.
✔ Estimate the breakdown of residential and commercial materials to the best of your ability.
✔ Report any wastes that were generated as a result of a natural disaster in Part 2C and 2D as Other Solid Waste.
✔ Report only quantities received during the reporting period stated above.
2. Waste Data
2A. Municipal solid waste (MSW) received from residential and commercial sources
in _____________________________ during the stated reporting period and hauled to disposal
facilities (e.g., landfills, incinerators, and waste-to-energy facilities).
Refer to the attached Scope of MSW table for examples of what to include as MSW.
TYPE OF MSW
Amount Hauled to a
Disposal Facility in
_________________
Were EPAConversion
FactorsUsed?
Amount Exported to aDisposal Facility
Outside of
_________________
Were EPAConversion
FactorsUsed?
TOTAL (tons)
Residential
Commercial
TOTAL (tons)
Are any of the reported quantities estimates, i.e., guesses? If they are estimates, explain how they were determined below.
Explanation of estimates: ________________________________________________________________
____________________________________________________________________________________
____________________________________________________________________________________
____________________________________________________________________________________
____________________________________________________________________________________
____________________________________________________________________________________
8/11/97
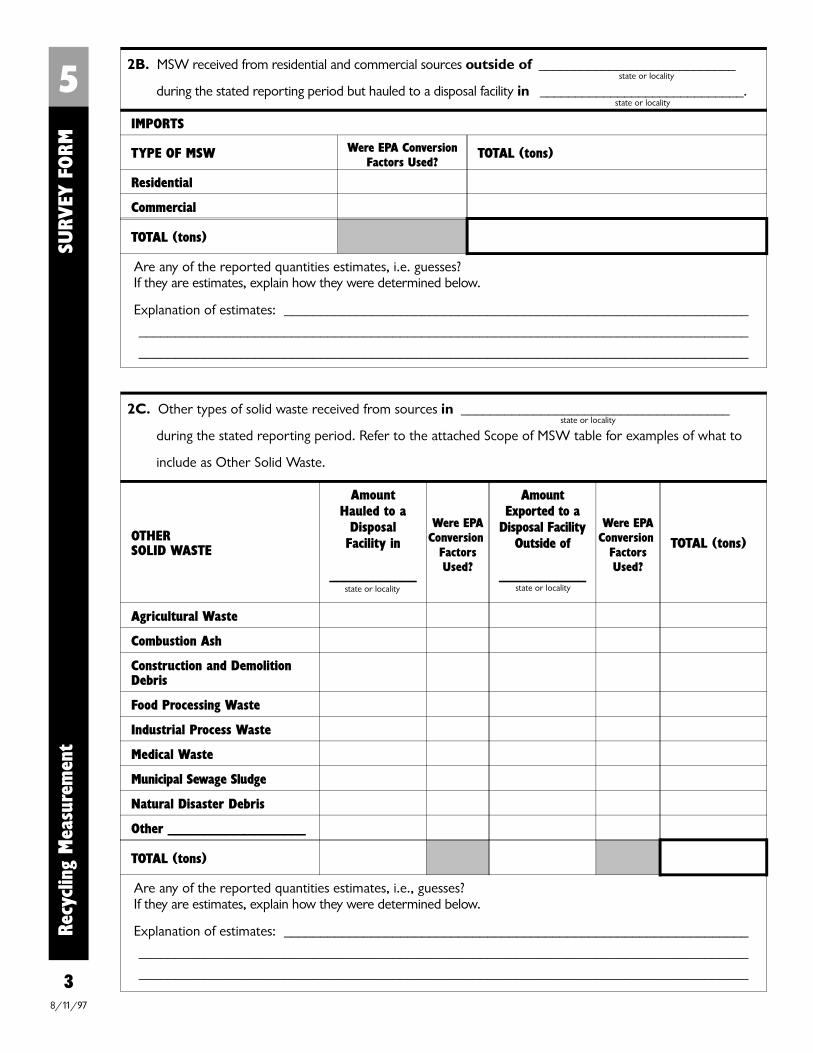
state or locality
state or locality
state or locality
state or locality state or locality
Recy
clin
g M
easu
rem
ent
SU
RVEY
FORM
5
3
2B. MSW received from residential and commercial sources outside of ____________________________
during the stated reporting period but hauled to a disposal facility in _____________________________.
IMPORTS
TYPE OF MSW Were EPA ConversionFactors Used?
TOTAL (tons)
Residential
Commercial
TOTAL (tons)
Are any of the reported quantities estimates, i.e. guesses? If they are estimates, explain how they were determined below.
Explanation of estimates: ________________________________________________________________
____________________________________________________________________________________
____________________________________________________________________________________
2C. Other types of solid waste received from sources in _____________________________________
during the stated reporting period. Refer to the attached Scope of MSW table for examples of what to
include as Other Solid Waste.
OTHER SOLID WASTE
AmountHauled to a
DisposalFacility in
____________
Were EPAConversion
FactorsUsed?
AmountExported to a
Disposal FacilityOutside of
____________
Were EPAConversion
FactorsUsed?
TOTAL (tons)
Agricultural Waste
Combustion Ash
Construction and DemolitionDebris
Food Processing Waste
Industrial Process Waste
Medical Waste
Municipal Sewage Sludge
Natural Disaster Debris
Other ___________________
TOTAL (tons)
Are any of the reported quantities estimates, i.e., guesses? If they are estimates, explain how they were determined below.
Explanation of estimates: ________________________________________________________________
____________________________________________________________________________________
____________________________________________________________________________________
8/11/97
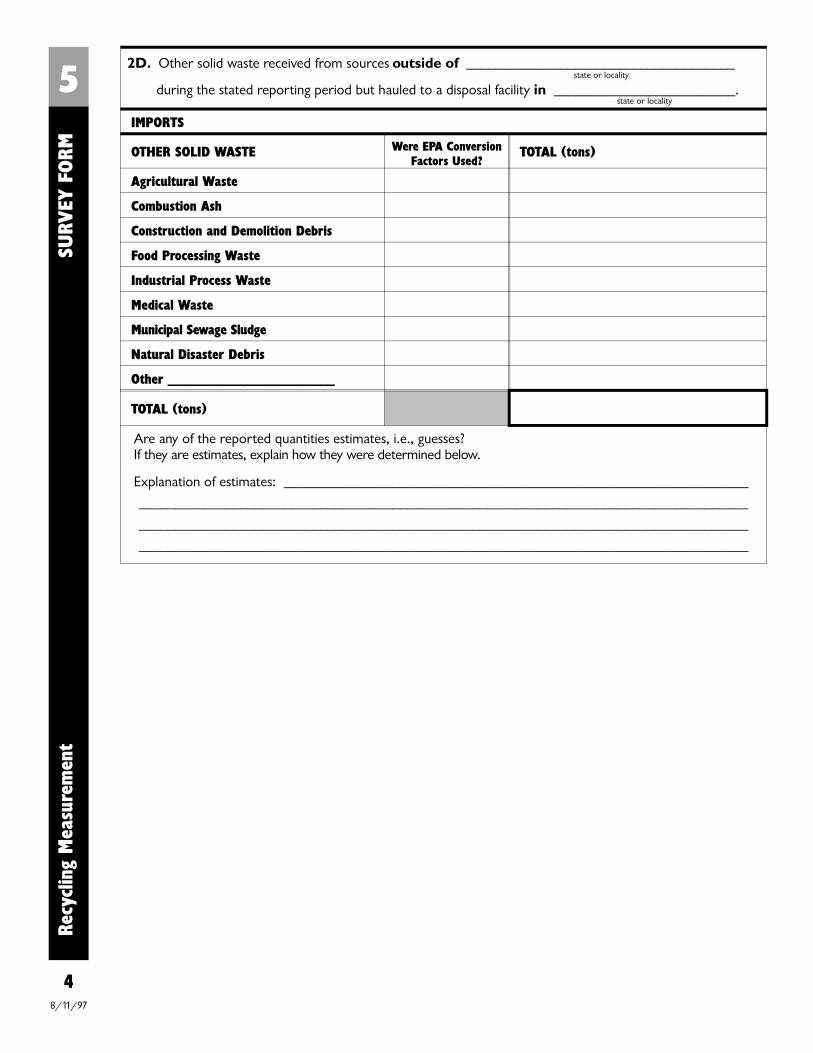
state or locality
state or locality
Recy
clin
g M
easu
rem
ent
SU
RVEY
FORM
5
4
2D. Other solid waste received from sources outside of _____________________________________
during the stated reporting period but hauled to a disposal facility in _________________________.
IMPORTS
OTHER SOLID WASTE Were EPA ConversionFactors Used?
TOTAL (tons)
Agricultural Waste
Combustion Ash
Construction and Demolition Debris
Food Processing Waste
Industrial Process Waste
Medical Waste
Municipal Sewage Sludge
Natural Disaster Debris
Other _______________________
TOTAL (tons)
Are any of the reported quantities estimates, i.e., guesses? If they are estimates, explain how they were determined below.
Explanation of estimates: ________________________________________________________________
____________________________________________________________________________________
____________________________________________________________________________________
____________________________________________________________________________________
8/11/97
Waste Disposal FacilitiesUse this form to collect information on the amount of municipal solid waste (MSW)and other types of solid waste from residential and commercial sources in your stateor locality accepted during the previous year by disposal facilities.
Who Should Fill Out This Form:
Public and Private Landfills
Public and Private Incinerators
Public and Private Waste-to-Energy Facilities
Important Tips:
1. Send a cover letter with the survey form explaining the purpose of the form and how to fill itout. Remember to specify which sections of the form you want respondents to complete andwhich sections are optional. Use the sample cover letters provided as guides for developing yourown.
2. Send the glossary and standard volume-to-weight conversion factors to all respondents.
3. Before mailing the form and cover letter to respondents, write in the name of your state orlocality, reporting period, due date, and return address in the spaces provided at the top of theform.
4. Fill in the name of your state or locality throughout the form where indicated.
6 About This Form
Recy
clin
g M
easu
rem
ent
SU
RVEY
FORM
8/11/97
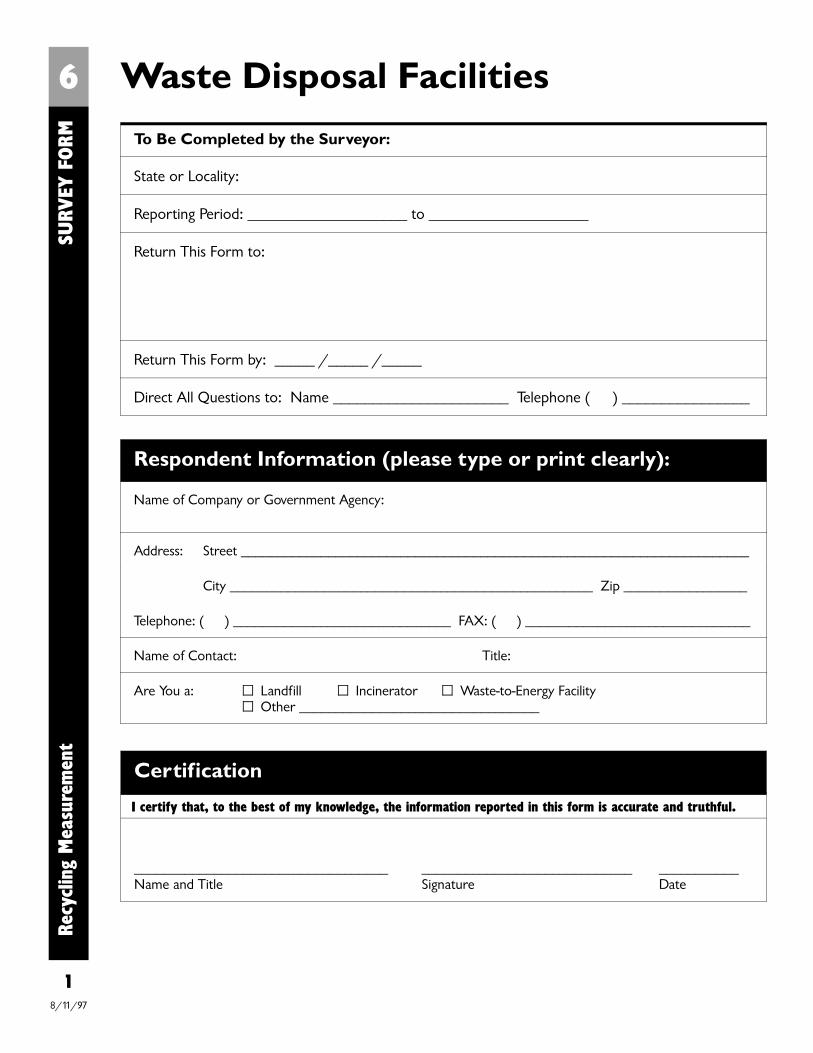
Waste Disposal Facilities
To Be Completed by the Surveyor:
State or Locality:
Reporting Period: ____________________ to ____________________
Return This Form to:
Return This Form by: _____ /_____ /_____
Direct All Questions to: Name ______________________ Telephone ( ) ________________
Recy
clin
g M
easu
rem
ent
S
URV
EY F
ORM
6
Respondent Information (please type or print clearly):
Name of Company or Government Agency:
Address: Street ______________________________________________________________________
City __________________________________________________ Zip _________________
Telephone: ( ) ______________________________ FAX: ( ) _______________________________
Name of Contact: Title:
Are You a: Landfill Incinerator Waste-to-Energy Facility Other _________________________________
1
Certification
I certify that, to the best of my knowledge, the information reported in this form is accurate and truthful.
___________________________________Name and Title
_____________________________Signature
___________Date
8/11/97
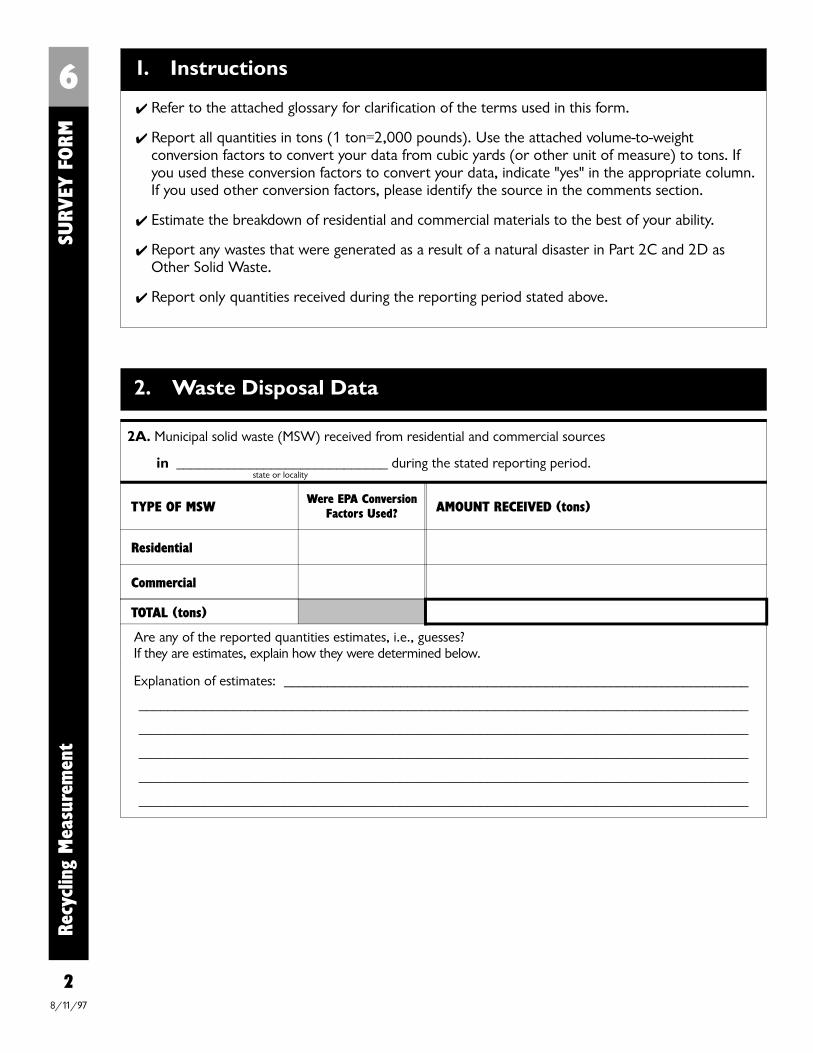
state or locality
6Re
cycl
ing
Mea
sure
men
t
S
URV
EY F
ORM
2
1. Instructions
✔ Refer to the attached glossary for clarification of the terms used in this form.
✔ Report all quantities in tons (1 ton=2,000 pounds). Use the attached volume-to-weightconversion factors to convert your data from cubic yards (or other unit of measure) to tons. Ifyou used these conversion factors to convert your data, indicate "yes" in the appropriate column.If you used other conversion factors, please identify the source in the comments section.
✔ Estimate the breakdown of residential and commercial materials to the best of your ability.
✔ Report any wastes that were generated as a result of a natural disaster in Part 2C and 2D asOther Solid Waste.
✔ Report only quantities received during the reporting period stated above.
2. Waste Disposal Data
2A. Municipal solid waste (MSW) received from residential and commercial sources
in _____________________________ during the stated reporting period.
TYPE OF MSWWere EPA Conversion
Factors Used? AMOUNT RECEIVED (tons)
Residential
Commercial
TOTAL (tons)
Are any of the reported quantities estimates, i.e., guesses? If they are estimates, explain how they were determined below.
Explanation of estimates: ________________________________________________________________
____________________________________________________________________________________
____________________________________________________________________________________
____________________________________________________________________________________
____________________________________________________________________________________
____________________________________________________________________________________
8/11/97
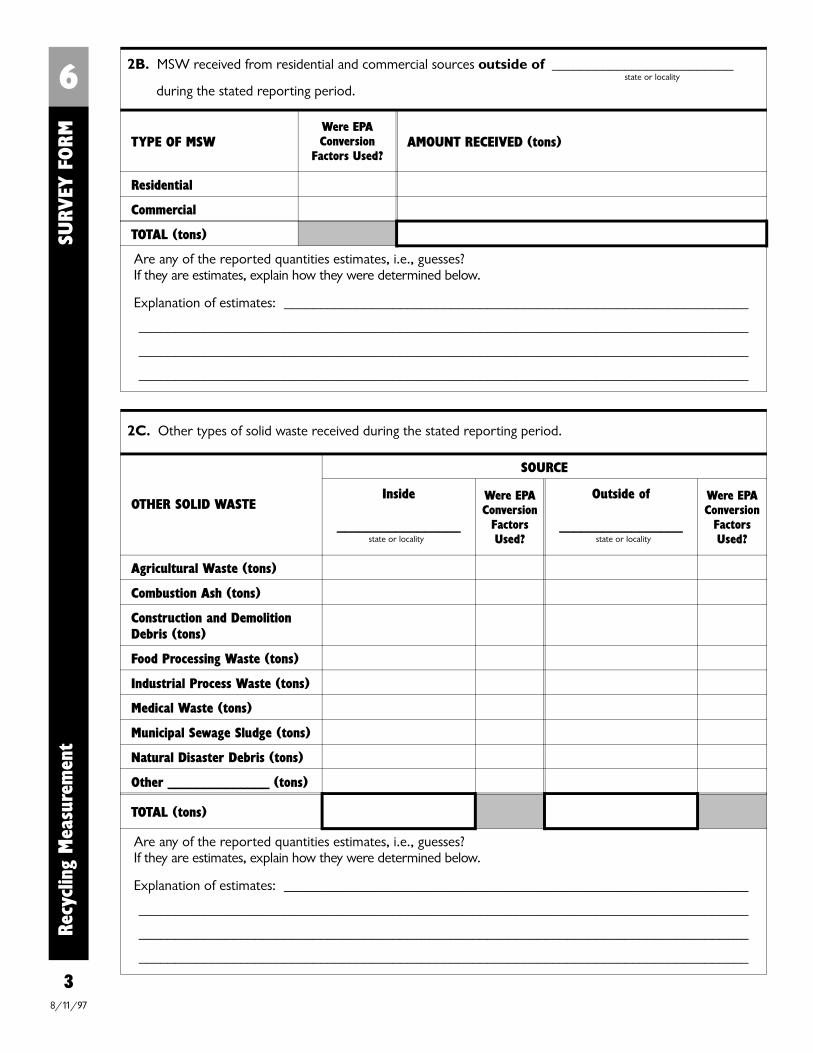
state or locality
state or locality state or locality
6Re
cycl
ing
Mea
sure
men
t
S
URV
EY F
ORM
3
2C. Other types of solid waste received during the stated reporting period.
OTHER SOLID WASTE
SOURCE
Inside
_________________
Were EPAConversion
FactorsUsed?
Outside of
_________________
Were EPAConversion
FactorsUsed?
Agricultural Waste (tons)
Combustion Ash (tons)
Construction and DemolitionDebris (tons)
Food Processing Waste (tons)
Industrial Process Waste (tons)
Medical Waste (tons)
Municipal Sewage Sludge (tons)
Natural Disaster Debris (tons)
Other ______________ (tons)
TOTAL (tons)
Are any of the reported quantities estimates, i.e., guesses? If they are estimates, explain how they were determined below.
Explanation of estimates: ________________________________________________________________
____________________________________________________________________________________
____________________________________________________________________________________
____________________________________________________________________________________
2B. MSW received from residential and commercial sources outside of _________________________
during the stated reporting period.
TYPE OF MSWWere EPAConversion
Factors Used?AMOUNT RECEIVED (tons)
Residential
Commercial
TOTAL (tons)
Are any of the reported quantities estimates, i.e., guesses? If they are estimates, explain how they were determined below.
Explanation of estimates: ________________________________________________________________
____________________________________________________________________________________
____________________________________________________________________________________
____________________________________________________________________________________
8/11/97
107Recycling Rate Worksheets
AP
PE
ND
IX
DIntroduction tothe Worksheets
Worksheet AUse this worksheet if you have
already calculated a recycling ratefor your state or locality and sim-ply want to calculate a revisedrecycling rate based on the stan-dard equation. Worksheet A helpsyou translate your current data onrecycling and disposal so that thedata match the standard defini-tions of municipal solid waste(MSW) and recycling outlined inthis guide.
Worksheets B1,B2, and B3
These three worksheets areintended both for those states andlocalities that are measuring recy-cling for the first time and want touse the standard methodology out-lined in this guide and for thosethat wish to redesign their currentrecycling measurement systemaccording to the standard method-ology. These worksheets allow youto compile data reported on thesurvey forms and calculate anMSW recycling rate.
Worksheet B1 is used to aggre-gate data on MSW recycling, asreported by respondents on SurveyForms 1, 2, and 3. The worksheetallows you to determine the totalamount of MSW recycled in yourjurisdiction during the currentmeasurement year, which is thenumerator of the standard recy-cling rate equation.
Worksheet B2 is used to aggre-gate data on MSW disposal, asreported by respondents on SurveyForms 4, 5, and 6. The worksheetallows you to determine the totalamount of MSW disposed of inyour jurisdiction during the cur-rent measurement year, whichwhen added to the total amount ofMSW recycled (from WorksheetB1) is the total amount of MSWgenerated, or the denominator ofthe standard recycling rate equa-tion. Worksheet B2 also can beused to estimate the total amountof MSW generated if actual dispos-al data are not available or reliable.
Worksheet B3This worksheet is used to com-
bine the totals obtained inWorksheets B1 and B2 to calculatea standard recycling rate.
Recycling Rate Worksheets
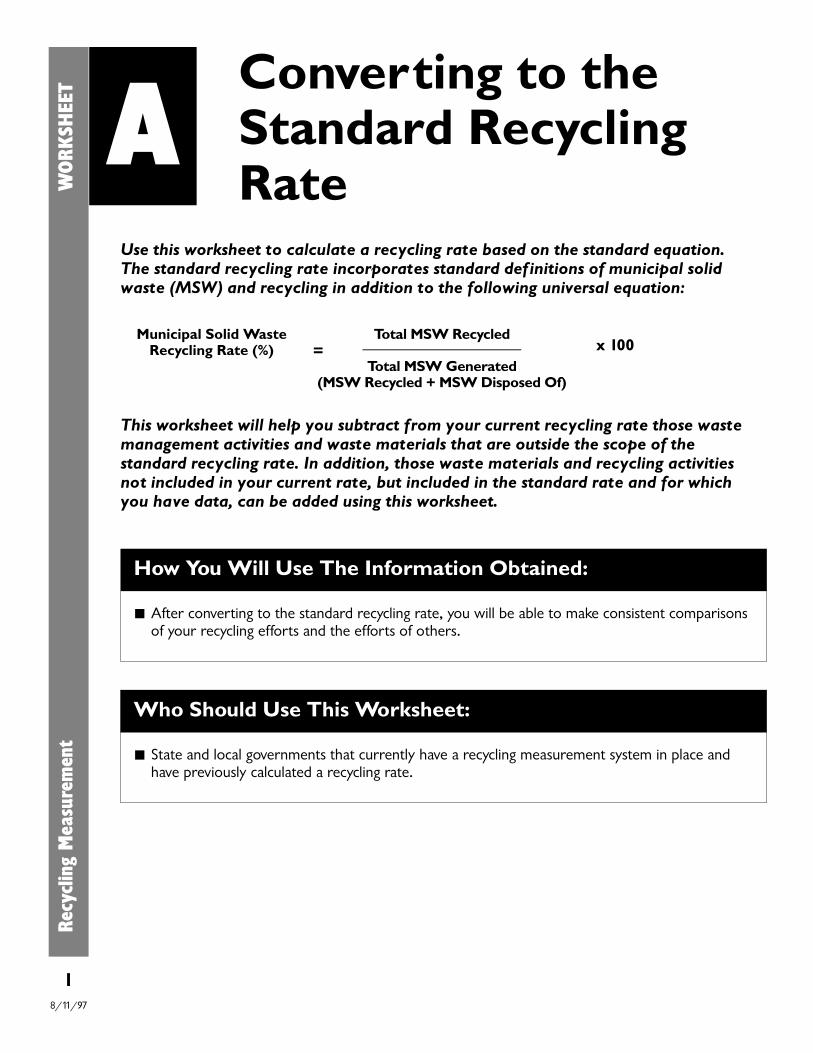
Use this worksheet to calculate a recycling rate based on the standard equation. The standard recycling rate incorporates standard definitions of municipal solidwaste (MSW) and recycling in addition to the following universal equation:
Municipal Solid WasteRecycling Rate (%)
Total MSW Recycled
Total MSW Generated(MSW Recycled + MSW Disposed Of)
x 100
This worksheet will help you subtract from your current recycling rate those wastemanagement activities and waste materials that are outside the scope of thestandard recycling rate. In addition, those waste materials and recycling activitiesnot included in your current rate, but included in the standard rate and for whichyou have data, can be added using this worksheet.
A
How You Will Use The Information Obtained:
After converting to the standard recycling rate, you will be able to make consistent comparisonsof your recycling efforts and the efforts of others.
Who Should Use This Worksheet:
State and local governments that currently have a recycling measurement system in place andhave previously calculated a recycling rate.
Recy
clin
g M
easu
rem
ent
W
ORKSH
EET Converting to the
Standard RecyclingRate
=
18/11/97

What You Will Need:
A list of the types of solid waste and recyclables included in your current recycling rate.
Your definitions of the following terms:
Municipal Solid Waste
Recyclable materials (e.g., yard trimmings, tires, ferrous metal)
Recycling
Standard definitions of the above terms from the Glossary (found on page 49 of the Guide).
Scope of Materials Included in the Standard MSW Recycling Rate table (Table A, found on page 11 of the Guide).
Scope of Activities Included in the Standard MSW Recycling Rate table (Table B, found on page 13 of the Guide).
Important Tips:
✔ In order to be consistent with the standard recycling rate, only solid waste defined as municipalsolid waste in the attached Scope of MSW table can be included when calculating the amount ofwaste disposed of and recycled.
✔ Only MSW recycled according to the waste management activities outlined in the attached Scope of MSW Recycling table can be included when calculating the amount of waste recycled.
ARe
cycl
ing
Mea
sure
men
t
WORK
SHEE
T
28/11/97
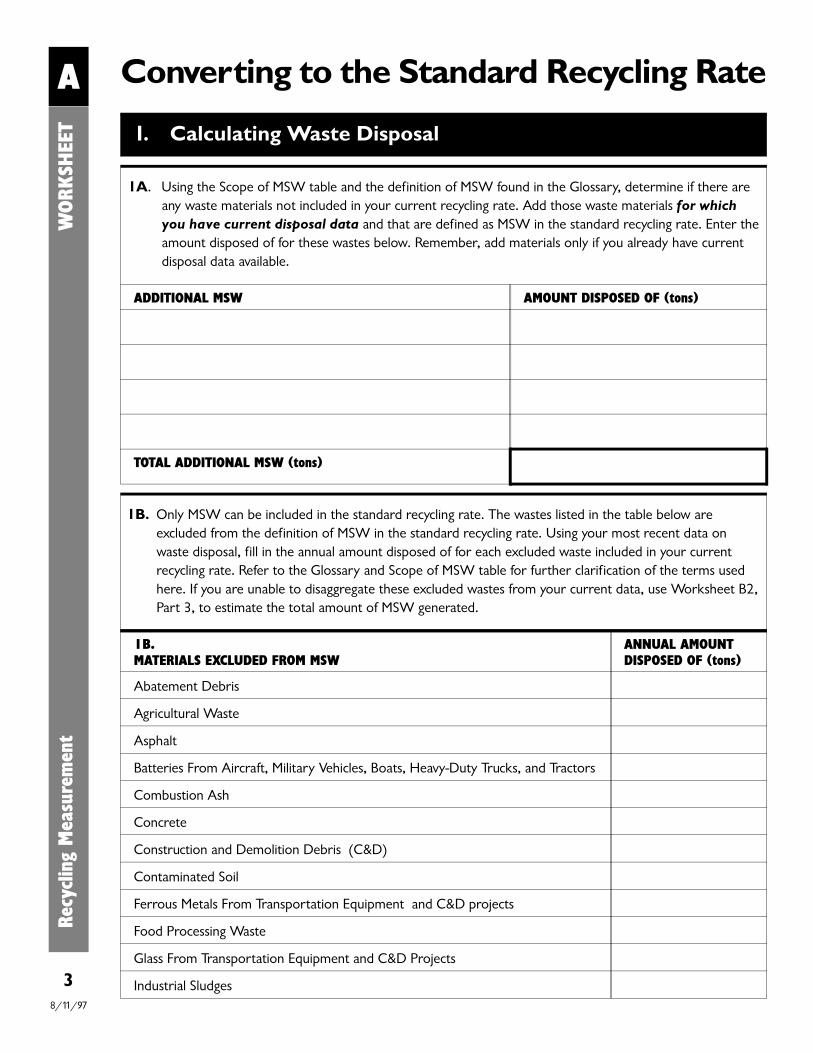
A Converting to the Standard Recycling RateRe
cycl
ing
Mea
sure
men
t
WORK
SHEE
T
3
1. Calculating Waste Disposal
1A. Using the Scope of MSW table and the definition of MSW found in the Glossary, determine if there areany waste materials not included in your current recycling rate. Add those waste materials for whichyou have current disposal data and that are defined as MSW in the standard recycling rate. Enter theamount disposed of for these wastes below. Remember, add materials only if you already have currentdisposal data available.
ADDITIONAL MSW AMOUNT DISPOSED OF (tons)
TOTAL ADDITIONAL MSW (tons)
1B.MATERIALS EXCLUDED FROM MSW
ANNUAL AMOUNT DISPOSED OF (tons)
Abatement Debris
Agricultural Waste
Asphalt
Batteries From Aircraft, Military Vehicles, Boats, Heavy-Duty Trucks, and Tractors
Combustion Ash
Concrete
Construction and Demolition Debris (C&D)
Contaminated Soil
Ferrous Metals From Transportation Equipment and C&D projects
Food Processing Waste
Glass From Transportation Equipment and C&D Projects
Industrial Sludges
1B. Only MSW can be included in the standard recycling rate. The wastes listed in the table below areexcluded from the definition of MSW in the standard recycling rate. Using your most recent data onwaste disposal, fill in the annual amount disposed of for each excluded waste included in your currentrecycling rate. Refer to the Glossary and Scope of MSW table for further clarification of the terms usedhere. If you are unable to disaggregate these excluded wastes from your current data, use Worksheet B2,Part 3, to estimate the total amount of MSW generated.
8/11/97
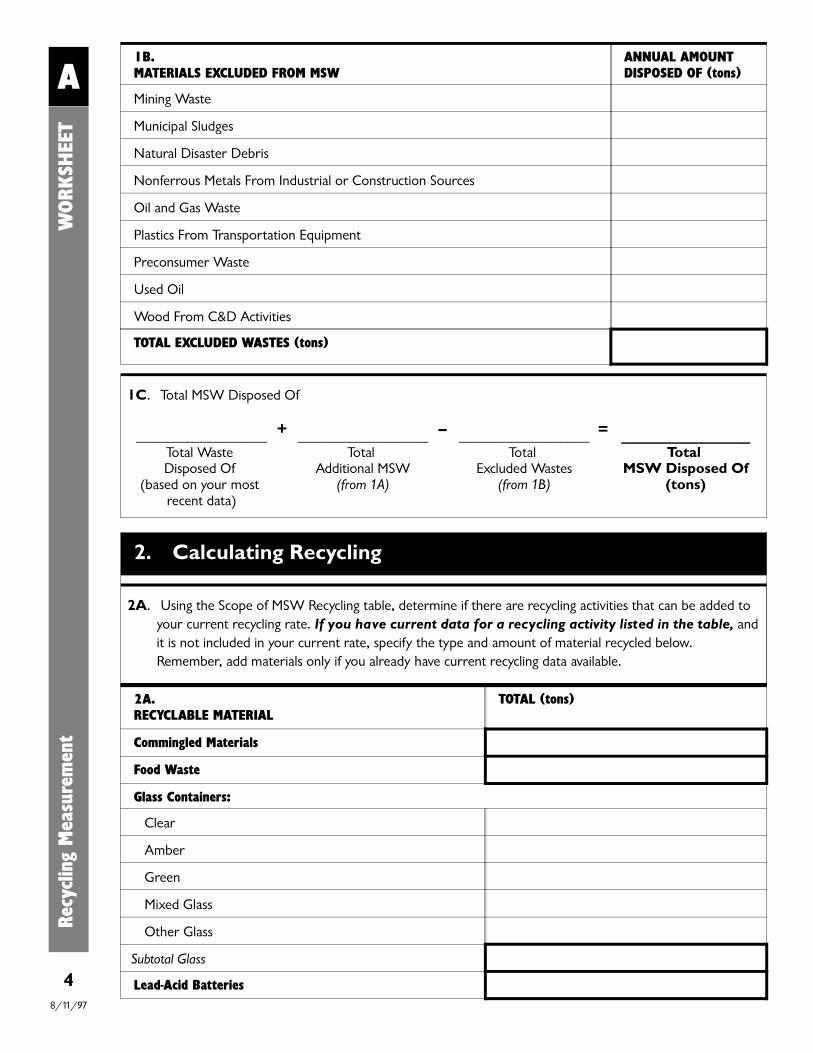
1B.MATERIALS EXCLUDED FROM MSW
ANNUAL AMOUNT DISPOSED OF (tons)
Mining Waste
Municipal Sludges
Natural Disaster Debris
Nonferrous Metals From Industrial or Construction Sources
Oil and Gas Waste
Plastics From Transportation Equipment
Preconsumer Waste
Used Oil
Wood From C&D Activities
TOTAL EXCLUDED WASTES (tons)
1C. Total MSW Disposed Of
__________________Total Waste Disposed Of
(based on your most recent data)
__________________Total
Additional MSW(from 1A)
__________________Total
Excluded Wastes(from 1B)
________________Total
MSW Disposed Of(tons)
=–+
ARe
cycl
ing
Mea
sure
men
t
WORK
SHEE
T
4
2A.RECYCLABLE MATERIAL
TOTAL (tons)
Commingled Materials
Food Waste
Glass Containers:
Clear
Amber
Green
Mixed Glass
Other Glass
Subtotal Glass
Lead-Acid Batteries
2. Calculating Recycling
2A. Using the Scope of MSW Recycling table, determine if there are recycling activities that can be added toyour current recycling rate. If you have current data for a recycling activity listed in the table, andit is not included in your current rate, specify the type and amount of material recycled below.Remember, add materials only if you already have current recycling data available.
8/11/97

2A.RECYCLABLE MATERIAL
TOTAL (tons)
Metals:
Aluminum Cans
Tin/Steel Cans
Major Appliances
Other Ferrous
Other Nonferrous
Mixed Metals
Subtotal Metals
Paper:
Old Magazines
Old Newspaper
Old Corrugated Containers
Office Papers
Telephone Directories
Mixed Paper
Other Paper
Subtotal Paper
Plastic:
PETE
HDPE
PVC
LDPE
PP
PS
Mixed Plastic
Other Plastic
Subtotal Plastic
Textiles
Tires
Wood:
Wood Packaging
Other Wood
Subtotal Wood
ARe
cycl
ing
Mea
sure
men
t
WORK
SHEE
T
58/11/97
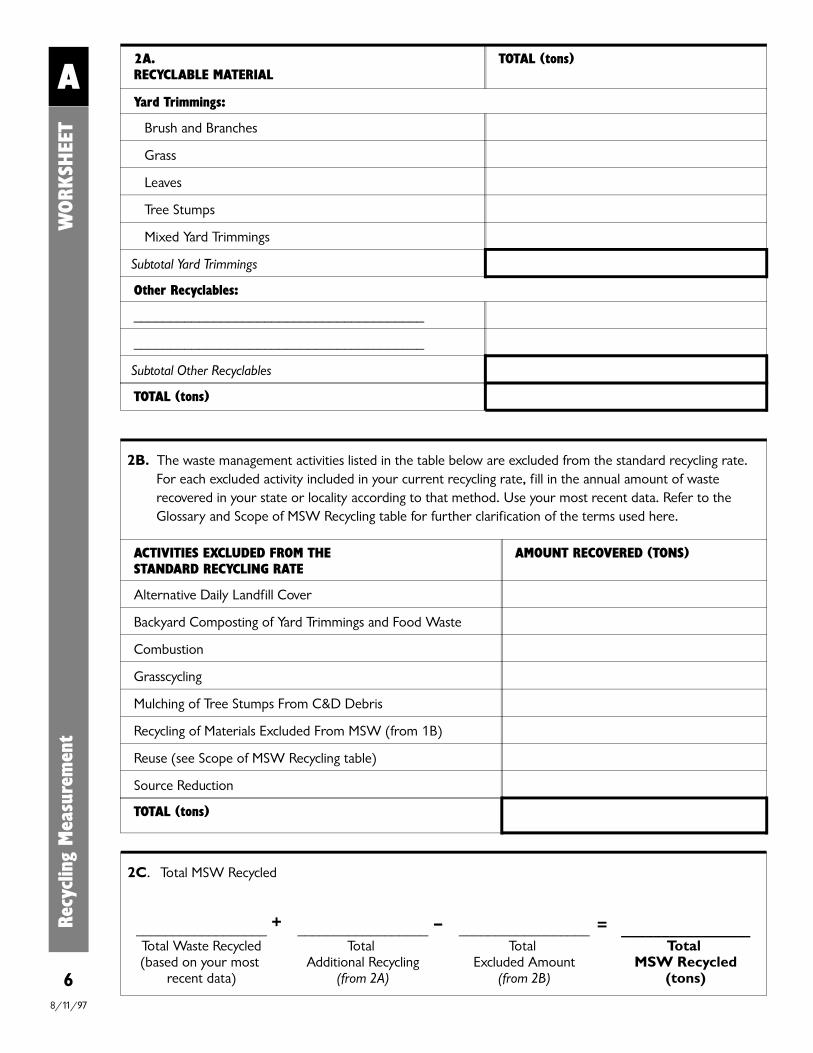
2B. The waste management activities listed in the table below are excluded from the standard recycling rate.For each excluded activity included in your current recycling rate, fill in the annual amount of wasterecovered in your state or locality according to that method. Use your most recent data. Refer to theGlossary and Scope of MSW Recycling table for further clarification of the terms used here.
ACTIVITIES EXCLUDED FROM THE STANDARD RECYCLING RATE
AMOUNT RECOVERED (TONS)
Alternative Daily Landfill Cover
Backyard Composting of Yard Trimmings and Food Waste
Combustion
Grasscycling
Mulching of Tree Stumps From C&D Debris
Recycling of Materials Excluded From MSW (from 1B)
Reuse (see Scope of MSW Recycling table)
Source Reduction
TOTAL (tons)
2A.RECYCLABLE MATERIAL
TOTAL (tons)
Yard Trimmings:
Brush and Branches
Grass
Leaves
Tree Stumps
Mixed Yard Trimmings
Subtotal Yard Trimmings
Other Recyclables:
________________________________________
________________________________________
Subtotal Other Recyclables
TOTAL (tons)
A
6
Recy
clin
g M
easu
rem
ent
WORK
SHEE
T
2C. Total MSW Recycled
__________________Total Waste Recycled(based on your most
recent data)
__________________Total
Additional Recycling(from 2A)
__________________Total
Excluded Amount(from 2B)
________________Total
MSW Recycled(tons)
=–+
8/11/97
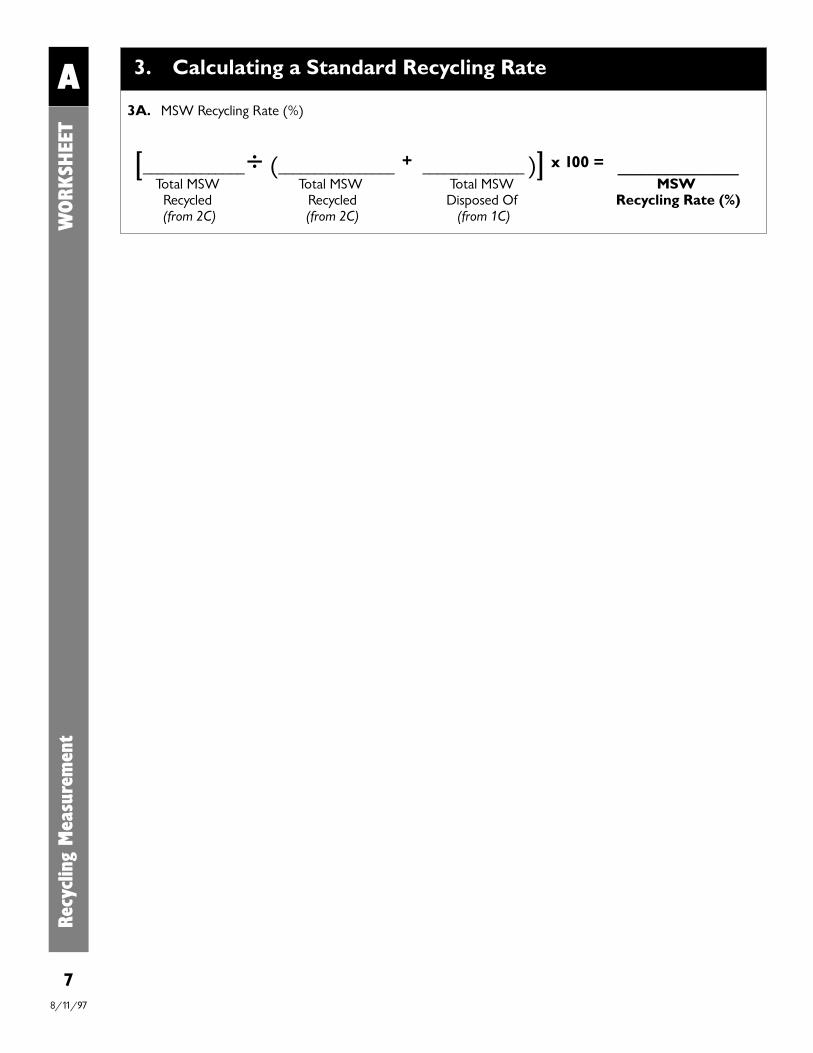
ARe
cycl
ing
Mea
sure
men
t
WORK
SHEE
T
7
3. Calculating a Standard Recycling Rate
3A. MSW Recycling Rate (%)
[______________Total MSW Recycled (from 2C)
(________________Total MSW
Recycled(from 2C)
______________ )]Total MSW Disposed Of
(from 1C)
_______________MSW
Recycling Rate (%)
x 100 =# +
8/11/97
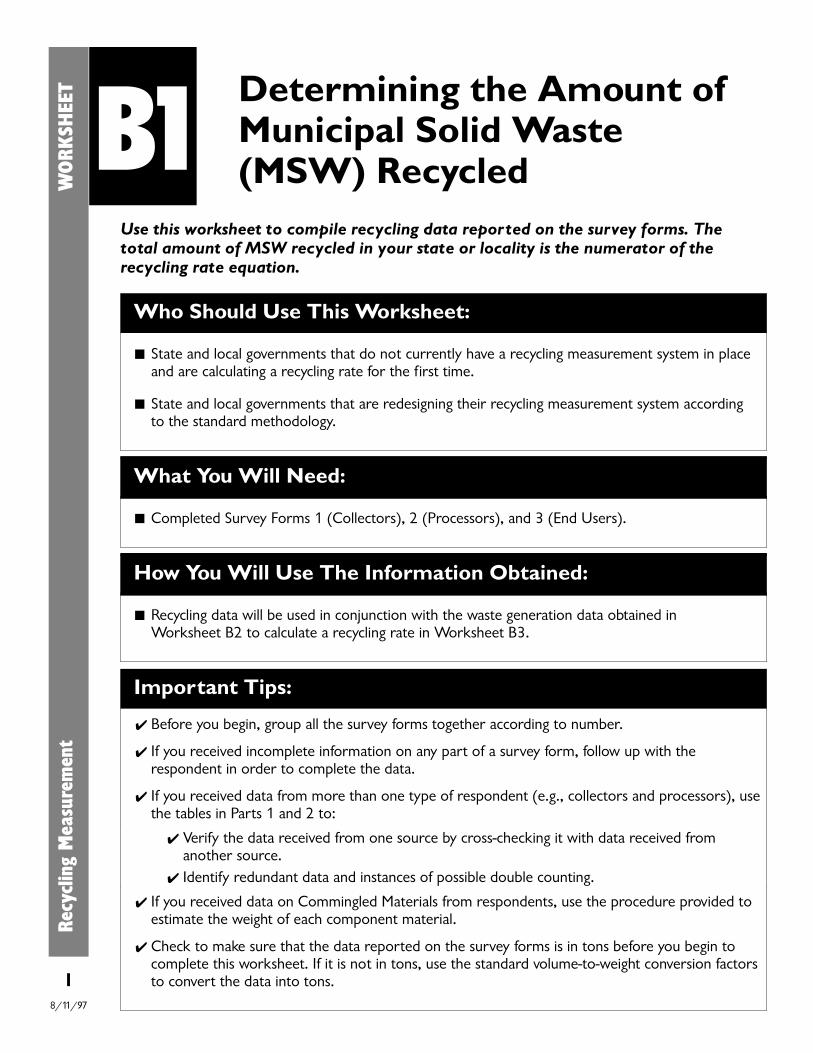
Use this worksheet to compile recycling data reported on the survey forms. Thetotal amount of MSW recycled in your state or locality is the numerator of therecycling rate equation.
B1Who Should Use This Worksheet:
State and local governments that do not currently have a recycling measurement system in placeand are calculating a recycling rate for the first time.
State and local governments that are redesigning their recycling measurement system accordingto the standard methodology.
What You Will Need:
Completed Survey Forms 1 (Collectors), 2 (Processors), and 3 (End Users).
How You Will Use The Information Obtained:
Recycling data will be used in conjunction with the waste generation data obtained in Worksheet B2 to calculate a recycling rate in Worksheet B3.
Important Tips:
✔ Before you begin, group all the survey forms together according to number.
✔ If you received incomplete information on any part of a survey form, follow up with therespondent in order to complete the data.
✔ If you received data from more than one type of respondent (e.g., collectors and processors), usethe tables in Parts 1 and 2 to:
✔ Verify the data received from one source by cross-checking it with data received fromanother source.
✔ Identify redundant data and instances of possible double counting.
✔ If you received data on Commingled Materials from respondents, use the procedure provided toestimate the weight of each component material.
✔ Check to make sure that the data reported on the survey forms is in tons before you begin tocomplete this worksheet. If it is not in tons, use the standard volume-to-weight conversion factorsto convert the data into tons.
Determining the Amount ofMunicipal Solid Waste(MSW) Recycled
Recy
clin
g M
easu
rem
ent
W
ORKSH
EET
18/11/97

Recy
clin
g M
easu
rem
ent
W
ORKSH
EET
B1 1. Residential Recycling Data
1A. For each recyclable material, total the data reported by each collector in the Residential column of Form 1, Part 2A. Do the same for the data reported by processors (Form 2, Part 2A) and then end users(Form 3, Part 2A).
To avoid double counting of data, for those materials where you received data from more than one typeof survey respondent, circle the data that you believe is the most complete and accurate. Draw a linethrough the other data (you will not use it again). For example, if you received data on residential glassrecycling from both collectors and processors, circle the data that you believe is the least likely to result indouble counting. Remember to circle only one survey respondent for each material. If you surveyed onlyone type of respondent, simply fill out the corresponding column below.
2
1A.RECYCLABLE MATERIAL
Survey RespondentTOTAL (tons)Collectors
(tons)Processors(tons)
End Users(tons)
Food Waste
Glass Containers:
Clear
Amber
Green
Mixed Glass
Other GlassSubtotal Glass
Lead-Acid Batteries
Metals:
Aluminum Cans
Tin/Steel Cans
Major Appliances
Other Ferrous
Other Nonferrous
Mixed Metals
Subtotal Metals
Paper:
Old Magazines
Old Newspaper
Old Corrugated Containers
Office Papers
Telephone Directories
Mixed Paper
Other Paper
Subtotal Paper
8/11/97
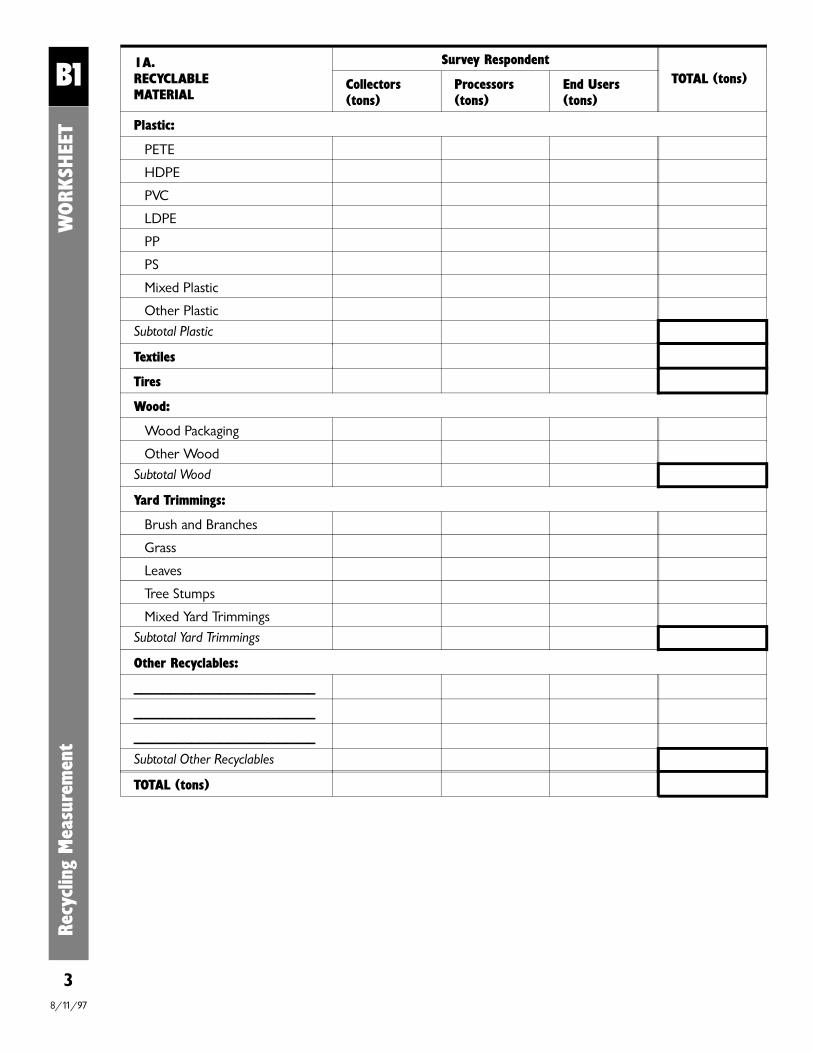
1A.RECYCLABLE MATERIAL
Survey RespondentTOTAL (tons)Collectors
(tons)Processors(tons)
End Users(tons)
Plastic:
PETE
HDPE
PVC
LDPE
PP
PS
Mixed Plastic
Other Plastic
Subtotal Plastic
Textiles
Tires
Wood:
Wood Packaging
Other Wood
Subtotal Wood
Yard Trimmings:
Brush and Branches
Grass
Leaves
Tree Stumps
Mixed Yard Trimmings
Subtotal Yard Trimmings
Other Recyclables:
_________________________
_________________________
_________________________
Subtotal Other Recyclables
TOTAL (tons)
B1
3
Recy
clin
g M
easu
rem
ent
W
ORKSH
EET
8/11/97

1B. If you received data from survey respondents on Commingled Materials for residential programs, use thefollowing method to estimate the weight of each recyclable material that makes up the commingledcategory. Tons for each material should be entered separately into the corresponding category in the tablein Part 1A. You will need to complete this exercise for each different type of commingled mix reported onthe survey forms.
Step 1: Based on the comments received on the survey forms, list the individual recyclable materials that make upCommingled Materials in Column 1 of the blank table titled Actual Data.
B. Step 2: Using the national recovery data in the reference table below as default data, estimate the percentage ofeach material in the commingled mix, and then enter the percentages in Column 2 of the blank table. Forexample, if your mix consists of aluminum cans and steel cans, you would have a total of 2,670 tons ofmaterials (1,120 + 1,550) according to the reference table. This is equal to a mix consisting of 42%aluminum cans and 58% steel cans by weight. To arrive at these percentages, divide the tons of eachmaterial by the total tons for the mix (e.g., 1,120/2,670 x 100 = 42%).
B. Step 3: Apply the percentages calculated in Step 2 to the total commingled tons reported on the survey forms toarrive at a weight for each recyclable material. For example, if you determined in Step 2 that thecommingled mix is 42% aluminum cans by weight according to the reference table, and the total forcommingled materials reported on the survey forms is 10,000 tons, then the actual amount of aluminumcans is 4,200 tons (42% x 10,000).
B. Step 4: Enter the tons from Step 3 in Column 3 of the blank table. Finally, add these amounts to thecorresponding material totals in the table in Part 1A.
Reference Data:
Recovery of Products in Municipal Solid Waste, 19951
Product Amount Recovered (in thousands of tons)
Aluminum Cans 990
Corrugated Boxes 18,480
Glass 3,140
Magazines 670
Newspaper 6,960
Office Paper 3,010
Plastic Bottles 490
Steel Cans 1,500
Telephone Directories 60
Third Class Mail 7101U.S. EPA. 1997. Characterization of Municipal Solid Waste in the United States: 1996 Update. EPA530-R-97-015. Washington, DC. (Please use the latest available version.)
B1
4
Recy
clin
g M
easu
rem
ent
W
ORKSH
EET
8/11/97

1B.
Example:
Recyclable Material (from Step 1) Percentage (from Step 2) Tons (from Step 3)*
Aluminum Cans 19% 190 tons
Steel Cans 27% 270 tons
Glass Bottles 54% 540 tons
*Assume a total of 1,000 tons of Commingled Materials.
Actual Data:
Recyclable Material (from Step 1) Percentage (from Step 2) Tons (from Step 3)
B1
5
Recy
clin
g M
easu
rem
ent
W
ORKSH
EET
8/11/97

2. Commercial Recycling Data
2A. For each recyclable material, total the data reported by each collector in the Commercial column of Form 1, Part 2A. Do the same for the data reported by processors (Form 2, Part 2A) and then end users(Form 3, Part 2A).
To avoid double counting, for those materials where you received data from more than one type of surveyrespondent, circle the data that you believe is the most complete and accurate. Draw a line through theother data. If you surveyed only one type of respondent, simply fill out the corresponding column below.
2A.RECYCLABLE MATERIAL
Survey RespondentTOTAL (tons)Collectors
(tons)Processors(tons)
End Users(tons)
Food Waste
Glass Containers:
Clear
Amber
Green
Mixed Glass
Other GlassSubtotal Glass
Lead-Acid Batteries
Metals:
Aluminum Cans
Tin/Steel Cans
Major Appliances
Other Ferrous
Other Nonferrous
Mixed Metals
Subtotal Metals
Paper:
Old Magazines
Old Newspaper
Old Corrugated Containers
Office Papers
Telephone Directories
Mixed Paper
Other Paper
Subtotal Paper
B1
6
Recy
clin
g M
easu
rem
ent
W
ORKSH
EET
8/11/97
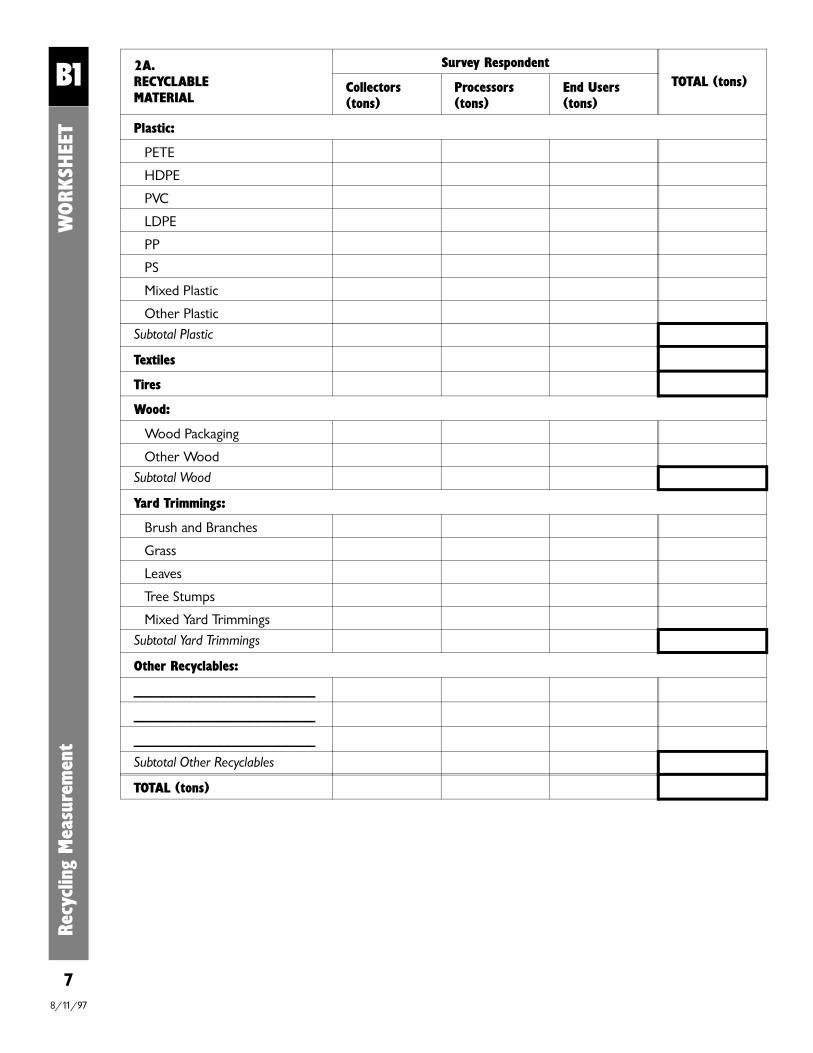
2A.RECYCLABLE MATERIAL
Survey RespondentTOTAL (tons)Collectors
(tons)Processors(tons)
End Users(tons)
Plastic:
PETE
HDPE
PVC
LDPE
PP
PS
Mixed Plastic
Other Plastic
Subtotal Plastic
Textiles
Tires
Wood:
Wood Packaging
Other Wood
Subtotal Wood
Yard Trimmings:
Brush and Branches
Grass
Leaves
Tree Stumps
Mixed Yard Trimmings
Subtotal Yard Trimmings
Other Recyclables:
_________________________
_________________________
_________________________
Subtotal Other Recyclables
TOTAL (tons)
B1
7
Recy
clin
g M
easu
rem
ent
W
ORKSH
EET
8/11/97

B1
8
Recy
clin
g M
easu
rem
ent
W
ORKSH
EET
2B. If you received data from survey respondents on Commingled Materials for commercial programs, use thefollowing method to estimate the weight of each recyclable material that makes up the commingledcategory. Tons for each material should be entered separately into the corresponding category in the tablein Part 2A. You will need to complete this exercise for each different type of commingled mix reported onthe survey forms.
Step 1: Based on the comments received on the survey forms, list the individual recyclable materials that make upCommingled Materials in Column 1 of the blank table titled Actual Data.
B. Step 2: Using the national recovery data in the reference table below as default data, estimate the percentage ofeach material in the commingled mix, and then enter the percentages in Column 2 of the blank table. Forexample, if your mix consists of aluminum cans and steel cans, you would have a total of 2,670 tons ofmaterials (1,120 + 1,550) according to the reference table. This is equal to a mix consisting of 42%aluminum cans and 58% steel cans by weight. To arrive at these percentages, divide the tons of eachmaterial by the total tons for the mix (e.g., 1,120/2,670 x 100 = 42%).
B. Step 3: Apply the percentages calculated in Step 2 to the total commingled tons reported on the survey forms toarrive at a weight for each recyclable material. For example, if you determined in Step 2 that thecommingled mix is 42% aluminum cans by weight according to the reference table, and the total forcommingled materials reported on the survey forms is 10,000 tons, then the actual amount of aluminumcans is 4,200 tons (42% x 10,000).
B. Step 4: Enter the tons from Step 3 in Column 3 of the blank table. Finally, add these amounts to thecorresponding material totals in the table in Part 2A.
Reference Data:
Recovery of Products in Municipal Solid Waste, 19951
Product Amount Recovered (in thousands of tons)
Aluminum Cans 990
Corrugated Boxes 18,480
Glass 3,140
Magazines 670
Newspaper 6,960
Office Paper 3,010
Plastic Bottles 490
Steel Cans 1,500
Telephone Directories 60
Third Class Mail 7101U.S. EPA. 1997. Characterization of Municipal Solid Waste in the United States: 1996 Update. EPA530-R-97-015. Washington, DC. (Please use the latest available version.)
8/11/97
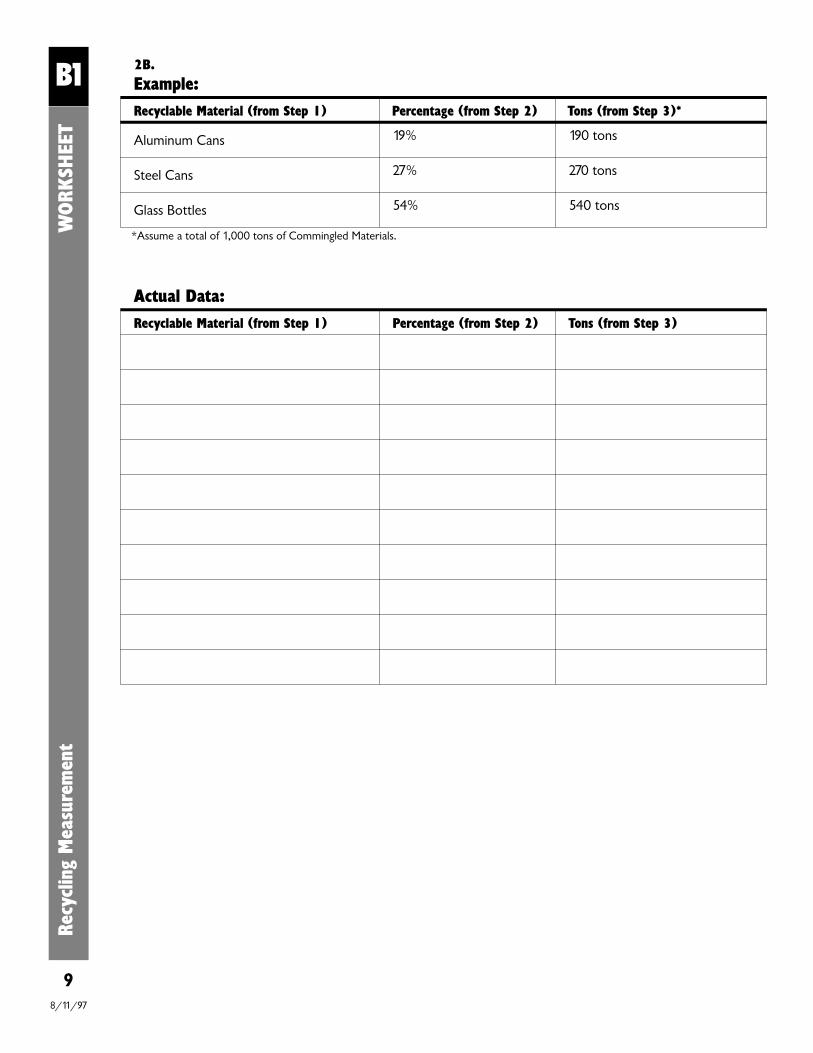
2B.
Example:
Recyclable Material (from Step 1) Percentage (from Step 2) Tons (from Step 3)*
Aluminum Cans 19% 190 tons
Steel Cans 27% 270 tons
Glass Bottles 54% 540 tons
*Assume a total of 1,000 tons of Commingled Materials.
Actual Data:
Recyclable Material (from Step 1) Percentage (from Step 2) Tons (from Step 3)
B1
9
Recy
clin
g M
easu
rem
ent
W
ORKSH
EET
8/11/97

3. Total Recycling Data
3A. If you used the double counting exercise, in the table below enter the circled data from Parts 1 and 2 foreach residential and commercial recyclable material. If you did not use the double counting exercise,simply enter below the available data from Parts 1 and 2. Then, add those numbers to arrive at the totalamount recycled for each material. Finally, add the totals in the last column to arrive at the total amountof MSW recycled in your state or locality.
3A.Recyclable Material
Source of Recyclable Material
Residential(tons)
Commercial(tons) Total (tons)
Food Waste
Glass Containers:
Clear
Amber
Green
Mixed Glass
Other Glass
Subtotal Glass
Lead-Acid Batteries
Metals:
Aluminum Cans
Tin/Steel Cans
Major Appliances
Other Ferrous
Other Nonferrous
Mixed Metals
Subtotal Metals
Paper:
Old Magazines
Old Newspaper
Old Corrugated Containers
Office Papers
Telephone Directories
Mixed Paper
Other paper
Subtotal Paper
Plastic:
PETE
HDPE
PVC
LDPE
=+
B1
10
Recy
clin
g M
easu
rem
ent
W
ORKSH
EET
8/11/97

3A.Recyclable Material
Source of Recyclable Material
Residential(tons)
Commercial(tons) Total (tons)
Plastic (continued)
PP
PS
Mixed Plastic
Other Plastic
Subtotal Plastic
Textiles
Tires
Wood:
Wood Packaging
Other Wood
Subtotal Wood
Yard Trimmings:
Brush and Branches
Grass
Leaves
Tree Stumps
Mixed Yard Trimmings
Subtotal Yard Trimmings
Other Recyclables:
______________________
______________________
______________________Subtotal Other Recyclables
TOTAL (tons)
________________This is the
numerator of therecycling rate
equation (for Worksheet B3).
=+B1
11
Recy
clin
g M
easu
rem
ent
W
ORKSH
EET
8/11/97

Use this worksheet to determine total municipal solid waste (MSW) generation foryour state or locality. Waste generation is equal to the total amount of MSWrecycled plus the total amount of MSW disposed of, in tons. It is the denominator ofthe recycling rate equation.
This worksheet can be used for compiling waste disposal data reported on thestandard survey forms (Parts 1 and 2), or for estimating waste generation if actualdisposal data are not available or reliable (Part 3).
B2
Who Should Use This Worksheet:
State and local governments that do not currently have a recycling measurement system in place.
State and local governments that are redesigning their recycling measurement system accordingto the standard methodology.
State and local governments using Worksheet A to convert to the standard recycling rate (Part 3 only).
What You Will Need:
Completed Survey Forms 4 (Collectors), 5 (Transfer Stations), and 6 (Disposal Facilities).
Population data for the current measurement year (Parts 2 and 3 only).
Your state or local waste characterization study, if available (Part 3 only).
How You Will Use The Information Obtained:
The waste generation figure calculated in this worksheet will be used in conjunction with therecycling data obtained in Worksheet B1 to calculate a recycling rate in Worksheet B3.
Important Tips:
✔ Before you begin, group all the survey forms together according to number.
✔ If you received incomplete information on any part of a survey form, follow up with therespondent in order to complete the data.
✔ This worksheet contains three sections. Read the description of each to determine which areapplicable to your particular situation. In most cases, only one or two of the sections will be needto be completed.
✔ Check to make sure that the data reported on the survey forms is in tons before you begin tocomplete this worksheet. If it is not in tons, use the standard volume-to-weight conversion factorsto convert the data into tons.
Determining WasteGeneration
Re
cycl
ing
Mea
sure
men
t
W
ORKSH
EET
18/11/97
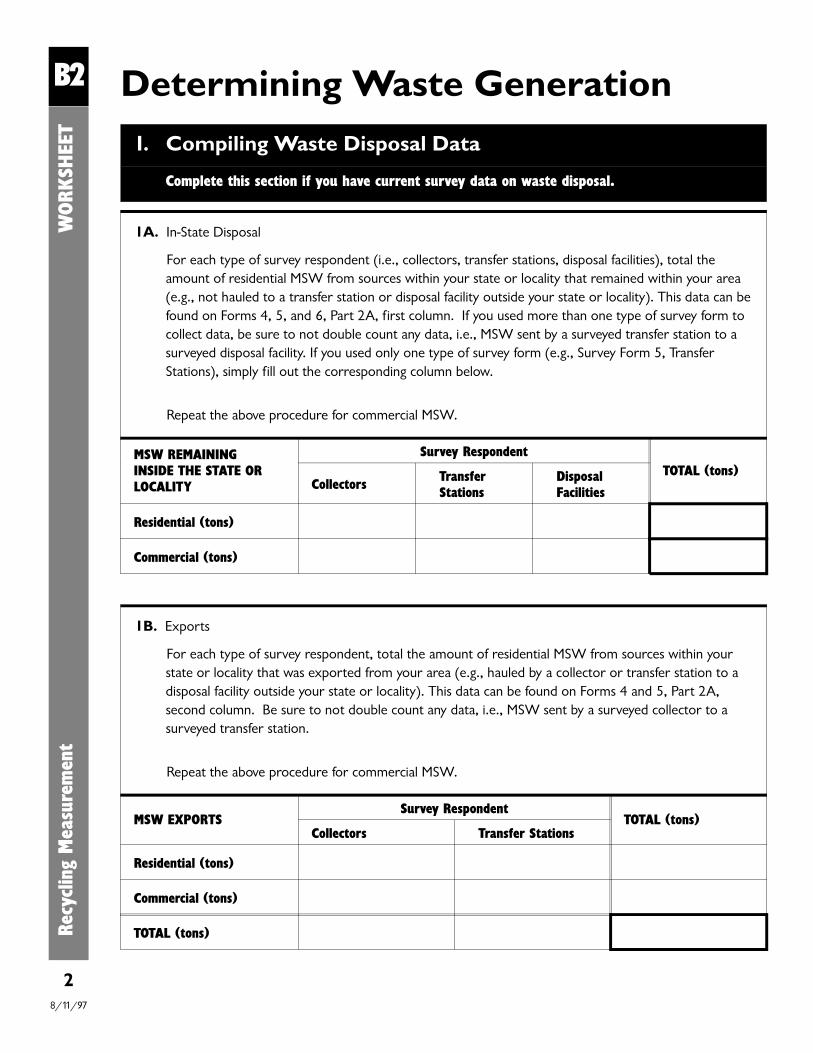
Recy
clin
g M
easu
rem
ent
WORKSH
EET
B2
1. Compiling Waste Disposal Data
Complete this section if you have current survey data on waste disposal.
1A. In-State Disposal
For each type of survey respondent (i.e., collectors, transfer stations, disposal facilities), total theamount of residential MSW from sources within your state or locality that remained within your area(e.g., not hauled to a transfer station or disposal facility outside your state or locality). This data can befound on Forms 4, 5, and 6, Part 2A, first column. If you used more than one type of survey form tocollect data, be sure to not double count any data, i.e., MSW sent by a surveyed transfer station to asurveyed disposal facility. If you used only one type of survey form (e.g., Survey Form 5, TransferStations), simply fill out the corresponding column below.
Repeat the above procedure for commercial MSW.
MSW REMAININGINSIDE THE STATE ORLOCALITY
Survey RespondentTOTAL (tons)
Collectors TransferStations
DisposalFacilities
Residential (tons)
Commercial (tons)
Determining Waste Generation
2
1B. Exports
For each type of survey respondent, total the amount of residential MSW from sources within yourstate or locality that was exported from your area (e.g., hauled by a collector or transfer station to adisposal facility outside your state or locality). This data can be found on Forms 4 and 5, Part 2A,second column. Be sure to not double count any data, i.e., MSW sent by a surveyed collector to asurveyed transfer station.
Repeat the above procedure for commercial MSW.
MSW EXPORTSSurvey Respondent
TOTAL (tons)Collectors Transfer Stations
Residential (tons)
Commercial (tons)
TOTAL (tons)
8/11/97

B2Re
cycl
ing
Mea
sure
men
t
WORKSH
EET
3
1C. Imports
For each type of survey respondent, total the amount of residential MSW from sources outside yourstate or locality that was imported into the area (e.g., hauled by a collector to a transfer station ordisposal facility inside your state or locality). This data can be found on Forms 4, 5 and 6, Part 2B. Besure to not double count any data, i.e., MSW sent by a surveyed collector to a surveyed disposal facility.
Repeat the above procedure for commercial MSW.
MSW IMPORTSSurvey Respondent
TOTAL (tons)Collectors Transfer Stations
Residential (tons)
Commercial (tons)
TOTAL (tons)
1D. Total Residential MSW Disposed Of
_____________________MSW Remaining
Inside the State or Locality(from 1A)
______________MSW Exports
(from 1B)
______________MSW Imports
(from 1C)
____________________Total Residential
MSW Disposed Of(tons)
– =+
1E. Total Commercial MSW Disposed Of
_____________________MSW Remaining
Inside the State or Locality(from 1A)
______________MSW Exports
(from 1B)
_______________MSW Imports
(from 1C)
__________________Total CommercialMSW Disposed Of
(tons)
– =+
1F. Total MSW Disposed Of
_____________________Total Residential MSW
(from 1D)
_____________________Total Commercial MSW
(from 1E)
_______________________Total MSW Disposed Of
(tons)
=+
1G. Total MSW Generated
______________________Total MSW Disposed Of
(from 1F)
______________________Total MSW Recycled
(from Worksheet B1, Part 3)
______________________Total MSW Generated
(tons)This is the denominator ofthe recycling rate equation
(for Worksheet B3).
=+
8/11/97

2. Extrapolating Waste Generation Data (optional)
Complete this section if you received less than a 100 percent response rate to your survey. In this section you will use the partial data received to extrapolate total MSW generation. Inother words, it will allow you to calculate a total even though you have data from only aportion of your state or locality.
2A. Estimate the population represented by the data received in your latest survey:
___________________________ Estimated Population
2B. Complete Part 1 using the data received in your latest survey.
2C. Per Capita Waste Generation:
______________________Total MSW Generated
(from 1G)
______________________Estimated Population
(from 2A)
______________________Per Capita Waste
Generation
2D. Extrapolated MSW Generation:
________________________Per Capita Waste Generation
(from 2C)
________________________Current Measurement Year
Total Population
________________________Extrapolated MSW
Generation(tons)
This is the denominator ofthe recycling rate equation
(for Worksheet B3).
=#
=x
B2Re
cycl
ing
Mea
sure
men
t
WORKSH
EET
48/11/97
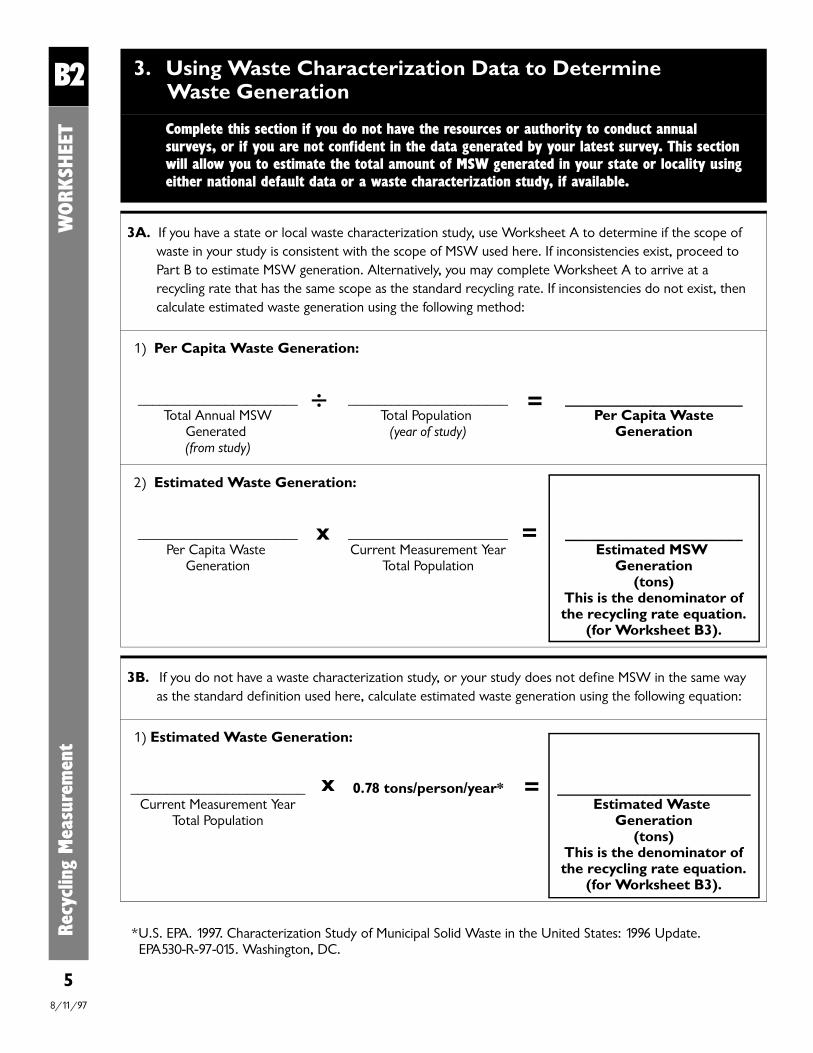
3. Using Waste Characterization Data to Determine Waste Generation
Complete this section if you do not have the resources or authority to conduct annualsurveys, or if you are not confident in the data generated by your latest survey. This sectionwill allow you to estimate the total amount of MSW generated in your state or locality usingeither national default data or a waste characterization study, if available.
3A. If you have a state or local waste characterization study, use Worksheet A to determine if the scope ofwaste in your study is consistent with the scope of MSW used here. If inconsistencies exist, proceed toPart B to estimate MSW generation. Alternatively, you may complete Worksheet A to arrive at arecycling rate that has the same scope as the standard recycling rate. If inconsistencies do not exist, thencalculate estimated waste generation using the following method:
1) Per Capita Waste Generation:
______________________Total Annual MSW
Generated (from study)
______________________Total Population
(year of study)
______________________Per Capita Waste
Generation
2) Estimated Waste Generation:
______________________Per Capita Waste
Generation
______________________Current Measurement Year
Total Population
______________________Estimated MSW
Generation(tons)
This is the denominator ofthe recycling rate equation.
(for Worksheet B3).
3B. If you do not have a waste characterization study, or your study does not define MSW in the same wayas the standard definition used here, calculate estimated waste generation using the following equation:
1) Estimated Waste Generation:
________________________Current Measurement Year
Total Population
0.78 tons/person/year* ________________________Estimated Waste
Generation(tons)
This is the denominator ofthe recycling rate equation.
(for Worksheet B3).
*U.S. EPA. 1997. Characterization Study of Municipal Solid Waste in the United States: 1996 Update. EPA530-R-97-015. Washington, DC.
=#
=x
=x
B2Re
cycl
ing
Mea
sure
men
t
WORKSH
EET
58/11/97
Use this worksheet to determine your state or locality’s MSW recycling rate for thecurrent measurement year.
B3
Who Should Use This Worksheet:
State and local governments that do not currently have a recycling measurement system in placeand are establishing a recycling rate for the first time.
State and local governments that are redesigning their recycling measurement system accordingto the standard methodology.
What You Will Need:
Total MSW recycled from Worksheet B1.
Total MSW generated from Worksheet B2.
Calculating YourMunicipal Solid Waste(MSW) Recycling Rate
Rec
yclin
g M
easu
rem
ent
W
ORKSH
EET
18/11/97
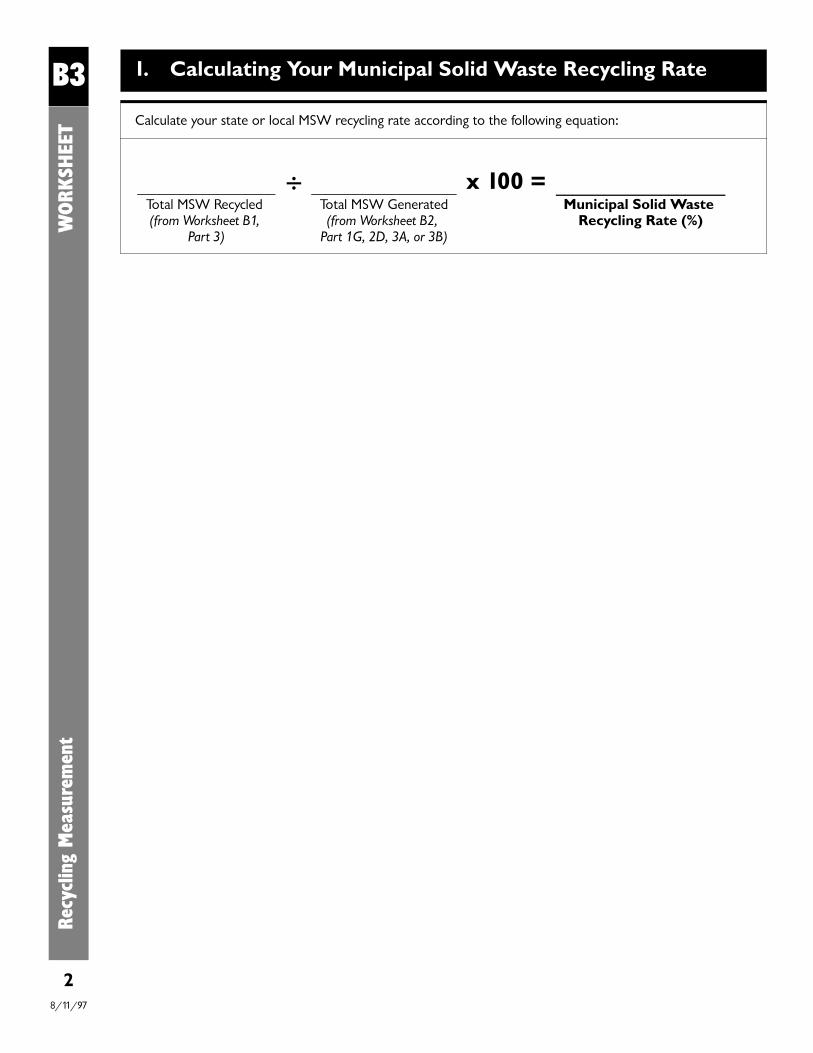
Rec
yclin
g M
easu
rem
ent
W
ORKSH
EET
B3 1. Calculating Your Municipal Solid Waste Recycling Rate
Calculate your state or local MSW recycling rate according to the following equation:
___________________Total MSW Recycled (from Worksheet B1,
Part 3)
____________________Total MSW Generated(from Worksheet B2,
Part 1G, 2D, 3A, or 3B)
_____________________Municipal Solid Waste
Recycling Rate (%)
# x 100 =
28/11/97
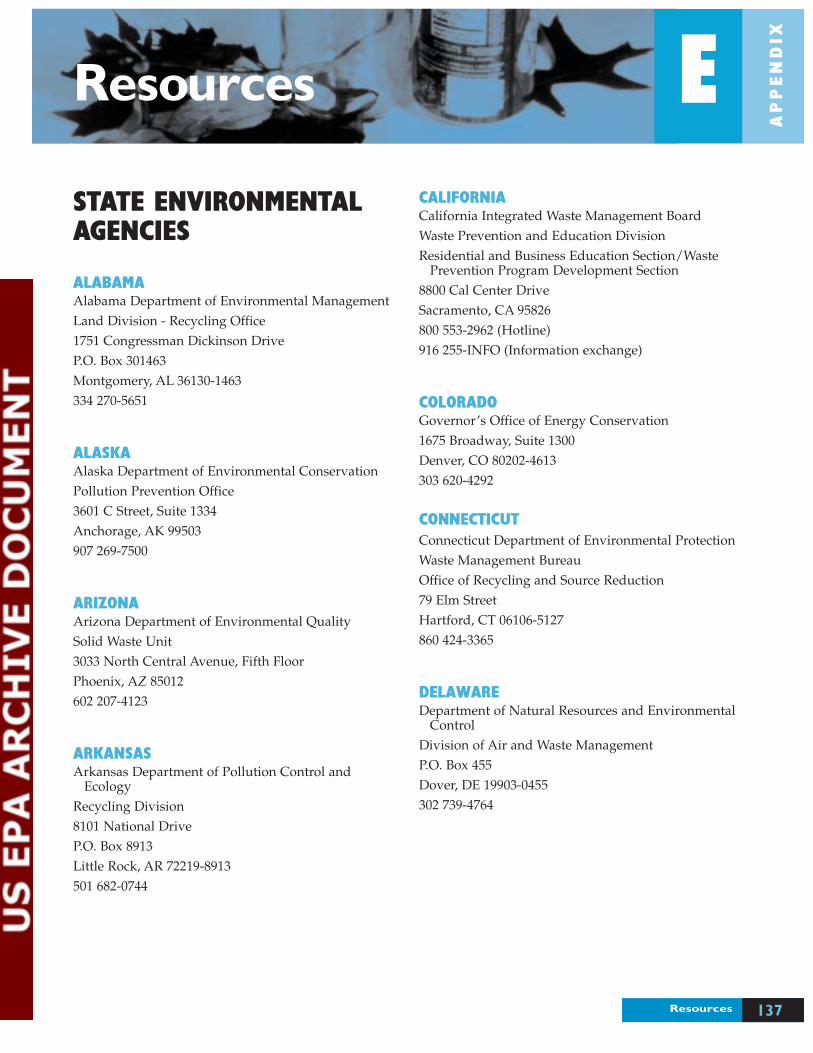
STATE ENVIRONMENTALAGENCIES
ALABAMAAlabama Department of Environmental ManagementLand Division - Recycling Office1751 Congressman Dickinson DriveP.O. Box 301463Montgomery, AL 36130-1463334 270-5651
ALASKAAlaska Department of Environmental ConservationPollution Prevention Office3601 C Street, Suite 1334Anchorage, AK 99503907 269-7500
ARIZONAArizona Department of Environmental QualitySolid Waste Unit3033 North Central Avenue, Fifth FloorPhoenix, AZ 85012602 207-4123
ARKANSASArkansas Department of Pollution Control and
EcologyRecycling Division8101 National DriveP.O. Box 8913Little Rock, AR 72219-8913501 682-0744
CALIFORNIACalifornia Integrated Waste Management BoardWaste Prevention and Education DivisionResidential and Business Education Section/Waste
Prevention Program Development Section8800 Cal Center DriveSacramento, CA 95826800 553-2962 (Hotline)916 255-INFO (Information exchange)
COLORADOGovernor’s Office of Energy Conservation1675 Broadway, Suite 1300Denver, CO 80202-4613303 620-4292
CONNECTICUTConnecticut Department of Environmental ProtectionWaste Management BureauOffice of Recycling and Source Reduction79 Elm StreetHartford, CT 06106-5127860 424-3365
DELAWAREDepartment of Natural Resources and Environmental
ControlDivision of Air and Waste ManagementP.O. Box 455Dover, DE 19903-0455302 739-4764
137Resources
AP
PE
ND
IX
EResources
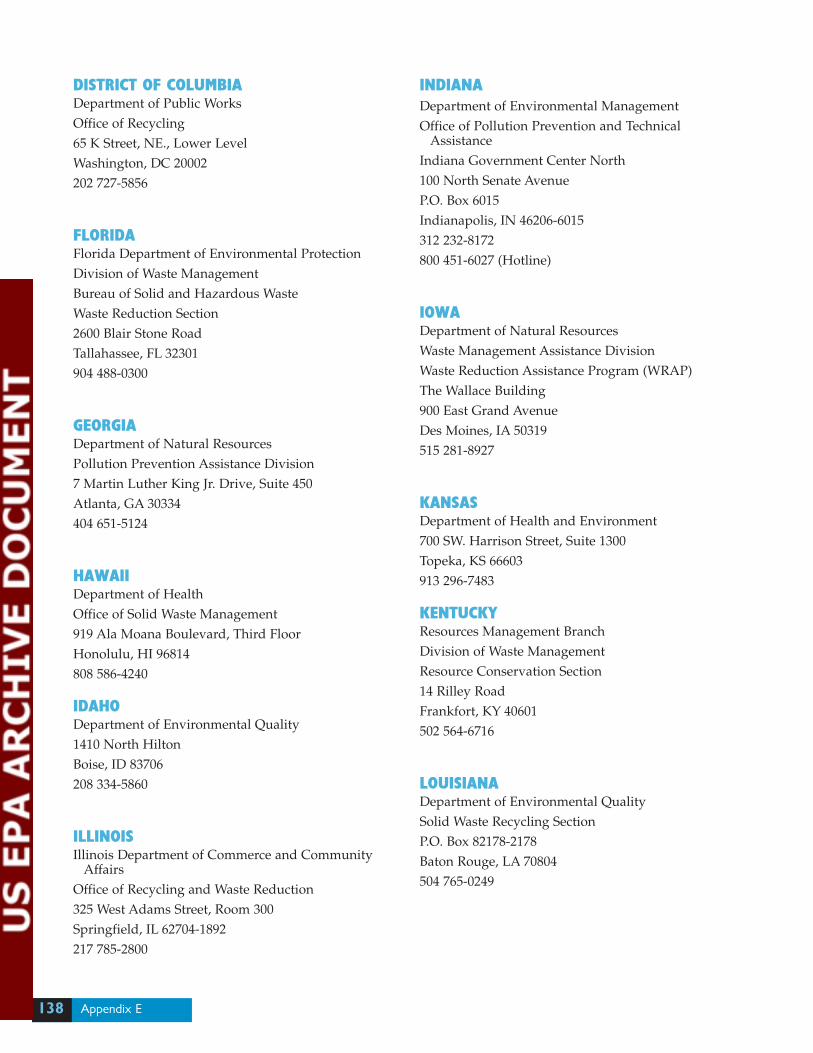
Appendix E138
DISTRICT OF COLUMBIADepartment of Public WorksOffice of Recycling65 K Street, NE., Lower LevelWashington, DC 20002202 727-5856
FLORIDAFlorida Department of Environmental ProtectionDivision of Waste ManagementBureau of Solid and Hazardous WasteWaste Reduction Section2600 Blair Stone RoadTallahassee, FL 32301904 488-0300
GEORGIADepartment of Natural ResourcesPollution Prevention Assistance Division7 Martin Luther King Jr. Drive, Suite 450Atlanta, GA 30334404 651-5124
HAWAIIDepartment of HealthOffice of Solid Waste Management919 Ala Moana Boulevard, Third FloorHonolulu, HI 96814808 586-4240
IDAHODepartment of Environmental Quality1410 North HiltonBoise, ID 83706208 334-5860
ILLINOISIllinois Department of Commerce and Community
AffairsOffice of Recycling and Waste Reduction325 West Adams Street, Room 300Springfield, IL 62704-1892217 785-2800
INDIANADepartment of Environmental ManagementOffice of Pollution Prevention and Technical
AssistanceIndiana Government Center North100 North Senate AvenueP.O. Box 6015Indianapolis, IN 46206-6015312 232-8172800 451-6027 (Hotline)
IOWADepartment of Natural ResourcesWaste Management Assistance DivisionWaste Reduction Assistance Program (WRAP)The Wallace Building900 East Grand AvenueDes Moines, IA 50319515 281-8927
KANSASDepartment of Health and Environment700 SW. Harrison Street, Suite 1300Topeka, KS 66603913 296-7483
KENTUCKYResources Management BranchDivision of Waste ManagementResource Conservation Section14 Rilley RoadFrankfort, KY 40601502 564-6716
LOUISIANADepartment of Environmental QualitySolid Waste Recycling SectionP.O. Box 82178-2178Baton Rouge, LA 70804504 765-0249
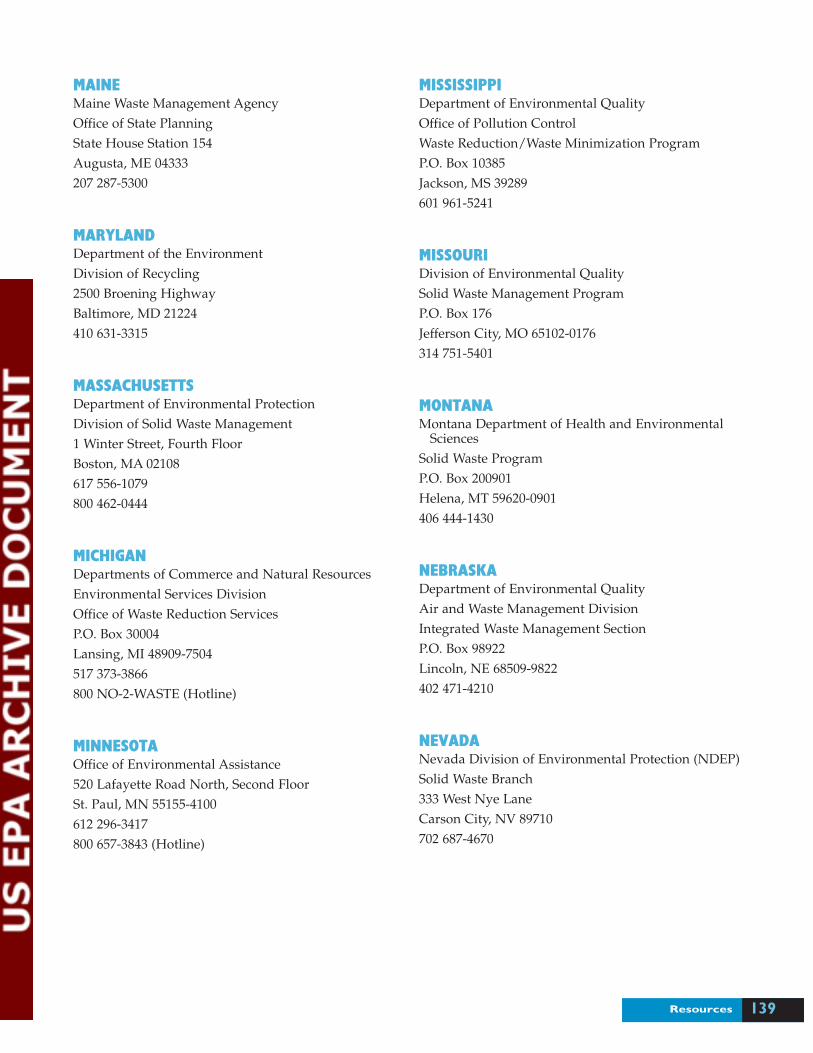
139Resources
MAINEMaine Waste Management AgencyOffice of State PlanningState House Station 154Augusta, ME 04333207 287-5300
MARYLANDDepartment of the EnvironmentDivision of Recycling2500 Broening HighwayBaltimore, MD 21224410 631-3315
MASSACHUSETTSDepartment of Environmental ProtectionDivision of Solid Waste Management1 Winter Street, Fourth FloorBoston, MA 02108617 556-1079800 462-0444
MICHIGANDepartments of Commerce and Natural ResourcesEnvironmental Services DivisionOffice of Waste Reduction ServicesP.O. Box 30004Lansing, MI 48909-7504517 373-3866800 NO-2-WASTE (Hotline)
MINNESOTAOffice of Environmental Assistance520 Lafayette Road North, Second FloorSt. Paul, MN 55155-4100612 296-3417800 657-3843 (Hotline)
MISSISSIPPIDepartment of Environmental QualityOffice of Pollution ControlWaste Reduction/Waste Minimization ProgramP.O. Box 10385Jackson, MS 39289601 961-5241
MISSOURIDivision of Environmental QualitySolid Waste Management ProgramP.O. Box 176Jefferson City, MO 65102-0176314 751-5401
MONTANAMontana Department of Health and Environmental
SciencesSolid Waste ProgramP.O. Box 200901Helena, MT 59620-0901406 444-1430
NEBRASKADepartment of Environmental QualityAir and Waste Management DivisionIntegrated Waste Management SectionP.O. Box 98922Lincoln, NE 68509-9822402 471-4210
NEVADANevada Division of Environmental Protection (NDEP)Solid Waste Branch333 West Nye LaneCarson City, NV 89710702 687-4670
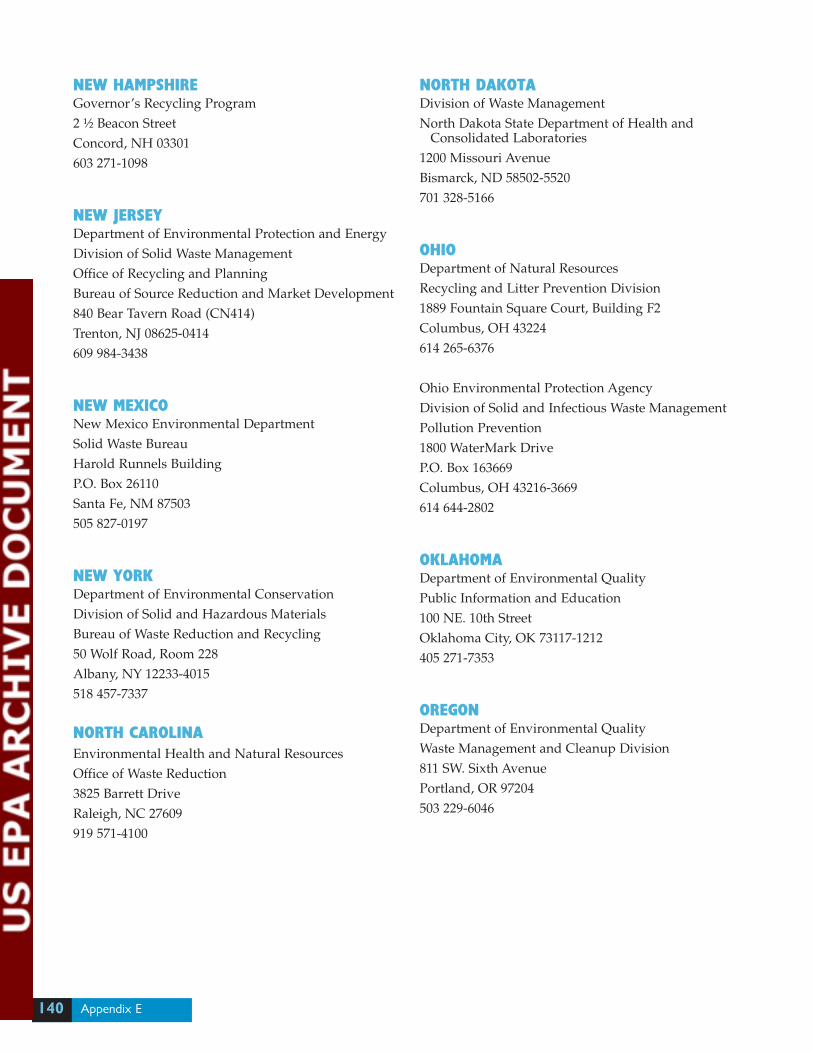
Appendix E140
NEW HAMPSHIREGovernor’s Recycling Program 2 ½ Beacon StreetConcord, NH 03301603 271-1098
NEW JERSEYDepartment of Environmental Protection and EnergyDivision of Solid Waste ManagementOffice of Recycling and PlanningBureau of Source Reduction and Market Development840 Bear Tavern Road (CN414)Trenton, NJ 08625-0414609 984-3438
NEW MEXICONew Mexico Environmental DepartmentSolid Waste BureauHarold Runnels BuildingP.O. Box 26110Santa Fe, NM 87503505 827-0197
NEW YORKDepartment of Environmental ConservationDivision of Solid and Hazardous MaterialsBureau of Waste Reduction and Recycling50 Wolf Road, Room 228Albany, NY 12233-4015518 457-7337
NORTH CAROLINAEnvironmental Health and Natural ResourcesOffice of Waste Reduction3825 Barrett DriveRaleigh, NC 27609919 571-4100
NORTH DAKOTADivision of Waste ManagementNorth Dakota State Department of Health and
Consolidated Laboratories1200 Missouri AvenueBismarck, ND 58502-5520701 328-5166
OHIODepartment of Natural ResourcesRecycling and Litter Prevention Division1889 Fountain Square Court, Building F2Columbus, OH 43224614 265-6376
Ohio Environmental Protection AgencyDivision of Solid and Infectious Waste ManagementPollution Prevention1800 WaterMark DriveP.O. Box 163669Columbus, OH 43216-3669614 644-2802
OKLAHOMADepartment of Environmental QualityPublic Information and Education100 NE. 10th StreetOklahoma City, OK 73117-1212405 271-7353
OREGONDepartment of Environmental QualityWaste Management and Cleanup Division811 SW. Sixth AvenuePortland, OR 97204503 229-6046
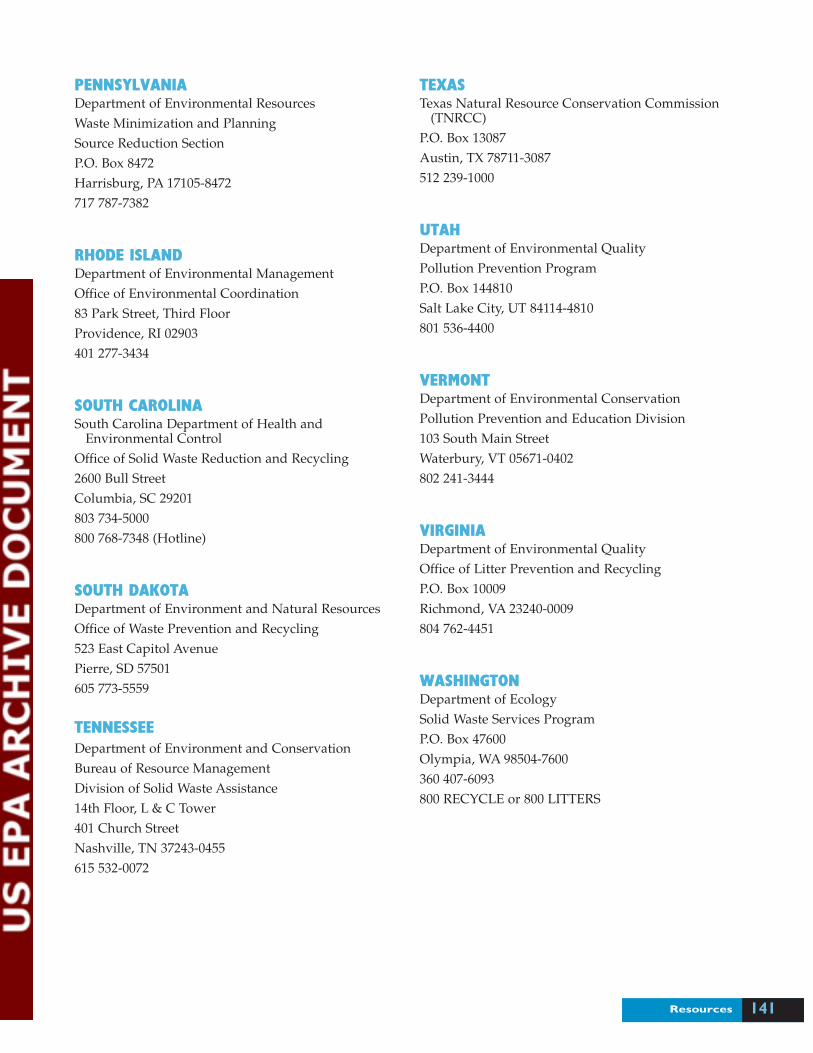
141Resources
PENNSYLVANIADepartment of Environmental ResourcesWaste Minimization and PlanningSource Reduction SectionP.O. Box 8472Harrisburg, PA 17105-8472717 787-7382
RHODE ISLANDDepartment of Environmental ManagementOffice of Environmental Coordination83 Park Street, Third FloorProvidence, RI 02903401 277-3434
SOUTH CAROLINASouth Carolina Department of Health and
Environmental ControlOffice of Solid Waste Reduction and Recycling2600 Bull StreetColumbia, SC 29201803 734-5000800 768-7348 (Hotline)
SOUTH DAKOTADepartment of Environment and Natural ResourcesOffice of Waste Prevention and Recycling523 East Capitol AvenuePierre, SD 57501605 773-5559
TENNESSEEDepartment of Environment and ConservationBureau of Resource ManagementDivision of Solid Waste Assistance14th Floor, L & C Tower401 Church StreetNashville, TN 37243-0455615 532-0072
TEXASTexas Natural Resource Conservation Commission
(TNRCC)P.O. Box 13087Austin, TX 78711-3087512 239-1000
UTAHDepartment of Environmental QualityPollution Prevention ProgramP.O. Box 144810Salt Lake City, UT 84114-4810801 536-4400
VERMONTDepartment of Environmental ConservationPollution Prevention and Education Division103 South Main StreetWaterbury, VT 05671-0402802 241-3444
VIRGINIADepartment of Environmental QualityOffice of Litter Prevention and RecyclingP.O. Box 10009Richmond, VA 23240-0009804 762-4451
WASHINGTONDepartment of EcologySolid Waste Services ProgramP.O. Box 47600Olympia, WA 98504-7600360 407-6093800 RECYCLE or 800 LITTERS
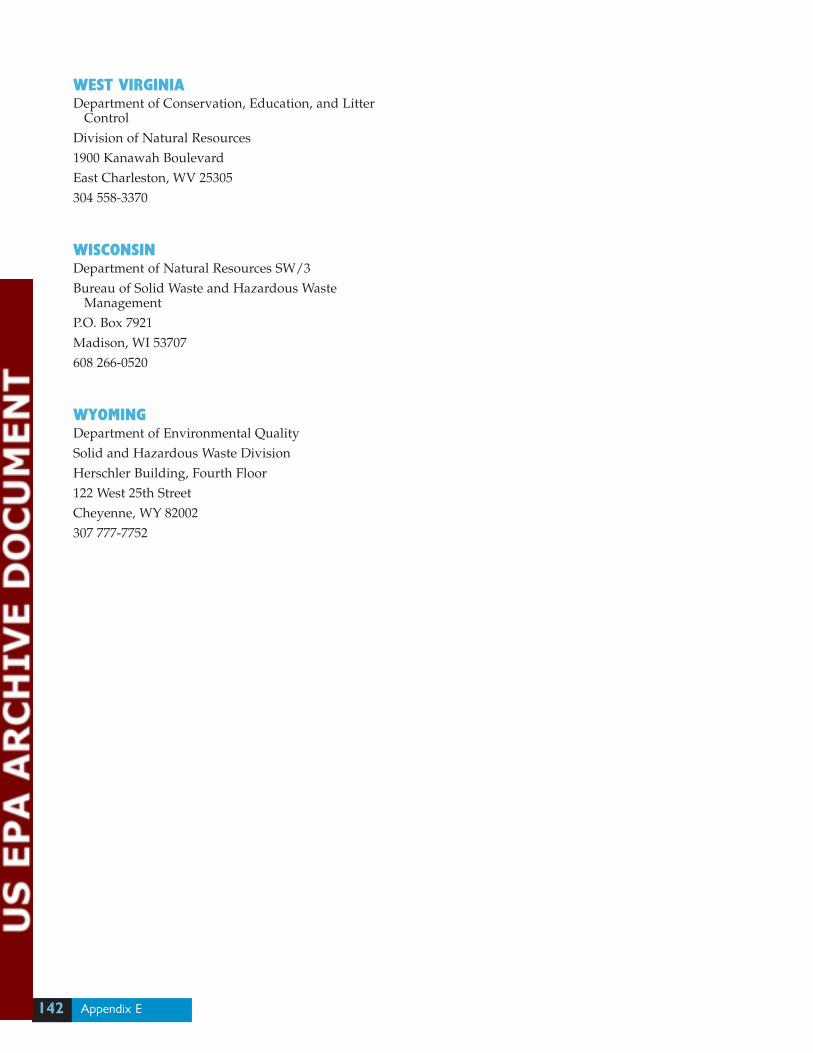
Appendix E142
WEST VIRGINIADepartment of Conservation, Education, and Litter
ControlDivision of Natural Resources1900 Kanawah BoulevardEast Charleston, WV 25305304 558-3370
WISCONSINDepartment of Natural Resources SW/3Bureau of Solid Waste and Hazardous Waste
ManagementP.O. Box 7921Madison, WI 53707608 266-0520
WYOMINGDepartment of Environmental QualitySolid and Hazardous Waste DivisionHerschler Building, Fourth Floor122 West 25th StreetCheyenne, WY 82002307 777-7752
Excerpt From FloridaStatute Section403.7046, “Regulationof Recovered Materials”
(1) After January 1, 1994, anyperson who handles, purchases,receives, recovers, sells, or is anend use of recovered materialsshall annually certify to the depart-ment on forms provided by thedepartment. The department mayby rule exempt from this require-ment generators of recoveredmaterials, persons who handle orsell recovered materials as an activ-ity which is incidental to the nor-mal primary business activities ofthat person, or persons who han-dle, purchase, receive, recover, sell,or are end users of recovered mate-rials in small quantities as definedby the department. The depart-ment shall adopt rules for the certi-fication of and reporting by suchpersons and shall establish criteriafor revocation of such certification.Prior to the adoption of such rules,the department shall appoint atechnical advisory committee of nomore than nine persons, includingat a minimum, representatives ofthe Florida Association ofCounties, the Florida League ofCities, the Florida RecyclersAssociation, and the FloridaChapter of the National SolidWaste Management Association, toaid in the development of such
rules. Such rules shall be designedto elicit, at a minimum, the amountand types of recovered materialshandled by registrants, and theamount and disposal site, or nameof person with whom such dispos-al was arranged, or any solid wastegenerated by such facility. Suchrules may provide for the depart-ment to conduct periodic inspec-tions. The department may chargea fee of up to $50 for each registra-tion, which shall be deposited intothe Solid Waste Management TrustFund for implementation of theprogram.
(2) Information reported pur-suant to the requirements of thissection or any rule adopted pur-suant to this section which, if dis-closed, would reveal a trade secret,as defined in s.-812.081(1)(c), isconfidential and exempt from theprovisions of s.-119.07(1). Thisexemption is subject to the OpenGovernment Sunset Review Act inaccordance with s.-119.14. Forreporting or information purposes,however, the department may pro-vide this information in such formthat the names of the personsreporting such information and thespecific information reported is notrevealed.
(3) Except as otherwise provid-ed in this section or pursuant to aspecial act in effect on or beforeJanuary 1, 1993, a local governmentmay not require a commercial
establishment that generatessource-separated recovered materi-als to sell or otherwise convey itsrecovered materials to the localgovernment or to a facility desig-nated by the local government, normay the local government restrictsuch a generator’s right to sell orotherwise convey such recoveredmaterials to any properly certifiedrecovered materials dealer who hassatisfied the requirements of thissection. A local government maynot enact any ordinance that pre-vents such a dealer from enteringinto a contract with a commercialestablishment to purchase, collect,transport, process, or receivesource-separated recovered materi-als.
(a) The local government mayrequire that the recovered materi-als generated at the commercialestablishment be source separatedat the premises of the commercialestablishment.
(b) Prior to engaging in businesswithin the jurisdiction of the localgovernment, a recovered materialsdealer must provide the local gov-ernment with a copy of the certifi-cation provided for this section. Inaddition, the local governmentmay establish a registrationprocess whereby a recovered mate-rials dealer must register with thelocal government prior to engagingin business with the jurisdiction ofthe local government.
143Sample Language for Freedom of Information Act Exemption
AP
PE
ND
IX
FSample Language for Freedom ofInformation Act Exemption
{Date}
{Name}
{Address}
Dear {Private Recycling Hauler}:
The {name of department/agency} would appreciate your assistance in calculating the official199_ recycling rate. As you know, {name of state or locality} has set a recycling goal of {percentage}percent by 199_. To measure our progress toward achieving this goal, we are collecting data on theamount of municipal solid waste (MSW) recycled in the {state, city, or county}. In addition, thesedata will help us expand markets for recyclable materials, better allocate resources, make effectivesolid waste management decisions, and gauge our disposal capacity.
By completing the enclosed Recycling Measurement Survey Form, you will provide us withvaluable information. This information will be combined with data from other collectors, proces-sors, and end users of recyclable materials to calculate a recycling rate and to help us plan for thefuture of solid waste management in {name of state or locality}. Supplying these data to us also pro-vides important benefits to you. By knowing the amount of recyclables collected in the {state, city,or county} we can determine where additional mills or processors might be needed to developmarkets for specific materials. This could mean more business opportunities and better markets foryou in the future.
To assist us in our recycling measurement efforts, please fill out the enclosed survey form andreturn it to us by {date of deadline}. Before completing the survey, please take time to read all of theinstructions carefully. It is essential that you provide us with the most complete and accurate infor-mation available. To ensure confidentiality, please mark any sensitive or proprietary information as“confidential.” Please understand that we will not release any confidential information used to cal-culate our recycling rate.
If you have any questions regarding the Recycling Measurement Survey Form, please contact{name of contact person} at {phone number}. This person is available to provide you with any tech-nical assistance you may need and can also be reached at the following electronic mail address{address}. The results of this survey can be obtained by contacting {name of person} after {date}.
Measuring recycling in our {state, city, or county} is an important endeavor. We hope that youwill fill out the survey form carefully and return it to us by the date above.
Thank you for your time and assistance.
Sincerely,
{Name of Recycling Measurement Official}
145Sample Cover Letters
AP
PE
ND
IX
GSample Cover Letters
Appendix G146
{Date}
{Name}
{Address}
Dear {Name of County or City Recycling Coordinator}:
The {name of department/agency} would appreciate your assistance in calculating the official199_ recycling rate. As you know, {name of state or locality} has set a recycling goal of {percentage}percent by 199_. To measure our progress toward achieving this goal, we are collecting data on theamount of municipal solid waste (MSW) recycled in the {state, city, or county}. In addition, thesedata will help us expand markets for recyclable materials, better allocate resources, make effectivesolid waste management decisions, and gauge our disposal capacity.
By completing the enclosed Recycling Measurement Survey Form, you will provide us withvaluable information. This information will be combined with data from other {cities or counties}to calculate a recycling rate and to help us plan for the future of solid waste management in {nameof state or locality}. Supplying these data to us also provides important benefits to you. You can usethese data to supplement your local solid waste planning efforts, public education and outreach,and local market development.
To assist us in our recycling measurement efforts, please fill out the enclosed survey form andreturn it to us by {date of deadline}. Before completing the survey, please take time to read all of theinstructions carefully. It is essential that you provide us with the most complete and accurate infor-mation available.
If you have any questions regarding the Recycling Measurement Survey Form, please contact{name of contact person} at {phone number}. This person is available to provide you with any tech-nical assistance you may need and can also be reached at the following electronic mail address{address}. In addition, we are conducting a training seminar on the reporting requirements on{date} at {location}. Additional information about the training session will be mailed to you short-ly. Technical assistance materials including {name(s) of guidebook, documents, etc.} are also avail-able. For more information about the recycling measurement program, contact {contact person} atthe number above. The results of this survey can be obtained by contacting {name of person} after{date}.
Measuring recycling in our {state, city, or county} is an important endeavor. We hope that youwill fill out the survey form carefully and return it to us by the date above.
Thank you for your time and assistance.
Sincerely,
{Name of Recycling Measurement Official}
147Sample Cover Letters
{Date}
{Name}
{Address}
Dear {Waste Disposal Facility}:
The {name of department/agency} would appreciate your assistance in calculating the official199_ recycling rate. As you know, {name of state or locality} has set a recycling goal of {percentage}percent by 199_. To measure our progress toward achieving this goal, we are collecting data on theamount of municipal solid waste (MSW) recycled and disposed of in the {state, city, or county}. Inaddition, these data will help us expand markets for recyclable materials, better allocate resources,make effective solid waste management decisions, and gauge our disposal capacity.
By completing the enclosed Waste Disposal Survey Form, you will provide us with valuableinformation. This information will be combined with data from other landfills, incinerators, waste-to-energy facilities, transfer stations, and waste haulers to determine the amount of waste generat-ed in the area and calculate a recycling rate. Supplying these data to us voluntarily can prevent usfrom having to mandate reporting in the future.
To assist us in our waste disposal measurement efforts, please fill out the enclosed survey formand return it to us by {date of deadline}. Before completing the survey, please take time to read allof the instructions carefully. It is essential that you provide us with the most complete and accurateinformation available. To ensure confidentiality, please mark any sensitive or proprietary informa-tion as “confidential.” Please understand that we will not release any confidential information usedto calculate our recycling rate.
If you have any questions regarding the Waste Disposal Survey Form, please contact {name ofcontact person} at {phone number}. This person is available to provide you with any technical assis-tance you may need and can also be reached at the following electronic mail address {address}. Theresults of this survey can be obtained by contacting {name of person} after {date}.
Measuring recycling in our {state, city, or county} is an important endeavor. We hope that youwill fill out the survey form carefully and return it to us by the date above.
Thank you for your time and assistance.
Sincerely,
{Name of Recycling Measurement Official}
149Adjusting Waste Generation
AP
PE
ND
IX
HAdjusting WasteGeneration
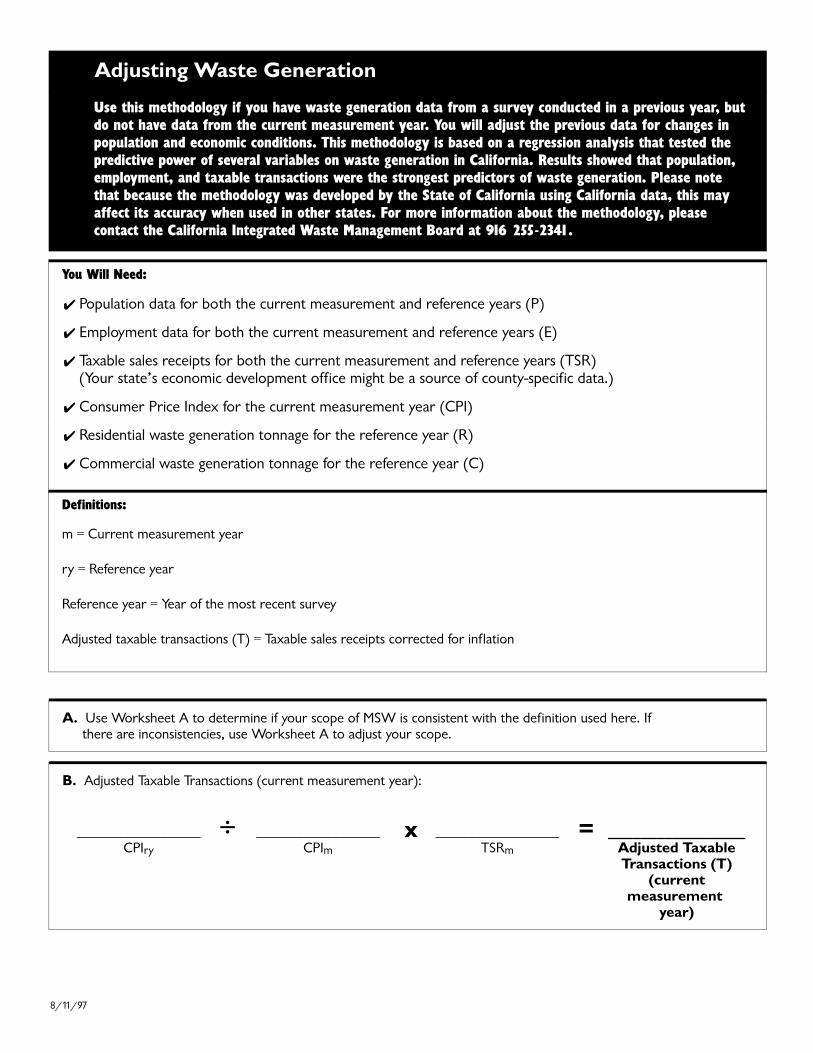
Adjusting Waste Generation
Use this methodology if you have waste generation data from a survey conducted in a previous year, butdo not have data from the current measurement year. You will adjust the previous data for changes inpopulation and economic conditions. This methodology is based on a regression analysis that tested thepredictive power of several variables on waste generation in California. Results showed that population,employment, and taxable transactions were the strongest predictors of waste generation. Please notethat because the methodology was developed by the State of California using California data, this mayaffect its accuracy when used in other states. For more information about the methodology, pleasecontact the California Integrated Waste Management Board at 916 255-2341.
You Will Need:
✔ Population data for both the current measurement and reference years (P)
✔ Employment data for both the current measurement and reference years (E)
✔ Taxable sales receipts for both the current measurement and reference years (TSR) (Your state’s economic development office might be a source of county-specific data.)
✔ Consumer Price Index for the current measurement year (CPI)
✔ Residential waste generation tonnage for the reference year (R)
✔ Commercial waste generation tonnage for the reference year (C)
Definitions:
m = Current measurement year
ry = Reference year
Reference year = Year of the most recent survey
Adjusted taxable transactions (T) = Taxable sales receipts corrected for inflation
A. Use Worksheet A to determine if your scope of MSW is consistent with the definition used here. If there are inconsistencies, use Worksheet A to adjust your scope.
B. Adjusted Taxable Transactions (current measurement year):
_________________CPIry
_________________CPIm
_________________TSRm
_________________Adjusted TaxableTransactions (T)
(currentmeasurement
year)
x =#
8/11/97
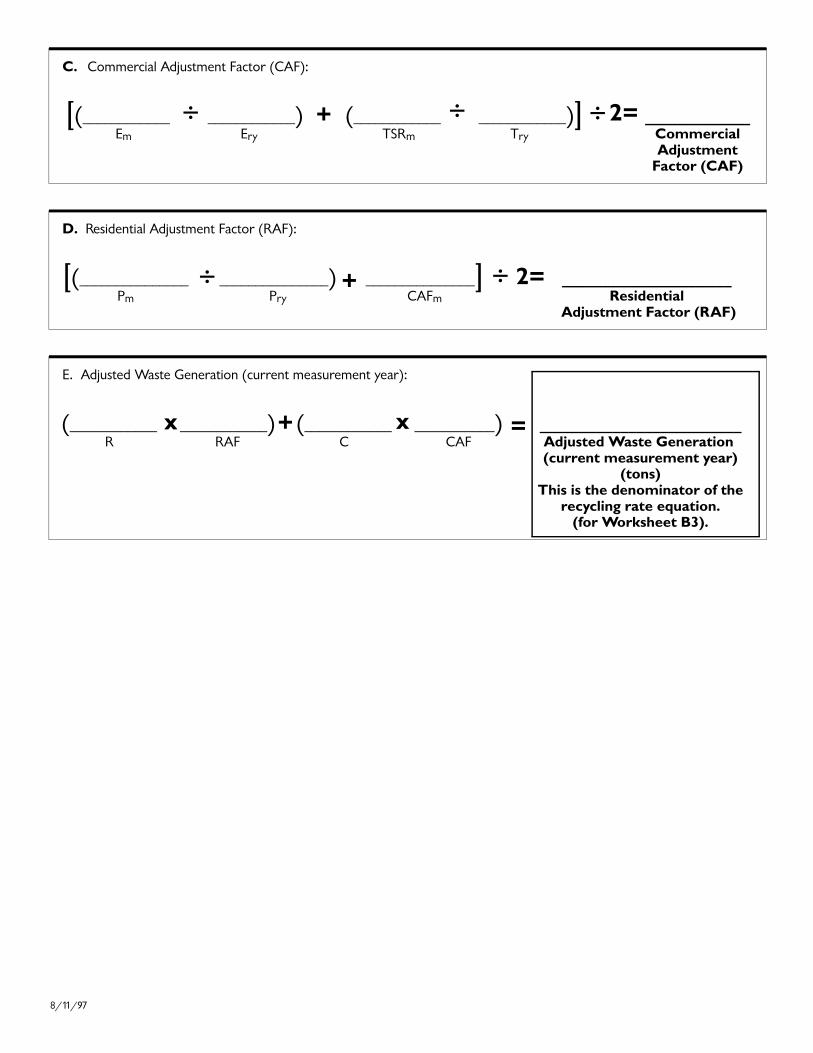
D. Residential Adjustment Factor (RAF):
[(_______________Pm
_______________)Pry
_______________]CAFm
_____________________Residential
Adjustment Factor (RAF)
+# #2=
E. Adjusted Waste Generation (current measurement year):
(____________R
____________)RAF
(____________C
___________)CAF
_________________________Adjusted Waste Generation (current measurement year)
(tons)This is the denominator of the
recycling rate equation.(for Worksheet B3).
=+x x
C. Commercial Adjustment Factor (CAF):
[(____________ Em
____________)Ery
(____________ TSRm
____________)]Try
_____________CommercialAdjustment
Factor (CAF)
#+# #2=
8/11/97

Use this worksheet to calculate a recycling rate based on the standard equation. The standard recycling rate incorporates standard definitions of municipal solidwaste (MSW) and recycling in addition to the following universal equation:
Municipal Solid WasteRecycling Rate (%)
Total MSW Recycled
Total MSW Generated(MSW Recycled + MSW Disposed Of)
x 100
This worksheet will help you subtract from your current recycling rate those wastemanagement activities and waste materials that are outside the scope of thestandard recycling rate. In addition, those waste materials and recycling activitiesnot included in your current rate, but included in the standard rate and for whichyou have data, can be added using this worksheet.
A
How You Will Use The Information Obtained:
After converting to the standard recycling rate, you will be able to make consistent comparisonsof your recycling efforts and the efforts of others.
Who Should Use This Worksheet:
State and local governments that currently have a recycling measurement system in place andhave previously calculated a recycling rate.
Recy
clin
g M
easu
rem
ent
W
ORKSH
EET Converting to the
Standard RecyclingRate
=
18/11/97
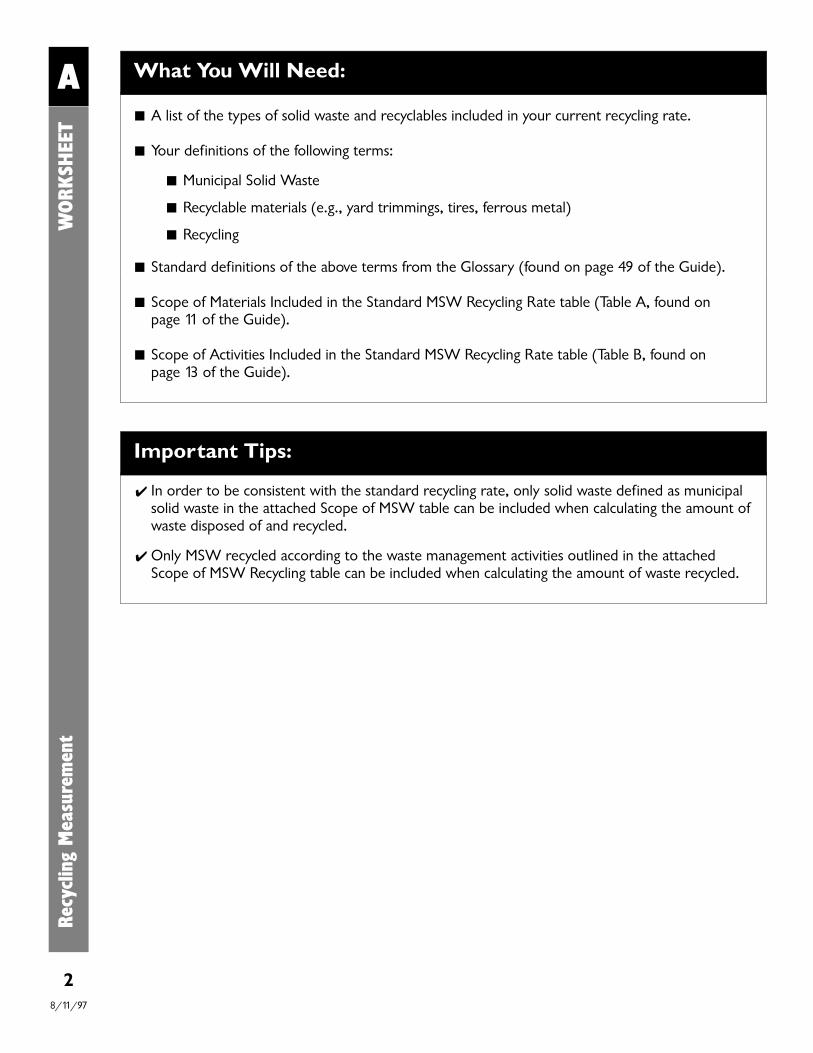
What You Will Need:
A list of the types of solid waste and recyclables included in your current recycling rate.
Your definitions of the following terms:
Municipal Solid Waste
Recyclable materials (e.g., yard trimmings, tires, ferrous metal)
Recycling
Standard definitions of the above terms from the Glossary (found on page 49 of the Guide).
Scope of Materials Included in the Standard MSW Recycling Rate table (Table A, found on page 11 of the Guide).
Scope of Activities Included in the Standard MSW Recycling Rate table (Table B, found on page 13 of the Guide).
Important Tips:
✔ In order to be consistent with the standard recycling rate, only solid waste defined as municipalsolid waste in the attached Scope of MSW table can be included when calculating the amount ofwaste disposed of and recycled.
✔ Only MSW recycled according to the waste management activities outlined in the attached Scope of MSW Recycling table can be included when calculating the amount of waste recycled.
ARe
cycl
ing
Mea
sure
men
t
WORK
SHEE
T
28/11/97

A Converting to the Standard Recycling RateRe
cycl
ing
Mea
sure
men
t
WORK
SHEE
T
3
1. Calculating Waste Disposal
1A. Using the Scope of MSW table and the definition of MSW found in the Glossary, determine if there areany waste materials not included in your current recycling rate. Add those waste materials for whichyou have current disposal data and that are defined as MSW in the standard recycling rate. Enter theamount disposed of for these wastes below. Remember, add materials only if you already have currentdisposal data available.
ADDITIONAL MSW AMOUNT DISPOSED OF (tons)
TOTAL ADDITIONAL MSW (tons)
1B.MATERIALS EXCLUDED FROM MSW
ANNUAL AMOUNT DISPOSED OF (tons)
Abatement Debris
Agricultural Waste
Asphalt
Batteries From Aircraft, Military Vehicles, Boats, Heavy-Duty Trucks, and Tractors
Combustion Ash
Concrete
Construction and Demolition Debris (C&D)
Contaminated Soil
Ferrous Metals From Transportation Equipment and C&D projects
Food Processing Waste
Glass From Transportation Equipment and C&D Projects
Industrial Sludges
1B. Only MSW can be included in the standard recycling rate. The wastes listed in the table below areexcluded from the definition of MSW in the standard recycling rate. Using your most recent data onwaste disposal, fill in the annual amount disposed of for each excluded waste included in your currentrecycling rate. Refer to the Glossary and Scope of MSW table for further clarification of the terms usedhere. If you are unable to disaggregate these excluded wastes from your current data, use Worksheet B2,Part 3, to estimate the total amount of MSW generated.
8/11/97

1B.MATERIALS EXCLUDED FROM MSW
ANNUAL AMOUNT DISPOSED OF (tons)
Mining Waste
Municipal Sludges
Natural Disaster Debris
Nonferrous Metals From Industrial or Construction Sources
Oil and Gas Waste
Plastics From Transportation Equipment
Preconsumer Waste
Used Oil
Wood From C&D Activities
TOTAL EXCLUDED WASTES (tons)
1C. Total MSW Disposed Of
__________________Total Waste Disposed Of
(based on your most recent data)
__________________Total
Additional MSW(from 1A)
__________________Total
Excluded Wastes(from 1B)
________________Total
MSW Disposed Of(tons)
=–+
ARe
cycl
ing
Mea
sure
men
t
WORK
SHEE
T
4
2A.RECYCLABLE MATERIAL
TOTAL (tons)
Commingled Materials
Food Waste
Glass Containers:
Clear
Amber
Green
Mixed Glass
Other Glass
Subtotal Glass
Lead-Acid Batteries
2. Calculating Recycling
2A. Using the Scope of MSW Recycling table, determine if there are recycling activities that can be added toyour current recycling rate. If you have current data for a recycling activity listed in the table, andit is not included in your current rate, specify the type and amount of material recycled below.Remember, add materials only if you already have current recycling data available.
8/11/97
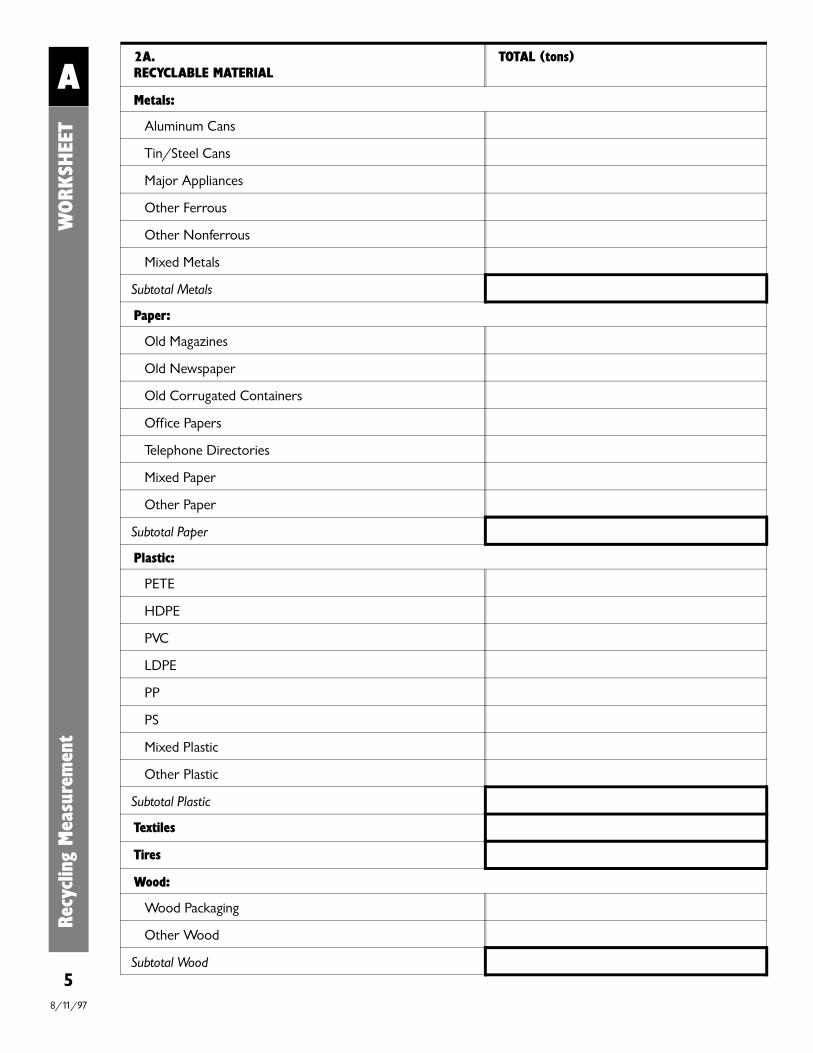
2A.RECYCLABLE MATERIAL
TOTAL (tons)
Metals:
Aluminum Cans
Tin/Steel Cans
Major Appliances
Other Ferrous
Other Nonferrous
Mixed Metals
Subtotal Metals
Paper:
Old Magazines
Old Newspaper
Old Corrugated Containers
Office Papers
Telephone Directories
Mixed Paper
Other Paper
Subtotal Paper
Plastic:
PETE
HDPE
PVC
LDPE
PP
PS
Mixed Plastic
Other Plastic
Subtotal Plastic
Textiles
Tires
Wood:
Wood Packaging
Other Wood
Subtotal Wood
ARe
cycl
ing
Mea
sure
men
t
WORK
SHEE
T
58/11/97

2B. The waste management activities listed in the table below are excluded from the standard recycling rate.For each excluded activity included in your current recycling rate, fill in the annual amount of wasterecovered in your state or locality according to that method. Use your most recent data. Refer to theGlossary and Scope of MSW Recycling table for further clarification of the terms used here.
ACTIVITIES EXCLUDED FROM THE STANDARD RECYCLING RATE
AMOUNT RECOVERED (TONS)
Alternative Daily Landfill Cover
Backyard Composting of Yard Trimmings and Food Waste
Combustion
Grasscycling
Mulching of Tree Stumps From C&D Debris
Recycling of Materials Excluded From MSW (from 1B)
Reuse (see Scope of MSW Recycling table)
Source Reduction
TOTAL (tons)
2A.RECYCLABLE MATERIAL
TOTAL (tons)
Yard Trimmings:
Brush and Branches
Grass
Leaves
Tree Stumps
Mixed Yard Trimmings
Subtotal Yard Trimmings
Other Recyclables:
________________________________________
________________________________________
Subtotal Other Recyclables
TOTAL (tons)
A
6
Recy
clin
g M
easu
rem
ent
WORK
SHEE
T
2C. Total MSW Recycled
__________________Total Waste Recycled(based on your most
recent data)
__________________Total
Additional Recycling(from 2A)
__________________Total
Excluded Amount(from 2B)
________________Total
MSW Recycled(tons)
=–+
8/11/97

ARe
cycl
ing
Mea
sure
men
t
WORK
SHEE
T
7
3. Calculating a Standard Recycling Rate
3A. MSW Recycling Rate (%)
[______________Total MSW Recycled (from 2C)
(________________Total MSW
Recycled(from 2C)
______________ )]Total MSW Disposed Of
(from 1C)
_______________MSW
Recycling Rate (%)
x 100 =# +
8/11/97

Use this worksheet to compile recycling data reported on the survey forms. Thetotal amount of MSW recycled in your state or locality is the numerator of therecycling rate equation.
B1Who Should Use This Worksheet:
State and local governments that do not currently have a recycling measurement system in placeand are calculating a recycling rate for the first time.
State and local governments that are redesigning their recycling measurement system accordingto the standard methodology.
What You Will Need:
Completed Survey Forms 1 (Collectors), 2 (Processors), and 3 (End Users).
How You Will Use The Information Obtained:
Recycling data will be used in conjunction with the waste generation data obtained in Worksheet B2 to calculate a recycling rate in Worksheet B3.
Important Tips:
✔ Before you begin, group all the survey forms together according to number.
✔ If you received incomplete information on any part of a survey form, follow up with therespondent in order to complete the data.
✔ If you received data from more than one type of respondent (e.g., collectors and processors), usethe tables in Parts 1 and 2 to:
✔ Verify the data received from one source by cross-checking it with data received fromanother source.
✔ Identify redundant data and instances of possible double counting.
✔ If you received data on Commingled Materials from respondents, use the procedure provided toestimate the weight of each component material.
✔ Check to make sure that the data reported on the survey forms is in tons before you begin tocomplete this worksheet. If it is not in tons, use the standard volume-to-weight conversion factorsto convert the data into tons.
Determining the Amount ofMunicipal Solid Waste(MSW) Recycled
Recy
clin
g M
easu
rem
ent
W
ORKSH
EET
18/11/97
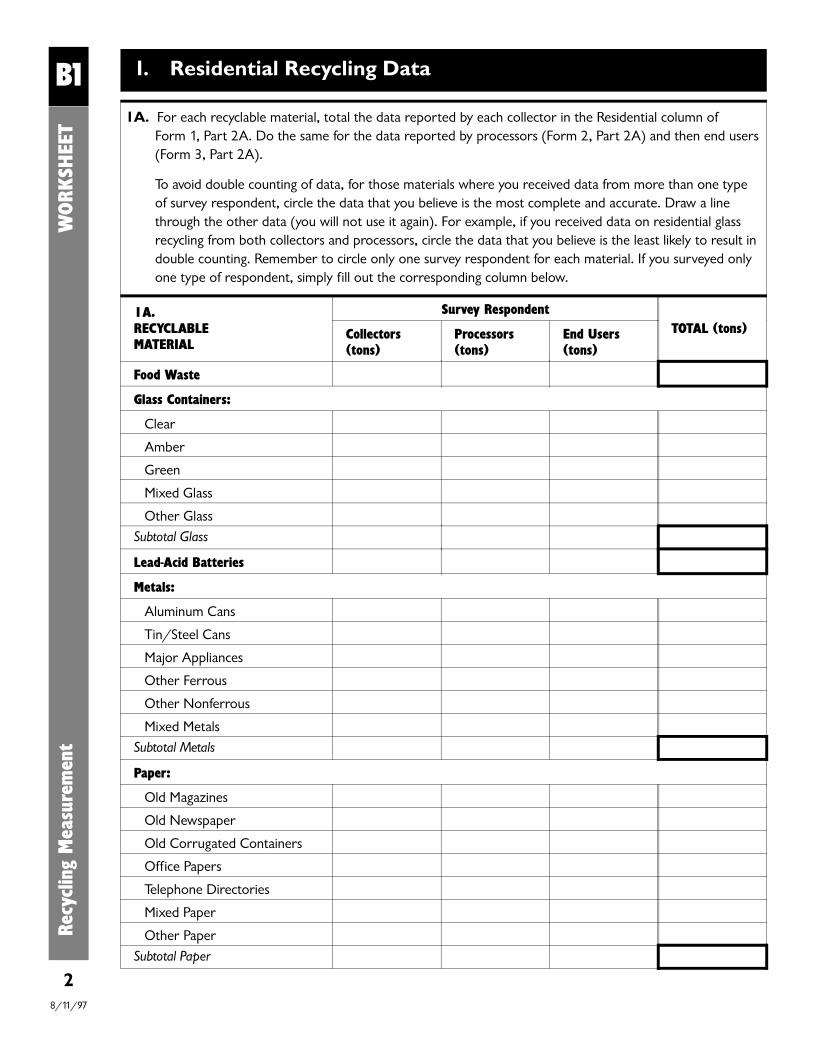
Recy
clin
g M
easu
rem
ent
W
ORKSH
EET
B1 1. Residential Recycling Data
1A. For each recyclable material, total the data reported by each collector in the Residential column of Form 1, Part 2A. Do the same for the data reported by processors (Form 2, Part 2A) and then end users(Form 3, Part 2A).
To avoid double counting of data, for those materials where you received data from more than one typeof survey respondent, circle the data that you believe is the most complete and accurate. Draw a linethrough the other data (you will not use it again). For example, if you received data on residential glassrecycling from both collectors and processors, circle the data that you believe is the least likely to result indouble counting. Remember to circle only one survey respondent for each material. If you surveyed onlyone type of respondent, simply fill out the corresponding column below.
2
1A.RECYCLABLE MATERIAL
Survey RespondentTOTAL (tons)Collectors
(tons)Processors(tons)
End Users(tons)
Food Waste
Glass Containers:
Clear
Amber
Green
Mixed Glass
Other GlassSubtotal Glass
Lead-Acid Batteries
Metals:
Aluminum Cans
Tin/Steel Cans
Major Appliances
Other Ferrous
Other Nonferrous
Mixed Metals
Subtotal Metals
Paper:
Old Magazines
Old Newspaper
Old Corrugated Containers
Office Papers
Telephone Directories
Mixed Paper
Other Paper
Subtotal Paper
8/11/97

1A.RECYCLABLE MATERIAL
Survey RespondentTOTAL (tons)Collectors
(tons)Processors(tons)
End Users(tons)
Plastic:
PETE
HDPE
PVC
LDPE
PP
PS
Mixed Plastic
Other Plastic
Subtotal Plastic
Textiles
Tires
Wood:
Wood Packaging
Other Wood
Subtotal Wood
Yard Trimmings:
Brush and Branches
Grass
Leaves
Tree Stumps
Mixed Yard Trimmings
Subtotal Yard Trimmings
Other Recyclables:
_________________________
_________________________
_________________________
Subtotal Other Recyclables
TOTAL (tons)
B1
3
Recy
clin
g M
easu
rem
ent
W
ORKSH
EET
8/11/97

1B. If you received data from survey respondents on Commingled Materials for residential programs, use thefollowing method to estimate the weight of each recyclable material that makes up the commingledcategory. Tons for each material should be entered separately into the corresponding category in the tablein Part 1A. You will need to complete this exercise for each different type of commingled mix reported onthe survey forms.
Step 1: Based on the comments received on the survey forms, list the individual recyclable materials that make upCommingled Materials in Column 1 of the blank table titled Actual Data.
B. Step 2: Using the national recovery data in the reference table below as default data, estimate the percentage ofeach material in the commingled mix, and then enter the percentages in Column 2 of the blank table. Forexample, if your mix consists of aluminum cans and steel cans, you would have a total of 2,670 tons ofmaterials (1,120 + 1,550) according to the reference table. This is equal to a mix consisting of 42%aluminum cans and 58% steel cans by weight. To arrive at these percentages, divide the tons of eachmaterial by the total tons for the mix (e.g., 1,120/2,670 x 100 = 42%).
B. Step 3: Apply the percentages calculated in Step 2 to the total commingled tons reported on the survey forms toarrive at a weight for each recyclable material. For example, if you determined in Step 2 that thecommingled mix is 42% aluminum cans by weight according to the reference table, and the total forcommingled materials reported on the survey forms is 10,000 tons, then the actual amount of aluminumcans is 4,200 tons (42% x 10,000).
B. Step 4: Enter the tons from Step 3 in Column 3 of the blank table. Finally, add these amounts to thecorresponding material totals in the table in Part 1A.
Reference Data:
Recovery of Products in Municipal Solid Waste, 19951
Product Amount Recovered (in thousands of tons)
Aluminum Cans 990
Corrugated Boxes 18,480
Glass 3,140
Magazines 670
Newspaper 6,960
Office Paper 3,010
Plastic Bottles 490
Steel Cans 1,500
Telephone Directories 60
Third Class Mail 7101U.S. EPA. 1997. Characterization of Municipal Solid Waste in the United States: 1996 Update. EPA530-R-97-015. Washington, DC. (Please use the latest available version.)
B1
4
Recy
clin
g M
easu
rem
ent
W
ORKSH
EET
8/11/97

1B.
Example:
Recyclable Material (from Step 1) Percentage (from Step 2) Tons (from Step 3)*
Aluminum Cans 19% 190 tons
Steel Cans 27% 270 tons
Glass Bottles 54% 540 tons
*Assume a total of 1,000 tons of Commingled Materials.
Actual Data:
Recyclable Material (from Step 1) Percentage (from Step 2) Tons (from Step 3)
B1
5
Recy
clin
g M
easu
rem
ent
W
ORKSH
EET
8/11/97
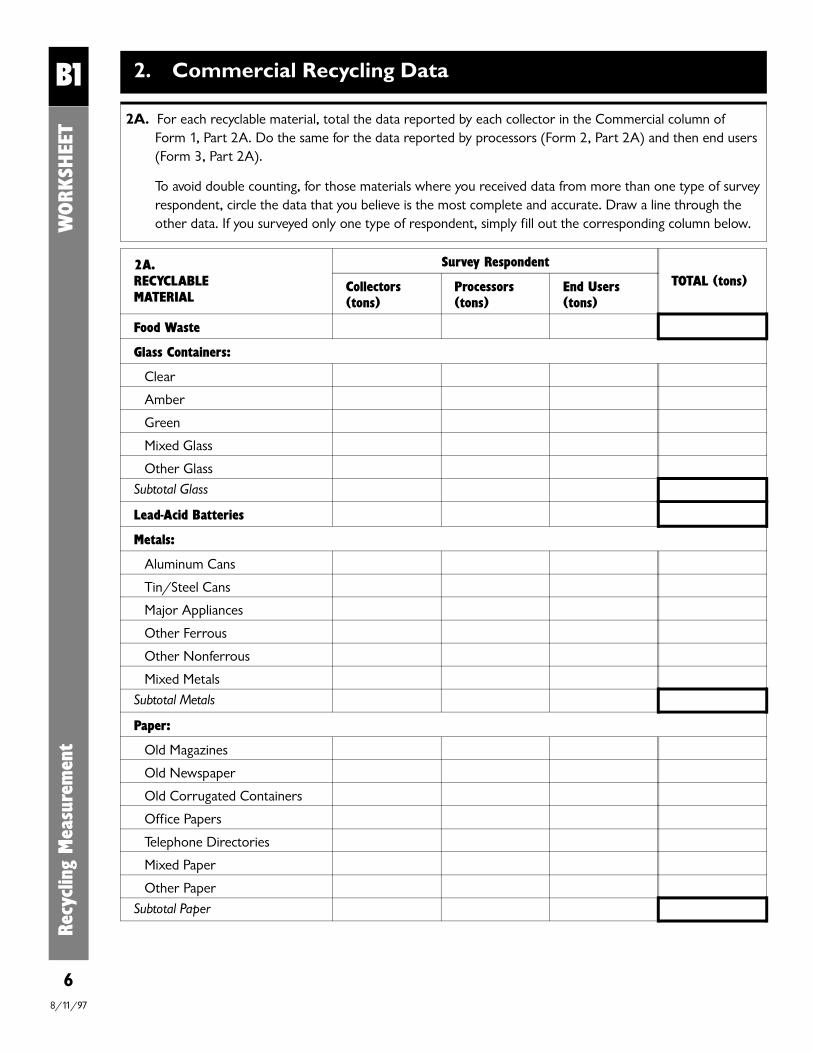
2. Commercial Recycling Data
2A. For each recyclable material, total the data reported by each collector in the Commercial column of Form 1, Part 2A. Do the same for the data reported by processors (Form 2, Part 2A) and then end users(Form 3, Part 2A).
To avoid double counting, for those materials where you received data from more than one type of surveyrespondent, circle the data that you believe is the most complete and accurate. Draw a line through theother data. If you surveyed only one type of respondent, simply fill out the corresponding column below.
2A.RECYCLABLE MATERIAL
Survey RespondentTOTAL (tons)Collectors
(tons)Processors(tons)
End Users(tons)
Food Waste
Glass Containers:
Clear
Amber
Green
Mixed Glass
Other GlassSubtotal Glass
Lead-Acid Batteries
Metals:
Aluminum Cans
Tin/Steel Cans
Major Appliances
Other Ferrous
Other Nonferrous
Mixed Metals
Subtotal Metals
Paper:
Old Magazines
Old Newspaper
Old Corrugated Containers
Office Papers
Telephone Directories
Mixed Paper
Other Paper
Subtotal Paper
B1
6
Recy
clin
g M
easu
rem
ent
W
ORKSH
EET
8/11/97

2A.RECYCLABLE MATERIAL
Survey RespondentTOTAL (tons)Collectors
(tons)Processors(tons)
End Users(tons)
Plastic:
PETE
HDPE
PVC
LDPE
PP
PS
Mixed Plastic
Other Plastic
Subtotal Plastic
Textiles
Tires
Wood:
Wood Packaging
Other Wood
Subtotal Wood
Yard Trimmings:
Brush and Branches
Grass
Leaves
Tree Stumps
Mixed Yard Trimmings
Subtotal Yard Trimmings
Other Recyclables:
_________________________
_________________________
_________________________
Subtotal Other Recyclables
TOTAL (tons)
B1
7
Recy
clin
g M
easu
rem
ent
W
ORKSH
EET
8/11/97
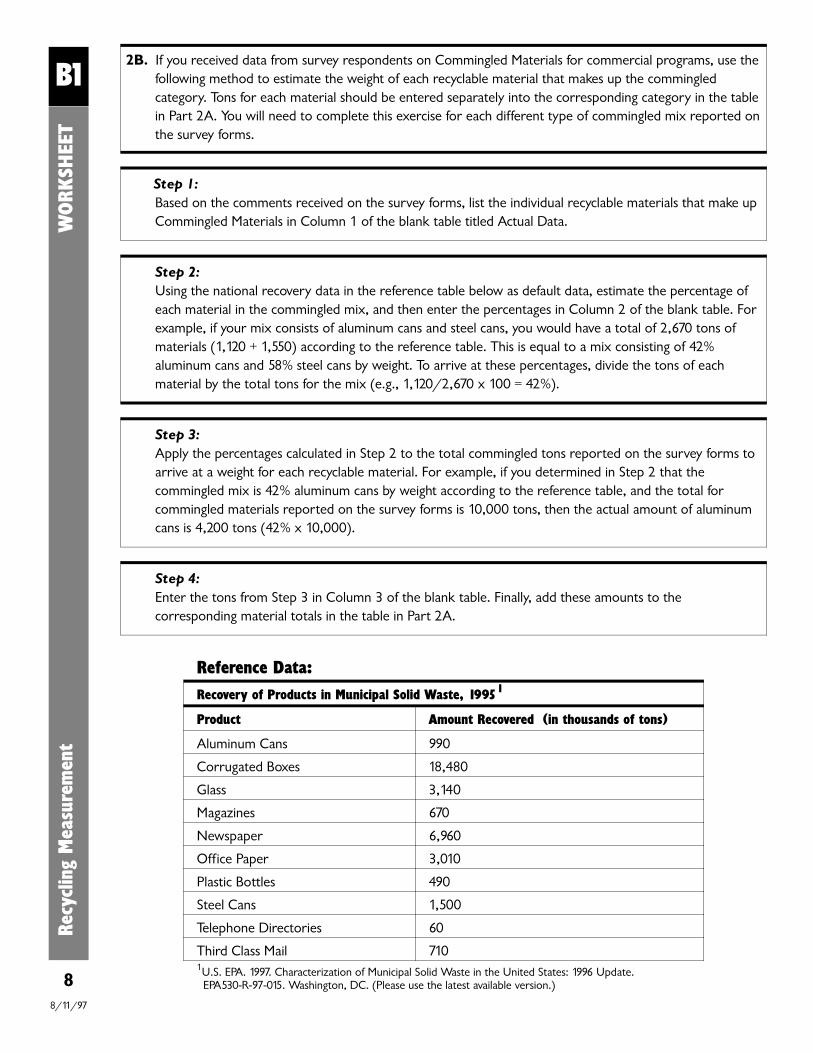
B1
8
Recy
clin
g M
easu
rem
ent
W
ORKSH
EET
2B. If you received data from survey respondents on Commingled Materials for commercial programs, use thefollowing method to estimate the weight of each recyclable material that makes up the commingledcategory. Tons for each material should be entered separately into the corresponding category in the tablein Part 2A. You will need to complete this exercise for each different type of commingled mix reported onthe survey forms.
Step 1: Based on the comments received on the survey forms, list the individual recyclable materials that make upCommingled Materials in Column 1 of the blank table titled Actual Data.
B. Step 2: Using the national recovery data in the reference table below as default data, estimate the percentage ofeach material in the commingled mix, and then enter the percentages in Column 2 of the blank table. Forexample, if your mix consists of aluminum cans and steel cans, you would have a total of 2,670 tons ofmaterials (1,120 + 1,550) according to the reference table. This is equal to a mix consisting of 42%aluminum cans and 58% steel cans by weight. To arrive at these percentages, divide the tons of eachmaterial by the total tons for the mix (e.g., 1,120/2,670 x 100 = 42%).
B. Step 3: Apply the percentages calculated in Step 2 to the total commingled tons reported on the survey forms toarrive at a weight for each recyclable material. For example, if you determined in Step 2 that thecommingled mix is 42% aluminum cans by weight according to the reference table, and the total forcommingled materials reported on the survey forms is 10,000 tons, then the actual amount of aluminumcans is 4,200 tons (42% x 10,000).
B. Step 4: Enter the tons from Step 3 in Column 3 of the blank table. Finally, add these amounts to thecorresponding material totals in the table in Part 2A.
Reference Data:
Recovery of Products in Municipal Solid Waste, 19951
Product Amount Recovered (in thousands of tons)
Aluminum Cans 990
Corrugated Boxes 18,480
Glass 3,140
Magazines 670
Newspaper 6,960
Office Paper 3,010
Plastic Bottles 490
Steel Cans 1,500
Telephone Directories 60
Third Class Mail 7101U.S. EPA. 1997. Characterization of Municipal Solid Waste in the United States: 1996 Update. EPA530-R-97-015. Washington, DC. (Please use the latest available version.)
8/11/97

2B.
Example:
Recyclable Material (from Step 1) Percentage (from Step 2) Tons (from Step 3)*
Aluminum Cans 19% 190 tons
Steel Cans 27% 270 tons
Glass Bottles 54% 540 tons
*Assume a total of 1,000 tons of Commingled Materials.
Actual Data:
Recyclable Material (from Step 1) Percentage (from Step 2) Tons (from Step 3)
B1
9
Recy
clin
g M
easu
rem
ent
W
ORKSH
EET
8/11/97
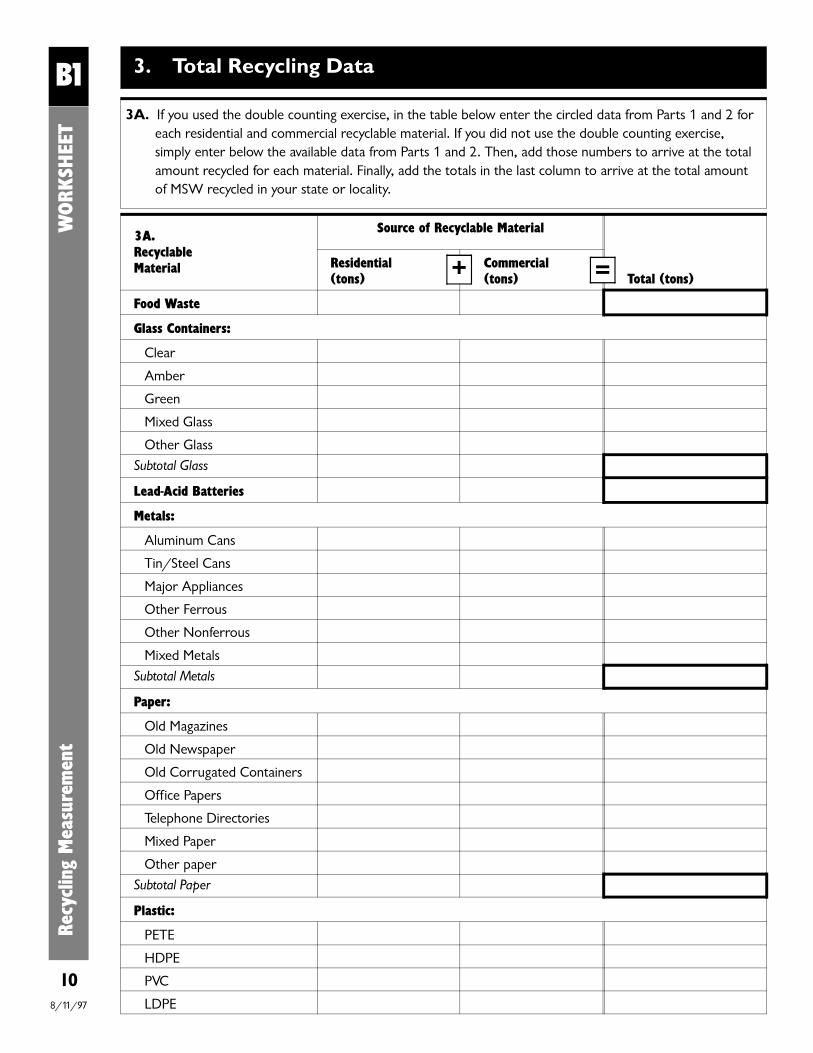
3. Total Recycling Data
3A. If you used the double counting exercise, in the table below enter the circled data from Parts 1 and 2 foreach residential and commercial recyclable material. If you did not use the double counting exercise,simply enter below the available data from Parts 1 and 2. Then, add those numbers to arrive at the totalamount recycled for each material. Finally, add the totals in the last column to arrive at the total amountof MSW recycled in your state or locality.
3A.Recyclable Material
Source of Recyclable Material
Residential(tons)
Commercial(tons) Total (tons)
Food Waste
Glass Containers:
Clear
Amber
Green
Mixed Glass
Other Glass
Subtotal Glass
Lead-Acid Batteries
Metals:
Aluminum Cans
Tin/Steel Cans
Major Appliances
Other Ferrous
Other Nonferrous
Mixed Metals
Subtotal Metals
Paper:
Old Magazines
Old Newspaper
Old Corrugated Containers
Office Papers
Telephone Directories
Mixed Paper
Other paper
Subtotal Paper
Plastic:
PETE
HDPE
PVC
LDPE
=+
B1
10
Recy
clin
g M
easu
rem
ent
W
ORKSH
EET
8/11/97
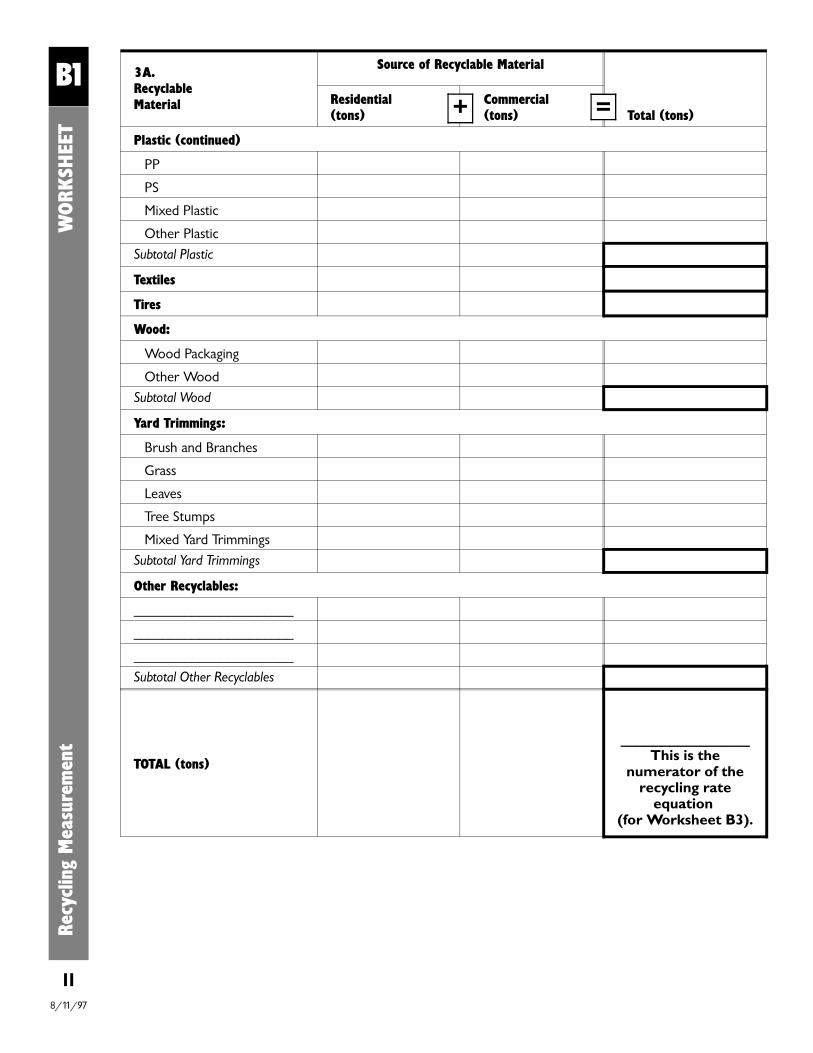
3A.Recyclable Material
Source of Recyclable Material
Residential(tons)
Commercial(tons) Total (tons)
Plastic (continued)
PP
PS
Mixed Plastic
Other Plastic
Subtotal Plastic
Textiles
Tires
Wood:
Wood Packaging
Other Wood
Subtotal Wood
Yard Trimmings:
Brush and Branches
Grass
Leaves
Tree Stumps
Mixed Yard Trimmings
Subtotal Yard Trimmings
Other Recyclables:
______________________
______________________
______________________Subtotal Other Recyclables
TOTAL (tons)
________________This is the
numerator of therecycling rate
equation (for Worksheet B3).
=+B1
11
Recy
clin
g M
easu
rem
ent
W
ORKSH
EET
8/11/97
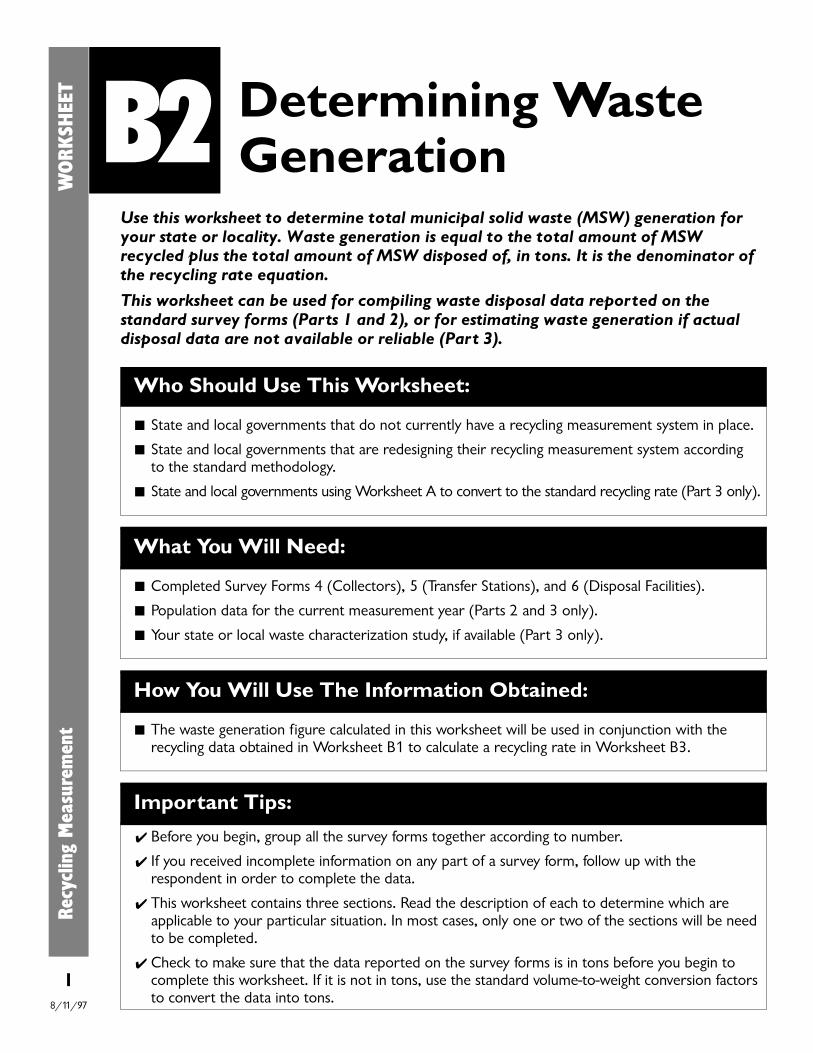
Use this worksheet to determine total municipal solid waste (MSW) generation foryour state or locality. Waste generation is equal to the total amount of MSWrecycled plus the total amount of MSW disposed of, in tons. It is the denominator ofthe recycling rate equation.
This worksheet can be used for compiling waste disposal data reported on thestandard survey forms (Parts 1 and 2), or for estimating waste generation if actualdisposal data are not available or reliable (Part 3).
B2
Who Should Use This Worksheet:
State and local governments that do not currently have a recycling measurement system in place.
State and local governments that are redesigning their recycling measurement system accordingto the standard methodology.
State and local governments using Worksheet A to convert to the standard recycling rate (Part 3 only).
What You Will Need:
Completed Survey Forms 4 (Collectors), 5 (Transfer Stations), and 6 (Disposal Facilities).
Population data for the current measurement year (Parts 2 and 3 only).
Your state or local waste characterization study, if available (Part 3 only).
How You Will Use The Information Obtained:
The waste generation figure calculated in this worksheet will be used in conjunction with therecycling data obtained in Worksheet B1 to calculate a recycling rate in Worksheet B3.
Important Tips:
✔ Before you begin, group all the survey forms together according to number.
✔ If you received incomplete information on any part of a survey form, follow up with therespondent in order to complete the data.
✔ This worksheet contains three sections. Read the description of each to determine which areapplicable to your particular situation. In most cases, only one or two of the sections will be needto be completed.
✔ Check to make sure that the data reported on the survey forms is in tons before you begin tocomplete this worksheet. If it is not in tons, use the standard volume-to-weight conversion factorsto convert the data into tons.
Determining WasteGeneration
Re
cycl
ing
Mea
sure
men
t
W
ORKSH
EET
18/11/97

Recy
clin
g M
easu
rem
ent
WORKSH
EET
B2
1. Compiling Waste Disposal Data
Complete this section if you have current survey data on waste disposal.
1A. In-State Disposal
For each type of survey respondent (i.e., collectors, transfer stations, disposal facilities), total theamount of residential MSW from sources within your state or locality that remained within your area(e.g., not hauled to a transfer station or disposal facility outside your state or locality). This data can befound on Forms 4, 5, and 6, Part 2A, first column. If you used more than one type of survey form tocollect data, be sure to not double count any data, i.e., MSW sent by a surveyed transfer station to asurveyed disposal facility. If you used only one type of survey form (e.g., Survey Form 5, TransferStations), simply fill out the corresponding column below.
Repeat the above procedure for commercial MSW.
MSW REMAININGINSIDE THE STATE ORLOCALITY
Survey RespondentTOTAL (tons)
Collectors TransferStations
DisposalFacilities
Residential (tons)
Commercial (tons)
Determining Waste Generation
2
1B. Exports
For each type of survey respondent, total the amount of residential MSW from sources within yourstate or locality that was exported from your area (e.g., hauled by a collector or transfer station to adisposal facility outside your state or locality). This data can be found on Forms 4 and 5, Part 2A,second column. Be sure to not double count any data, i.e., MSW sent by a surveyed collector to asurveyed transfer station.
Repeat the above procedure for commercial MSW.
MSW EXPORTSSurvey Respondent
TOTAL (tons)Collectors Transfer Stations
Residential (tons)
Commercial (tons)
TOTAL (tons)
8/11/97
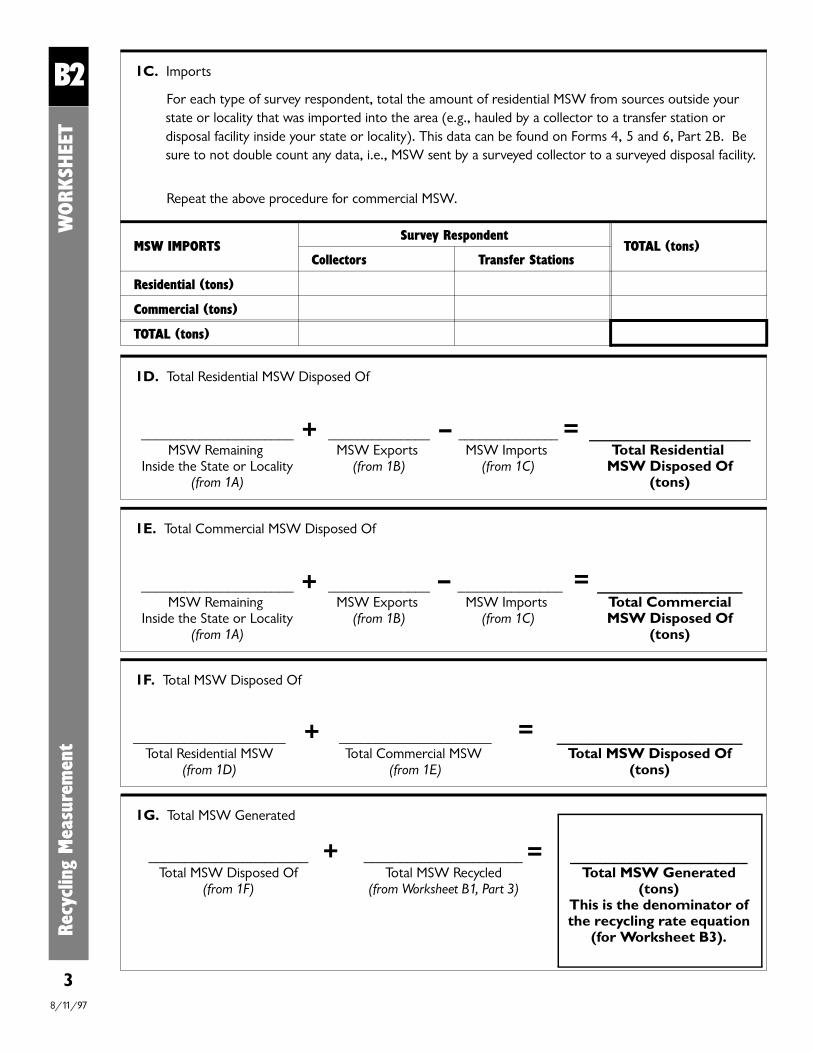
B2Re
cycl
ing
Mea
sure
men
t
WORKSH
EET
3
1C. Imports
For each type of survey respondent, total the amount of residential MSW from sources outside yourstate or locality that was imported into the area (e.g., hauled by a collector to a transfer station ordisposal facility inside your state or locality). This data can be found on Forms 4, 5 and 6, Part 2B. Besure to not double count any data, i.e., MSW sent by a surveyed collector to a surveyed disposal facility.
Repeat the above procedure for commercial MSW.
MSW IMPORTSSurvey Respondent
TOTAL (tons)Collectors Transfer Stations
Residential (tons)
Commercial (tons)
TOTAL (tons)
1D. Total Residential MSW Disposed Of
_____________________MSW Remaining
Inside the State or Locality(from 1A)
______________MSW Exports
(from 1B)
______________MSW Imports
(from 1C)
____________________Total Residential
MSW Disposed Of(tons)
– =+
1E. Total Commercial MSW Disposed Of
_____________________MSW Remaining
Inside the State or Locality(from 1A)
______________MSW Exports
(from 1B)
_______________MSW Imports
(from 1C)
__________________Total CommercialMSW Disposed Of
(tons)
– =+
1F. Total MSW Disposed Of
_____________________Total Residential MSW
(from 1D)
_____________________Total Commercial MSW
(from 1E)
_______________________Total MSW Disposed Of
(tons)
=+
1G. Total MSW Generated
______________________Total MSW Disposed Of
(from 1F)
______________________Total MSW Recycled
(from Worksheet B1, Part 3)
______________________Total MSW Generated
(tons)This is the denominator ofthe recycling rate equation
(for Worksheet B3).
=+
8/11/97
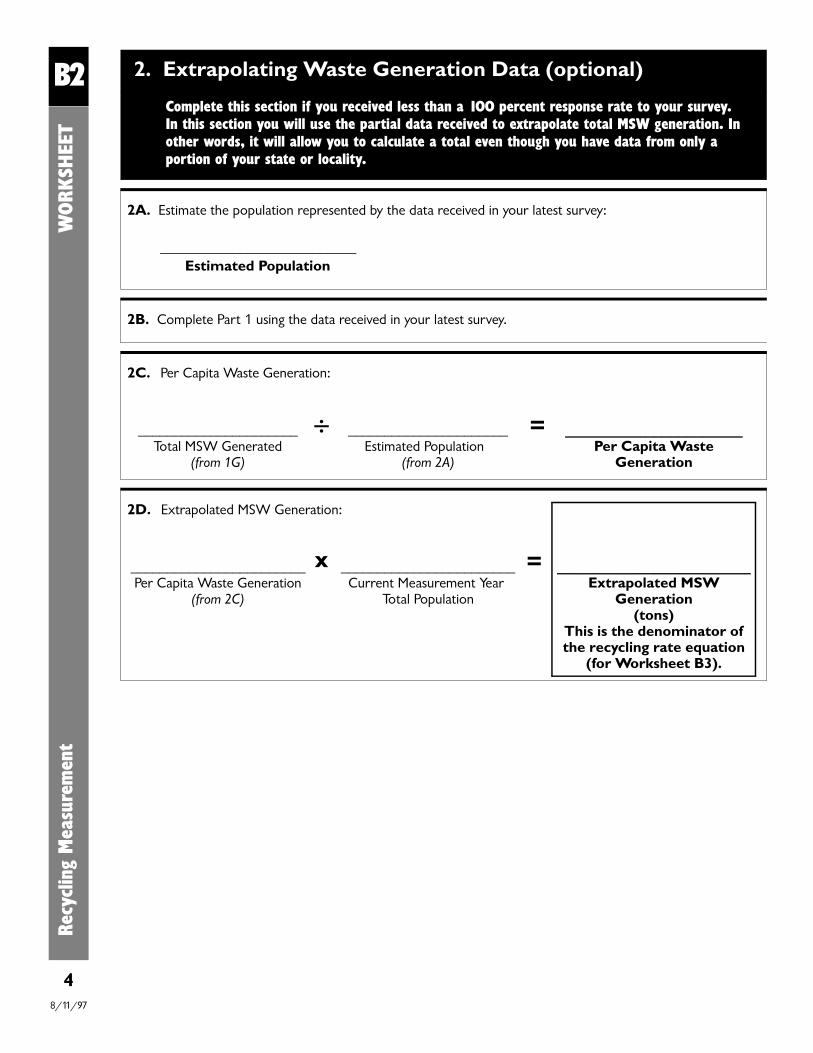
2. Extrapolating Waste Generation Data (optional)
Complete this section if you received less than a 100 percent response rate to your survey. In this section you will use the partial data received to extrapolate total MSW generation. Inother words, it will allow you to calculate a total even though you have data from only aportion of your state or locality.
2A. Estimate the population represented by the data received in your latest survey:
___________________________ Estimated Population
2B. Complete Part 1 using the data received in your latest survey.
2C. Per Capita Waste Generation:
______________________Total MSW Generated
(from 1G)
______________________Estimated Population
(from 2A)
______________________Per Capita Waste
Generation
2D. Extrapolated MSW Generation:
________________________Per Capita Waste Generation
(from 2C)
________________________Current Measurement Year
Total Population
________________________Extrapolated MSW
Generation(tons)
This is the denominator ofthe recycling rate equation
(for Worksheet B3).
=#
=x
B2Re
cycl
ing
Mea
sure
men
t
WORKSH
EET
48/11/97

3. Using Waste Characterization Data to Determine Waste Generation
Complete this section if you do not have the resources or authority to conduct annualsurveys, or if you are not confident in the data generated by your latest survey. This sectionwill allow you to estimate the total amount of MSW generated in your state or locality usingeither national default data or a waste characterization study, if available.
3A. If you have a state or local waste characterization study, use Worksheet A to determine if the scope ofwaste in your study is consistent with the scope of MSW used here. If inconsistencies exist, proceed toPart B to estimate MSW generation. Alternatively, you may complete Worksheet A to arrive at arecycling rate that has the same scope as the standard recycling rate. If inconsistencies do not exist, thencalculate estimated waste generation using the following method:
1) Per Capita Waste Generation:
______________________Total Annual MSW
Generated (from study)
______________________Total Population
(year of study)
______________________Per Capita Waste
Generation
2) Estimated Waste Generation:
______________________Per Capita Waste
Generation
______________________Current Measurement Year
Total Population
______________________Estimated MSW
Generation(tons)
This is the denominator ofthe recycling rate equation.
(for Worksheet B3).
3B. If you do not have a waste characterization study, or your study does not define MSW in the same wayas the standard definition used here, calculate estimated waste generation using the following equation:
1) Estimated Waste Generation:
________________________Current Measurement Year
Total Population
0.78 tons/person/year* ________________________Estimated Waste
Generation(tons)
This is the denominator ofthe recycling rate equation.
(for Worksheet B3).
*U.S. EPA. 1997. Characterization Study of Municipal Solid Waste in the United States: 1996 Update. EPA530-R-97-015. Washington, DC.
=#
=x
=x
B2Re
cycl
ing
Mea
sure
men
t
WORKSH
EET
58/11/97

Use this worksheet to determine your state or locality’s MSW recycling rate for thecurrent measurement year.
B3
Who Should Use This Worksheet:
State and local governments that do not currently have a recycling measurement system in placeand are establishing a recycling rate for the first time.
State and local governments that are redesigning their recycling measurement system accordingto the standard methodology.
What You Will Need:
Total MSW recycled from Worksheet B1.
Total MSW generated from Worksheet B2.
Calculating YourMunicipal Solid Waste(MSW) Recycling Rate
Rec
yclin
g M
easu
rem
ent
W
ORKSH
EET
18/11/97

Rec
yclin
g M
easu
rem
ent
W
ORKSH
EET
B3 1. Calculating Your Municipal Solid Waste Recycling Rate
Calculate your state or local MSW recycling rate according to the following equation:
___________________Total MSW Recycled (from Worksheet B1,
Part 3)
____________________Total MSW Generated(from Worksheet B2,
Part 1G, 2D, 3A, or 3B)
_____________________Municipal Solid Waste
Recycling Rate (%)
# x 100 =
28/11/97

United S
tates E
nvironmental P
rotection Agency
(5306W)
Washington, D
C 20460
Official B
usinessP
enalty for Private U
se$300