Embed Size (px)
Citation preview
EN
/FA
D10
900
15
Measuring Radio Network PerformanceMeasuring Radio Network Performance
Gunnar Heikkilä
AWARE – Advanced Wireless Algorithm Research & ExperimentsRadio Network Performance, Ericsson Research
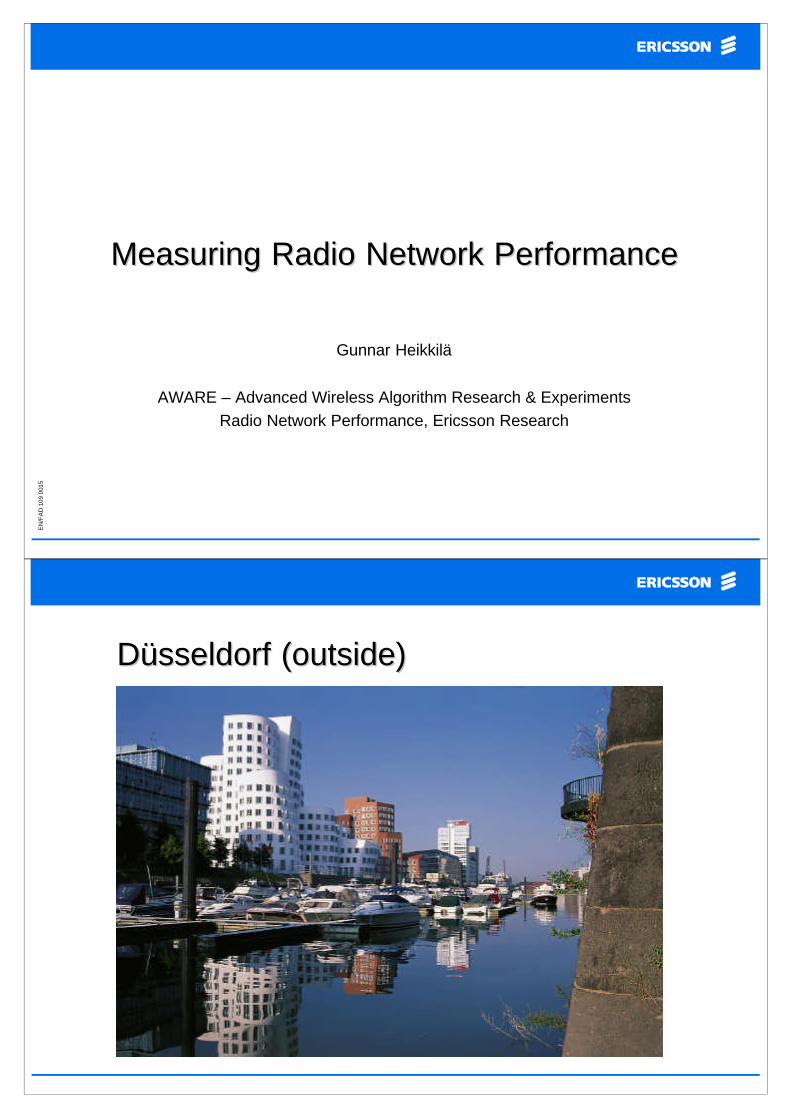
Düsseldorf (outside)Düsseldorf (outside)
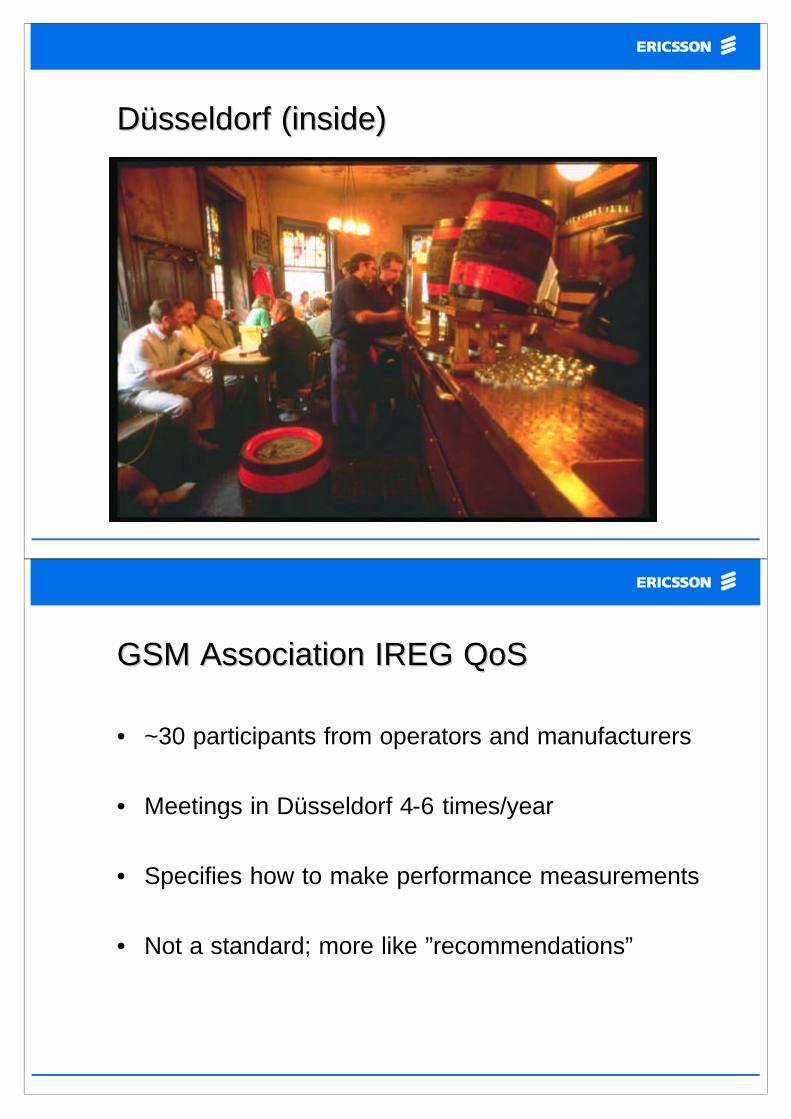
Düsseldorf (inside)Düsseldorf (inside)
GSM Association IREG QoSGSM Association IREG QoS
• ~30 participants from operators and manufacturers
• Meetings in Düsseldorf 4-6 times/year
• Specifies how to make performance measurements
• Not a standard; more like ”recommendations”

Anywhere, Anytime...Anywhere, Anytime...
Antennas and Base StationsAntennas and Base Stations

Cell PlanningCell Planning
Coverage MapsCoverage Maps
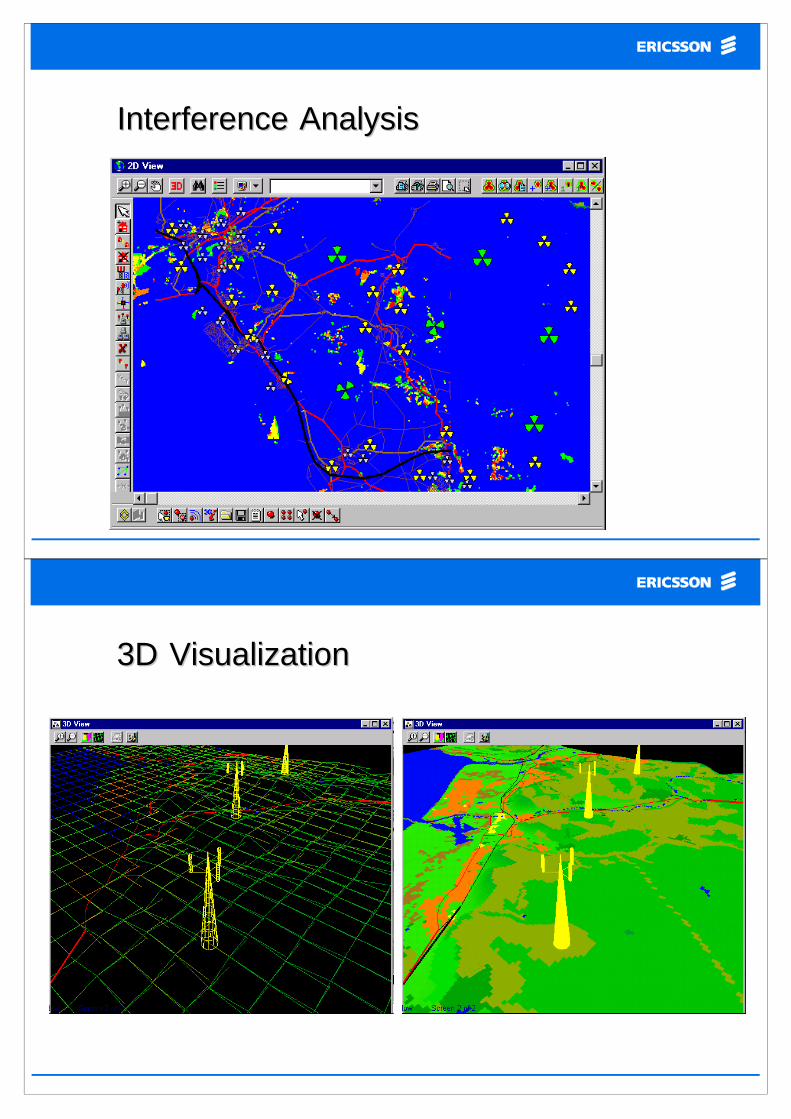
Interference AnalysisInterference Analysis
3D Visualization3D Visualization

System Metrica: Unsuccessful CallsSystem Metrica: Unsuccessful Calls
Unsuccessful Call Attempts
0.0%
0.5%
1.0%
1.5%
2.0%
2.5%
3.0%
Netw ork 1 Netw ork 2 Netw ork 3 Netw ork 4
% No Service
% Blocked
System Metrica: Dropped CallsSystem Metrica: Dropped Calls
% Dropped Calls
2.5%
5.6% 5.8%
7.6%
0.0%
1.0%
2.0%
3.0%
4.0%
5.0%
6.0%
7.0%
8.0%
9.0%
Network 1 Network 2 Network 3 Network 4
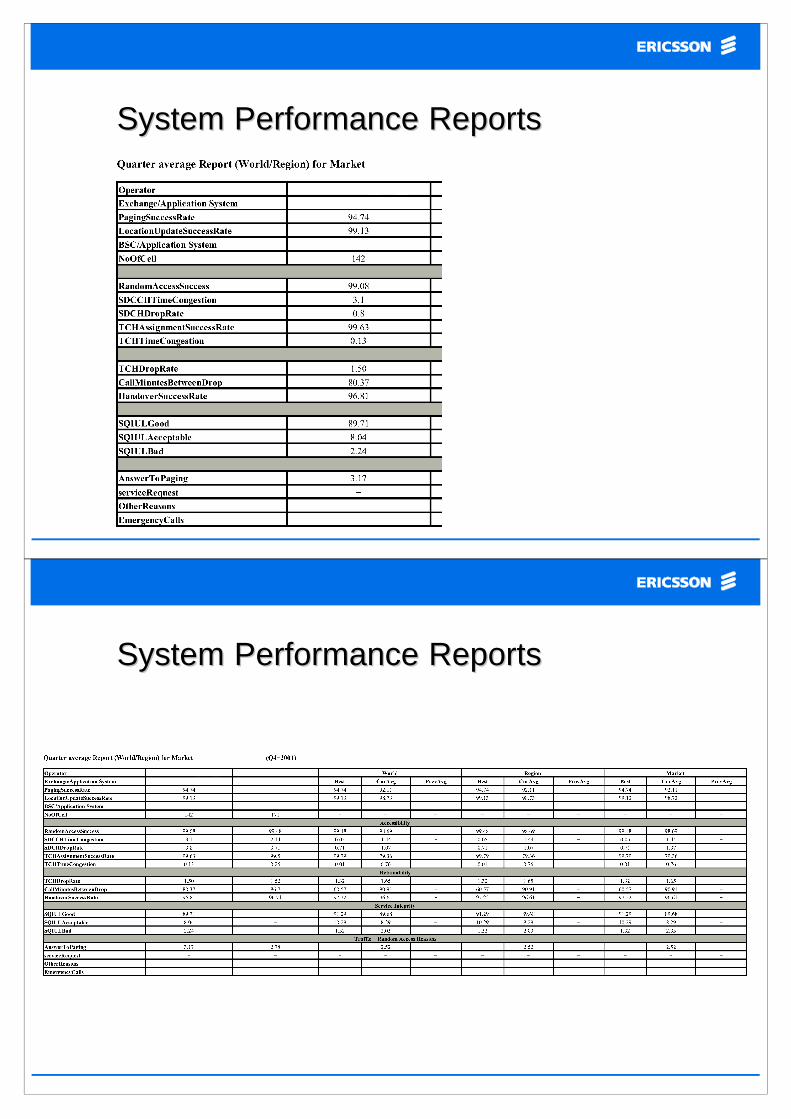
System Performance ReportsSystem Performance Reports
System Performance ReportsSystem Performance Reports
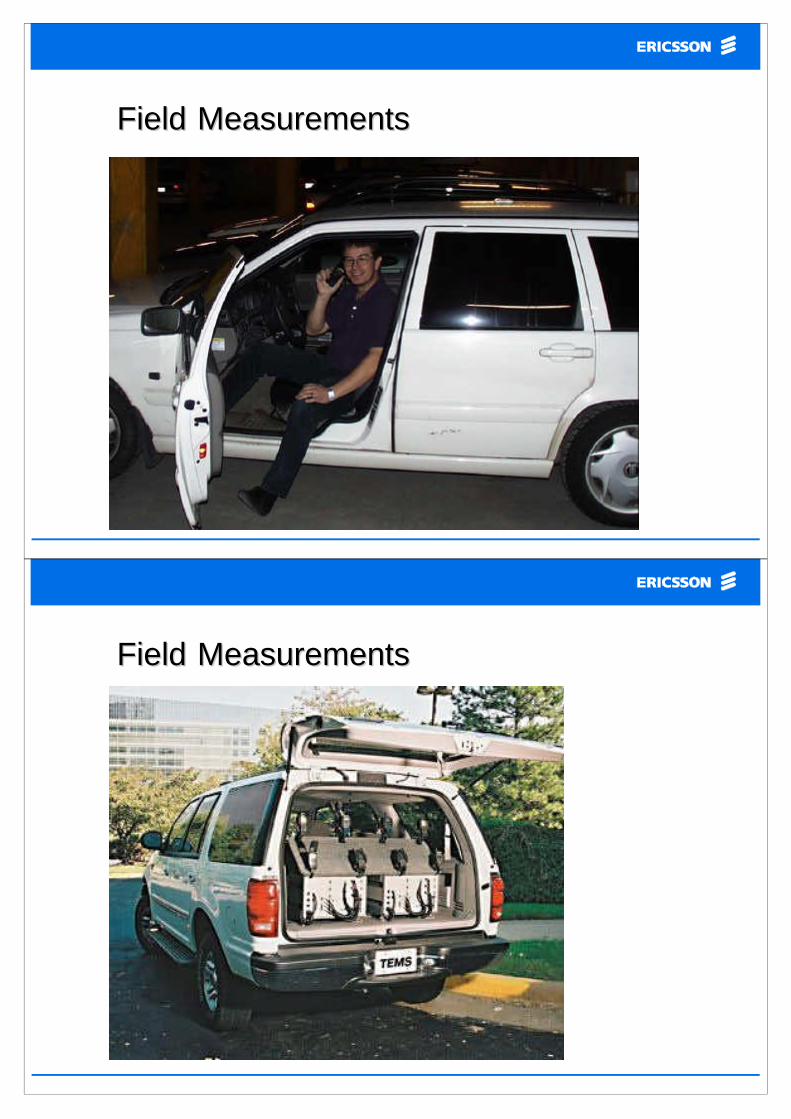
Field MeasurementsField Measurements
Field MeasurementsField Measurements

S t ö r a r e
What Should Be Measured?What Should Be Measured?
• Coverage
• Interference
• Speech Quality
• Data Quality
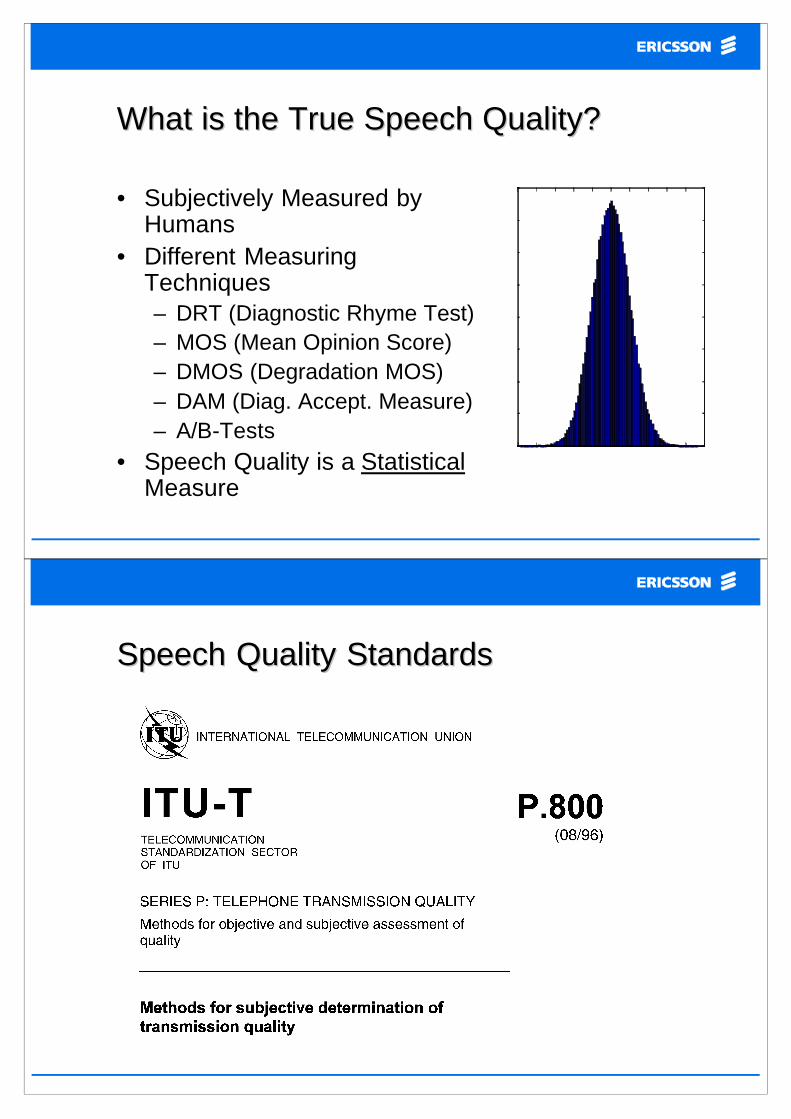
What is the True Speech Quality?What is the True Speech Quality?
• Subjectively Measured byHumans
• Different MeasuringTechniques– DRT (Diagnostic Rhyme Test)– MOS (Mean Opinion Score)– DMOS (Degradation MOS)– DAM (Diag. Accept. Measure)– A/B-Tests
• Speech Quality is a StatisticalMeasure
Speech Quality StandardsSpeech Quality Standards

P.800: MOS and DMOS ScalesP.800: MOS and DMOS Scales
Grade Quality Distortion Level
5 Excellent Imperceptible
4 Good Just perceptible but notannoying
3 Fair Perceptible and slightlyannoying
2 Poor Annoying but notobjectionable
1 Bad Very annoying andobjectionable
Speech DependenciesSpeech Dependencies
• Speaker pitch and formant structure (male - female -children)– High dependency
• Sentence contents– Medium to high dependency
• Language– Relatively low dependency
• Relevant measure– Statistical average

P.862P.862 -- PESQPESQ
Objective MethodsObjective Methods
0 1 2 3 4 5 6-2
-1
0
1
2x 10
4
Transmitted speech
0 1 2 3 4 5 6-2
-1
0
1
2x 10
4
Received speech
sweep_jum
p
Jump

Examples Of Bad Speech QualityExamples Of Bad Speech Quality
• Audio levels• Noise• Background noise• Bit errors• Erased frames• Echo• Discontinuous transmission• Time warping• Delay
PESQ StructurePESQ Structure

Level AndLevel AndTime AlignmentTime Alignment
IRS FilteringIRS Filtering

Level AndLevel AndTime AlignmentTime Alignment
Synchronisation DependencySynchronisation Dependency
0 50 100 150 200 250 300 350 400-20
-15
-10
-5
0
5
10
15
20
25
30
Spe
ech
Qu
ality
Est
ima
te
Sentence
Correct5 ms error10 ms20 ms

PerceptualPerceptualModellingModelling
The Bark ScaleThe Bark Scale

PerceptualPerceptualModellingModelling
The Sone ScaleThe Sone Scale

PerceptualPerceptualModellingModelling
Norm AggregatingNorm Aggregating
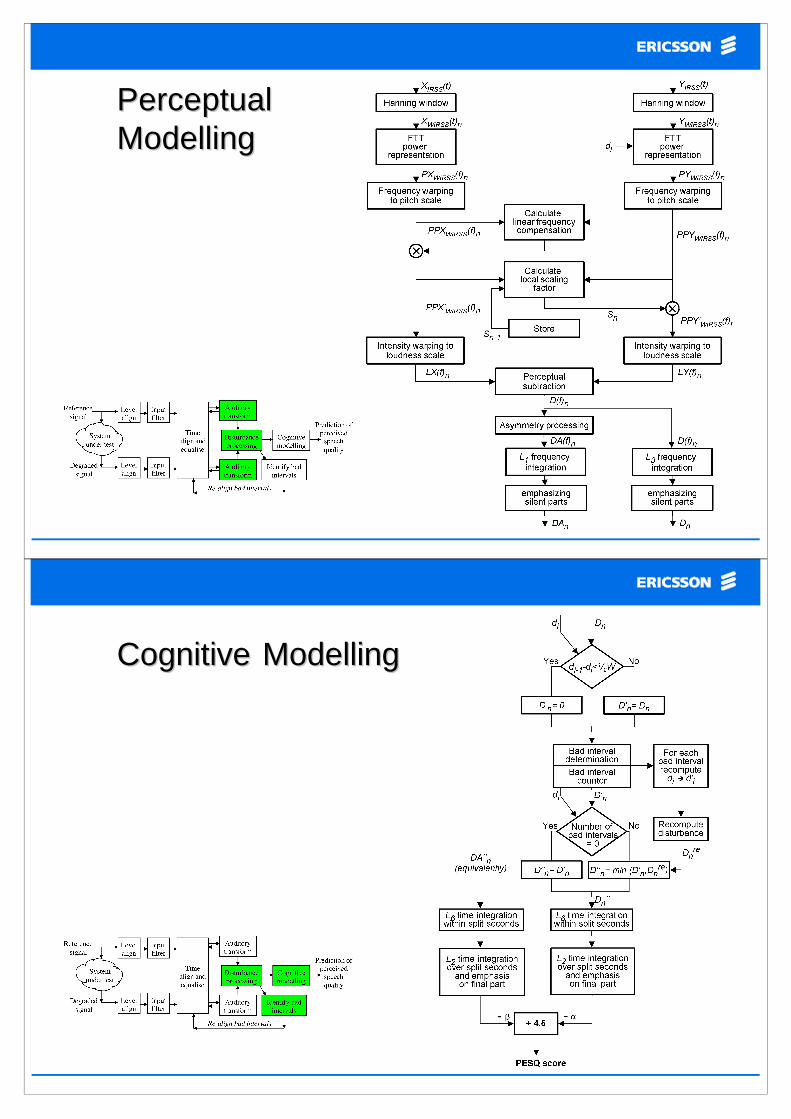
PerceptualPerceptualModellingModelling
Cognitive ModellingCognitive Modelling
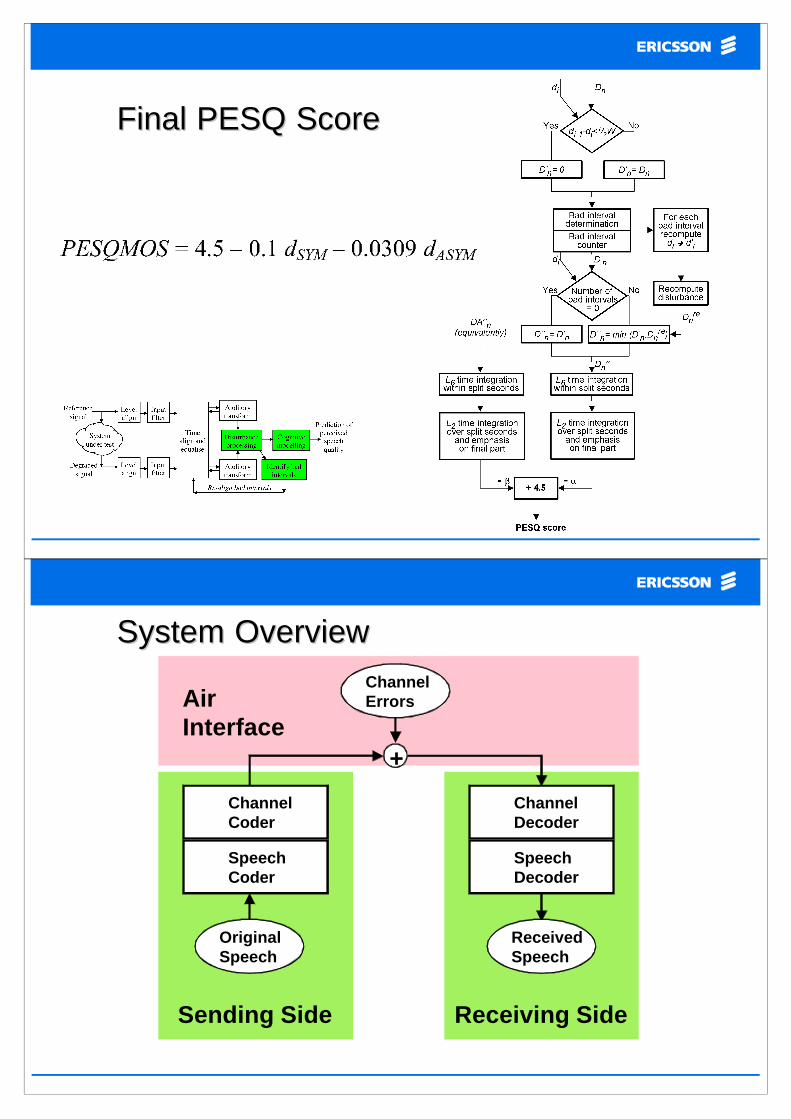
Final PESQ ScoreFinal PESQ Score
System OverviewSystem Overview
SpeechCoder
ChannelCoder
SpeechDecoder
ChannelDecoder
ChannelErrors
ReceivedSpeech
OriginalSpeech
+
Sending Side Receiving Side
AirInterface

What Affects Speech Quality?What Affects Speech Quality?
• Most important– Codec capabilities– Radio channel disturbancies
• Also relevant– Mobile type– Background noise– Speech contents– Echo problems
ModellingModelling PrinciplePrinciple
SpeechDecoder
ChannelDecoder
Receiving Side
ReceivedSpeech
Parameters &Transforms
MultivariateModelling Model
Recordings &Listenings
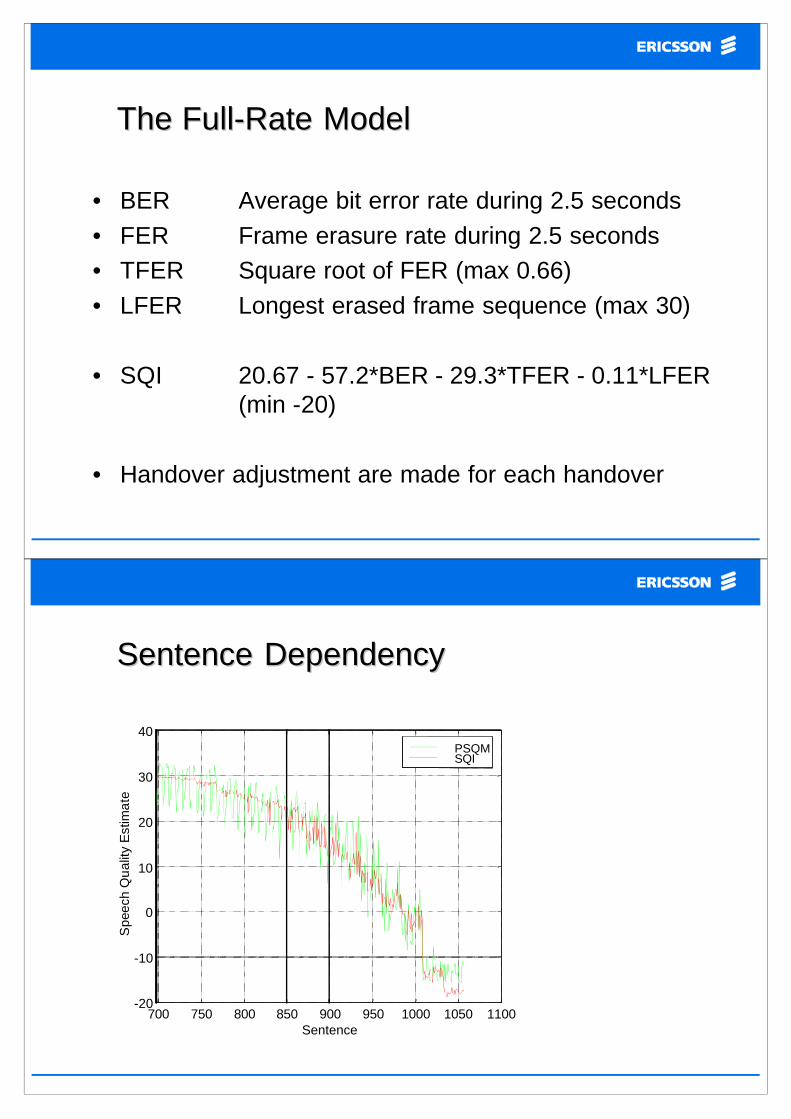
The FullThe Full--Rate ModelRate Model
• BER Average bit error rate during 2.5 seconds• FER Frame erasure rate during 2.5 seconds• TFER Square root of FER (max 0.66)• LFER Longest erased frame sequence (max 30)
• SQI 20.67 - 57.2*BER - 29.3*TFER - 0.11*LFER(min -20)
• Handover adjustment are made for each handover
Sentence DependencySentence Dependency
700 750 800 850 900 950 1000 1050 1100-20
-10
0
10
20
30
40
Sentence
Spe
ech
Qu
ality
Est
ima
te
PSQMSQI

Sentence Dependency, cont.Sentence Dependency, cont.
700 710 720 730 740
22
24
26
28
30
32
34
Sentence
Spe
ech
Qua
lity
Est
imat
e
PSQMSQI
Selected SentencesSelected Sentences
0 50 100 150 200 250 300 350 400-20
-10
0
10
20
30
40
Sentence
Spe
ech
Qua
lity
Est
imat
e
PSQMSQI
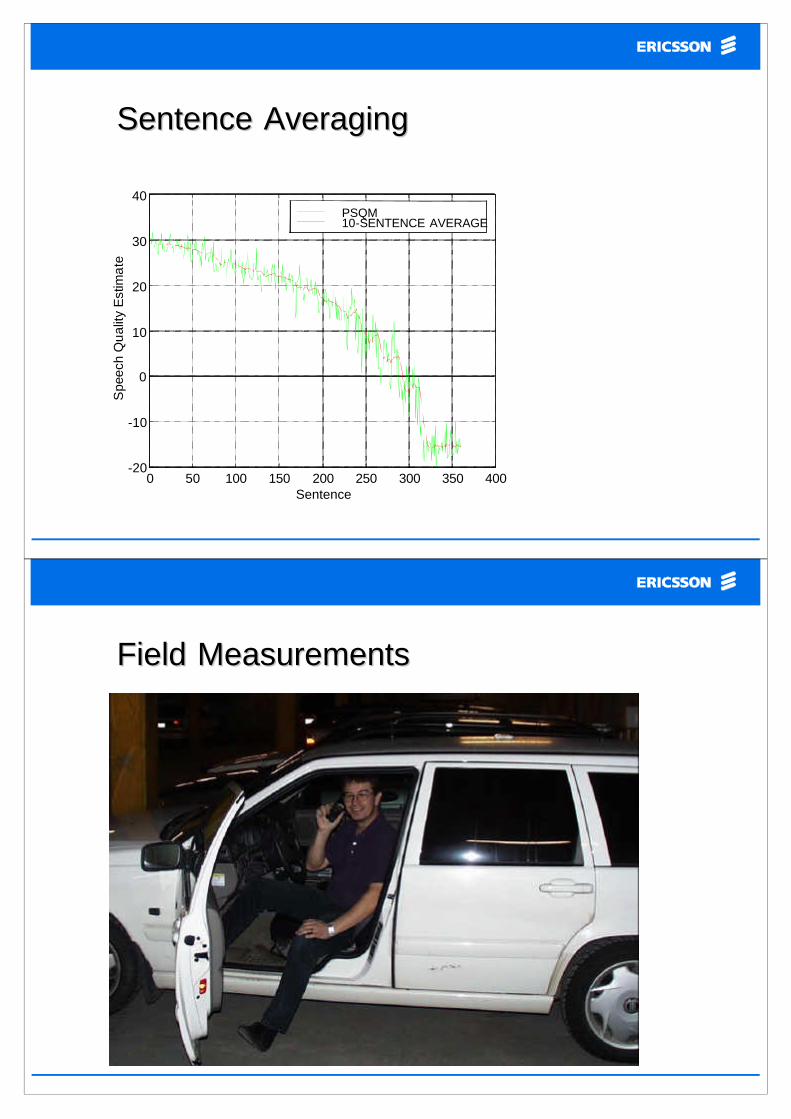
Sentence AveragingSentence Averaging
0 50 100 150 200 250 300 350 400-20
-10
0
10
20
30
40
Sentence
Spe
ech
Qu
ality
Est
ima
te
PSQM10-SENTENCE AVERAGE
Field MeasurementsField Measurements

C/I Example: Three FrequenciesC/I Example: Three Frequencies
SQI, Signal Strength and C/ISQI, Signal Strength and C/I
0 5 10 15 20 25 30 35 400
20
40
60
.S
QI
RxL
evel
0 5 10 15 20 25 30 35 400
10
20
30
Time [s]
C/I
[db]
ci_recording
S t ö r a r e
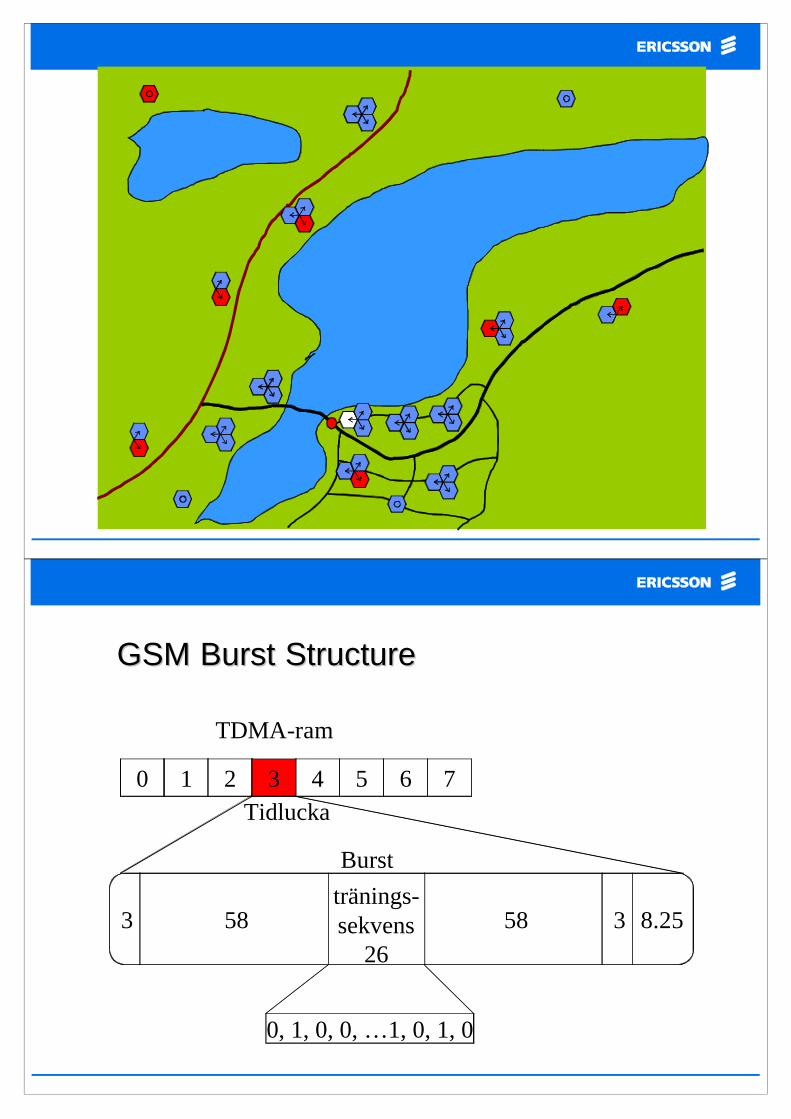
tränings-sekvens
26
0 1 2 3 4 5 6 7
TDMA-ram
Tidlucka
0, 1, 0, 0, …1, 0, 1, 0
Burst
583 358 8.25
GSM Burst StructureGSM Burst Structure

CI Carrier
detection
yes
no
Bit detection
Carrierestimation
Rampmodel
Correlation
Trainingsequences
Graphicalpresentation Channel
estimation
Σ-
+
Algorithm StructureAlgorithm Structure
Correlation CurvesCorrelation Curves

Algorithm PerformanceAlgorithm Performance
Graphical PresentationGraphical Presentation

S t ö r a r e
S t ö r a r eChannels:
101526
Channels:15224649
Channels:71523
Channels:15192452

S t ö r a r eChannels:
15224649
Channels:71523
Channels:15192452
Channels:101526
-50 0 50 100 150
Interference onchannel 15
Candidate 1 Candidate 3
Candidate 2
Streaming QualityStreaming Quality

GPRS Coding SchemesGPRS Coding Schemes
Block Error ProbabilityBlock Error Probability
0 5 10 15 20 25 300
0.1
0.2
0.3
0.4
0.5
0.6
0.7
0.8
0.9
1
C/I [dB]
Blo
cker
rorp
roba
bilit
y
blep

Throughput for a 3Throughput for a 3--slot Mobileslot Mobile
0 5 10 15 20 25 300
10
20
30
40
50
60
C/I [dB]
Thr
ough
put[
kbit/
s]
raw_tp
EGPRS Ack/Nack WindowEGPRS Ack/Nack Window
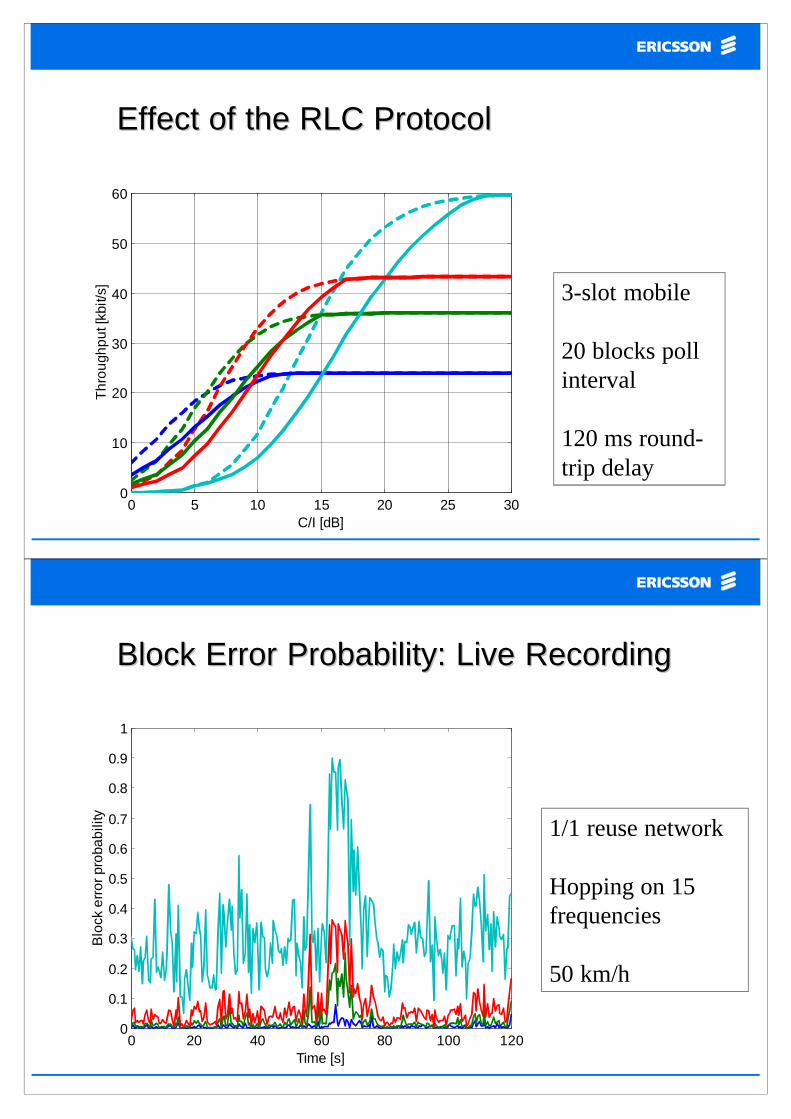
Effect of the RLC ProtocolEffect of the RLC Protocol
0 5 10 15 20 25 300
10
20
30
40
50
60
C/I [dB]
Thr
ough
put[
kbit/
s]
prot_tp_20_6_3
3-slot mobile
20 blocks pollinterval
120 ms round-trip delay
Block Error Probability: Live RecordingBlock Error Probability: Live Recording
0 20 40 60 80 100 1200
0.1
0.2
0.3
0.4
0.5
0.6
0.7
0.8
0.9
1
Time [s]
Blo
cker
rorp
roba
bilit
y
rec_blep
1/1 reuse network
Hopping on 15frequencies
50 km/h

Block Error Probability: 2.5 Sec. FilterBlock Error Probability: 2.5 Sec. Filter
0 20 40 60 80 100 1200
0.1
0.2
0.3
0.4
0.5
0.6
0.7
0.8
0.9
1
Time [s]
Blo
cker
rorp
roba
bilit
y
rec_blep_filt
1/1 reuse network
Hopping on 15frequencies
50 km/h
Throughput for a 3Throughput for a 3--slot Mobileslot Mobile
0 20 40 60 80 100 1200
10
20
30
40
50
60
Time [s]
Thr
ough
put[
kbit/
s]
rec_raw_filt
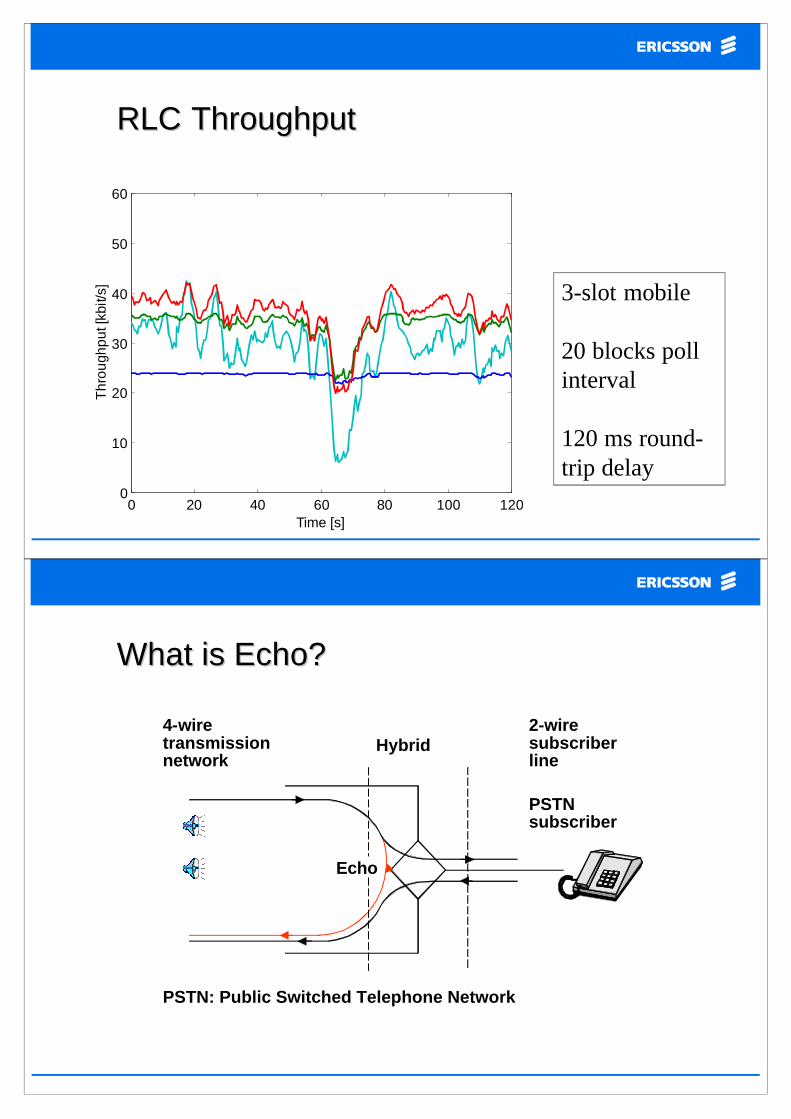
RLC ThroughputRLC Throughput
0 20 40 60 80 100 1200
10
20
30
40
50
60
Time [s]
Thr
ough
put[
kbit/
s]
rec_prot_filt
3-slot mobile
20 blocks pollinterval
120 ms round-trip delay
4-wiretransmissionnetwork
Hybrid2-wiresubscriberline
PSTNsubscriber
Echo
PSTN: Public Switched Telephone Network
What is Echo?What is Echo?

EchoReturnLoss(ERL)
dB
Echo ToleranceCurve
Tolerable
Intolerable
Delay (msec)
AnalogNetworks
DigitalNetworks Satellite
200 300
Echo ToleranceEcho Tolerance
Requirement and Real Hybrid DataRequirement and Real Hybrid Data
• 45 dB needed(theoretically) fortypical GSM delay
• Can be relaxed to 35dB consideringbackground noisearound the mobileuser

Trunk EchoTrunk Echo CancellerCanceller EchoEcho CancellerCanceller in Poolin Pool
Digitalcellularsubscriber
Digitalcellularsystem
MSC
EC
EC
EC
ECPSTN
Digitalcellularsubscriber
Digitalcellularsystem
MSC
ETC
ETC
ETC
ETCPSTN
ECP
ETC:EC:ECP:PSTN:MSC:
Exchange Terminal CircuitEcho CancellerEricsson Echo Canceller in PoolPublic Switched Telephone NetworkMobile Switching Center
ETC
ETC
ETC
ETC
Echo Effects on Speech QualityEcho Effects on Speech Quality
• No standard-defined speech quality tests– ITU-T tests (G.165, G.168) are rather minimum functionality
tests
• Objective methods are difficult to define– The echo path and the conversation characteristics are
changing from subscriber to subscriber
• Subjective speech quality tests are necessary– ITU-T P.800 & P.831 for correct methods
• Only simple objective parameters can be measured today– Echo delay– Echo amplitude

DTX in Cellular NetworksDTX in Cellular Networks
• DTX Principle:– Send only when there is something important to send (i.e.
when talking)– Estimate the background noise, and send estimates with 0.5
s intervals during silence in conversation
• DTX Benefits:– Longer battery life in mobile– Lower total interference in network
• DTX Drawbacks:– “Wrong silence” is produced if estimate is bad, which can be
extremely disturbing
DTX and Speech QualityDTX and Speech Quality
• The impact of “silence distortions” are not well understood orhandled by todays algorithms
• Most algorithms excludes (or weights down) silent parts whenestimating the speech quality
• For time-coverage reasons, the transmitted speech does notcontain (much) silence at all, thus avoiding the DTX problem
• But the “users on the street” are experiencing the full DTXeffect, thus the measurements are not representative
Music QualityMusic Quality
• Madonna, original
• Madonna, 12.2 kbit/s, no channel errors
• Madonna, 4.75 kbit/s, no channel errors
• Madonna, 4.75 kbit/s, bad channel
Skip The Audio?Skip The Audio?

Skip the Audio 2...Skip the Audio 2...
QoS Attributes vs. ”Quality”QoS Attributes vs. ”Quality”Real Time Non Real Time
Traffic class Conversationalclass
Streamingclass
Interactiveclass
Backgroundclass
Maximum bit rate X X X X
Delivery order X X X X
Maximum SDU size X X X X
SDU format information X X
SDU error ratio X X X X
Residual bit error ratio X X X X
Delivery of erroneous SDUs X X X X
Transfer delay X X
Guaranteed bit rate X X
Traffic handling priority X
Allocation/Retention priority X X X X

Keep the Stock Exchange Happy...Keep the Stock Exchange Happy...