Embed Size (px)
Citation preview
From Inputs to Outcomes: Creating Student Learning Performance Metrics
and Quality Assurance for Online Schools
Measuring Quality From Inputs to Outcomes:
Creating Student Learning Performance Metrics and Quality Assurance for Online Schools
Measuring Quality From Inputs to Outcomes:Creating Student Learning Performance Metrics and Quality Assurance for Online Schools
Written by
Susan Patrick, David Edwards, Matthew Wicks, iNACOL
John Watson, Evergreen Education Group
October 2012
TOLL-FREE 888.95.NACOL (888.956.2265) DIRECT 703.752.6216 FAx 703.752.6201EmAIL [email protected] wEb www.inacol.org mAIL 1934 Old Gallows Road, Suite 350 Vienna, VA 22182-4040
We want to thank and acknowledge The Bill & Melinda Gates Foundation for their leadership and support of this work.
Introduction
Online learning, in many forms, is growing rapidly across the United States. Some students are taking a single online course while attending a physical school. Other students attend schools that split time between online and face-to-face content and instruction throughout the school day. They may rotate between learning labs with laptops and classrooms that look and feel much like a traditional school. Still other students attend schools that blend online and face-to-face instruction in all classes throughout the day; although these students attend a physical school it looks nothing like a traditional school building. Finally, some students are attending schools that don’t have a physical building at all. These full-time online schools still have highly qualified teachers and curriculum, and still foster interaction between students and teachers, but students typically access courses from home.
The stories of individual students demonstrate why online schools are the best option for some students who require a different learning environment, schedule flexibility, or some other element different than what is provided by traditional schools. Kelly, for example, was a pregnant teen who had dropped out of her traditional school. She enrolled in an online school that she could attend to more easily balance school and parenting responsibilities, and is now on track to graduate. Carl was not performing well because he was not challenged in school, even though he had been in gifted classes. In the personalized learning environment of his online school, his teachers have been able to differentiate instruction for him and challenge him to do well. He has responded and is now proficient in math and reading. Justin has recently developed serious asthma and additional health problems, and his parents worry about sending him to a traditional school until he learns to better manage these health issues. Until that happens, he is attending an online school so he can maintain his education without attending his traditional school.
Each of these examples of online or blended learning environments is an important component of the overall field of expanding learning opportunities in the 21st century. One of the reasons that online learning is expanding so rapidly is that teachers can personalize learning, using more engaging content and technology tools to better address the needs of each student in a way that is very difficult for a traditional environment (a single teacher lecturing 30 students with a single textbook) to match. In the same manner that different elements of an online course are best suited to different students, varied types of online learning are best suited to individual students as well. All of the models of education—traditional, full-time online, full-time onsite, or a blend—are appropriate for some students. Students are making these choices in growing numbers: in the United States there are nearly 2 million students taking single online courses, and 275,000 students
INTERNATIONAL ASSOCIATION fOR K-12 ONLINE LEARNINg 2
in full-time online schools. Twenty-eight states offer online courses through a statewide virtual school providing students with supplemental online courses; 31 states have full-time online schools for students in K-12 education.
Technology-based models allow for rapid capture of student performance data and personalized instruction tailored to the specific needs of individual students. Teachers, who adapt instruction by accessing data on student mastery and work with students to target their needs, can individualize learning to reflect the skills and knowledge students have mastered. These online and blended models have the potential to keep students engaged and supported as they learn, to allow students to access the best teachers from any location, and to help students to progress at their own pace, leading to dramatically higher levels of learning and attainment. The ultimate power of online and blended learning, however, lies in its ability to transform the education system and enable higher levels of learning through competency-based instruction.
There is much to be done to achieve this promise. While enrollment in online and blended models is growing rapidly, the field is still nascent and there is great diversity in the quality and overall effectiveness of courses and content available today. Increasing access alone will not lead to better outcomes for students. In order for online and blended learning to transform the education system, it is essential that the models available are high quality and successfully increase achievement. Fulfilling the potential of a student-centric, competency-based system will require that the field of online and blended learning and the policy environment in which it operates evolve to demand models that are not only different, but more effective, than traditional schooling.
Online learning is becoming more common—but is it a better way for students to learn than traditional schools? In some ways the answer is clearly yes. Some students are, for example, taking Advanced Placement courses that they would otherwise not have access to if it was not for an online course. They are better prepared for college or career having had the option to take the online course. Students who attend an online school as a last resort because they have not succeeded in traditional schools, or students who are physically unable to attend traditional schools, are also clearly better off because of the online option.
But what of the many other students who are choosing online schools when they might instead remain in the traditional classroom—is the online school a better option for them?
The simplest answer to that question is we do not know, because most state accountability and data systems can’t easily provide the information about individual student growth on mastery outcomes that is necessary to produce the answer.
Background on quality assurance and related accountability outcomesFor decades, K-12 education has addressed quality issues mostly via inputs. Inputs provide helpful criteria and indicate critical success factors in instructional design and managing programs—but they don’t tell us what works and is effective based on outcomes. Examples of inputs-based quality assurance include policymakers requiring courses meet state content standards, textbooks going through extensive reviews, and requiring teachers to have licenses and receive professional
3Measuring Quality From Inputs to Outcomes: Creating Student Learning Performance Metrics and Quality Assurance for Online Schools
development. However, the problem is that in many cases these inputs have not been correlated with improved student outcomes. While it might make sense to expect that a teacher who has received more professional development would be a better teacher for students, there are limited data available to determine if this is true or not.
With the passage of No Child Left Behind (NCLB) in 2001, the federal government for the first time mandated each state create its own assessment tools to measure grade-level proficiency and its own accountability frameworks based on testing students to reach 100% proficiency (on its own standards in reading and math) by 2014. Only 11 states had previously set academic standards for reading and math and had them in place. With a large road to forge ahead in accountability, NCLB set a requirement that each state would create its own plan and that students would be tested for proficiency in math and language arts across several grade levels, with at least a single assessment at the end of the year, to make an annual determination of student achievement based on the state’s own standards.
The resulting accountability framework and the once-a-year, end-of-year assessment regime, is flawed in many ways. The resulting state assessments provide an annual snapshot of school accountability at one point during the year, but that snapshot is often not enough to tell us about student performance and individual growth in the context of college and career readiness. Availability of data is still weak. Partly, this is because the tests are limited in grade levels, there are many non-tested subject areas and grade levels, and the current tests lack the ability to assess critical thinking and higher order skills. Most importantly, these tests rarely tell us about how much the student has learned in the past year—how much they have grown during the duration of a school, program or learning environment. Two national consortia are developing assessments based on the Common Core State Standards; they are likely to provide better measures for English/Language Arts and Math in certain grades but will not assess proficiency across all the K-12 grades and subject areas. End-of-year, annual summative assessments are snapshots of a single moment, and provide little to no data on the learning trajectory that the student is experiencing.
“Systems of assessments” are needed to understand quality assurance based on outcomes. These would provide data upon entry through adaptive assessments showing gaps or mastery of proficiency across the K-12 continuum, ongoing performance-based assessments where students demonstrate mastery exhibited in their work products, formative assessments reflecting student proficiency and skills, and summative “end of unit” or “end of course” validating assessments to provide a much more comprehensive set of data and information to understand student learning outcomes and growth trajectories. Rolling students’ individual proficiency and standards-based outcomes data up to the school level could provide a better way to assess how well students are served by a school or program.
Recognizing the limitation of the current accountability model based on a single assessment and using age-based cohorts, an increasing number of states are considering and moving towards new models of accountability that are focused on measuring student growth—how much a student has learned over a period of time. Still, usually the time period is the year between annual state assessments. Ideally, these growth models would measure real learning by individual students in a way that is easy to explain and analyze. The limitations of today’s state systems mean that this ideal is rarely achieved. The result is that the information we have to evaluate schools does not paint a complete picture in most states. This applies to all schools, but has specific implications for online schools.
INTERNATIONAL ASSOCIATION fOR K-12 ONLINE LEARNINg 4
Online schools are also challenged by a single measure end-of-year test, which does not include substantive data on individual student growth. School accountability that judges students by age-based cohort groups, or by meeting percentiles of proficiency rather than demonstrating proficiency at a standards-based level, makes it very difficult to understand the success of schools that are moving students toward proficiency and mastery at accelerated levels of individual student growth, especially for students who have been behind or ahead of grade level historically. The importance of
“systems of assessments,” understanding proficiency levels upon entry, identifying gaps, measuring real progress over smaller increments of time, and collecting standards-based data on proficiency toward college and career-readiness through performance-based assessments, along with validating data, are all essential pieces of information to know how well a student is doing in a more holistic way—and to provide robust accountability based on student outcomes.
Many people interpret the current dialog on “growth models” to mean states are measuring an individual student’s academic growth along a trajectory—measuring proficiency of standards at program or intervention entry and exit (often simply a “year’s worth” of schooling). Ideally, growth models would measure real learning by individual students in a way that is easy to explain and provides solid data. However, not all growth models are created equally. There are wide variances in how growth models are used for school accountability and whether they lump students into cohorts or not. There are value-add measures and models that may take into consideration individual student growth and extensive data on a student’s background and academic history. The notion of what a growth model is or should be often differs greatly; there is a wide range of “growth models” being deployed for annual state accountability systems, just as with NCLB there were 50 state accountability models. So, in viewing quality assurance through growth models, we must recognize that not all growth models for accountability will measure individual student growth. Although different measurement systems are labeled “growth models,” these systems must be much more transparent about whether they measure individual student growth along a trajectory. The bigger issue is the need for better transparency of student data: demographic, proficiency, and assessment data developed based on standards-based trajectories used to analyze individual student growth outcomes.
The challenge for policymakersHow can we approach quality assurance based on individual student outcomes along with inputs? Assessing a school is difficult without clear data on individual student growth—online or otherwise—to determine whether a program is actually supporting students to meet their educational goals. This report is not intended to be a treatise on comparing growth models. It is clear, however, that we need measures that show actual student learning outcomes—and we must realize that most states and schools are using a flawed assessment system that doesn’t necessarily measure entry and exit knowledge across the entire K-12 curriculum. This situation makes quality assurance a major challenge in the United States.
The fact that we don’t have outcomes-based quality assurance means we don’t know how well online schools and courses are educating students. This leads to two types of risk: first is the possibility that online learning will become ubiquitous, but not transformative. In districts and states that are moving rapidly to expand online and blended learning, if we don’t know how well the new methods are serving students we must ask: How are decisions being made regarding program implementation?
5Measuring Quality From Inputs to Outcomes: Creating Student Learning Performance Metrics and Quality Assurance for Online Schools
The risk on the opposite side of the spectrum is that some states are not allowing students to enroll in online schools and courses, and in some cases, are threatening to restrict existing online schools and limit student and family choice. Without better data about student performance, we run the risk that we will restrict options that would improve student outcomes, because our systems are not comprehensive enough to measure the improvements.
How can educators and policymakers address quality assurance by understanding these issues and mitigating risks? To address these quality assurance questions requires collecting and reporting more transparent data, implementing multiple measures of student performance, rethinking school evaluation, and clarifying which performance metrics are most important to create a more robust benchmarking picture of performance. These can and should apply to all schools, but the need is especially pressing for online schools.
The road aheadMany thought leaders and policymakers across the country are addressing these issues and attempting to improve their states’ quality and accountability systems. This paper looks at these issues through the lens of online schools, courses, and students. It suggests principles for reform that will help provide outcomes-based quality assurance to better identify successful schools, address needs of the student populations they serve, and may apply broadly to the ongoing debates about how best to evaluate physical schools as well. This report suggests multiple outcomes-based performance indicators and supporting metrics for quality assurance and effectiveness of online programs and courses.1
1 Although many of the recommendations presented in this report can apply to blended learning, the variations in blended formats and instruction do not specifically fall under the scope of this report.
INTERNATIONAL ASSOCIATION fOR K-12 ONLINE LEARNINg 6
A vision for the future; an immediate need to focus on outcomes-based effectiveness and individual student growth
There are national efforts making significant progress in pursuing an outcomes-based accountability, assessment, and content and skills quality agenda for American education. New assessments supporting the Common Core State Standards for college and career-readiness are the focus of the Smarter Balanced Assessment Consortium (SBAC) and the Partnership for Assessment of Readiness for College and Careers (PARCC). States are beginning to connect K-12 data systems with post-secondary data, workforce systems, and social services. Within several years, new assessments in English Language Arts and Math via the assessment consortia will be in use in most states across the country. Further progress will have been made in defining the best approaches to measuring student growth to better ensure that accountability systems are improved. These improvements vary by state, however, and synergies between these different systems of data and assessment will be necessary.
Educators and policymakers cannot stand by in the meantime. State education agencies are deciding how to evaluate existing online schools. Charter school commissions and education boards in Maine, North Carolina, New Jersey, and other states are considering whether to allow the implementation or expansion of online schools. Florida, Utah, Idaho, Indiana, Georgia, and other states are expanding student choice to individual online courses, and determining how to ensure quality and hold course providers accountable.
We honor the work of the experts in accountability models, value add, student growth, assessment consortia, data systems, and other parts of the education system and urge quality work to continue. The challenge for our field—online and blended practitioners, policymakers, and educational leaders—is to bridge the gap between existing systems and the time, years from now, when data and accountability systems will be much improved. For this reason, we present this paper as a framework for thinking about outcomes-based quality assurance and performance metrics.
7Measuring Quality From Inputs to Outcomes: Creating Student Learning Performance Metrics and Quality Assurance for Online Schools
Exploring key performance metrics for student learning outcomes
How are policy makers and education leaders thinking about evaluating education based on outcomes?
This section explores the building blocks of outcomes-based performance metrics. In writing this report, our research has unearthed five core performance metrics that are the foundation for the discussion of measuring student learning based on outcomes. These five performance metrics are proficiency, individual student growth, graduation rates, college and career readiness, and closing the achievement gap.
Proficiency measures provide the most commonly reported data. In some states, other performance indicators have been suggested for quality assurance rather than collected systematically from schools.
In order to consider quality assurance in the context of online learning, we first describe these measures of student learning outcomes as each has advantages and shortcomings, but together they paint a more accurate picture of student outcomes. It is important to note that definitions of these measures vary from state to state.
The subsequent sections of this report provide recommendations for how multiple measures of student outcomes should be implemented for full-time online schools and individual online courses. Outcomes measures are discussed in more detail below, and in some cases additional information is provided in the appendices.
It is important to understand each of these metrics in the context of developing a more holistic framework of quality assurance in future sections of the report.
Education leaders in numerous states are considering better approaches to evaluating student performance outcomes. A key starting point for evaluating online schools’ effectiveness are measures of proficiency. Beyond proficiency, or how much a student knows at a distinct point of time, there are other measures of student learning that examine a student’s growth of knowledge, skills, and deeper learning to prepare them for college and careers over time. Many states are moving toward formally using multiple measures of student learning in assessing outcomes and performance.
We present in this section a set of measures that may be used to evaluate student outcomes more robustly than is often being done currently with proficiency alone. We have identified multiple outcomes-based measures that should be explored more closely when moving toward quality assurance and evaluations of schools:
INTERNATIONAL ASSOCIATION fOR K-12 ONLINE LEARNINg 8
• Proficiency
• Individual student growth
• Graduation rate
• College and career readiness
• Closing the achievement gap
ProficiencyProficiency is the most basic of the measures. It evaluates what students know at a point in time in a given subject, and is usually associated with grade level. It is a necessary performance metric but insufficient, especially if proficiency data are solely based on age or grade cohorts, rather than an individual student’s overall proficiency map. Understanding student proficiency is an important starting point for a robust set of indicators.
In thinking about online students progressing at their own pace based on demonstration of mastery, the role of a state in ensuring quality and proficiency requires student proficiency to be measured and validated. Ways to measure include state assessments, end-of-course exams, and national and international tests such as the National Assessment of Educational Progress (NAEP), Programme for International Student Assessment (PISA), and Trends in International Mathematics and Science Study (TIMSS). None of these tests covers a comprehensive range of grades and subject areas across K-12 education. State assessments typically cover grades 3-8 plus one year of high school.
Many educators realize that proficiency measures often “show more about who attended each school than how well they were being taught.”2 Online schools and other alternative schools, which serve students who are at-risk or over-age and under-credited, often do not demonstrate strong proficiency scores at grade level.
Although proficiency measures are widely used, they clearly do not cover a wide range of students and courses. How does a state deal with students advancing ahead of a traditional calendar schedule? How do we measure outcomes in untested subjects or grades?
GrowthMeasuring individual student learning based on proficiency, skills, and knowledge gained in a given period of time is a foundational concept behind growth. Examining individual student learning growth is necessary because proficiency measures alone will tend to reward schools whose students arrive above grade level, and penalize schools whose students arrive below grade level. This is of particular concern to online schools because they are often chosen by students who have been unsuccessful in traditional environments, are not achieving at grade level, are at-risk, over-age and under-credited, or otherwise not successful in a physical school.
2 Richard Lee Colvin, Education Sector, Measures that Matter: Why California Should Scrap the Academic Performance Index, http://www.educationsector.org/sites/default/files/publications/MeasuresThatMatter-RELEASED.pdf
9Measuring Quality From Inputs to Outcomes: Creating Student Learning Performance Metrics and Quality Assurance for Online Schools
“Growth, in its simplest form, is a comparison of the test results of a student or group of students between two points in time where a positive difference would imply growth. If you analyze how a group of students performed at a school, in a program, or with a teacher, relative to a standard (e.g., compared to a baseline in a prior year or relative to other schools or educators), then you begin to produce information that differentiates growth and implies varying levels of effectiveness—areas of strength and opportunities for improvement. While seemingly simple, there are several policy, technical, and adaptive issues to address.
Growth measures come in various forms that differ in approach and design. You don’t necessarily need to understand the specific mathematical or statistical techniques economists and statisticians use in the models, but it is important to be comfortable discussing the educational assumptions within models, some terminology used to describe various models, and the importance of certain decision points to ensure alignment with your state or district’s goals.
There are a spectrum of models that measure student growth and estimate educator effectiveness, ranging from simple comparisons of student achievement, to descriptive analyses, to complex statistical models that estimate or make inferences about educator effectiveness. Often, you hear the terms “growth model” and “value-added” used interchangeably. This guide makes some distinctions between the two.
These models vary greatly in several areas:
• The purpose for which they were developed;
• The assumptions made by model providers about the educational environments for which they were developed; and
• The mathematical/statistical approaches and techniques used to estimate student growth or value-added.
Simple growth models describe the academic growth of a group of students between two points in time without directly making assumptions about the influence of schools or educators on that growth. This is accomplished by comparing students’ achievement, in a given subject, to their achievement the prior year. These models typically use limited student test data in the analysis and do not attempt to control for other factors (e.g., measurement error, student demographics, or other attributes). Simple growth models are fairly easy for educators to understand and often can be run internally by state or local experts.
Value-added models attempt to estimate the influence of schools or classrooms on the academic growth rates of a group of students with statistical confidence. For example, if the school estimate is positive, it is interpreted that the performance of the school is greater than average or typical and therefore “value is added.” By nature, these models are more complex than simple growth models and rarely can be run internally without a statistician or economist on staff. Not all value-added models are the same because they often are designed to analyze a specific part of the educational system, such as pre-service programs, school or district factors, or teacher or classroom factors. These models employ various statistical approaches and use differing amounts or types of data in the analysis.”3
3 Battelle for Kids, Selecting Growth Measures: A Guide for Education Leaders 2011, http://www.edgrowthmeasures.org/documents/Selecting_Growth_Measures_Guide.pdf
INTERNATIONAL ASSOCIATION fOR K-12 ONLINE LEARNINg 10
Growth models are clearly complex,4 but a few key points emerge from among them. Among these key points: “The most significant factor in selecting a growth model is how the information will be used to inform education decisions.”5
For quality assurance, growth models should be based on individual students, and they should track multiple data points to show a student’s learning trajectory. They should not be based on cohorts, as some are.
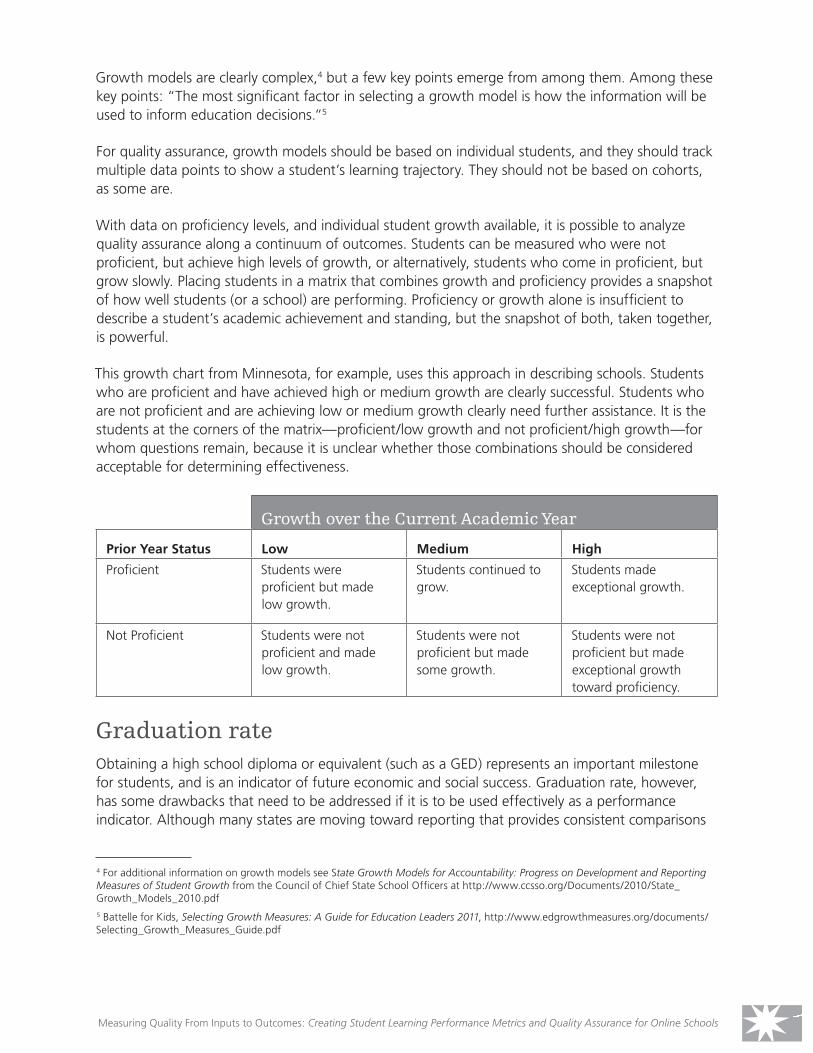
With data on proficiency levels, and individual student growth available, it is possible to analyze quality assurance along a continuum of outcomes. Students can be measured who were not proficient, but achieve high levels of growth, or alternatively, students who come in proficient, but grow slowly. Placing students in a matrix that combines growth and proficiency provides a snapshot of how well students (or a school) are performing. Proficiency or growth alone is insufficient to describe a student’s academic achievement and standing, but the snapshot of both, taken together, is powerful.
This growth chart from Minnesota, for example, uses this approach in describing schools. Students who are proficient and have achieved high or medium growth are clearly successful. Students who are not proficient and are achieving low or medium growth clearly need further assistance. It is the students at the corners of the matrix—proficient/low growth and not proficient/high growth—for whom questions remain, because it is unclear whether those combinations should be considered acceptable for determining effectiveness.
Growth over the Current Academic Year
Prior Year Status Low Medium High
Proficient Students were proficient but made low growth.
Students continued to grow.
Students made exceptional growth.
Not Proficient Students were not proficient and made low growth.
Students were not proficient but made some growth.
Students were not proficient but made exceptional growth toward proficiency.
Graduation rateObtaining a high school diploma or equivalent (such as a GED) represents an important milestone for students, and is an indicator of future economic and social success. Graduation rate, however, has some drawbacks that need to be addressed if it is to be used effectively as a performance indicator. Although many states are moving toward reporting that provides consistent comparisons
4 For additional information on growth models see State Growth Models for Accountability: Progress on Development and Reporting Measures of Student Growth from the Council of Chief State School Officers at http://www.ccsso.org/Documents/2010/State_Growth_Models_2010.pdf 5 Battelle for Kids, Selecting Growth Measures: A Guide for Education Leaders 2011, http://www.edgrowthmeasures.org/documents/Selecting_Growth_Measures_Guide.pdf
11Measuring Quality From Inputs to Outcomes: Creating Student Learning Performance Metrics and Quality Assurance for Online Schools

across states, such as the Graduation Counts Compact of the National Governors Association,6 often measures do not consider student mobility and credit deficiencies when students move into a new school. In many cases, graduation rate does not include an accommodation for extended time, and in some cases schools’ graduation rates are based on cohorts instead of individual students.
Using graduation rate as a key performance indicator may create a disincentive for enrolling students who are behind in proficiency, dropouts, or older, because of the negative impact on graduation rate if the graduation rate calculation does not allow for extra time. Alternatively, the potential exists to create an incentive for schools to work with under-credited students if graduation rate calculations account for students taking extra time, or students who achieve success through earning a GED.
College and career readinessDefinitions of college readiness vary. The U. S. Department of Education defines college ready as having “the knowledge and skills to succeed in credit-bearing courses from day one, without remediation,” and career ready as “demonstrating the academic skills to be able to engage in postsecondary education and training without the need for remediation.” Regardless of the specific definition, there is a growing gap between students having a high school diploma or GED and being fully prepared with knowledge, skills, and dispositions for postsecondary education or to enter the workforce. Thirty-four percent of all students entering postsecondary institutions require at least one remedial course.7 Only 24 percent of students who took the ACT met the test’s readiness benchmarks in all four subjects (English, reading, math and science).8 All schools—both online and traditional—are facing challenges in preparing students for life past a high school diploma.
“College readiness and career readiness have become important policy goals for education over the past few years. The Common Core State Standards point toward college and career readiness. However, many people contend that it is unclear what is meant by these terms. What do they mean? What are some definitions? How can college and career readiness be measured? What are the implications of various measurement approaches?” A definition (Conley 2007, 2010) of college and career-readiness: “the level of preparation a student needs in order to enroll and succeed—without remediation—in a credit-bearing course at a postsecondary institution that offers a baccalaureate degree or transfer to a baccalaureate program, or in a high-quality certificate program that enables students to enter a career pathway with potential future advancement. Success is defined as completing the entry-level courses or core certificate courses at a level of understanding and proficiency that makes it possible for the student to consider taking the next course in the sequence or the next level of course in the subject area or of completing the certificate.”9
6 National Governors Association, Implementing Graduation Counts, http://www.nga.org/cms/home/nga-center-for-best-practices/center-publications/page-edu-publications/col2-content/main-content-list/implementing-graduation-2010.html7 Bruce Vandal, Getting Past Go: Rebuilding the Remedial Education Bridge to College Success, Denver: Education Commission of the States, 2010, http://www.gettingpastgo.org/docs/GPGpaper.pdf 8 The Condition of College & Career Readiness 2010 (Iowa City: ACT Inc., 2010)9 David T Conley, Educational Policy Improvement Center, University of Oregon, Defining and Measuring College and Career Readiness, programs.ccsso.orgprojectsMembership_MeetingsdocumentsDefining_College_Career_Readiness.pdf
INTERNATIONAL ASSOCIATION fOR K-12 ONLINE LEARNINg 12
Closing the achievement gap The student achievement gap pertains to disparities in academic performance between groups of students, largely based on standardized tests. It is defined by the U.S. Department of Education as “the difference in the performance between each ESEA subgroup…within a participating LEA or school and the statewide average performance of the LEA’s or State’s highest achieving subgroups in reading/language arts and mathematics as measured by the assessments required under the ESEA.”10 The subgroups include students who are economically disadvantaged, from major racial and ethnic groups, those with disabilities, and with limited English proficiency.11
Closing the achievement gap between subgroups of students has become a focus of federal and state education policy since the passage of NCLB. State assessment scores, dropout rates, course and class grades, and preparedness for and enrollment in post-secondary education are all areas where the achievement gap is apparent.
States address closing the achievement gap in school evaluations by aiming for greater levels of advancement from lower-performing subgroups. In Minnesota, for example, the ability of schools to gain higher levels of growth from lower-performing subgroups than the statewide growth average for high-performing subgroups is measured and taken into account as an indicator of success. Closing the achievement gap must include quality assurance provisions to ensure all students are held to high standards of college and career readiness and provide equity and excellence for all students.
To summarize, understanding these five performance metrics is important in developing a model for measuring quality based on student learning outcomes. The next chapters will explore these metrics as a cornerstone of building quality assurance for online learning programs.
10 U.S. Department of Education, Definitions, http://www.ed.gov/race-top/district-competition/definitions11 U.S. Department of Education, http://www2.ed.gov/policy/elsec/leg/esea02/pg2.html
13Measuring Quality From Inputs to Outcomes: Creating Student Learning Performance Metrics and Quality Assurance for Online Schools
Recommendations for full-time online schools: school-level outcomes-based quality assurance
It is essential that online and blended learning practitioners and policy makers differentiate between high- and low-quality options for students. High-quality, effective programs must be recognized as such, become more available to students, and receive the funding they need to thrive. Similarly, lower-quality, less effective programs must be identified, and made less available to students and less able to receive the funding necessary to continue. Only then will the field of online and blended learning achieve its full potential.
The goal of this section of the report is to recommend outcomes-based quality assurance standards and performance metrics for full-time online schools.
New innovations rarely fit into old models of measuring success. We believe there is a small window of opportunity to pilot within the field of online and blended learning a set of new outcomes-based performance metrics for quality that—once adopted and disseminated—would ultimately forge a path for outcomes-based quality assurance in K-12 education at large.
Time is of the essence. Piloting performance metrics and collecting data based on outcomes are critical steps needed in the evolution of K-12 education quality assurance. There is a strong need to collect the data and require transparency for outcomes-based quality assurance. In developing these metrics, we recognize the need to not only collect and analyze performance data in aggregate, but also to disaggregate data by subgroups and by prior performance.
Outcomes-based quality assurance frameworks should include transparent data collection of multiple measures including:
• Proficiency
• Individual student growth along a trajectory
• Graduation rates
• College and career readiness
• Closing the achievement gap
• Fidelity to a student’s academic goals
These recommendations present a holistic set of metrics creating and implementing outcomes-based performance measures for online schools. It builds on the ideas presented in the previous section
INTERNATIONAL ASSOCIATION fOR K-12 ONLINE LEARNINg 14
discussing multiple measures of student outcomes, and suggests ways in which these measures should be implemented.
Individual states are at different points in terms of creating measures in addition to proficiency. Some states are already using growth measures, and a smaller number of states are determining how to track college and career readiness. These recommendations, therefore, will be implemented in different ways by different states. Later in this report we suggest additional ideas for implementation and suggest two scenarios that suggest how the measures may be applied.
In considering the recommendations for outcomes-based quality assurance, there are critical success factors that must be taken into context.
Multiple measures of student outcomes should be in place.High-quality measures of student outcomes should include performance metrics for proficiency and individual student growth. We believe that in addition to proficiency and growth, states should look at a combination of high school graduation rates, college and career-readiness, and closing the student achievement gap. Taken together, these five measures provide a picture of how well schools are achieving their educational goals.
Individual student performance should be measured and reported transparently based on standards.Measures including growth and high school graduation rates are often based on cohorts of students, and not on actual, individual student’s skills and aptitudes. For example, the Average Freshman Graduation Rate used by the National Center for Education Statistics is based on dividing the number of students who graduate from a high school by an average of the number of students who were in 8th, 9th, and 10th grades in previous years.12 Instead of a cohort approach in which groups of students (who may or may not be the same individual students) are compared, actual individual students, with unique identifiers, should be measured, using standards-based assessments of proficiency over multiple points in time.
Growth models should be based on the growth of individual students over time, not on cohorts. Growth calculations should address a conceptually simple question: what is the student’s gain in learning over a given period of time? That growth should be based on multiple assessments taken over time so that the student’s learning trajectory can be understood.
Untested subjects and grade levels must be assessed with validating assessments that can measure both proficiency and growth. Gaps in assessments should be reduced over time so that a fuller picture of student learning emerges. This might occur in part through expanded use of end-of-course exams (discussed in
12 National Center for Education Statistics, Freshman Graduation Rate, nces.ed.gov/programs/coe/pdf/coe_scr.pdf
15Measuring Quality From Inputs to Outcomes: Creating Student Learning Performance Metrics and Quality Assurance for Online Schools

the next section) in high school in particular, where the number of proficiency tests is lower than in the earlier grades.
Online school data should be disaggregated separately from other schools or districts to assure accurate data.In too many cases, results from online schools are not disaggregated from other data, such that the overall performance of online schools in a state is not reported. This extends even to some of the state audits that have been done; for example the state audit of online schools in Minnesota13 did not include all the online schools and students. Online schools should be required to have a separate school code so that their data can be analyzed.
Online schools must be provided student performance data and prior student records on academic history from the school the student previously attended, in a timely manner.A key benchmarking indicator is prior academic performance. Among the challenges that online schools face is receiving students’ prior information. Often the student’s prior district may feel that it is “losing” the student to the online school, and may be very slow in passing along student performance data. The state should play a role in either requiring that the data be forthcoming, or as a repository of student information so that it can pass the information to new programs and to the online school quickly and efficiently.
Data systems must be upgraded and better aligned to meet the challenge of collecting, reporting, and passing data between schools and the state.Many of these recommendations require that student information systems be upgraded to report on student-level, standards-based proficiency levels. Many state data systems are not yet able to report on individual student performance. This limitation hampers school performance when students switch schools and the new school is unable to receive the student’s prior academic information quickly.
This need extends throughout K-12 schools and into post-secondary systems in order to fully capture student trajectories. Numerous initiatives are in place to do this,14 but they remain largely early-stage and sporadic. In addition, issues exist beyond the technical challenges of capturing and reporting data.15
13 Office of the Legislative Auditor, State of Minnesota. Evaluation Report: K-12 Online Learning; http://www.auditor.leg.state.mn.us/ped/2011/k12oll.htm14 Annenberg Institute for School Reform at Brown University, College Readiness: Examples of Initiatives and Programs, http://annenberginstitute.org/publication/college-readiness-guide-field15 Annenberg Institute for School Reform at Brown University, Linking High School and Postsecondary Data: Not Just a Technical Challenge, http://annenberginstitute.org/commentary/2012/06/linking-high-school-and-postsecondary-data-not-just-technical-challenge
INTERNATIONAL ASSOCIATION fOR K-12 ONLINE LEARNINg 16
Student fidelity toward academic goals, and reasons for mobility, must be addressed in data systems and accountability ratings.Online schools are sometimes questioned because of the high rates at which students move into and leave the schools, without acknowledging that the moves could reflect students in need of a school that they will attend temporarily by design. Some students will attend an online school during a period of illness or injury; when these students leave the online school to go back to the physical school, having maintained their course or grade progression, this is a success toward reaching long-term academic goals through the flexibility they needed in an online school. Student mobility data in most cases do not capture whether the school changes have been good or bad for the student’s academic achievement. Assessing students’ proficiency levels, academic progress, and fidelity to overall goals on entry into and exit from a school would help address this issue.
The measures of student performance are complicated enough when the student attends a single school over time. When a student attends more than one school, the issue of how to divide responsibility for growth and high school graduation rates adds a new and complicating dimension to accountability across schools.
This issue is particularly relevant for online schools because many online schools serve high numbers of mobile students. Students wanting an alternative can easily enroll in anytime, anyplace online schools—and leave just as easily.
Physical schools as well as online schools are penalized similarly when students enter who are extremely credit deficient, especially in 11th and 12th grade. The difference, however, is that online schools often have higher mobility rates than physical schools, so they are disproportionately penalized. Absolute transparency of student data is needed to understand how online schools are serving and helping all students.
The measures discussed above are complex and require appropriate systems of assessments to provide adequate data for outcomes-based quality assurance. How quality assurance performance metrics are implemented matters as much as how they are conceived. These are recommendations that we believe state education leaders should consider for outcomes-based quality assurance and to improve accountability for full-time online schools. Recommendations for supplemental online courses are made in the next section.
17Measuring Quality From Inputs to Outcomes: Creating Student Learning Performance Metrics and Quality Assurance for Online Schools
Recommendations for online courses: course-level outcomes-based quality assurance
The need exists for outcomes-based performance indicators at the course level as well as at the full-time online school level. Student choice of online courses from multiple providers is becoming more common. Increasing access for student learning opportunities through online courses is important. Just as with online programs, high-quality, effective courses and content must be recognized, become more available to students, and receive the funding needed to thrive. Thus, the need for online courses to be evaluated based on student learning outcomes is important. Utah and Florida have passed laws allowing course choice from multiple online providers, and other states including Kentucky, Louisiana, and Idaho are implementing or considering similar measures.
This section presents a set of recommendations for how to implement outcomes-based performance measures for individual online courses. In some ways, evaluating individual online courses is more challenging than evaluating online schools, because traditionally the school has been the main focus of accountability from the state perspective, not the individual course. A few states have created and are implementing end-of-course exams or other course-specific evaluation measures, but in most cases the accountability rests with the district that accepts the course grade and credit.
Determining outcomes-based performance metrics for supplemental, online courses requires understanding proficiency, growth, and attainment of college- and career-ready knowledge and skills. Outcomes-based quality assurance for online courses should include transparent data collection of multiple measures including:
• Proficiency
• Individual student growth along a trajectory
The challenges for quality assurance for individual online courses are that many subjects for individual online courses do not have readily available pre-tests and post-tests for measuring proficiency or individual student growth. The same challenges for assessing course quality based on college and career readiness exist for full-time online schools as for individual online courses. The most common supplemental online course providers, including universities, state virtual schools, and vendors in partnerships with school districts, do not often have access to student data or a student’s prior academic performance. These challenges need to be addressed systemically in order to implement outcomes-based quality assurance. The recommendations involve a deeper exploration of several issues below.
INTERNATIONAL ASSOCIATION fOR K-12 ONLINE LEARNINg 18
Need for common assessments across most course subjects With less focus on inputs, and a stronger focus on measuring outcomes for quality, there is a greater need for reliable end-of-course assessments in all subjects. Today, student success in most individual online courses is based on a measure that is intrinsic to the provider or school: the course grade. In the large majority of cases, the school or course provider submits a grade to the student’s home district, and the district accepts the grade and awards or accepts credit. The district may review the course materials to assess the quality of the course, an input-based indicator, but there is no assessment that is external to the provider that is based on outcomes.
Few cases exist where the results of individual courses are tied to or validated with an external assessment. Some states or programs are identifying the students or course codes when taking online courses so that their results on state assessments in reading, writing, and math can be correlated with the online course provider, but this is rare. A few states have end-of-course exams (EOCs) in at least some subject areas, allowing for all students in the state who have taken a course with an EOC to be compared with one another. Aside from these few examples, however, a gap clearly exists in evaluating student learning outcomes from individual online courses.
Given that state assessments cover relatively few subjects and gaps exist in subjects and grade levels covered—especially in high school when most individual online courses are taken—the most likely approach to evaluating individual online courses is by creating EOCs that cover the major middle and high school courses, especially those that are not covered by state assessments.
Implementing end-of-course exams (EOCs) for individual online coursesDetermining proctoring protocols for these EOCs would be necessary, but not especially difficult, because most students are accessing individual online courses from within their schools. Students should be able to take the exams online, in a proctored setting, when they finish the course—whenever in the school year that is.
An EOC measures proficiency but not growth on its own; therefore EOCs alone would not be as robust as the multiple measures we are advocating for school accountability. At least two paths are available to course providers and districts to account for student’s knowledge prior to beginning the course. One option is that pre-tests could be created for these courses, either individually (by the providers) or as part of the effort to create EOCs. Alternatively, providers may require that for some courses students demonstrate that they have taken and passed prerequisite courses to demonstrate that they are ready to move into the online course. If adaptive assessments for that subject area are available, pre- and post- testing would help reveal student growth outcomes.
These options have implications that data systems must be up to the task of sharing student information, and states or schools are willing (or required) to provide student information to course providers, including prior academic performance and history. In most cases currently, supplemental course providers do not know how well students who have taken their online courses have
19Measuring Quality From Inputs to Outcomes: Creating Student Learning Performance Metrics and Quality Assurance for Online Schools
performed in state assessments, Advanced Placement exams, or any other measures external to the course provider. Improving data exchange is a necessary step for online schools and course providers to analyze data for student supports and continuous improvement.
The creation and implementation of course-level pre- and post-exams would be a promising development to credential student outcomes as a validating assessment of learning anywhere, anytime as well as in extended learning opportunities to bridge informal and formal learning—which takes place either inside or outside of a school or formal educational program. Although a larger discussion on the subject of informal learning is outside the scope of this report, one can envision how the existence of validating assessments for many courses could eventually allow students to place out of these courses if they can demonstrate that they have mastered the subjects via alternative means of demonstrating competence.
These outcomes-based quality assurance performance metrics are meant to provide transparent proficiency and growth outcomes data on effectiveness for student learning for individual online courses. Since iNACOL first released the National Standards for Quality Online Courses, we have strived to provide states, districts, online learning programs, and other organizations with a set of quality guidelines for all aspects of online course quality. These standards provide an overall method and framework for ensuring quality across online courses, and encourage continuous improvement. First published in 2007 and updated in 2011, the iNACOL National Standards for Quality Online Courses were published to address the issues of online course content, instructional design, technology, student assessment, and course management.
Creating and formalizing quality assurance using both inputs and outcomes-based data can help programs identify what changes need to be made and measure the effectiveness of programs. Quality assurance frameworks rely on collecting significant feedback from quality review processes, instructors, students, surveys, data-driven decision-making, and analysis. The iNACOL National Standards for Quality Online Courses safeguards quality in the areas of academic content standards, embedded course assessments, instructor resources, lesson design, instructional strategies, technology, student resources, and supports, as well as provide rubrics for evaluation. This data-driven decision-making process uses well-developed tools to support continuous improvement.
We believe that quality assurance frameworks that are most valuable include both identifying a robust set of course quality standards and ultimately reviewing outcomes as a holistic approach—building on key interdependencies of course content, design, instruction, resources, supports and identifying the related outcomes for student learning success.
INTERNATIONAL ASSOCIATION fOR K-12 ONLINE LEARNINg 20
Implementing the recommendations
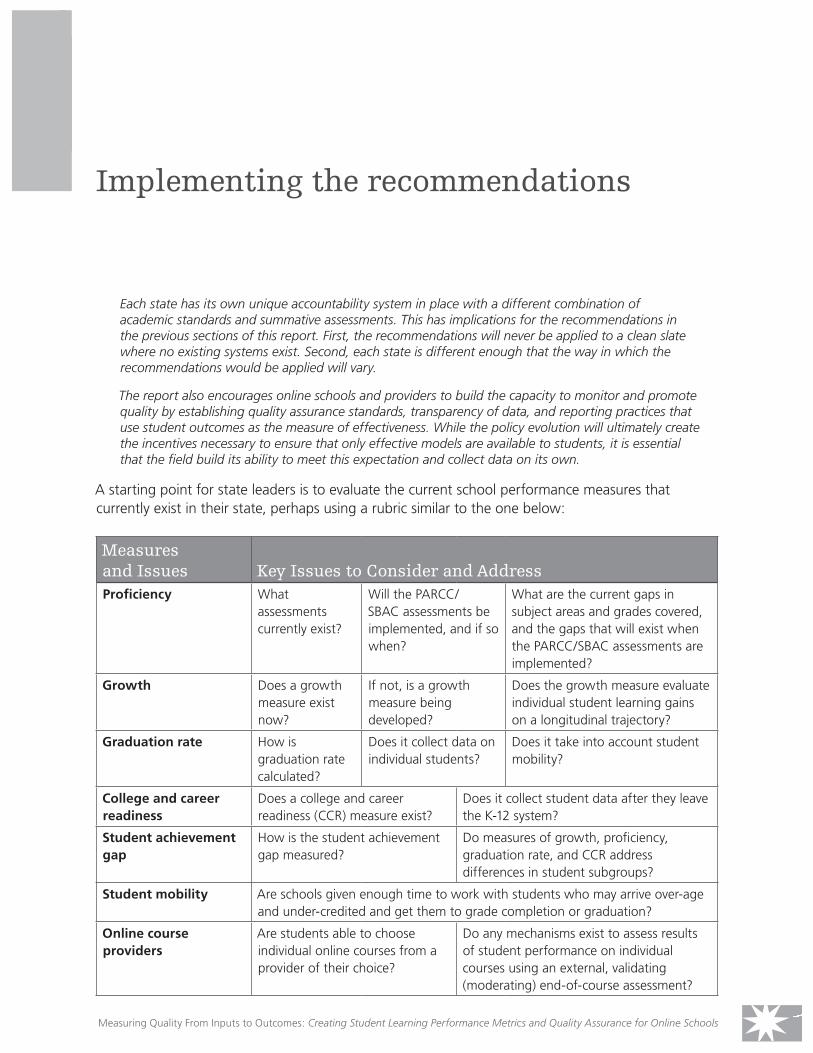
Each state has its own unique accountability system in place with a different combination of academic standards and summative assessments. This has implications for the recommendations in the previous sections of this report. First, the recommendations will never be applied to a clean slate where no existing systems exist. Second, each state is different enough that the way in which the recommendations would be applied will vary.
The report also encourages online schools and providers to build the capacity to monitor and promote quality by establishing quality assurance standards, transparency of data, and reporting practices that use student outcomes as the measure of effectiveness. While the policy evolution will ultimately create the incentives necessary to ensure that only effective models are available to students, it is essential that the field build its ability to meet this expectation and collect data on its own.
A starting point for state leaders is to evaluate the current school performance measures that currently exist in their state, perhaps using a rubric similar to the one below:
Measures and Issues Key Issues to Consider and AddressProficiency What
assessments currently exist?
Will the PARCC/SBAC assessments be implemented, and if so when?
What are the current gaps in subject areas and grades covered, and the gaps that will exist when the PARCC/SBAC assessments are implemented?
Growth Does a growth measure exist now?
If not, is a growth measure being developed?
Does the growth measure evaluate individual student learning gains on a longitudinal trajectory?
Graduation rate How is graduation rate calculated?
Does it collect data on individual students?
Does it take into account student mobility?
College and career readiness
Does a college and career readiness (CCR) measure exist?
Does it collect student data after they leave the K-12 system?
Student achievement gap
How is the student achievement gap measured?
Do measures of growth, proficiency, graduation rate, and CCR address differences in student subgroups?
Student mobility Are schools given enough time to work with students who may arrive over-age and under-credited and get them to grade completion or graduation?
Online course providers
Are students able to choose individual online courses from a provider of their choice?
Do any mechanisms exist to assess results of student performance on individual courses using an external, validating (moderating) end-of-course assessment?
Measuring Quality From Inputs to Outcomes: Creating Student Learning Performance Metrics and Quality Assurance for Online Schools 21
We present below two scenarios for how the recommendations might be employed.
ScenarIO 1: Implementing the measures for online schools in a state without online schools Twenty-nine states do not have full-time online schools as of October 2012. Although these states are the closest to the clean slate condition, they are still evaluating physical schools using inputs or current accountability models. Proficiency measures are based on existing state assessments (at a minimum). They may have a growth model in place or being developed, they are likely to calculate graduation rates, and they may even have a measure of college and career readiness.
When these states allow full-time online schools for the first time, they have the opportunity to create a method of authorizing these schools, including requiring the transparency of data that will be captured for online students. Although this system should not be an entirely new accountability system that operates in parallel with the existing state system, if the state has not yet moved to multiple measures, the online schools may present an opportunity to test new outcomes-based measures with a small population of students.
In this scenario, the state could take the following steps to meet the goals outlined in this report:
1. Create a multi-year Quality Assurance research pilot that collects data using outcomes-based performance metrics, conduct an analysis on the effectiveness of measures and efficacy of approach, and evaluate the extent to which the goal of outcomes-based quality assurance is implemented in the pilot.
2. Create or use an existing state-level authorizing body that collects data on student performance from online schools annually, and reports the data to the legislature and public.
3. If a growth model is not in place, or if it does not use individual students’ results, require that all online students take an adaptive assessment, or entry and exit assessments at the start of each program in math and English at a minimum for elementary and middle school grades, and add additional subjects (e.g. science, history) for high school students.
4. Track student mobility and progress toward goals by a) requiring each online school to ask students why they chose the online school, and b) to clarify their academic goals for attending. When leaving, schools can track where students are going next, and the fidelity to their goals.
5. Require school districts to disclose student information and proficiency data to online schools in a reasonable amount of time. This requires having a unique student identifier, and investing in the state education agency to work with schools to better collect and transfer students’ performance data.
6. Implement a graduation rate calculation for students in online schools that takes into account students who arrive over-age and under-credited, consistent with best practices in the field for serving these youth. For example, calculate graduation rates on a six-year calculation instead of four-year.
INTERNATIONAL ASSOCIATION fOR K-12 ONLINE LEARNINg 22
ScenarIO 2: States offering individual, supplemental online courses statewide and implementing quality assuranceSeveral states currently provide a course choice option in which students can choose to take an individual online course from multiple providers of online courses, and other states are moving in this direction. In some cases, the states providing course choice options require that the online courses meet certain criteria as designed by a state authorizing body. In addition, many states still allow local districts to determine what options are available for individual online courses for their students.
In this scenario with “course choice” states and districts, the implementation of quality assurance using the outcomes-based performance indicators of proficiency and growth measures would better inform authorizing entities, educators, and parents about which courses are producing the best outcomes through transparency of data. States could develop a more comprehensive data system that integrates assessment data from courses outside the current EOC performance measures into state and federal reporting requirements and make that information available to students and families.
For quality assurance using outcomes for individual online courses, here is an example of how a state would take the following steps to effectively implement the measures outlined in this report:
1. State would set up an online course clearinghouse.
2. State would require districts, vendors, and other course providers to apply to have their courses reviewed and accepted based upon current online course quality standards in a rolling review process.
3. State would list online courses in the online course clearinghouse.
4. Students would register for approved online courses through the clearinghouse or their local school district.
5. The online course clearinghouse would require outcomes data to link back to the student data profile through the student information system and provide achievement data based on a unique course identifier. Schools within the state would need to delineate course codes to assure that reporting indicates that student took an online course.
6. Data would be collected on the individual online course and provider.
7. State would develop pre-and post-assessments for subject areas offered in the online course clearinghouse, including subjects outside the traditionally tested courses. The pre- and post-test data would help determine student performance in individual courses. The pre/post assessment data would also be used to determine growth in the subject. Growth measures must be reported at the individual student level for the individual course.
8. State would partner with a university or external research entity to develop research pilots, review performance data across all subjects, examine the efficacy of the measures, understand outcomes based on student performance, and evaluate online course quality tied to data.
9. The state would adapt current assessment and reporting processes to allow for data from courses outside the traditionally-tested subject areas to be included in the data reporting.
23Measuring Quality From Inputs to Outcomes: Creating Student Learning Performance Metrics and Quality Assurance for Online Schools
Investigating policy issues affecting quality: Recognizing unintended consequences and perverse incentives driving today’s system
In the course of the research of the quality assurance project, a number of policies surfaced that are counter to incentivizing rapid gains for student outcomes in learning, thus providing what we will term
“perverse incentives” for school systems.
Policy always runs the risk of creating unintended consequences and perverse incentives. It is important to recognize factors that drive practice away from the student-centered, competency-based transformational models we seek in K-12 education that are to be measured based on outcomes. Perverse incentives in policy exist today which drive educators away from “doing the right thing” for student learning.
We identified several issues related to perverse incentives including:
• If a student in a full-time online school is able to move at their own pace, advance based upon demonstrated mastery, and accelerates rapidly, the current end-of-year testing on grade level would not recognize gains of a student who is not tested at the correct time in their pathway for proficiency. For example, a student in a mastery-based environment (at the age of 5th grade, who has advanced through 5th and 6th grade math) who is taking advanced courses, would be tested in the current accountability system at the end of the year on 5th grade math levels. Systems of assessments need to be put into place to provide validating testing at multiple times throughout the year, based on a student’s own trajectory. There is not an incentive for the school to advance the student beyond the age-based grade level, because the school would risk missing school accountability targets. What if accountability also rewarded significant growth?
• One state policy provides significant additional funding for students who are below basic proficiency levels in English; in this example, the English Language Learner (ELL) designation provides a significant funding supplement to the state’s per pupil funding allotment for the school. Doing the right thing, the online school provides high-quality teachers and extensive tutoring support, dynamic content, and personalized instruction with a strong response-to-intervention (RTI) program. The student accelerates at an advanced pace throughout the calendar year, using teacher-led, digital learning to engage with dynamic content and help them learn in multiple ways, understanding the progress they are making as they go along. The results are excellent: the student’s proficiency levels rise by more than two grade level equivalents in a single calendar year, and the student is testing at advanced proficient
INTERNATIONAL ASSOCIATION fOR K-12 ONLINE LEARNINg 24
levels on an adaptive assessment. The perverse incentive? The school loses the supplemental funding for bringing the ELL student up to proficiency. The question is: How could policy support or incentivize rewarding a school or school district with doing the most with the most challenged students, rather than cutting its funding? What if schools were rewarded for significant proficiency growth?
• Funding models can lead to perverse incentives when funding is not tied in any way to student outcomes. In the most extreme examples, some states base funding largely on
“single count days”—schools are funded for students being in the school on one or two days each year, usually one in fall and one in spring. This provides perverse incentives (for all schools: traditional, alternative, and online) to have students enroll prior to the “count days” in order to receive per pupil funding. Having multiple count dates for partial year funding is an important policy consideration, especially for mobile students.
• Schools (and teachers, to the extent that teachers are evaluated in part based on growth) have an incentive to show that students are behind when entering a new school, grade level, or course.
• Well-publicized measures based on a threshold of proficiency, such as California’s Academic Performance Index (API), create a perverse incentive for schools that meet the minimum threshold in that they no longer have to be concerned about the subset of students who are not yet proficient once the school has met the threshold.
• When individual programs are considered a unique school, if that school serves underperforming students, the district may have an incentive to move students to that alternative school so that scores in other schools remain higher.
• There are perverse incentives for schools to encourage severely under-credited and low performing students to transfer to another school before the graduation or assessment period due to school accountability measures. Because a student does not have to move (geographically), it becomes quite convenient for students who have not been successful in a traditional environment to transfer to a full-time online school.
Schools can be penalized under graduation rate calculations or proficiency assessments if over-age and under-credited students, or students behind grade level, arrive at the school just prior to the graduation date or the assessment. For example, many full-time online schools have very high new enrollments after the start of the 12th grade for students that are extremely credit deficient.
Currently there is a disincentive to enroll students who are under-credited or overage, students who are behind in grade level, or students who have persistent challenges with math or other core subjects. Implementing a more robust outcomes-based approach that accounts for these issues will help alleviate these concerns and allow schools to focus on educating all students, including those with the greatest need.
Education is a civil right. We must provide high-quality, rigorous educational opportunities for all students and hold schools and programs accountable. Incentives should support serving students who have greater resource needs. While performance-based funding is emerging in online learning, it is important that adequate outcomes-based quality assurance is in place to ensure we are holding all students to high levels of rigor and indeed rewarding success based on student achievement.
25Measuring Quality From Inputs to Outcomes: Creating Student Learning Performance Metrics and Quality Assurance for Online Schools
Appendix A: DefinitionsTerminology surrounding the measurement of educational quality has different meanings to different people. For example, the terms “measures,” “metrics,” and “indicators” are often used interchangeably, and stakeholders are often confused by the differences between inputs, outputs, and outcomes. Defining these terms is a necessary step to creating clarity around these complex issues.
Inputs are the essential elements that comprise the development and delivery of a course or school, such as textbooks, instructional materials, teaching, and technology. Quality assurance based on inputs often takes the form of standards or qualifications that apply to the inputs. Examples in K-12 education include state content standards, textbook adoption processes, and teacher certifications.
Outputs are defined by the Innosight Institute as the end result of a process, such as course completions.16 In an online course they may also include data showing student interaction with the course content or teacher. Outputs are sometimes used as proxies for outcomes, but are not outcomes themselves.
Outcomes measure the knowledge, skills, and abilities that students have attained as a result of their involvement in a particular set of educational experiences.17 They measure the effectiveness of the learning process, are more longitudinal in nature than outputs, and measure more than just academic achievement at a point in time. Ideally they are based on a common assessment, not one that is specific to the school or course.
Indicators are data points that are predictive. This is contrasted with evidence of accomplishment, which demonstrates success. For example, Advanced Placement exam scores are an indicator of college readiness, but evidence of college readiness is based on actual student performance in college.18
A metric is a type of measurement used to gauge some quantifiable component of performance. The metrics may take the form of assessment scores, growth rates, graduation or college acceptance rates, etc. For each of the performance indicators, there are a number of metrics that can be used to help determine levels of performance and thus quality.
Persistence is defined as continued enrollment during the next school year, even if it occurs at a different school.
16 Michael B. Horn and Katherine Mackey, Innosight Institute, Moving from Inputs to Outputs to Outcomes, http://www.innosightinstitute.org/innosight/wp-content/uploads/2011/06/Moving-from-Inputs-to-Outputs-to-Outcomes.pdf17 Linkoping University, Student Learning Outcomes, http://www.imt.liu.se/edu/Bologna/LO/slo.pdf18 Hyslop, A. & Tucker, B. (2012). Ready By Design: A College and Career Agenda for California. Retrieved September 7, 2012, from http://www.educationsector.org/publications/ready-design-college-and-career-agenda-california
INTERNATIONAL ASSOCIATION fOR K-12 ONLINE LEARNINg 26
Appendix B: Process and participantsThe following people generously donated their time in meetings and interviews to help formulate the ideas in this report. The report does not necessarily represent their views.
ParticipantsJudy Bauernschmidt Colorado Charter School Institute
Brian Bridges California Learning Resource Network
John Brim North Carolina Virtual Public School
Cheryl Charlton Idaho Digital Learning Academy
Robert Currie Montana Digital Academy
Barbara Dreyer Connections Education
Jamey Fitzpatrick Michigan Virtual University
Joe Freidhoff Michigan Virtual University
Liz Glowa Glowa Consulting
David Haglund Riverside Virtual School, Riverside Unified School District (CA)
Cindy Hamblin Illinois Virtual School
Chris Harrington Quakertown Community School District
Jay Heap Georgia Virtual School
Michael Horn Innosight Institute
Chip Hughes K12 Inc.
Karen Johnson SOCRATES Online
Steve Kossakoski Virtual Learning Academy Charter School (NH)
Alex Medler National Association of Charter School Authorizers
Melissa Myers Advanced Academics
Dawn Nordine Wisconsin Virtual School
Liz Pape The VHS Collaborative
Linda Pittenger Council of Chief State School Officers
Mickey Revenaugh Connections Learning
Terri Rowenhorst Monterey Institute for Technology and Education
Kim Rugh Florida Virtual School
Michelle Rutherford Apex Learning
Tom Ryan Education 360
Bror Saxberg Kaplan
Kay Shattuck Quality Matters
Kathy Shibley Ohio Department of Education
Nick Sproull NCAA
Eric Swanson PLATO Learning
Tom VanderArk Open Education Solutions
InterviewsJohn Bailey Digital Learning Now
Kristin Bennett Odigia
Christina Clayton Georgia Virtual School
Drew Hinds State Instructional Materials Review Association
Libbie Miller Scantron
Bryan Hassell Public Impact
Josh Moe Odigia
Bill Sanders SAS
John White SAS
Nadja Young SAS
27Measuring Quality From Inputs to Outcomes: Creating Student Learning Performance Metrics and Quality Assurance for Online Schools
Appendix C: Additional Resources ACT, The Condition of College & Career Readiness (2012). Retrieved September 7, 2012, from
http://media.act.org/documents/CCCR12-NationalReadinessRpt.pdf
Annenberg Institute for School Reform at Brown University, College Readiness: Examples of Initiatives and Programs, Retrieved September 7, 2012, from http://annenberginstitute.org/publication/college-readiness-guide-field
Barge, John D. (2012). Georgia’s College and Career Ready Performance Index (CCRPI) and ESEA Flexibility. Retrieved September 7, 2012, from http://www.gapsc.com/EducatorPreparation/NoChildLeftBehind/Admin/2012SpringConference/CCRPIandESEAflexibility3-12-12%20[Compatibility%20Mode].pdf
Bathgate, K., Colvin R.L., & Silva, E. (2011, November). Striving for Student Success: A Model of Shared Accountability. Retrieved September 7, 2012, from http://www.educationsector.org/publications/striving-student-success-model-shared-accountability
Carey, K. & Manwaring, R. (2011, May). Growth Models and Accountability: A Recipe for Remaking ESEA. Retrieved September 7, 2012, from http://www.educationsector.org/publications/growth-models-and-accountability-recipe-remaking-esea
Colvin, Richard L. (2012, May). Measures That Matter: Why California Should Scrap the Academic Performance Index. Retrieved September 7, 2012, from http://www.educationsector.org/publications/measures-matter-why-california-should-scrap-academic-performance-index
Conley, David T. (2007). Redefining College Readiness. Retrieved September 7, 2012, from http://www.aypf.org/documents/RedefiningCollegeReadiness.pdf
Conley, David T. (2011). Defining and Measuring College and Career Readiness. Retrieved September 7, 2012, from http://programs.ccsso.org/projects/Membership_Meetings/APF/documents/Defining_College_Career_Readiness.pdf
Curran, B. & Reyna, R. (2010). Implementing Graduation Counts State Progress to Date 2010. Retrieved September, 7, 2012, from http://www.nga.org/files/live/sites/NGA/files/pdf/1012GRADCOUNTSPROGRESS.PDF
Dahlin, M. & Cronin, J. (2010, January). Achievement Gaps and the Proficiency Trap. Retrieved September, 7, 2012, from http://www.kingsburycenter.org/sites/default/files/achievement-gaps-and-the-proficiency-trap.pdf
Davis, B. & Ice, P. (n.d). The Predictive Analytics Reporting (PAR) Framework. Retrieved September, 7, 2012, from http://wcet.wiche.edu/advance/par-framework
Education Policy Improvement Center, College and Career Readiness. Retrieved September 7, 2012, from https://www.epiconline.org/readiness/index.dot
INTERNATIONAL ASSOCIATION fOR K-12 ONLINE LEARNINg 28
Fairfax County Public Schools, Department of Professional Learning and Accountability (2010), Charting our Success: Options for Academic Benchmarking in Fairfax County Public Schools. Retrieved September 8, 2012, http://www.fcps.edu/pla/ope/docs/academic_benchmarking_options.pdf
Goldschmidt, P., Choi, K. & Beaudoin, J.P. (2012). Growth Model Comparison Study: Practical Implications of Alternative Models for Evaluating School Performance. Retrieved September 7, 2012, from http://www.ccsso.org/Documents/2012/Growth_Model_Comparison_Study_Evaluating_School_Performance_2012.pdf
Goldstein, J. & Behuniak, P. (2005). Growth Models in Action: Selected Case Studies. Retrieved September 7, 2012, from http://pareonline.net/pdf/v10n11.pdf
Horn, M. & Mackey, K. (2011, July). Moving from inputs to outputs to outcomes: The future of education policy. Retrieved September 7, 2012, from http://www.innosightinstitute.org/innosight/wp-content/uploads/2011/06/Moving-from-Inputs-to-Outputs-to-Outcomes.pdf
Hossler, D., Shapiro, D., Chen, A., Zerquera, D., Ziskin, M., & Torres, V. (2012, July). Reverse Transfer: A National View of Student Mobility from Four-Year to Two-Year. Retrieved September 7, 2012, from http://www.insidehighered.com/sites/default/server_files/files/NSC_Signature_Report_3.pdf
Hyslop, A. & Tucker, B. (2012). Ready By Design: A College and Career Agenda for California. Retrieved September 7, 2012, from http://www.educationsector.org/publications/ready-design-college-and-career-agenda-california
Jerald, C. (2012, January). On Her Majesty’s School Inspection Service. Retrieved September 7, 2012, from http://www.educationsector.org/publications/her-majestys-school-inspection-service
McAlister, S. & Mevs, P. (2012). College Readiness: A Guide to the Field. Retrieved September 7, 2012, from http://annenberginstitute.org/sites/default/files/CRIS_Guide.pdf
National Association of Charter School Authorizers, NACSA Academic Performance Framework and Guidance (August, 2012).
National Center for Educational Statistics, National Assessment of Educational Progress (NAEP), Retrieved September 7, 2012, from http://nces.ed.gov/nationsreportcard/
National Governors Association, Implementing Graduation Counts: State Progress to Date (2010), Washington, DC: National Governors Association. Retrieved September 7, 2012, from http://www.nga.org/cms/home/nga-center-for-best-practices/center-publications/page-edu-publications/col2-content/main-content-list/implementing-graduation-2010.html
SAS Institute Inc., What should educators know about EVAAS student projection?. Retrieved September 7, 2012.
29Measuring Quality From Inputs to Outcomes: Creating Student Learning Performance Metrics and Quality Assurance for Online Schools
The Postsecondary and Work Force Readiness Working Group, The Road Map to College and Career Readiness for Minnesota Students (June, 2009). Retrieved September 7, 2012, from http://www.massp.org/downloads/readiness.pdf
University of Minnesota. (2011). College Ready Minnesota. Retrieved September 7, 2012, from http://www.collegeready.umn.edu/resources/documents/CRC_booklet-May_2011.pdf
U.S. Department of Education, ESEA Flexibility. Retrieved September 7, 2012, from http://www.ed.gov/esea/flexibility
U.S. Department of Education, High School Graduation Rate (2008). Retrieved September 7, 2012, from http://www2.ed.gov/policy/elsec/guid/hsgrguidance.pdf
Wright, Paul S. (2010). An Investigation of Two Nonparametric Regression Models for Value-Added Assessment in Education. Retrieved September 7, 2012, from http://www.sas.com/resources/whitepaper/wp_16975.pdf
INTERNATIONAL ASSOCIATION fOR K-12 ONLINE LEARNINg 30

31Measuring Quality From Inputs to Outcomes: Creating Student Learning Performance Metrics and Quality Assurance for Online Schools

INTERNATIONAL ASSOCIATION fOR K-12 ONLINE LEARNINg 32

TOLL-FREE 888.95.NACOL (888.956.2265) DIRECT 703.752.6216 FAx 703.752.6201EmAIL [email protected] wEb www.inacol.org
mAIL 1934 Old Gallows Road, Suite 350, Vienna, VA 22182-4040