Embed Size (px)
Citation preview
8/3/2019 Measuring Public Benefit from Energy Efficient Homes
http://slidepdf.com/reader/full/measuring-public-benefit-from-energy-efficient-homes 1/40

8/3/2019 Measuring Public Benefit from Energy Efficient Homes
http://slidepdf.com/reader/full/measuring-public-benefit-from-energy-efficient-homes 2/40
P H O E N I X H O M E E N E R G Y E F F I C I E N C Y S T U D Y [ P A G E 1 ]
Author
Colby Swanson, Advanced Energy
Secondary Authors
Michael Blasnik, M. Blasnik & Associates
Eric Calhoun, Advanced Energy
Organizations
U.S. Environmental Protection Agency
Arizona Public Service
Beazer Homes
Chas Roberts Air Conditioning
Continental Homes
D.R. Wastchak, LLC
Hacienda Builders
Pulte Homes
Royce Homes
Sonoran Air, Inc.
Southwest Gas
Contributors
Keith Aldridge, Advanced Energy Brandon Baker, Independent Contractor Bruce Davis, Advanced Energy Minda Daughtry, Advanced Energy Sharon Gladwell, Advanced Energy Dirk Haupt, D.R. Wastchak, LLC Tom Hines, Arizona Public Service Arnie Katz, Advanced Energy Jodie Lanning, Advanced Energy Ward Lenz, Advanced Energy Thom Lynch, Masco Contractor Services’ Environments for Living
®
Susan Mollere, Arizona Public Service Susan Moreland, Arizona Public Service Timm Muth, Littlestone Technical Services Rita Ransom, Southwest Gas Sam Rashkin, U.S. Environmental Protection Agency Energy Star ® Homes Program Lane Smith, Advanced Energy Brad Townsend, Masco Contractor Services’ Environments for Living ®
Daran Wastchak, D.R. Wastchak, LLC Ashley Yeh, Independent Contractor
Advanced Energy
909 Capability Drive, Suite 2100
Raleigh, NC 27606-3870
1-919-857-9000 | www.advancedenergy.org

8/3/2019 Measuring Public Benefit from Energy Efficient Homes
http://slidepdf.com/reader/full/measuring-public-benefit-from-energy-efficient-homes 3/40
P H O E N I X H O M E E N E R G Y E F F I C I E N C Y S T U D Y [ P A G E 2 ]
Table of
Contents
Executive Summary........................................................... 3
Introduction........................................................................ 5
Data Collection .................................................................. 9
Data Analysis................................................................... 14
Results............................................................................. 32
Conclusions ..................................................................... 34
Recommendations for Further Study............................... 36
Resources ....................................................................... 37
Appendix.......................................................................... 38
8/3/2019 Measuring Public Benefit from Energy Efficient Homes
http://slidepdf.com/reader/full/measuring-public-benefit-from-energy-efficient-homes 4/40
P H O E N I X H O M E E N E R G Y E F F I C I E N C Y S T U D Y [ P A G E 3 ]
Executive
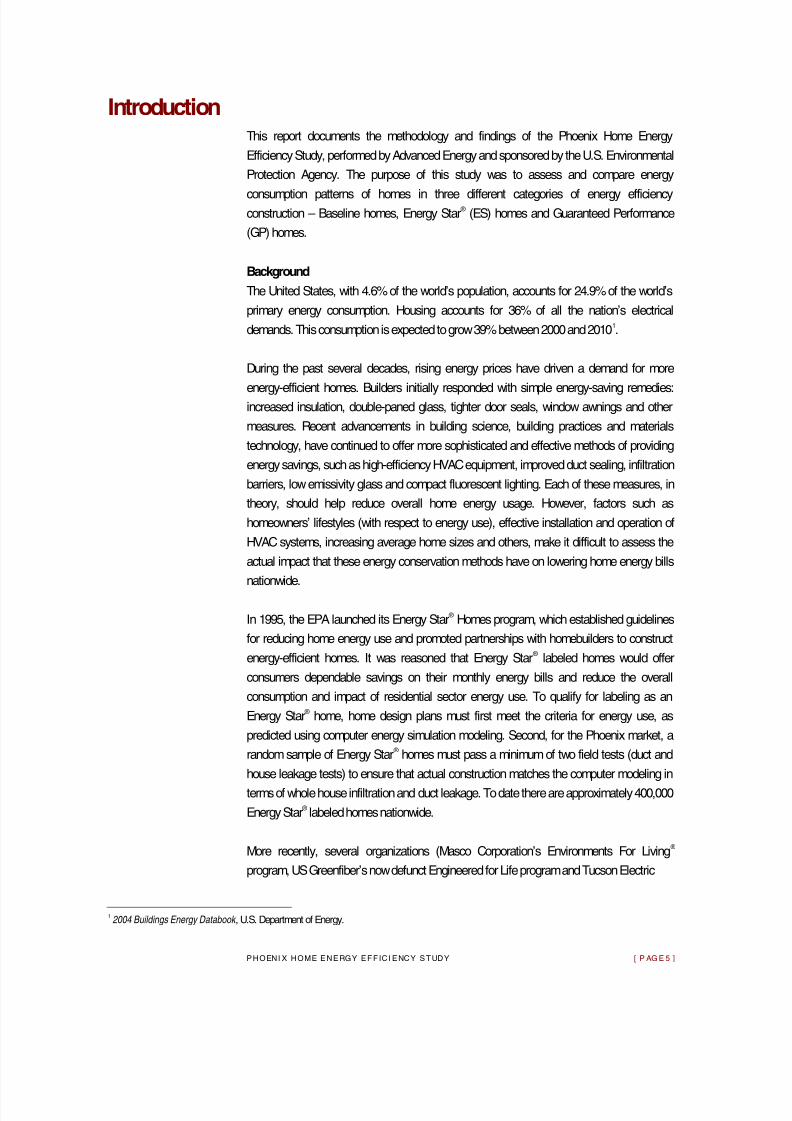
Summary For more than 30 years, a variety of approaches have been tried to improve the energy
efficiency of newly-constructed homes. In the Phoenix area over the last few years, homes
can be placed in three broad categories based on the energy “labeling” selected by the
builder:
1) Baseline homes - the current building code
2) Energy Star ® labeled homes
3) Guaranteed Performance homes
There are millions of homes constructed to code minimums, about 400,000 Energy Star ®
compliant homes and over 60,000 Guaranteed Performance homes have been built to date.
However, there is not enough actual consumption data being analyzed to determine the
impact these programs are having on energy reduction. The objective of the Phoenix Home
Energy Efficiency Study was to assess Baseline, Energy Star ® (ES) and Guaranteed
Performance (GP) homes and determine if homes in these three groups can be
distinguished from each other in terms of actual energy usage.
This study showed that the bar has been raised for home energy performance in the
Phoenix area as a result of U.S. Environmental Protection Agency’s Energy Star ® and
various Guaranteed Performance home programs. These programs have been instrumental
in the education and training of consumers, builders and contractors about the benefits and
construction of higher performing homes. The Environmental Protection Agency, Arizona
Public Service and Southwest Gas should be especially recognized for their support of this
study, which was initiated to provide a model for ongoing efforts to illuminate impact as well
as provide a model feedback mechanism to support continuous improvement.
A study conducted in May 2000 surveyed 291 homes in the Arizona Public Service territory,
segregating the homes into four categories based only on their Energy Star ® status and the
presence of swimming pools. The conclusions of this previous study indicated that Energy
Star ® homes as a whole (pool or no pool) used only 2.3% less energy per square foot than
non-Energy Star ® homes. However, the limited size and scope of the research does not
represent the two categories adequately.
The Phoenix Home Energy Efficiency Study included a much larger and more diverse
sample size. We evaluated a total of 7,141 houses, including 3,336 Baseline homes, 2,979
Energy Star ® homes and 826 Guaranteed Performance homes. In addition to energy use
profiles, we also collected information on square footage, number of stories, vintage,
orientation, existence of a pool and other general characteristics.

8/3/2019 Measuring Public Benefit from Energy Efficient Homes
http://slidepdf.com/reader/full/measuring-public-benefit-from-energy-efficient-homes 5/40
P H O E N I X H O M E E N E R G Y E F F I C I E N C Y S T U D Y [ P A G E 4 ]
The energy consumption habits of sample home occupants were not evaluated as part of
this study. While lifestyle choices can affect the overall energy consumption of a home, the
large statistical sample of homes used for this study should reduce the significance of this
variable.
The effects of variables were limited by creating similar subsets of homes. The most comparable subset suggested that the Energy Star ® homes on average used 3.50 kWh/ft 2 ,
compared to 4.16 kWh/ft 2 for the typical Baseline (BaseREG) homes. This represents a
savings of 16% for summer/cooling intensity. The same subset of Guaranteed Performance
homes consumed 2.80 kWh/ft 2 on average, 33% lower summer/cooling intensity than the
typical Baseline homes and 20% below Energy Star ® homes.
However, since the typical Energy Star ® and Guaranteed Performance home used in this
study were physically larger than the typical Baseline home, the average annual electric
consumption for both groups was larger than the Baseline homes. Baseline homes used
14,107 kWh per year on average, Guaranteed Performance homes used 14,904 kWh per year and Energy Star ® homes used an average of 15,831 kWh per year.
Implementation of the Energy Star ® and Guaranteed Performance programs can yield
improvements in the overall energy efficiency of new homes, as compared to homes built to
standard practices. It also appears that the increasing size of the average home, a trend the
entire country is experiencing (and the subsequent increasing energy use), offsets to a
large degree the savings achieved through improvements in home energy efficiency. To
realize actual reductions in overall energy usage along with the environmental, economic
and health benefits associated with those reductions, the trend to build larger homes must
also be addressed.
8/3/2019 Measuring Public Benefit from Energy Efficient Homes
http://slidepdf.com/reader/full/measuring-public-benefit-from-energy-efficient-homes 6/40
P H O E N I X H O M E E N E R G Y E F F I C I E N C Y S T U D Y [ P A G E 5 ]
Introduction This report documents the methodology and findings of the Phoenix Home Energy
Efficiency Study, performed by Advanced Energy and sponsored by the U.S. Environmental
Protection Agency. The purpose of this study was to assess and compare energy
consumption patterns of homes in three different categories of energy efficiency construction – Baseline homes, Energy Star ® (ES) homes and Guaranteed Performance
(GP) homes.
Background
The United States, with 4.6% of the world’s population, accounts for 24.9% of the world’s
primary energy consumption. Housing accounts for 36% of all the nation’s electrical
demands. This consumption is expected to grow 39% between 2000 and 2010 1.
During the past several decades, rising energy prices have driven a demand for more
energy-efficient homes. Builders initially responded with simple energy-saving remedies:increased insulation, double-paned glass, tighter door seals, window awnings and other
measures. Recent advancements in building science, building practices and materials
technology, have continued to offer more sophisticated and effective methods of providing
energy savings, such as high-efficiency HVAC equipment, improved duct sealing, infiltration
barriers, low emissivity glass and compact fluorescent lighting. Each of these measures, in
theory, should help reduce overall home energy usage. However, factors such as
homeowners’ lifestyles (with respect to energy use), effective installation and operation of
HVAC systems, increasing average home sizes and others, make it difficult to assess the
actual impact that these energy conservation methods have on lowering home energy bills
nationwide.
In 1995, the EPA launched its Energy Star ® Homes program, which established guidelines
for reducing home energy use and promoted partnerships with homebuilders to construct
energy-efficient homes. It was reasoned that Energy Star ® labeled homes would offer
consumers dependable savings on their monthly energy bills and reduce the overall
consumption and impact of residential sector energy use. To qualify for labeling as an
Energy Star ® home, home design plans must first meet the criteria for energy use, as
predicted using computer energy simulation modeling. Second, for the Phoenix market, a
random sample of Energy Star ® homes must pass a minimum of two field tests (duct and
house leakage tests) to ensure that actual construction matches the computer modeling in
terms of whole house infiltration and duct leakage. To date there are approximately 400,000
Energy Star ® labeled homes nationwide.
More recently, several organizations (Masco Corporation’s Environments For Living ®
program, US Greenfiber’s now defunct Engineered for Life program and Tucson Electric
12004 Buildings Energy Databook , U.S. Department of Energy.
8/3/2019 Measuring Public Benefit from Energy Efficient Homes
http://slidepdf.com/reader/full/measuring-public-benefit-from-energy-efficient-homes 7/40
P H O E N I X H O M E E N E R G Y E F F I C I E N C Y S T U D Y [ P A G E 6 ]
Power’s program) have been promoting the construction of Guaranteed Performance
homes. These homes are designed to go a step beyond the Energy Star ® program, using
advanced building science materials and techniques to lower home energy use even
further. For Guaranteed Performance homes, the standards and testing protocol are even
more stringent than Energy Star ® in order to ensure increased energy performance. To
offset the slightly higher cost of these Guaranteed Performance homes and enhance their marketability, the builders or program administrators actually guarantee that the homes’
energy usage will not exceed a certain average level or the excess costs will be refunded to
the homeowners. The programs also include a comfort guarantee that compliments the
cooling/heating usage guarantee. But once again, no comprehensive study has been
conducted to show how these Guaranteed Performance homes compare to Baseline
homes of similar style in terms of actual energy use over time. To date, more than 60,000
houses nationwide have been built and certified to the Guaranteed Performance standards
(Masco, US Greenfiber and Tucson Electric Power).
Little data has been collected to date on how these homes (Baseline, Energy Star ®
,Guaranteed Performance) actually performed while occupied under real world conditions.
Five years ago an Arizona State University (ASU) thesis study 2 conducted in the Phoenix,
Arizona area examined the energy consumption of 291 homes, comparing Energy Star ®
homes to non-Energy Star ® (Baseline) homes, both with and without pools. The report
concluded that the Energy Star ® homes in the study used only 2.3% less energy per square
foot than the Baseline homes, a much smaller savings than anticipated. However, the
sample size of that study was too small to be indicative of the market at large. The ASU
study also used houses from some of the first Energy Star ® communities built in the
Phoenix area; earlier homes with energy performance may have been substantially lower
than newer homes built to current Energy Star
®
levels.
Phoenix Building Market Overview
The Phoenix, Arizona market was an early adopter of both the Energy Star ® and
Guaranteed Performance programs. It is also one of the first areas in the country to realize
significant market penetration of energy-efficient home construction with large populations
of Baseline, Energy Star ® and Guaranteed Performance homes. Given that these programs
have been operating in Arizona for over five years now, Phoenix offers an excellent
opportunity to verify energy consumption data on the three home types under real-world
conditions.
In 2004, the Phoenix area became the largest market in the country for new housing
construction, with more than 60,000 new homes started. Production construction dominates
the new construction market in Phoenix, with many national residential homebuilders working
in the area. Home building contractors are more consolidated in Phoenix than in most cities,
2 Energy Consumption Comparison of Energy Star Homes in Phoenix, Arizona, Bradley Jay Bashford, Arizona State University, May 2000.
8/3/2019 Measuring Public Benefit from Energy Efficient Homes
http://slidepdf.com/reader/full/measuring-public-benefit-from-energy-efficient-homes 8/40
P H O E N I X H O M E E N E R G Y E F F I C I E N C Y S T U D Y [ P A G E 7 ]
which means that when one contractor changes their business practices, it can impact a
significant portion of the market. One HVAC contractor in particular installs more than 70% of
all new residential HVAC systems in the Phoenix market area. This same contractor installed
the majority of the HVAC systems on the homes in our study.
The builders in Phoenix have provided strong support of the Energy Star ®
and Guaranteed Performance programs through consistent and rigorous field testing of duct leakage and
home infiltration. An important driver for their support is that the cost of performance testing
for the builders is partially subsidized through a utility company, furthering the acceptance
of energy-efficient homes.
Study Objectives
This study was structured to compare the actual energy efficiency of Baseline homes,
Energy Star ® and Guaranteed Performance program homes, while taking into consideration
a large number of variables in home design. The study looks at real data and real energy
performance of occupied houses, not computer models. The results of the study could then
be used to answer several fundamental questions about the effectiveness of these
efficiency programs:
How much energy did the Baseline, Energy Star ® and Guaranteed
Performance homes actually consume?
How much energy savings are actually realized by Energy Star ® and
Guaranteed Performance homes, compared to similar Baseline homes?
Has the implementation of energy efficiency programs in new home
construction resulted in a reduction of total energy consumption?
This study was not intended to determine the degree of success of the Energy Star ® and
Guaranteed Performance programs. It does not make any interpretations as to why certain
houses performed well or performed poorly, nor does it compare actual performance
against computer modeling.
Survey Population
More than 7,000 homes built from 1995-2004 by six different production building
companies, were included in this study: 3,336 Baseline homes, 2,979 Energy Star ® homes,
and 826 Guaranteed Performance homes. Details on the physical design and construction
of the various homes (such as HVAC ratings, window size and types and volume) were
obtained from the home builders, utilities, contractors and testing companies. Energy use
histories for the homes were provided by Arizona Public Service (APS) and Southwest Gas
Corporation, over the period of 1998 through 2004. County records were used to identify
those homes with swimming pools and to collect additional information on floor area.
8/3/2019 Measuring Public Benefit from Energy Efficient Homes
http://slidepdf.com/reader/full/measuring-public-benefit-from-energy-efficient-homes 9/40
P H O E N I X H O M E E N E R G Y E F F I C I E N C Y S T U D Y [ P A G E 8 ]
Study Limitations
One significant factor not addressed by this study is the impact of the energy consumption
habits (lifestyle) of the home occupants on overall energy use. Lifestyle choices can result
in wide variances in both the total energy use and the efficiency or performance of a home.
Some lifestyle differences, such as variations in thermostat settings, could reasonably be
documented. Other choices that affect home energy use can be much more difficult to
verify. Opening and closing doors and windows can greatly affect the performance of some
HVAC systems. Even something as simple as occupants running repeat loads of laundry
could skew the survey results for an otherwise energy-efficient home. To account for this
variability, the authors used a statistically large sample of homes to diffuse the impact of the
lifestyle variable on the results of the study. It is assumed that the range of homeowner
behavior is equally represented across all three categories.
Anticipated Significance of Study Findings
The results of this study will offer a better understanding of the true energy value of the three levels of home construction (Baseline, ES and GP). These findings will help the
managers of the EPA Energy Star ® program fine-tune their program guidelines to ensure
that the most cost-effective, energy saving measures are identified and implemented into
new home construction. For homebuilders, utilities, contractors and other industry
professionals, the positive results of this study will provide compelling evidence to support
their claims of increased energy savings and help expand the market share of energy-
efficient homes. Utility services may also benefit from this study by using the data results to
help identify future trends in the housing market and predict patterns of energy use.

8/3/2019 Measuring Public Benefit from Energy Efficient Homes
http://slidepdf.com/reader/full/measuring-public-benefit-from-energy-efficient-homes 10/40
P H O E N I X H O M E E N E R G Y E F F I C I E N C Y S T U D Y [ P A G E 9 ]
Data
Collection Data Sets
For the 7,141 houses included in this study, data was compiled and analyzed based on the following three categories:
Baseline Homes
These “code” homes were not built as part of any energy efficiency program, but
their building characteristics resemble those of the other homes in the study.
Typical baseline homes built between 1998 and 2004 in the Phoenix area are
anecdotally considered to be 20% more efficient than homes built to the 1993
Model Energy Codes (MEC) standards. The Baseline homes provide a standard
for energy use, allowing the research team to determine the actual savings
presented by the ES and GP program homes. Most of the builders included in the
study offer Baseline homes for sale, as well as similar homes built to ES and/or
GP program standards.
Energy Star ® Homes
Energy Star ® (ES) homes meet or exceed the energy efficiency standards set by
the EPA’s Energy Star ® program. By definition, Energy Star ® qualified homes are
independently verified to be at least 30% more energy efficient than the same
home built to 1993 MEC or 15% more efficient than state energy code, whichever
is more rigorous. These savings are based on heating, cooling and hot water
energy use. Approximately 15% of the ES homes in this study were field tested
for duct and envelope leakage.
A typical upgrade to qualify for Energy Star ® in Phoenix during the time of this
study was either to install a SEER 12 air conditioner or low emissivity windows
(Low E) or both.
Guaranteed Performance Homes
Guaranteed Performance (GP) homes not only qualify for Energy Star ® status but
also generally include additional energy efficiency improvements. The energy
performance of these homes is actually guaranteed by the builders or program
managers not to exceed a certain level based on energy modeling. The GP
program guarantees that the energy used to heat and cool the home will not
exceed the Guaranteed Usage listed on the front of the homeowners guarantee
( www.eflhome.com ). In order to successfully deliver on these guarantees, a
minimum of 15% of these homes undergo a framing inspection, air barrier
inspection, insulation inspection, duct leakage testing, envelope leakage testing
and room pressure testing. Homes in this category are Energy Star ® qualified but
8/3/2019 Measuring Public Benefit from Energy Efficient Homes
http://slidepdf.com/reader/full/measuring-public-benefit-from-energy-efficient-homes 11/40
P H O E N I X H O M E E N E R G Y E F F I C I E N C Y S T U D Y [ P A G E 10 ]
for purposes of this report, they were not included in the data set for homes that
exclusively participated in the Energy Star ® program.
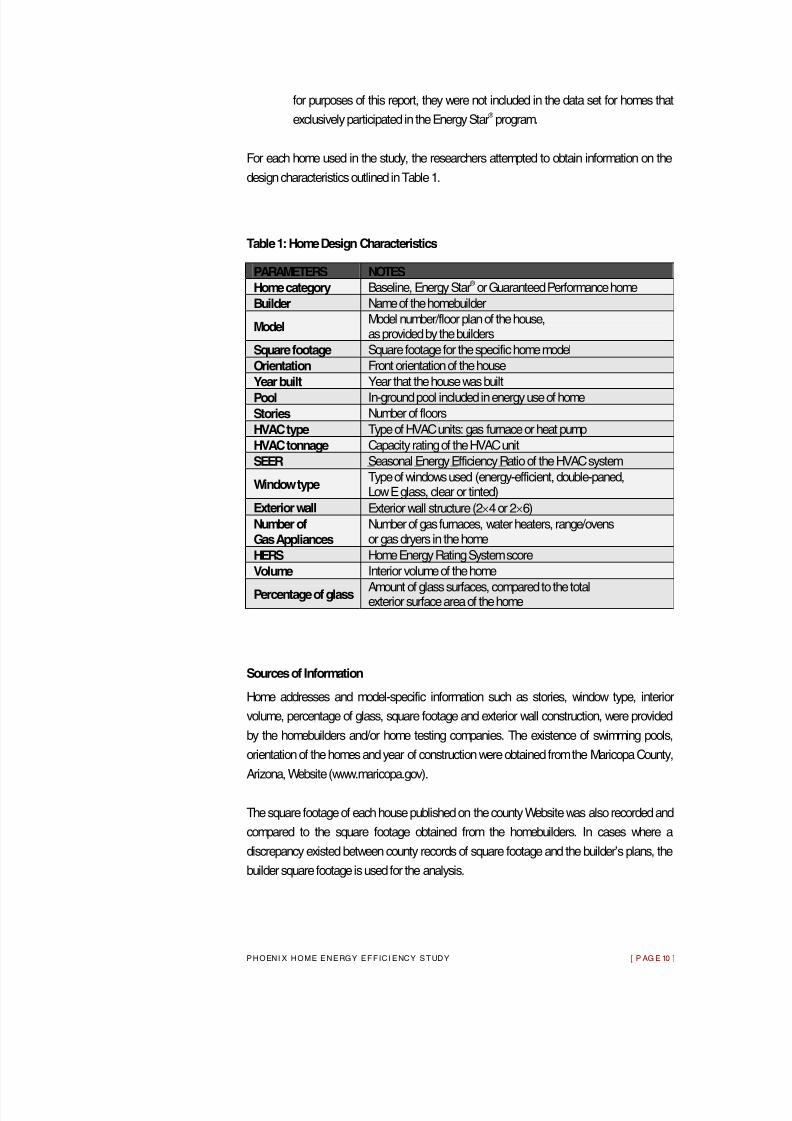
For each home used in the study, the researchers attempted to obtain information on the
design characteristics outlined in Table 1.
Table 1: Home Design Characteristics
PARAMETERS NOTES
Home category Baseline, Energy Star ® or Guaranteed Performance home
Builder Name of the homebuilder
ModelModel number/floor plan of the house,as provided by the builders
Square footage Square footage for the specific home model
Orientation Front orientation of the house
Year built Year that the house was built
Pool In-ground pool included in energy use of home Stories Number of floors
HVAC type Type of HVAC units: gas furnace or heat pump
HVAC tonnage Capacity rating of the HVAC unit
SEER Seasonal Energy Efficiency Ratio of the HVAC system
Window type Type of windows used (energy-efficient, double-paned,Low E glass, clear or tinted)
Exterior wall Exterior wall structure (2 4 or 2 6)Number of Gas Appliances
Number of gas furnaces, water heaters, range/ovens or gas dryers in the home
HERS Home Energy Rating System score
Volume Interior volume of the home
Percentage of glass Amount of glass surfaces, compared to the totalexterior surface area of the home
Sources of Information
Home addresses and model-specific information such as stories, window type, interior
volume, percentage of glass, square footage and exterior wall construction, were provided
by the homebuilders and/or home testing companies. The existence of swimming pools,
orientation of the homes and year of construction were obtained from the Maricopa County,
Arizona, Website (www.maricopa.gov).
The square footage of each house published on the county Website was also recorded and
compared to the square footage obtained from the homebuilders. In cases where a
discrepancy existed between county records of square footage and the builder’s plans, the
builder square footage is used for the analysis.

8/3/2019 Measuring Public Benefit from Energy Efficient Homes
http://slidepdf.com/reader/full/measuring-public-benefit-from-energy-efficient-homes 12/40
P H O E N I X H O M E E N E R G Y E F F I C I E N C Y S T U D Y [ P A G E 11 ]
The electric usage (kWh) history from January 1998 to 2004 was provided by Arizona
Public Service (APS). The gas usage (therm) history for 2002 and 2003 was provided by
Southwest Gas (SWG).
Survey Methodology
To maximize energy savings in this geographic area and climate at a reasonable cost, most
builders in the area focus on energy efficiency improvements related to the following items:
Square footage
Higher performance windows
Higher performance HVAC equipment (SEER rating)
Properly installed insulation
Reduced duct leakage
By no means is this list complete. Builders and homeowners may elect to include many
other energy efficiency improvements. However, current research argues that the areas
outlined above are the largest contributors to energy savings – or waste – outside occupant
lifestyle.
The data collection and analysis process for this study is detailed below:
Selected most builders based on current involvement in Energy Star ® and
Guaranteed Performance programs. These builders also built houses in the
Baseline category prior to implementing the home efficiency programs.
Selected one production builder who was not involved in any home efficiency
program.
Selected all GP subdivisions and most ES subdivisions in APS territory.
Selected Baseline subdivisions from GP and ES builders built prior to
entering the efficiency programs.
Collected data directly from builders.
Collected data from the county Website, contractors, utilities and home
performance testing companies.
Entered all data into a database designed by APS and Advanced Energy.
Collected utility data from APS and SWG. Links between utility data and
street addresses were hidden to protect the privacy of the homeowners.
Analyzed data.
Caveats
Data provided by supporting organization, individual and homebuilders and
obtained from the Maricopa County Website were not field verified by
Advanced Energy.
8/3/2019 Measuring Public Benefit from Energy Efficient Homes
http://slidepdf.com/reader/full/measuring-public-benefit-from-energy-efficient-homes 13/40
P H O E N I X H O M E E N E R G Y E F F I C I E N C Y S T U D Y [ P A G E 12 ]
Not all information on all the parameters listed in Table 1 is completed for
every house in the study. Therefore, some parameters were not able to be
used during the analysis.
In the case of discrepancies between county records and builder square
footage, the builder square footage was used for the analysis. This could
lead to discrepancies of the square footage of a home. In rare cases, the discrepancies, due to misidentification of a model number, may lead to
incorrect assumptions on model-specific information.
The energy consumption habit of the occupants (lifestyle) is not directly
evaluated in this study. Advanced Energy realizes that lifestyle is an
important variable that can affect the energy consumption of a home
significantly. Therefore, a large statistical sample size is used to minimize
the significance of the variable.
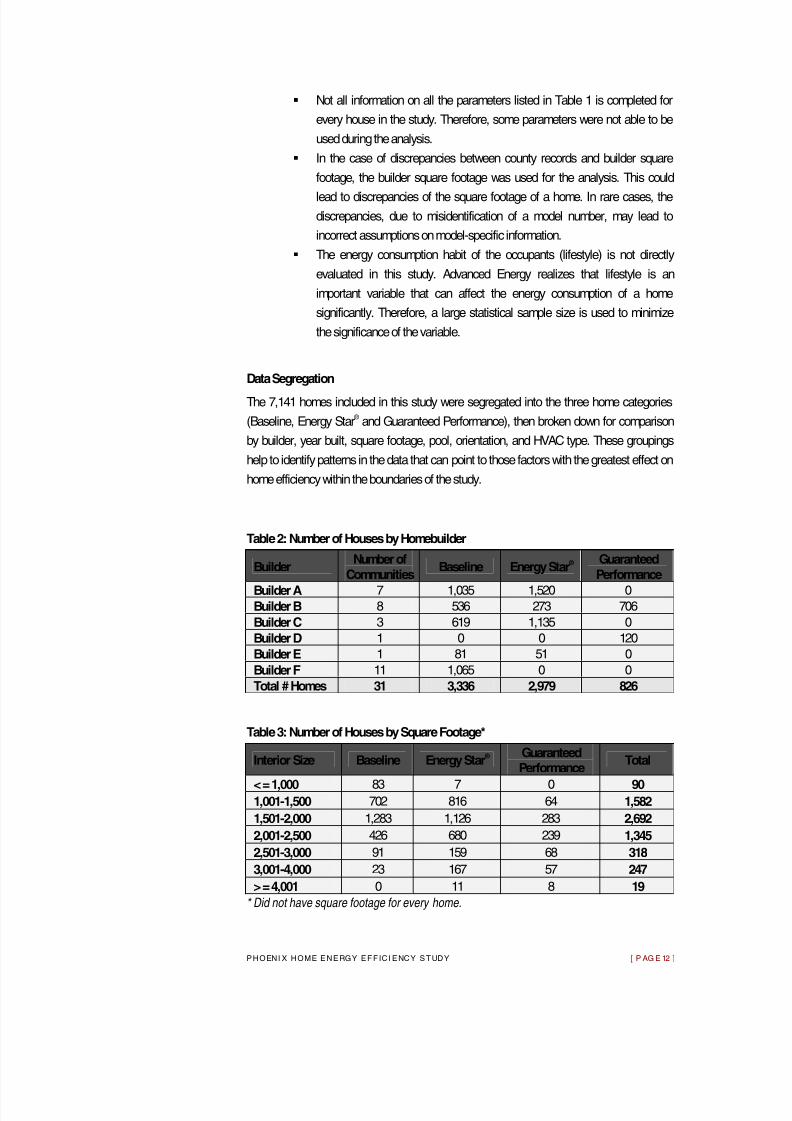
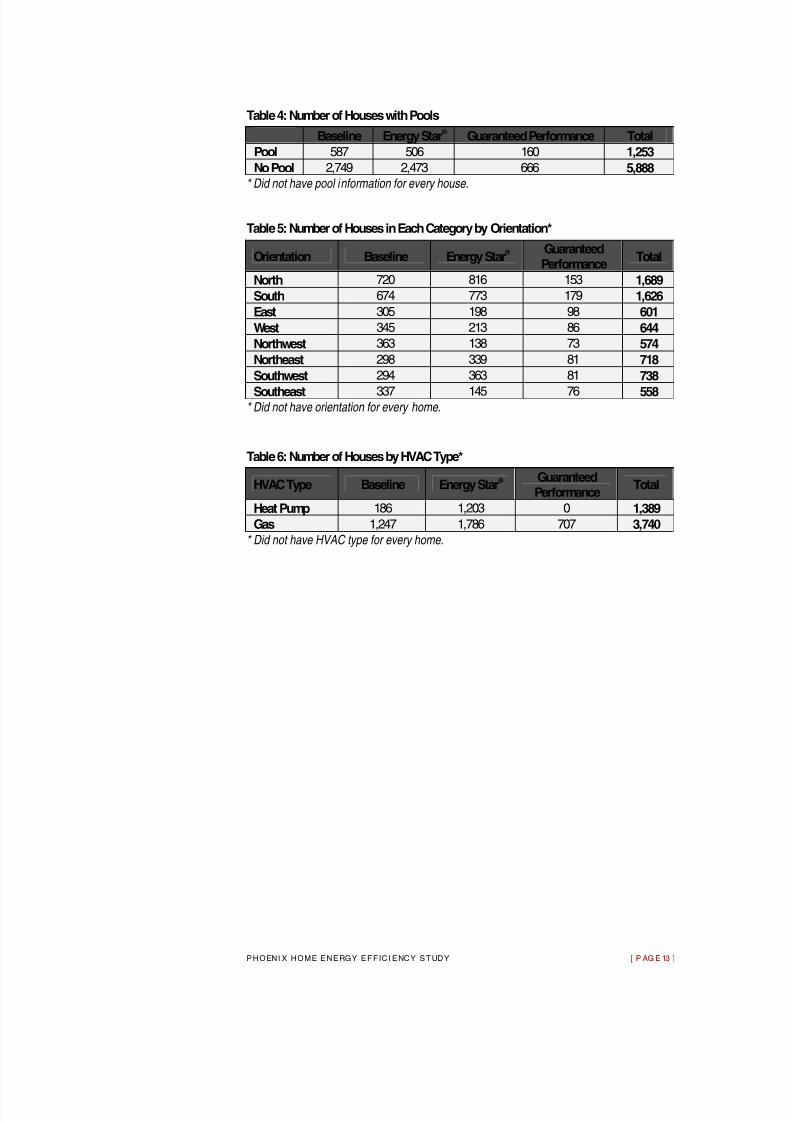
Data Segregation
The 7,141 homes included in this study were segregated into the three home categories
(Baseline, Energy Star ® and Guaranteed Performance), then broken down for comparison
by builder, year built, square footage, pool, orientation, and HVAC type. These groupings
help to identify patterns in the data that can point to those factors with the greatest effect on
home efficiency within the boundaries of the study.
Table 2: Number of Houses by Homebuilder
Builder Number of
Communities Baseline Energy Star
® Guaranteed Performance
Builder A 7 1,035 1,520 0 Builder B 8 536 273 706
Builder C 3 619 1,135 0
Builder D 1 0 0 120
Builder E 1 81 51 0
Builder F 11 1,065 0 0
Total # Homes 31 3,336 2,979 826
Table 3: Number of Houses by Square Footage*
Interior Size Baseline Energy Star ® Guaranteed
Performance Total
< = 1,000 83 7 0 90 1,001-1,500 702 816 64 1,582
1,501-2,000 1,283 1,126 283 2,692
2,001-2,500 426 680 239 1,345
2,501-3,000 91 159 68 318
3,001-4,000 23 167 57 247
> = 4,001 0 11 8 19
* Did not have square footage for every home.
8/3/2019 Measuring Public Benefit from Energy Efficient Homes
http://slidepdf.com/reader/full/measuring-public-benefit-from-energy-efficient-homes 14/40
P H O E N I X H O M E E N E R G Y E F F I C I E N C Y S T U D Y [ P A G E 13 ]
Table 4: Number of Houses with Pools
Baseline Energy Star ®
Guaranteed Performance Total
Pool 587 506 160 1,253
No Pool 2,749 2,473 666 5,888 * Did not have pool information for every house.
Table 5: Number of Houses in Each Category by Orientation*
Orientation Baseline Energy Star ® Guaranteed
Performance Total
North 720 816 153 1,689
South 674 773 179 1,626
East 305 198 98 601
West 345 213 86 644
Northwest 363 138 73 574
Northeast 298 339 81 718
Southwest 294 363 81 738
Southeast 337 145 76 558 * Did not have orientation for every home.
Table 6: Number of Houses by HVAC Type*
HVAC Type Baseline Energy Star ® Guaranteed
Performance Total
Heat Pump 186 1,203 0 1,389
Gas 1,247 1,786 707 3,740
* Did not have HVAC type for every home.
8/3/2019 Measuring Public Benefit from Energy Efficient Homes
http://slidepdf.com/reader/full/measuring-public-benefit-from-energy-efficient-homes 15/40
P H O E N I X H O M E E N E R G Y E F F I C I E N C Y S T U D Y [ P A G E 14 ]
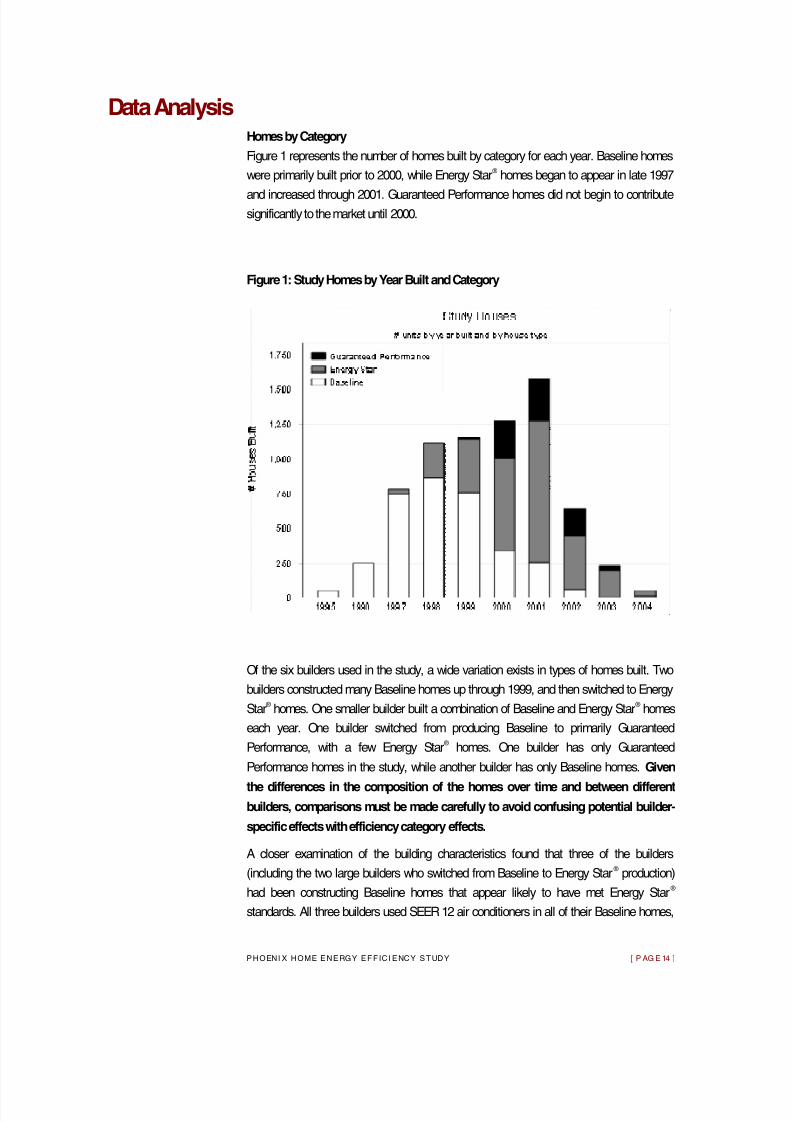
Data Analysis Homes by Category
Figure 1 represents the number of homes built by category for each year. Baseline homes
were primarily built prior to 2000, while Energy Star ® homes began to appear in late 1997
and increased through 2001. Guaranteed Performance homes did not begin to contribute significantly to the market until 2000.
Figure 1: Study Homes by Year Built and Category
Of the six builders used in the study, a wide variation exists in types of homes built. Two
builders constructed many Baseline homes up through 1999, and then switched to Energy
Star ® homes. One smaller builder built a combination of Baseline and Energy Star ® homes
each year. One builder switched from producing Baseline to primarily Guaranteed
Performance, with a few Energy Star ® homes. One builder has only Guaranteed
Performance homes in the study, while another builder has only Baseline homes. Given
the differences in the composition of the homes over time and between different
builders, comparisons must be made carefully to avoid confusing potential builder-
specific effects with efficiency category effects.
A closer examination of the building characteristics found that three of the builders
(including the two large builders who switched from Baseline to Energy Star ® production)
had been constructing Baseline homes that appear likely to have met Energy Star ®
standards. All three builders used SEER 12 air conditioners in all of their Baseline homes,
8/3/2019 Measuring Public Benefit from Energy Efficient Homes
http://slidepdf.com/reader/full/measuring-public-benefit-from-energy-efficient-homes 16/40
P H O E N I X H O M E E N E R G Y E F F I C I E N C Y S T U D Y [ P A G E 15 ]
and two of the builders also used all Low E windows. These two energy saving features –
SEER 12 HVAC and Low E glass – are perhaps the main changes required to meet Energy
Star ® standards in Phoenix. Indeed most homes only need one of these two features to
meet Energy Star ® standards given the already tight construction and high envelope R-
values common to Phoenix construction practices.
Overall, slightly more than half of all Baseline homes appear to have met Energy
Star ®
standards. This has the effect of raising the overall average efficiency of the
Baseline homes and could skew the amount of energy savings apparently available
in the Energy Star ®
and Guaranteed Performance homes. For this reason, the Baseline
category of homes was broken down further (BaseES and BaseReg) to distinguish between
those Baseline homes “masquerading” as Energy Star ® homes and the true, standard
efficiency, Baseline homes built to MEC 1993 requirements.
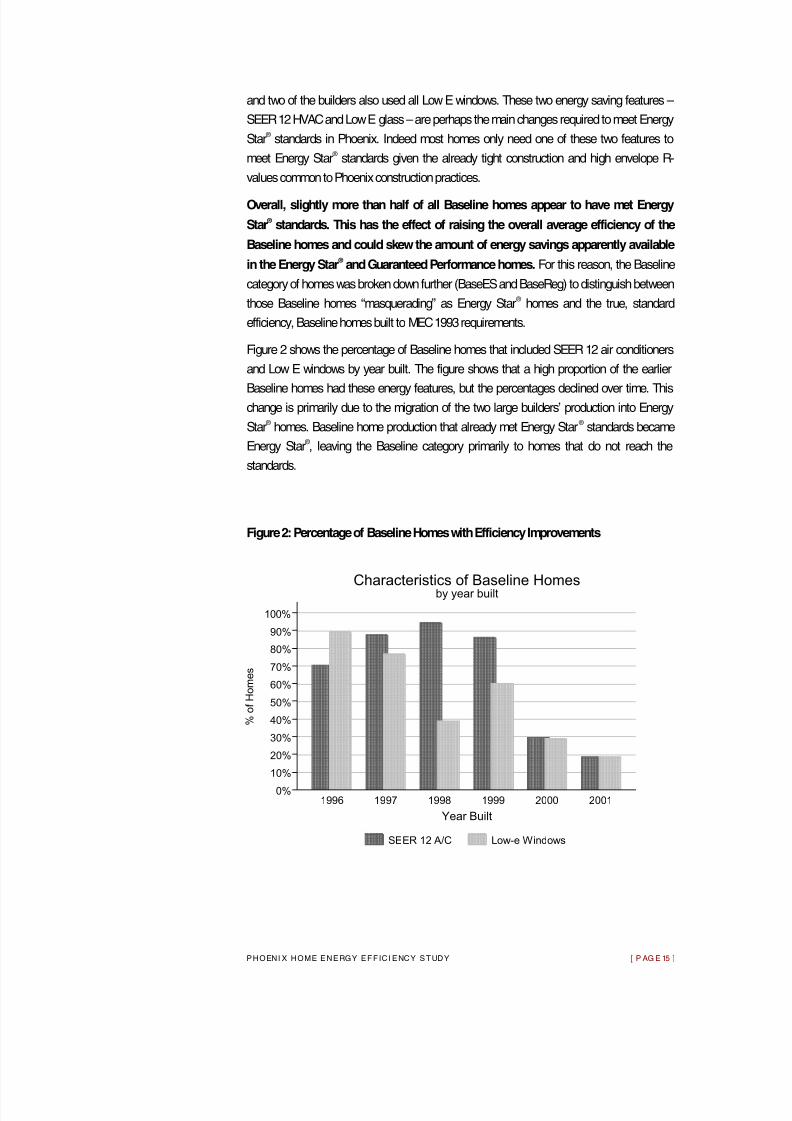
Figure 2 shows the percentage of Baseline homes that included SEER 12 air conditioners
and Low E windows by year built. The figure shows that a high proportion of the earlier
Baseline homes had these energy features, but the percentages declined over time. This change is primarily due to the migration of the two large builders’ production into Energy
Star ® homes. Baseline home production that already met Energy Star ® standards became
Energy Star ® , leaving the Baseline category primarily to homes that do not reach the
standards.
Figure 2: Percentage of Baseline Homes with Efficiency Improvements
0%
10%
20%
30%
40%
50%
60%
70%
80%
90%
100%
% o
f H o m e s
1996 1997 1998 1999 2000 2001
Year Built
by year builtCharacteristics of Baseline Homes
SEER 12 A/C Low-e Windows
8/3/2019 Measuring Public Benefit from Energy Efficient Homes
http://slidepdf.com/reader/full/measuring-public-benefit-from-energy-efficient-homes 17/40
P H O E N I X H O M E E N E R G Y E F F I C I E N C Y S T U D Y [ P A G E 16 ]
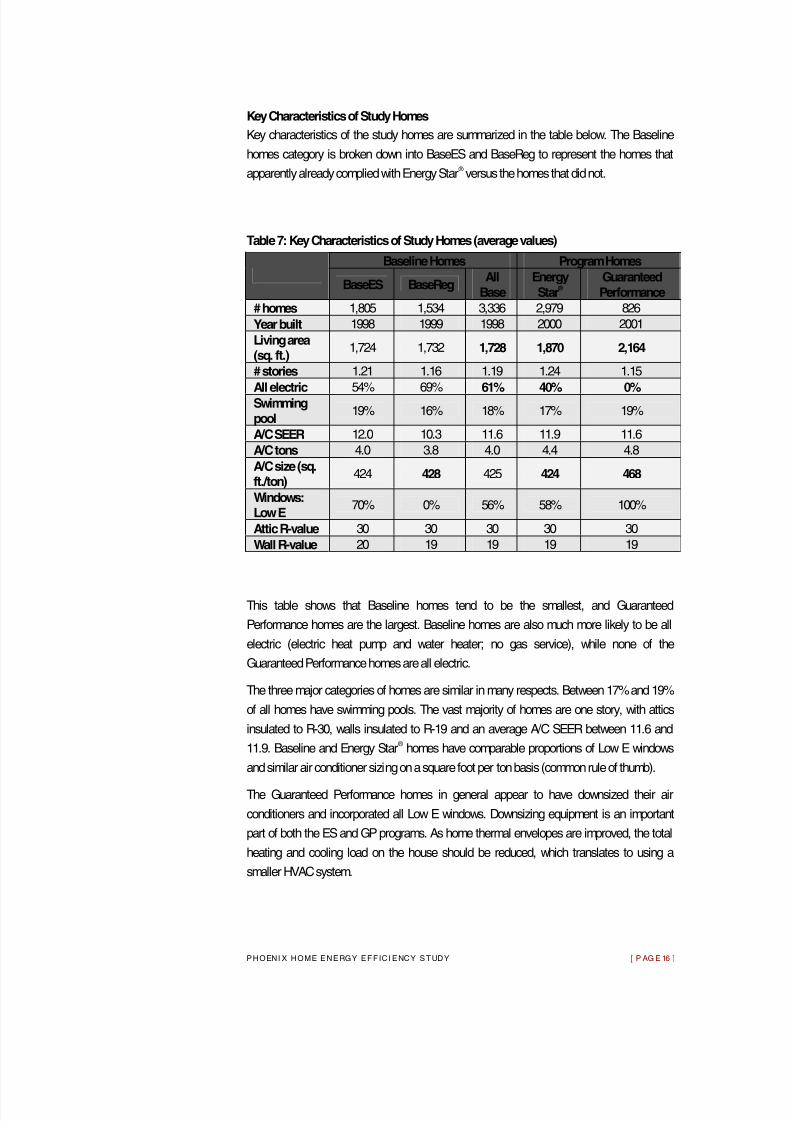
Key Characteristics of Study Homes
Key characteristics of the study homes are summarized in the table below. The Baseline
homes category is broken down into BaseES and BaseReg to represent the homes that
apparently already complied with Energy Star ® versus the homes that did not.
Table 7: Key Characteristics of Study Homes (average values)
Baseline Homes Program Homes
BaseES BaseReg All
Base Energy Star
®
Guaranteed Performance
# homes 1,805 1,534 3,336 2,979 826
Year built 1998 1999 1998 2000 2001
Living area (sq. ft.)
1,724 1,732 1,728 1,870 2,164
# stories 1.21 1.16 1.19 1.24 1.15
All electric 54% 69% 61% 40% 0% Swimming pool
19% 16% 18% 17% 19%
A/C SEER 12.0 10.3 11.6 11.9 11.6
A/C tons 4.0 3.8 4.0 4.4 4.8
A/C size (sq.ft./ton)
424 428 425 424 468
Windows:Low E
70% 0% 56% 58% 100%
Attic R-value 30 30 30 30 30
Wall R-value 20 19 19 19 19
This table shows that Baseline homes tend to be the smallest, and Guaranteed
Performance homes are the largest. Baseline homes are also much more likely to be all
electric (electric heat pump and water heater; no gas service), while none of the
Guaranteed Performance homes are all electric.
The three major categories of homes are similar in many respects. Between 17% and 19%
of all homes have swimming pools. The vast majority of homes are one story, with attics
insulated to R-30, walls insulated to R-19 and an average A/C SEER between 11.6 and
11.9. Baseline and Energy Star ® homes have comparable proportions of Low E windows
and similar air conditioner sizing on a square foot per ton basis (common rule of thumb).
The Guaranteed Performance homes in general appear to have downsized their air
conditioners and incorporated all Low E windows. Downsizing equipment is an important
part of both the ES and GP programs. As home thermal envelopes are improved, the total
heating and cooling load on the house should be reduced, which translates to using a
smaller HVAC system.
8/3/2019 Measuring Public Benefit from Energy Efficient Homes
http://slidepdf.com/reader/full/measuring-public-benefit-from-energy-efficient-homes 18/40
P H O E N I X H O M E E N E R G Y E F F I C I E N C Y S T U D Y [ P A G E 17 ]
Energy Use Data
Advanced Energy collaborated with Arizona Public Service and Southwest Gas to gather
monthly electric and gas usage data for each study home. Matching electric usage data
were found for 7,141 homes, while records for gas use were found for 2,030 homes. A large
number of gas-heated homes could not be matched and so could not be used for the
energy analysis portion of the study.
Gas Usage Analysis Methodology
The gas utility provided data spanning approximately two years, from 2003 through 2004.
The data was analyzed using a variable-base heating degree day regression analysis,
which is similar to the widely-used PRISM software. Energy usage data was first screened
to exclude periods when the property was vacant. These screens eliminated about 7% of all
meter readings. Analysis results were classified as unreliable if the usage data spanned
less than half a typical winter’s degree days, if the regression r-squared was less than 0.7
or if the estimated standard error of the annualized usage was greater than 20%. These screening criteria eliminated 13% of the cases analyzed, leaving gas usage analysis results
for 1,760 homes.
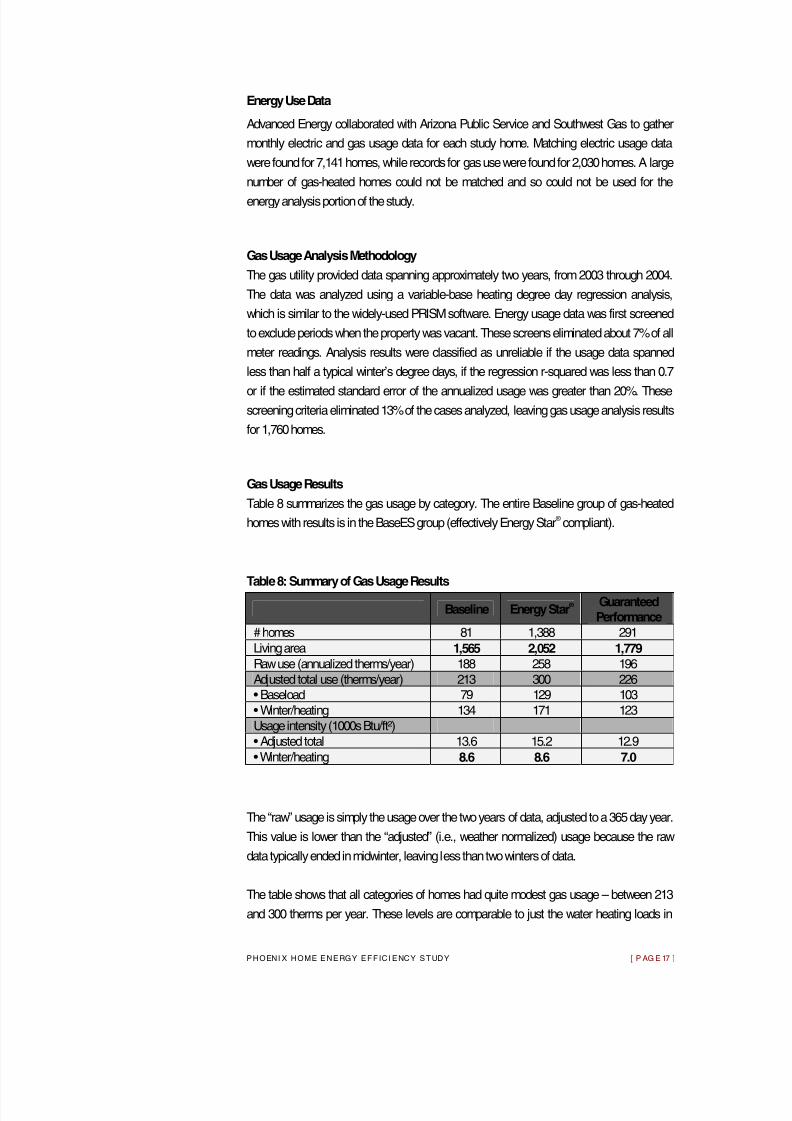
Gas Usage Results
Table 8 summarizes the gas usage by category. The entire Baseline group of gas-heated
homes with results is in the BaseES group (effectively Energy Star ® compliant).
Table 8: Summary of Gas Usage Results
Baseline Energy Star ® Guaranteed
Performance # homes 81 1,388 291Living area 1,565 2,052 1,779 Raw use (annualized therms/year) 188 258 196 Adjusted total use (therms/year) 213 300 226 • Baseload 79 129 103 • Winter/heating 134 171 123 Usage intensity (1000s Btu/ft²)• Adjusted total 13.6 15.2 12.9 • Winter/heating 8.6 8.6 7.0
The “raw” usage is simply the usage over the two years of data, adjusted to a 365 day year.
This value is lower than the “adjusted” (i.e., weather normalized) usage because the raw
data typically ended in midwinter, leaving less than two winters of data.
The table shows that all categories of homes had quite modest gas usage – between 213
and 300 therms per year. These levels are comparable to just the water heating loads in

8/3/2019 Measuring Public Benefit from Energy Efficient Homes
http://slidepdf.com/reader/full/measuring-public-benefit-from-energy-efficient-homes 19/40
P H O E N I X H O M E E N E R G Y E F F I C I E N C Y S T U D Y [ P A G E 18 ]
most heating climates. The Energy Star ® homes are 31% larger than the Baseline homes
on average, and they have the highest gas usage. Much of the difference in gas usage is in
the estimated baseload portion of use – representing estimated water heating and cooking
usage. This difference could be due to potentially greater occupancy in the larger homes.
In terms of usage per square foot, the Energy Star ® and Baseline homes have the
same winter/heating intensity of 8,600 Btu/ft²/year while the GP homes have a 19%
lower intensity at 7,000 Btu/ft²/year. Given the low absolute usage levels, even a 20%
difference in heating intensity only amounts to about 25 therms of gas per year.
It appears that heating in Phoenix is to some extent similar to cooling in Maine – mostly
optional for much of the season and potentially dominated by individual preferences and
behaviors more than building envelope and equipment differences. Midwinter usage
averages in the 30-50 therms/month range and summer usage drops to less than 10
therms – considerably lower than the typical water heating loads in cold climates but
consistent with the expected seasonality of water heating loads in such a hot climate.
Electric Usage Analysis Approach Methodology
For electric usage data, the primary method used for weather normalization was a cooling
degree day (CDD) and heating degree day (HDD) adjustment. This approach classified
each meter reading period as summer, winter or base load based on heating degree days
(base 65°F) and cooling degree days (base 75°F 3 ). The usage and degree days were
summed for winter, summer and base load months. The resulting three equations were
solved to estimate base load usage per day, summer/cooling usage per CDD75 and
winter/heating usage per HDD65, assuming a linear relation between usage, CDD and
HDD. This analysis approach allows for heating and cooling occurring within all seasons
and appears to provide more reliable results in many cases than using a regression model.
This analysis was run separately for each home during each calendar year.
Electric usage data were first screened using an approach similar to the gas data, excluding
periods of likely vacancy and other anomalous/questionable data. In addition, periods with
unusually low usage were also excluded, which were defined as use of less than 150
kWh/month, or less than 400 kWh and either less than 25% of the median month’s use or
less than 40% of the 25 th percentile of use for that home. These data screens excluded
about 11% of the total 400,027 meter readings from 1998 through 2004, but only about 6%
of the 85,963 meter readings in 2004. The usage analysis results were considered reliable
if they were based on at least nine meter readings that spanned at least 50% of a typical
year’s HDD65 and CDD75, included at least one period of true base load usage (very few
CDD or HDD) and resulted in an estimated base load usage of at least 2,000 kWh/yr (to
eliminate likely unoccupied homes not caught by the meter reading screens). This
_____________________________ 3
The CDD balance point temperature of 75° was derived from a variable base CDD regression analysis performed on homes that did not exhibit electric
heating loads – 75°F was the median estimated balance point temperature for homes with gas heat and hot water.

8/3/2019 Measuring Public Benefit from Energy Efficient Homes
http://slidepdf.com/reader/full/measuring-public-benefit-from-energy-efficient-homes 20/40
P H O E N I X H O M E E N E R G Y E F F I C I E N C Y S T U D Y [ P A G E 19 ]
screening eliminated 596 homes (8%), primarily due to the requirement for nine meter
readings, leaving 6,545 houses with apparently reliable records of electric use for the study.
A considerable drawback of any energy use analysis based on CDD is that cooling loads
are not directly proportional to CDD. Only about half or less of the typical Phoenix area
home’s cooling load is related to temperature difference and transfer through conduction and infiltration. The other half of the load is from solar gain and internal gains. The problem
with CDD adjustments was confirmed by examining trends in the weather adjusted
estimated cooling loads and finding that the hottest summer had the lowest estimated
cooling load because the CDD adjustment overcompensates for weather. Fortunately for
this project, the primary analysis year of interest (2004) had 99% of a typical
summer’s CDD75, so the weather adjustment is essentially no adjustment at all for
homes with complete data.
In addition to the inherent problem with CDD corrections, electric usage weather
normalization can be further confounded by seasonality in other end uses such as electric water heating, swimming pool pumps, ceiling fans and even lighting and refrigeration. To
the extent that these end uses vary over the year in proportion to outdoor temperatures, the
weather adjustment is sensible. But if they simply vary with the season, then the weather
adjustment may be inappropriate and may overcompensate. Having a typical weather year
as the analysis year (as 2004 was) reduces the potential for bias from these factors.
The seasonality of electric end uses caused us to refer to the CDD-adjusted estimated
cooling load as the summer/cooling load because it does not directly estimate air
conditioner usage. Instead, it utilizes the sum of all summer end-use variations. For most
homes in Phoenix, the air conditioner load wil l tend to dominate this summer load, but other seasonal end uses can have a noticeable impact as well, especially swimming pools and
water heaters. Similarly, the heating load estimate is referred to as the winter/heating load.
In our comparison of usage between different types of houses, total usage was examined
as well as the estimated components of baseload, summer/cooling load and winter/heating
load.
Electric Use Survey Results
Of more than 7,000 original study homes, satisfactory electric use records were only
available for 6,545 homes. Similarly, 86 attached townhouses and three houses without
information on living area were eliminated, leaving 6,480 houses with electric data suitable for the analysis. The Electric Use Summary table displays electric use by home category.
The table also provides a breakout by heating fuel type for the total heating and cooling
usage per square foot. All-electric homes use heat pumps and electric hot water, while gas-
heated homes also use gas hot water.
8/3/2019 Measuring Public Benefit from Energy Efficient Homes
http://slidepdf.com/reader/full/measuring-public-benefit-from-energy-efficient-homes 21/40
P H O E N I X H O M E E N E R G Y E F F I C I E N C Y S T U D Y [ P A G E 20 ]
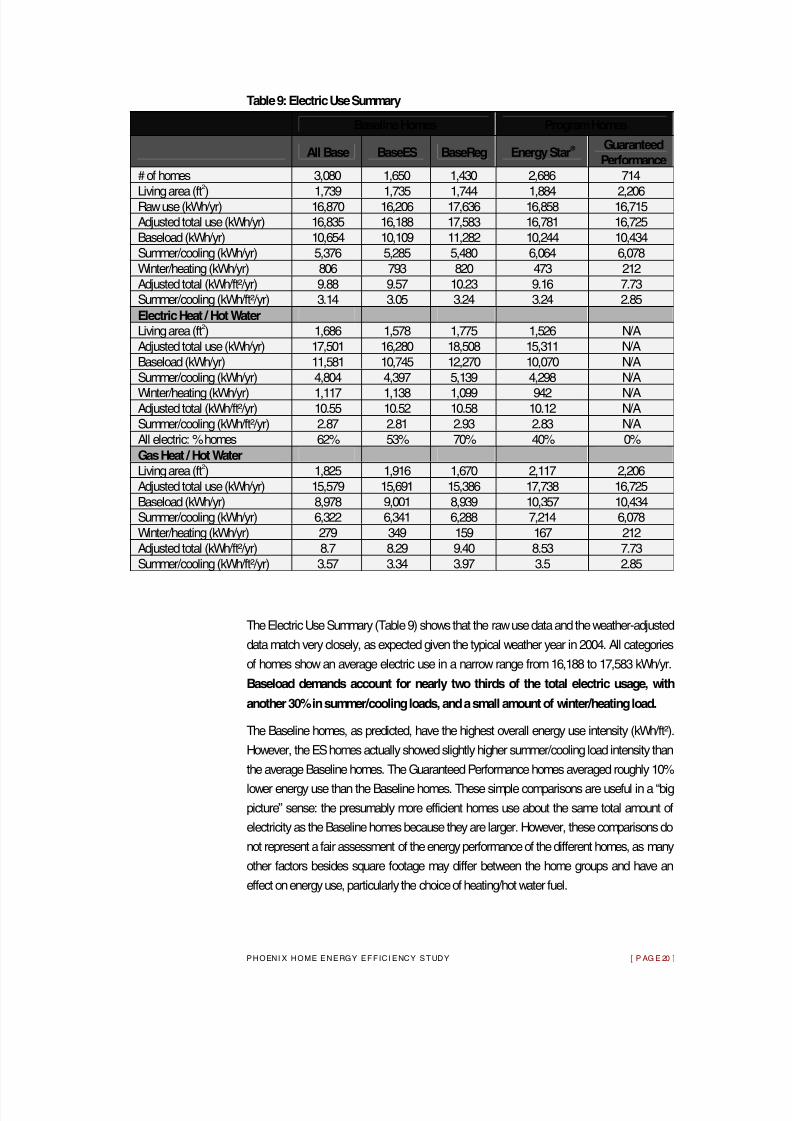
Table 9: Electric Use Summary
Baseline Homes Program Homes
All Base BaseES BaseReg Energy Star ® Guaranteed
Performance # of homes 3,080 1,650 1,430 2,686 714
Living area (ft
2
) 1,739 1,735 1,744 1,884 2,206 Raw use (kWh/yr) 16,870 16,206 17,636 16,858 16,715 Adjusted total use (kWh/yr) 16,835 16,188 17,583 16,781 16,725 Baseload (kWh/yr) 10,654 10,109 11,282 10,244 10,434 Summer/cooling (kWh/yr) 5,376 5,285 5,480 6,064 6,078 Winter/heating (kWh/yr) 806 793 820 473 212 Adjusted total (kWh/ft²/yr) 9.88 9.57 10.23 9.16 7.73 Summer/cooling (kWh/ft²/yr) 3.14 3.05 3.24 3.24 2.85
Electric Heat / Hot Water Living area (ft 2 ) 1,686 1,578 1,775 1,526 N/A Adjusted total use (kWh/yr) 17,501 16,280 18,508 15,311 N/A Baseload (kWh/yr) 11,581 10,745 12,270 10,070 N/A Summer/cooling (kWh/yr) 4,804 4,397 5,139 4,298 N/A
Winter/heating (kWh/yr) 1,117 1,138 1,099 942 N/A Adjusted total (kWh/ft²/yr) 10.55 10.52 10.58 10.12 N/A Summer/cooling (kWh/ft²/yr) 2.87 2.81 2.93 2.83 N/A All electric: % homes 62% 53% 70% 40% 0% Gas Heat / Hot Water Living area (ft 2 ) 1,825 1,916 1,670 2,117 2,206 Adjusted total use (kWh/yr) 15,579 15,691 15,386 17,738 16,725 Baseload (kWh/yr) 8,978 9,001 8,939 10,357 10,434 Summer/cooling (kWh/yr) 6,322 6,341 6,288 7,214 6,078 Winter/heating (kWh/yr) 279 349 159 167 212 Adjusted total (kWh/ft²/yr) 8.7 8.29 9.40 8.53 7.73 Summer/cooling (kWh/ft²/yr) 3.57 3.34 3.97 3.5 2.85
The Electric Use Summary (Table 9) shows that the raw use data and the weather-adjusted
data match very closely, as expected given the typical weather year in 2004. All categories
of homes show an average electric use in a narrow range from 16,188 to 17,583 kWh/yr.
Baseload demands account for nearly two thirds of the total electric usage, with
another 30% in summer/cooling loads, and a small amount of winter/heating load.
The Baseline homes, as predicted, have the highest overall energy use intensity (kWh/ft²).
However, the ES homes actually showed slightly higher summer/cooling load intensity than
the average Baseline homes. The Guaranteed Performance homes averaged roughly 10%
lower energy use than the Baseline homes. These simple comparisons are useful in a “big
picture” sense: the presumably more efficient homes use about the same total amount of
electricity as the Baseline homes because they are larger. However, these comparisons do
not represent a fair assessment of the energy performance of the different homes, as many
other factors besides square footage may differ between the home groups and have an
effect on energy use, particularly the choice of heating/hot water fuel.
8/3/2019 Measuring Public Benefit from Energy Efficient Homes
http://slidepdf.com/reader/full/measuring-public-benefit-from-energy-efficient-homes 22/40
P H O E N I X H O M E E N E R G Y E F F I C I E N C Y S T U D Y [ P A G E 21 ]
Heating/Hot Water Fuel Impacts
The lower portion of the Electric Use Summary table provides a breakout of usage based
on heating/hot water fuel. The Baseline homes are much more likely to be all-electric than
the ES homes, while none of the GP homes are all-electric. The all-electric Baseline homes
have considerably greater baseload usage than the homes using gas, reflecting additional
loads for water heating, some cooking and clothes drying. The Baseline all-electric homes are also smaller than the Baseline gas homes by about 10%. All-electric ES homes are
much smaller than gas-heated ES homes making comparisons more difficult. Estimated
winter/heating loads are quite small for these all-electric heat pump homes, averaging
about 1,000 kWh/year.
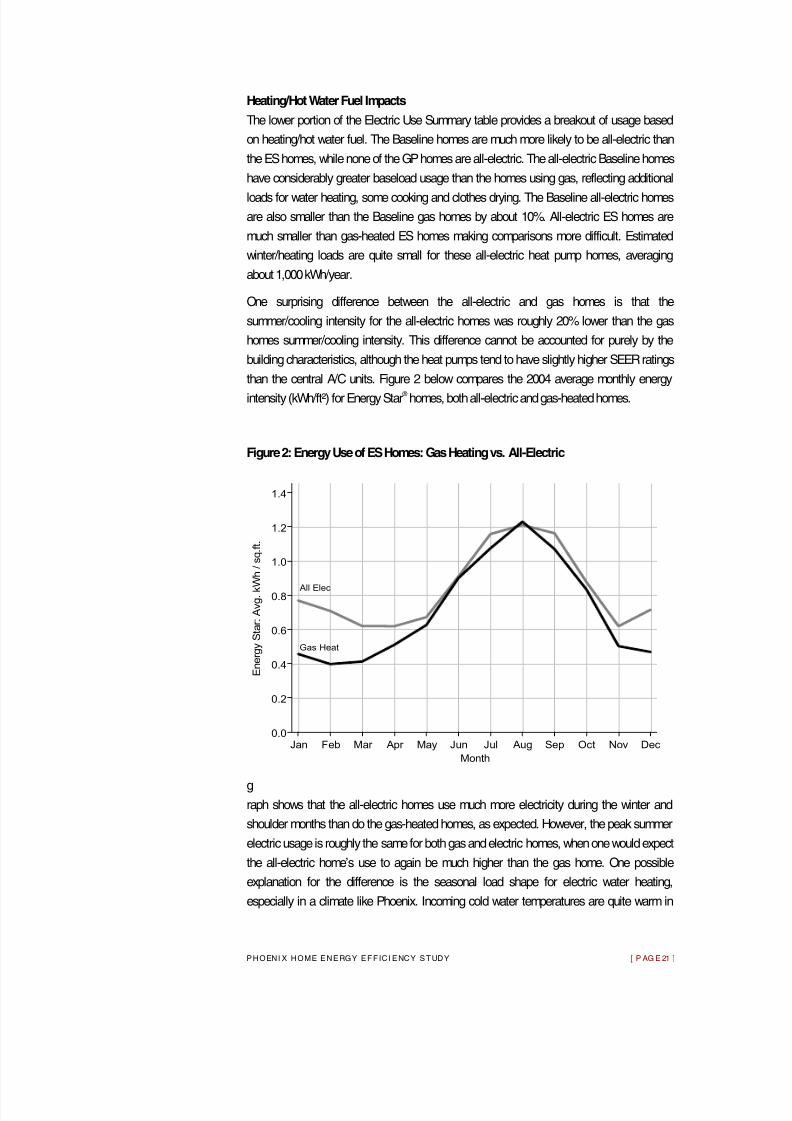
One surprising difference between the all-electric and gas homes is that the
summer/cooling intensity for the all-electric homes was roughly 20% lower than the gas
homes summer/cooling intensity. This difference cannot be accounted for purely by the
building characteristics, although the heat pumps tend to have slightly higher SEER ratings
than the central A/C units. Figure 2 below compares the 2004 average monthly energy
intensity (kWh/ft²) for Energy Star ® homes, both all-electric and gas-heated homes.
Figure 2: Energy Use of ES Homes: Gas Heating vs. All-Electric
T
h
e
g raph shows that the all-electric homes use much more electricity during the winter and
shoulder months than do the gas-heated homes, as expected. However, the peak summer
electric usage is roughly the same for both gas and electric homes, when one would expect
the all-electric home’s use to again be much higher than the gas home. One possible
explanation for the difference is the seasonal load shape for electric water heating,
especially in a climate like Phoenix. Incoming cold water temperatures are quite warm in
All Elec
Gas Heat
0.0
0.2
0.4
0.6
0.8
1.0
1.2
1.4
E n e r g y S t a r : A v g . k W h / s q . f t .
Jan Feb Mar Apr May Jun Jul Aug Sep Oct Nov Dec
Month
8/3/2019 Measuring Public Benefit from Energy Efficient Homes
http://slidepdf.com/reader/full/measuring-public-benefit-from-energy-efficient-homes 23/40
P H O E N I X H O M E E N E R G Y E F F I C I E N C Y S T U D Y [ P A G E 22 ]
the hot summers of Phoenix, creating a substantial reduction in electric usage of water
heaters. A model of water heating loads based on TMY2 (typical meteorological year)
weather data revealed that reductions in electric water heating loads could lower the
estimated seasonal summer/cooling loads by 800-900 kWh/year, or roughly 0.5 kWh/ft² in
Phoenix. This estimated water heating effect explains almost the entire difference in
estimated cooling loads between all-electric and gas-heated homes.
The substantial differences in load levels and seasonal load shapes require that any
comparisons between homes must be performed separately for all-electric and gas-
heated homes.
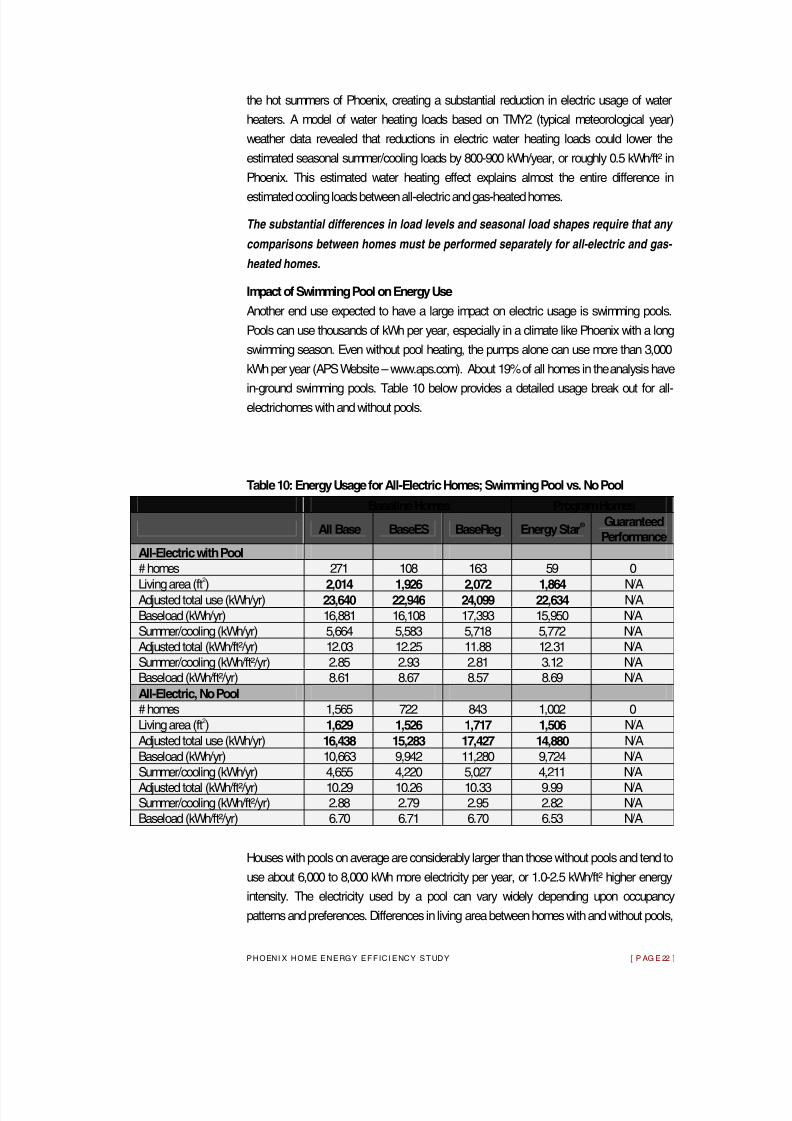
Impact of Swimming Pool on Energy Use
Another end use expected to have a large impact on electric usage is swimming pools.
Pools can use thousands of kWh per year, especially in a climate like Phoenix with a long
swimming season. Even without pool heating, the pumps alone can use more than 3,000
kWh per year (APS Website – www.aps.com). About 19% of all homes in the analysis have
in-ground swimming pools. Table 10 below provides a detailed usage break out for all- electrichomes with and without pools.
Table 10: Energy Usage for All-Electric Homes; Swimming Pool vs. No Pool
Baseline Homes Program Homes
All Base BaseES BaseReg Energy Star ® Guaranteed
Performance
All-Electric with Pool# homes 271 108 163 59 0
Living area (ft
2
) 2,014 1,926 2,072 1,864 N/A Adjusted total use (kWh/yr) 23,640 22,946 24,099 22,634 N/A Baseload (kWh/yr) 16,881 16,108 17,393 15,950 N/A Summer/cooling (kWh/yr) 5,664 5,583 5,718 5,772 N/A Adjusted total (kWh/ft²/yr) 12.03 12.25 11.88 12.31 N/A Summer/cooling (kWh/ft²/yr) 2.85 2.93 2.81 3.12 N/A Baseload (kWh/ft²/yr) 8.61 8.67 8.57 8.69 N/A
All-Electric, No Pool# homes 1,565 722 843 1,002 0 Living area (ft 2 ) 1,629 1,526 1,717 1,506 N/A Adjusted total use (kWh/yr) 16,438 15,283 17,427 14,880 N/A Baseload (kWh/yr) 10,663 9,942 11,280 9,724 N/A Summer/cooling (kWh/yr) 4,655 4,220 5,027 4,211 N/A
Adjusted total (kWh/ft²/yr) 10.29 10.26 10.33 9.99 N/A Summer/cooling (kWh/ft²/yr) 2.88 2.79 2.95 2.82 N/A Baseload (kWh/ft²/yr) 6.70 6.71 6.70 6.53 N/A
Houses with pools on average are considerably larger than those without pools and tend to
use about 6,000 to 8,000 kWh more electricity per year, or 1.0-2.5 kWh/ft² higher energy
intensity. The electricity used by a pool can vary widely depending upon occupancy
patterns and preferences. Differences in living area between homes with and without pools,
8/3/2019 Measuring Public Benefit from Energy Efficient Homes
http://slidepdf.com/reader/full/measuring-public-benefit-from-energy-efficient-homes 24/40
P H O E N I X H O M E E N E R G Y E F F I C I E N C Y S T U D Y [ P A G E 23 ]
as well as between the different efficiency categories, make direct comparisons difficult and
could lead to bias if, for example, people in GP homes tended to use their pools more or
less than people in Baseline homes. Because of this potential bias and given the relatively
small fraction of homes with pools, excluding homes with pools from the study will yield
more reliable performance comparisons between home categories.
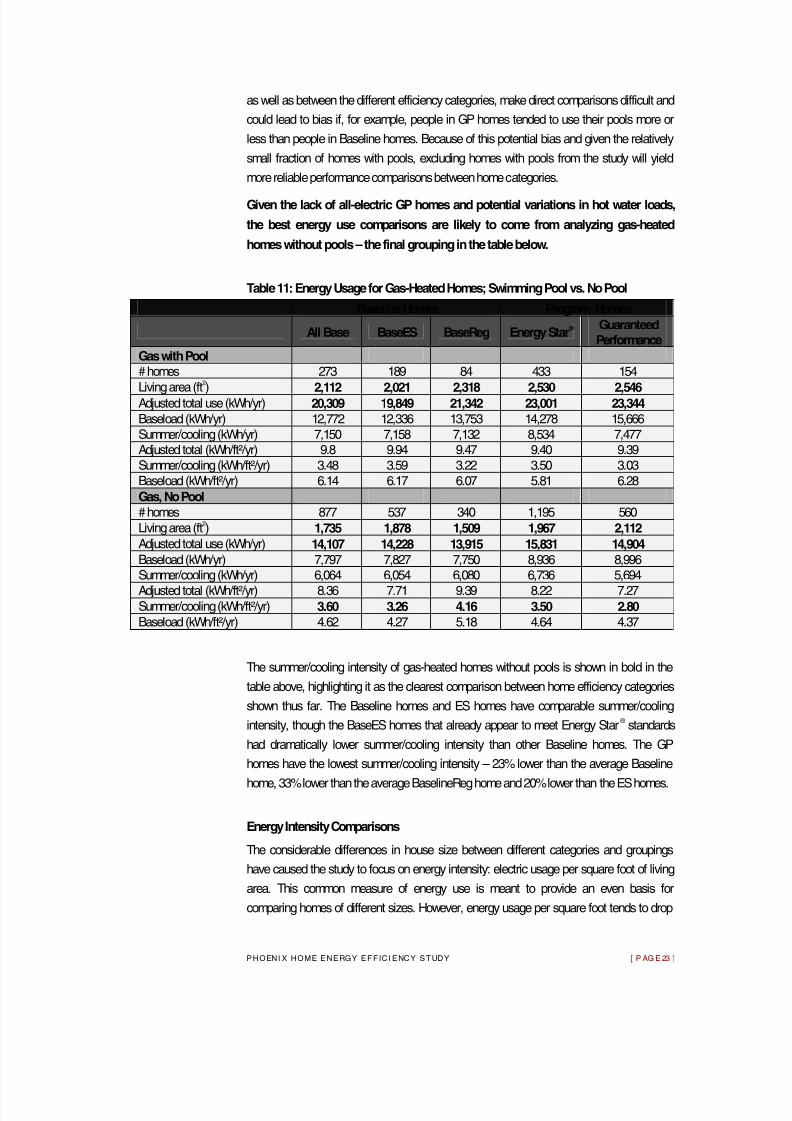
Given the lack of all-electric GP homes and potential variations in hot water loads,
the best energy use comparisons are likely to come from analyzing gas-heated
homes without pools – the final grouping in the table below.
Table 11: Energy Usage for Gas-Heated Homes; Swimming Pool vs. No Pool
Baseline Homes Program Homes
All Base BaseES BaseReg Energy Star ® Guaranteed
Performance
Gas with Pool# homes 273 189 84 433 154
Living area (ft
2
) 2,112 2,021 2,318 2,530 2,546 Adjusted total use (kWh/yr) 20,309 19,849 21,342 23,001 23,344 Baseload (kWh/yr) 12,772 12,336 13,753 14,278 15,666 Summer/cooling (kWh/yr) 7,150 7,158 7,132 8,534 7,477 Adjusted total (kWh/ft²/yr) 9.8 9.94 9.47 9.40 9.39 Summer/cooling (kWh/ft²/yr) 3.48 3.59 3.22 3.50 3.03 Baseload (kWh/ft²/yr) 6.14 6.17 6.07 5.81 6.28 Gas, No Pool# homes 877 537 340 1,195 560 Living area (ft 2 ) 1,735 1,878 1,509 1,967 2,112
Adjusted total use (kWh/yr) 14,107 14,228 13,915 15,831 14,904 Baseload (kWh/yr) 7,797 7,827 7,750 8,936 8,996 Summer/cooling (kWh/yr) 6,064 6,054 6,080 6,736 5,694
Adjusted total (kWh/ft²/yr) 8.36 7.71 9.39 8.22 7.27 Summer/cooling (kWh/ft²/yr) 3.60 3.26 4.16 3.50 2.80 Baseload (kWh/ft²/yr) 4.62 4.27 5.18 4.64 4.37
The summer/cooling intensity of gas-heated homes without pools is shown in bold in the
table above, highlighting it as the clearest comparison between home efficiency categories
shown thus far. The Baseline homes and ES homes have comparable summer/cooling
intensity, though the BaseES homes that already appear to meet Energy Star ® standards
had dramatically lower summer/cooling intensity than other Baseline homes. The GP
homes have the lowest summer/cooling intensity – 23% lower than the average Baseline
home, 33% lower than the average BaselineReg home and 20% lower than the ES homes.
Energy Intensity Comparisons
The considerable differences in house size between different categories and groupings
have caused the study to focus on energy intensity: electric usage per square foot of living
area. This common measure of energy use is meant to provide an even basis for
comparing homes of different sizes. However, energy usage per square foot tends to drop
8/3/2019 Measuring Public Benefit from Energy Efficient Homes
http://slidepdf.com/reader/full/measuring-public-benefit-from-energy-efficient-homes 25/40
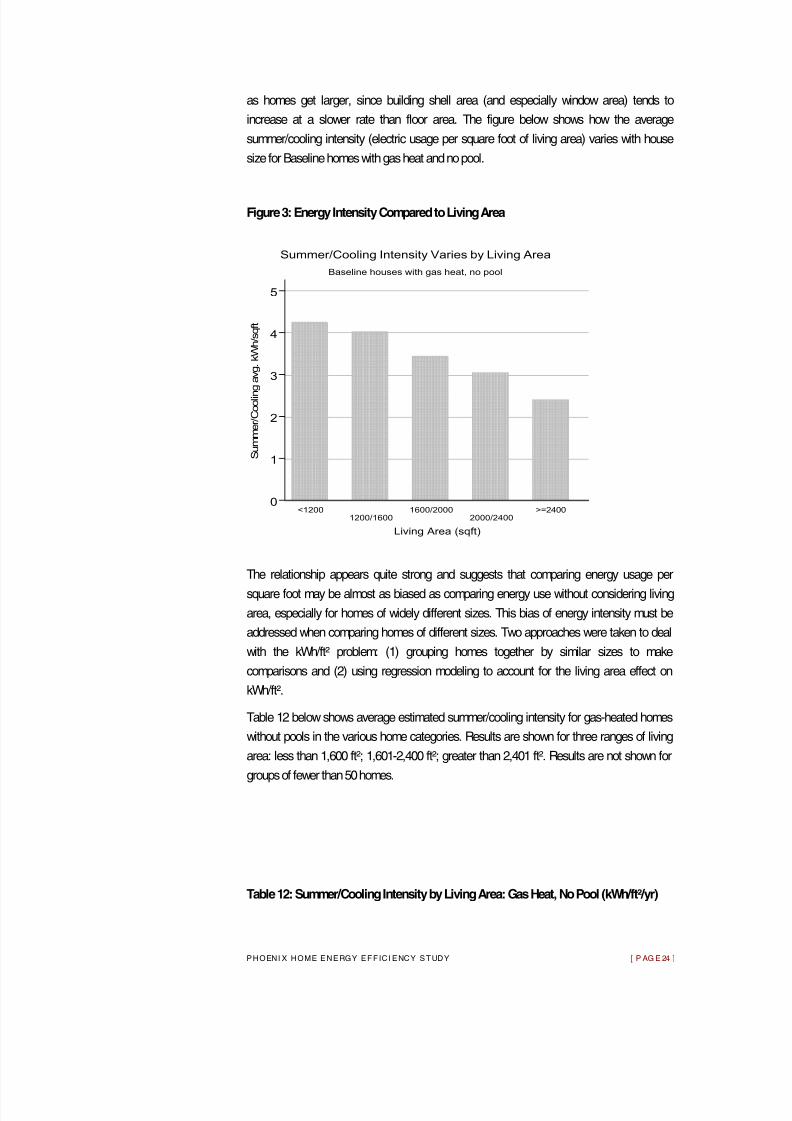
P H O E N I X H O M E E N E R G Y E F F I C I E N C Y S T U D Y [ P A G E 24 ]
as homes get larger, since building shell area (and especially window area) tends to
increase at a slower rate than floor area. The figure below shows how the average
summer/cooling intensity (electric usage per square foot of living area) varies with house
size for Baseline homes with gas heat and no pool.
Figure 3: Energy Intensity Compared to Living Area
The relationship appears quite strong and suggests that comparing energy usage per
square foot may be almost as biased as comparing energy use without considering living
area, especially for homes of widely different sizes. This bias of energy intensity must be
addressed when comparing homes of different sizes. Two approaches were taken to deal
with the kWh/ft² problem: (1) grouping homes together by similar sizes to make
comparisons and (2) using regression modeling to account for the living area effect on
kWh/ft².
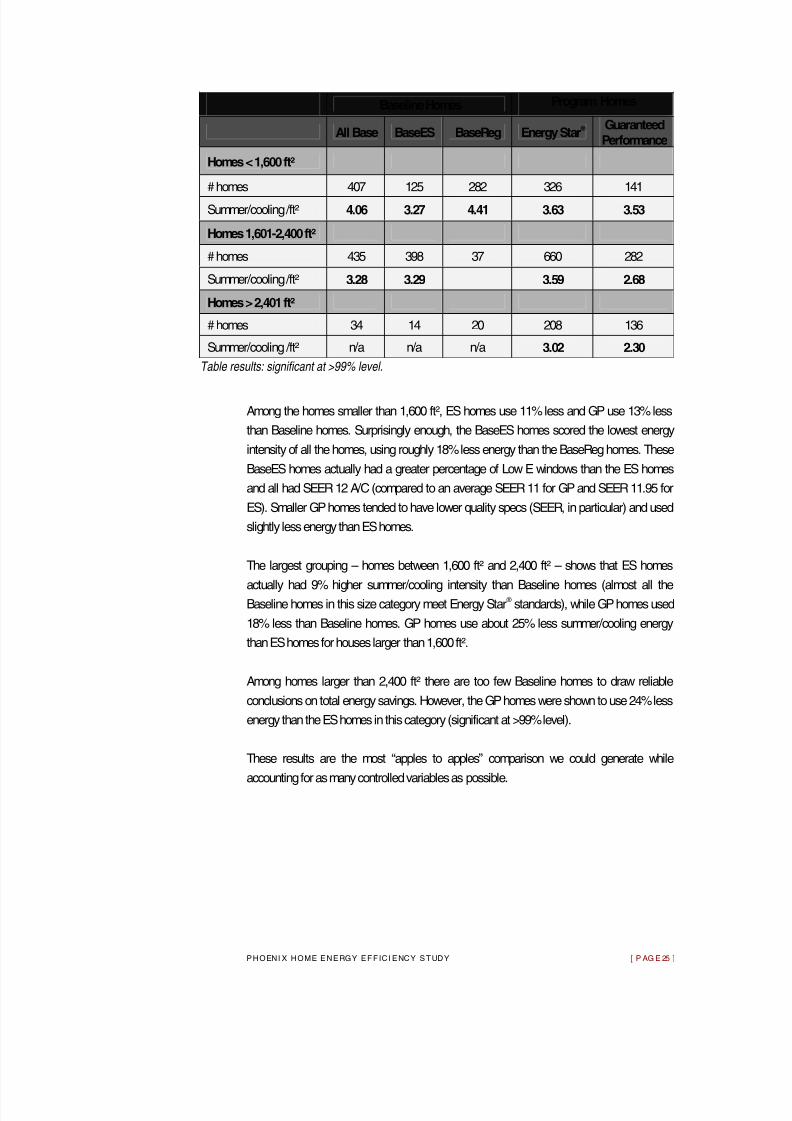
Table 12 below shows average estimated summer/cooling intensity for gas-heated homes
without pools in the various home categories. Results are shown for three ranges of living
area: less than 1,600 ft²; 1,601-2,400 ft²; greater than 2,401 ft². Results are not shown for
groups of fewer than 50 homes.
Table 12: Summer/Cooling Intensity by Living Area: Gas Heat, No Pool (kWh/ft²/yr)
0
1
2
3
4
5
S u m m e r / C o o l i n g a v g . k W h / s q f t
<12001200/1600
1600/20002000/2400
>=2400
Living Area (sqft)
Baseline houses with gas heat, no pool
Summer/Cooling Intensity Varies by Living Area
8/3/2019 Measuring Public Benefit from Energy Efficient Homes
http://slidepdf.com/reader/full/measuring-public-benefit-from-energy-efficient-homes 26/40
P H O E N I X H O M E E N E R G Y E F F I C I E N C Y S T U D Y [ P A G E 25 ]
Baseline Homes Program Homes
All Base BaseES BaseReg Energy Star ® Guaranteed
Performance
Homes < 1,600 ft²
# homes 407 125 282 326 141
Summer/cooling /ft² 4.06 3.27 4.41 3.63 3.53
Homes 1,601-2,400 ft²
# homes 435 398 37 660 282
Summer/cooling /ft² 3.28 3.29 3.59 2.68
Homes > 2,401 ft²
# homes 34 14 20 208 136
Summer/cooling /ft² n/a n/a n/a 3.02 2.30
Table results: significant at >99% level.
Among the homes smaller than 1,600 ft², ES homes use 11% less and GP use 13% less
than Baseline homes. Surprisingly enough, the BaseES homes scored the lowest energy
intensity of all the homes, using roughly 18% less energy than the BaseReg homes. These
BaseES homes actually had a greater percentage of Low E windows than the ES homes
and all had SEER 12 A/C (compared to an average SEER 11 for GP and SEER 11.95 for
ES). Smaller GP homes tended to have lower quality specs (SEER, in particular) and used
slightly less energy than ES homes.
The largest grouping – homes between 1,600 ft² and 2,400 ft² – shows that ES homes
actually had 9% higher summer/cooling intensity than Baseline homes (almost all the Baseline homes in this size category meet Energy Star ® standards), while GP homes used
18% less than Baseline homes. GP homes use about 25% less summer/cooling energy
than ES homes for houses larger than 1,600 ft².
Among homes larger than 2,400 ft² there are too few Baseline homes to draw reliable
conclusions on total energy savings. However, the GP homes were shown to use 24% less
energy than the ES homes in this category (significant at >99% level).
These results are the most “apples to apples” comparison we could generate while
accounting for as many controlled variables as possible.
8/3/2019 Measuring Public Benefit from Energy Efficient Homes
http://slidepdf.com/reader/full/measuring-public-benefit-from-energy-efficient-homes 27/40
P H O E N I X H O M E E N E R G Y E F F I C I E N C Y S T U D Y [ P A G E 26 ]
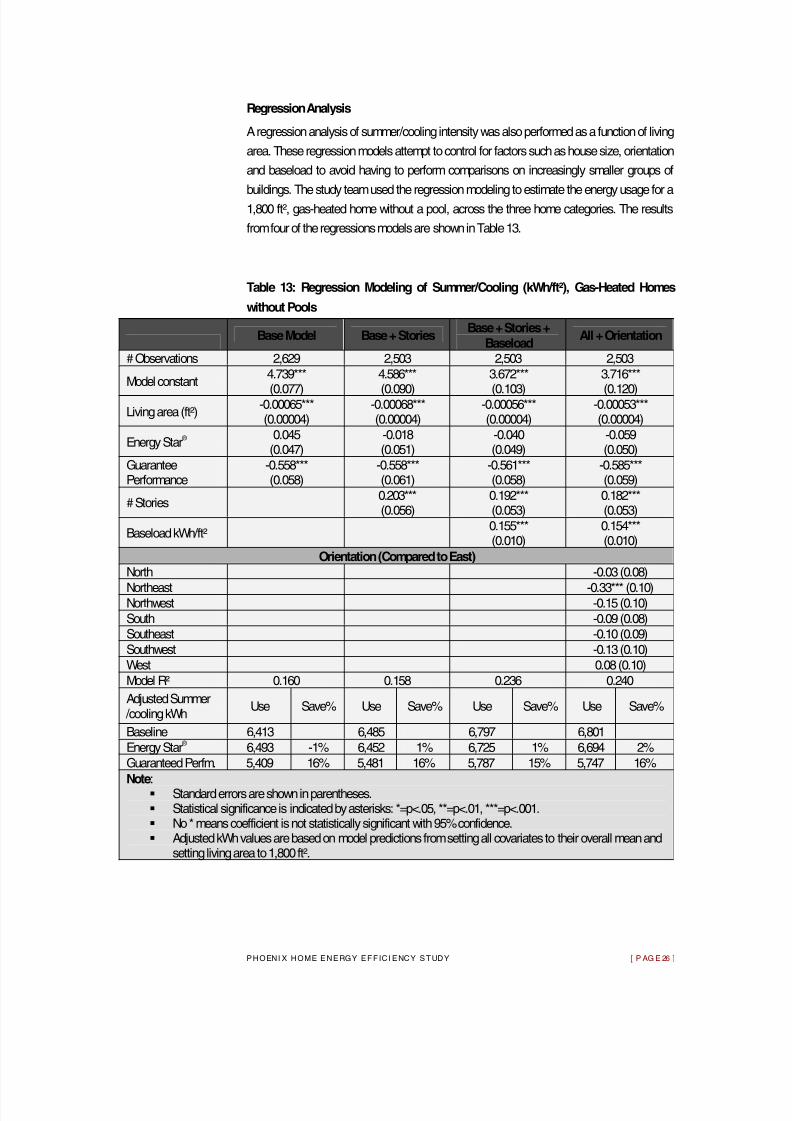
Regression Analysis
A regression analysis of summer/cooling intensity was also performed as a function of living
area. These regression models attempt to control for factors such as house size, orientation
and baseload to avoid having to perform comparisons on increasingly smaller groups of
buildings. The study team used the regression modeling to estimate the energy usage for a 1,800 ft², gas-heated home without a pool, across the three home categories. The results
from four of the regressions models are shown in Table 13.
Table 13: Regression Modeling of Summer/Cooling (kWh/ft²), Gas-Heated Homes
without Pools
Base Model Base + Stories Base + Stories +
Baseload All + Orientation
# Observations 2,629 2,503 2,503 2,503
Model constant 4.739***
(0.077)
4.586***
(0.090)
3.672***
(0.103)
3.716***
(0.120)Living area (ft²)
-0.00065*** (0.00004)
-0.00068*** (0.00004)
-0.00056*** (0.00004)
-0.00053*** (0.00004)
Energy Star ® 0.045 (0.047)
-0.018 (0.051)
-0.040 (0.049)
-0.059 (0.050)
Guarantee Performance
-0.558*** (0.058)
-0.558*** (0.061)
-0.561*** (0.058)
-0.585*** (0.059)
# Stories 0.203*** (0.056)
0.192*** (0.053)
0.182*** (0.053)
Baseload kWh/ft² 0.155*** (0.010)
0.154*** (0.010)
Orientation (Compared to East) North -0.03 (0.08)
Northeast -0.33*** (0.10)Northwest -0.15 (0.10)South -0.09 (0.08)Southeast -0.10 (0.09)Southwest -0.13 (0.10)West 0.08 (0.10)Model R² 0.160 0.158 0.236 0.240
Adjusted Summer /cooling kWh
Use Save% Use Save% Use Save% Use Save%
Baseline 6,413 6,485 6,797 6,801Energy Star ® 6,493 -1% 6,452 1% 6,725 1% 6,694 2% Guaranteed Perfm. 5,409 16% 5,481 16% 5,787 15% 5,747 16%
Note : Standard errors are shown in parentheses. Statistical significance is indicated by asterisks: *=p<.05, **=p<.01, ***=p<.001. No * means coefficient is not statistically significant with 95% confidence. Adjusted kWh values are based on model predictions from setting all covariates to their overall mean and
setting living area to 1,800 ft².
8/3/2019 Measuring Public Benefit from Energy Efficient Homes
http://slidepdf.com/reader/full/measuring-public-benefit-from-energy-efficient-homes 28/40
P H O E N I X H O M E E N E R G Y E F F I C I E N C Y S T U D Y [ P A G E 27 ]
The regression modeling yielded a number of conclusions:
Guaranteed Performance homes have significantly lower summer/cooling
intensity than Baseline homes. When adjusted to a standardized 1,800 ft²
home, the estimated savings equals about 1,000 kWh/year or about 16% of
the load.
Energy Star ® homes have about the same summer/cooling intensity as
Baseline homes – the small differences ranging from -1% to 2% is not
statistically significant.
Larger homes have lower cooling intensity (as we found previously).
Two-story homes have higher cooling intensity than one-story homes even
after accounting for living area.
Baseload electric usage constitutes about 0.15 kWh of additional
summer/cooling load for each 1 kWh of annual baseload electric usage.
This baseload electric impact is substantial – equal to about 1,300 kWh of summer/cooling for the average baseload usage of 8,571 kWh in the
analysis sample, equal to about 20% of the entire summer/cooling load.
Homes facing northeast have significantly lower summer/cooling intensity
than homes facing east (the default category), but no other orientations show
statistically significant differences.
Annual summer/cooling loads estimated to average 6,413 kWh for Baseline
homes, 6,493 kWh for Energy Star ® (1% savings) and 5,409 kWh for
Guaranteed Performance homes (16% savings).
Compared to Baseline homes that are not Energy Star
®
-compliant (BaseReg), Energy Star
® homes use 10% less and Guaranteed
Performance homes use 25% less for summer/cooling, saving about
1,800 kWh/year.
Swimming pools are estimated to increase annual total usage by about 4,500 kWh, with
750 kWh of this appearing as increased summer/cooling load. Pool heaters, pumps and
lighting constitute the majority of pool-related loads. But lifestyle factors associated with
having and using a pool (such as patio lighting, increased opening and closing of doors,
additional laundry loads) may also add to the increased energy use. Certainly, this
substantial energy user should be targeted for reducing new home electric use, possibly
through downsizing the pool pumps and using longer pump runtimes.
Homeowner Effects
While homeowner activity obviously has an effect on household energy use, it was
uncertain how much overall energy use varied from one family to the next. The study data
allowed the investigators to compare energy use for various families living in the same
8/3/2019 Measuring Public Benefit from Energy Efficient Homes
http://slidepdf.com/reader/full/measuring-public-benefit-from-energy-efficient-homes 29/40
P H O E N I X H O M E E N E R G Y E F F I C I E N C Y S T U D Y [ P A G E 28 ]
house over time (movers) versus homes with the same family over a similar period
(stayers).
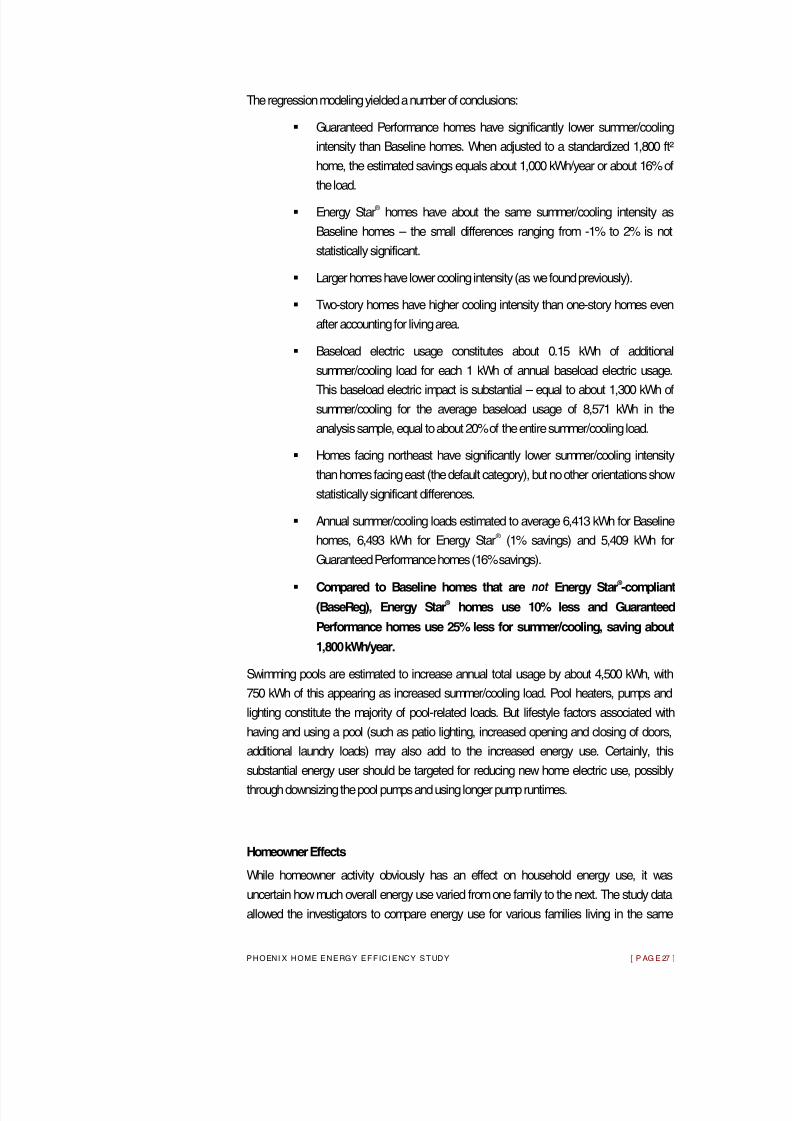
The study examined total and summer/cooling energy use in 2000 and again in 2004.
These two years were chosen both for the span of time – allowing for a change in
occupancy – and because the two years compare well in terms of weather, as shown in Table 14 below.
Table 14: 2000 and 2004 Temperature Statistics
Year HDD65 CDD65
2000 944 4629
2004 968 4755
In this data set, there were 1,289 movers where there was a change in occupancy and
1,384 stayers with no change in occupancy. Relative change in summer/cooling usage declined 5% in 2004 compared to 2000 for both the movers and stayers. In terms of
absolute change in consumption, the median change in usage between 2000 and 2004 was
14% for stayers and 21% for movers, implying that occupancy changes are typically
responsible for less than a 10% change in use.
It is important to note that more movers experienced large changes in usage
compared to stayers. One in four movers showed a usage change of 40% or more,
but only one in ten stayers showed that significant of a change.
Estimated total energy use and cooling usage was tabulated for a set of houses in both 2000 and 2004. The houses with no change in occupancy over the period were separated
from those houses that did have a change in occupancy.
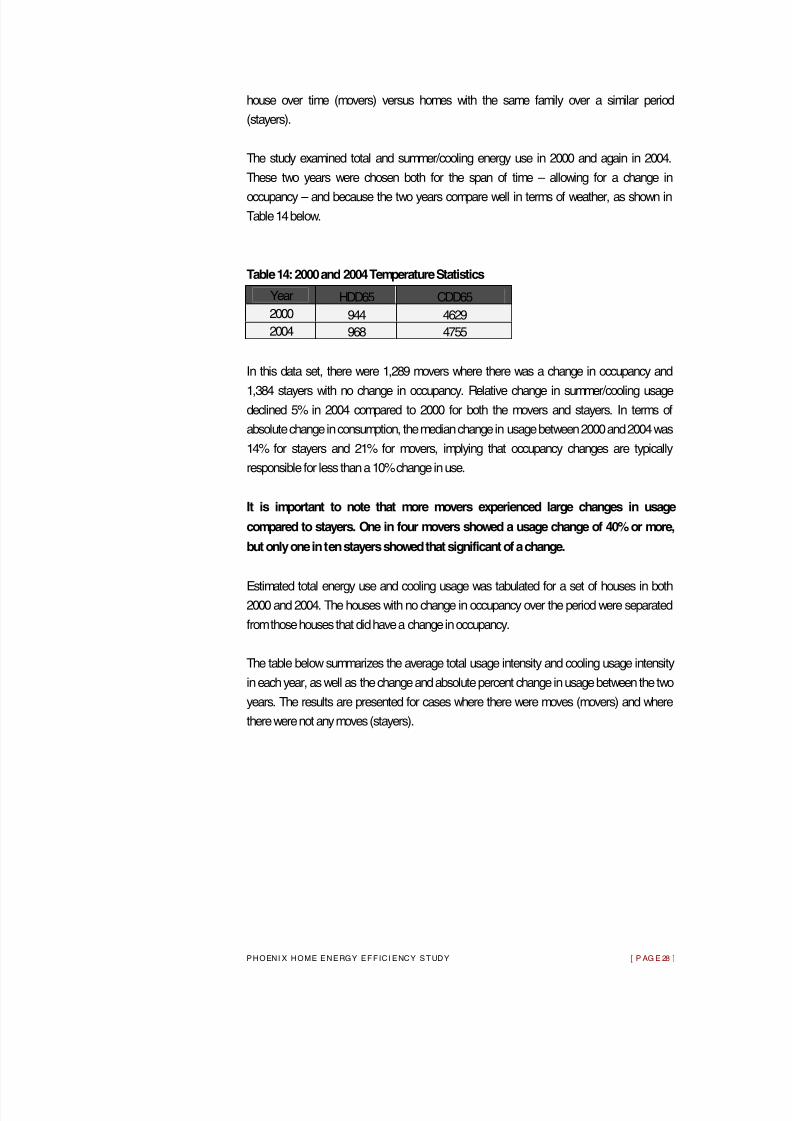
The table below summarizes the average total usage intensity and cooling usage intensity
in each year, as well as the change and absolute percent change in usage between the two
years. The results are presented for cases where there were moves (movers) and where
there were not any moves (stayers).
8/3/2019 Measuring Public Benefit from Energy Efficient Homes
http://slidepdf.com/reader/full/measuring-public-benefit-from-energy-efficient-homes 30/40
P H O E N I X H O M E E N E R G Y E F F I C I E N C Y S T U D Y [ P A G E 29 ]
Table 15: Movers vs. Stayers: Total Energy and Cooling Use
Movers – 48.2%
Variable N Mean sd ci95 Min. p10 p25 Median P75 p90 Max.
Total usage kwh/ft2
Year 2000 1,289 9.45 3.55 0.19 2.72 6.03 7.3 8.9 10.87 13.14 52.5
Year 2004 1,289 9.74 3.15 0.17 2.35 6.24 7.56 9.29 11.52 13.87 28.62
Change 1,289 0.29 4 0.22 -38.87 -3.49 -1.5 0.36 2.36 4.53 22.47
Absolute % change
1,289 0.29 0.3 0.02 0 0.03 0.1 0.21 0.4 0.64 3.92
Cooling intensity kwh/ft2
Year 2000 1,289 3.33 1.12 0.06 0.34 2.07 2.61 3.24 3.91 4.61 11.51
Year 2004 1,289 3.17 1.08 0.06 0.19 1.89 2.48 3.14 3.79 4.42 11.17
Change 1,289 -0.016 1.3 0.07 -6.49 -1.66 -0.84 -0.09 0.61 1.31 7.15
Absolute % change
1,289 0.33 0.5 0.03 0 0.04 0.11 0.23 0.41 0.63 7.31
Stayers – 51.8%
Variable N Mean sd ci95 Min. p10 p25 Median p75 p90 Max.
Total Usage kwh/ft2
Year 2000 1,384 8.76 2.64 0.14 2.27 5.68 6.91 8.48 10.18 12.22 23.83
Year 2004 1,384 9.65 3.18 0.17 2.93 6.02 7.35 9.36 11.5 13.73 28.87
Change 1,384 0.89 1.97 0.1 -11.79 -1.2 -0.26 0.7 1.89 3.4 12.69
Absolute % change
1,384 0.19 0.19 0.01 0 0.02 0.06 0.14 0.26 0.41 2.7
Cooling Intensity kwh/ft2 Year 2000 1,384 3.25 0.96 0.05 0.21 2.14 2.62 3.17 3.84 4.47 10.2
Year 2004 1,384 3.09 0.92 0.05 0.26 2.03 2.48 3.01 3.66 4.25 7.6
Change 1,384 -0.16 0.83 0.04 -5.09 -1.14 -0.62 -0.14 0.3 0.8 4.26
Absolute % change
1,384 0.21 0.35 0.02 0 0.03 0.07 0.15 0.27 0.42 8.51
This table (15) shows the number of cases (N), the average (Mean), the standard deviation
(sd), the 95% confidence interval of the mean (ci95), the minimum, the 10 th , 25 th , 50 th ,
(median), 75 th and 90 th percentiles, and the maximum value.
The table shows that, for these homes, average total usage increased from 2000 to 2004by
about 3% for movers and by about 10% for stayers. In terms of cooling intensity, usage
decreased by about 5% for both movers and stayers. It appears that baseload usage (e.g.,
plug loads) was responsible for overall usage increases.
The typical percentage change in total energy use was 21% for movers and 14% for stayers
(these numbers are from the median column of absolute percentage change). The typical
8/3/2019 Measuring Public Benefit from Energy Efficient Homes
http://slidepdf.com/reader/full/measuring-public-benefit-from-energy-efficient-homes 31/40
P H O E N I X H O M E E N E R G Y E F F I C I E N C Y S T U D Y [ P A G E 30 ]
changes in cooling load were 23% for movers and 15% for stayers. These results both
indicate that differences between households typically do not have a large effect on cooling
loads or total loads, with a typical incremental change in energy use of less than 10%. The
75 th and 90 th percentiles of the absolute percentage change reveal that larger swings in
usage are more common among the movers group: 40% versus 26% for the 75 th percentile
and 64% versus 41% in the 90 th
percentile. But for most households, the changes are not very large.
In conclusion, a modest increase in energy use variability was found between
different occupants, as compared to the same occupants over time. But typically, the
effect of this change in energy use is on the order of 10%.
Builder Effects
The study found that, even among homes with gas heat and no pool and within the same
size category, there were noticeable differences among builders. For example, one Guaranteed Performance builder’s homes averaged 3.9 kWh/ft² among small homes and
3.7 kWh/ft² among midsize homes, while the other GP builder averaged 3.4 kWh/ft² and 2.5
kWh/ft² respectively. Builder variations were evident among all house types and categories.
One way to control for this effect is to compare houses within a single builder’s product.
One builder produced homes in all three categories (Baseline, ES and GP). The
summer/cooling intensity for their homes averaged 4.0 kWh/ft² for Baseline, 3.0 kWh/ft² for
ES and 2.6 kWh/ft² for GP. This decrease in average energy use tracks with the builders’
decision to upgrade from Baseline to ES and GP programs.
For informational purposes, a plot of the average cooling intensity by builder, community
and efficiency category is provided in the Appendix. The number of homes in each group is
shown in parentheses. The figures do not control for heating fuel, swimming pools or
building size.
Market Transformations
A number of different factors have helped to transform the Phoenix area housing market in
terms of energy performance. When the Energy Star ® program entered the Phoenix market
area and gathered a number of avid supporters, it raised the energy performance bar for all
housing in the market, since few people wanted to purchase an energy inefficient home,
given the alternatives. Consumers are requesting energy efficient features because programs such as Energy Star ® and Environments For Living ® have educated them.
Another major market transformation occurred when the HVAC contracting company that
installs more than 70% of all HVAC systems in Phoenix, required duct sealing training for all
of its installers. In doing so, they initiated a significant change in the entire market which
resulted in a steady decline in duct leakage performance numbers. Similarly, training in

8/3/2019 Measuring Public Benefit from Energy Efficient Homes
http://slidepdf.com/reader/full/measuring-public-benefit-from-energy-efficient-homes 32/40
P H O E N I X H O M E E N E R G Y E F F I C I E N C Y S T U D Y [ P A G E 31 ]
other energy performance enhancements offered through these programs brought testers,
builders and contractors up to speed quickly.
As Low E glass and higher efficiency HVAC units were incorporated into early Energy Star ®
homes, the price for these products dropped noticeably, due mostly to its increased market
penetration and competition for supply. Lowered prices equates to more frequent requests by homeowners for efficient glass.
Energy Star ® and Guaranteed Performance programs brought the concept of “right-sizing”
into the market, leading HVAC system designers to use more sophisticated software (such
as Manual J) to size HVAC units for homes. This has resulted in smaller units being
installed, saving the homeowner money over purchasing a larger unit, while preventing
short cycling and allowing the HVAC units to reach their maximum SEER efficiency.
Typical HVAC sizing in Phoenix previously was 400 sq. ft. of livable floor space per ton; this
figurehas increased, as more attention is being given to improved thermal performance.
8/3/2019 Measuring Public Benefit from Energy Efficient Homes
http://slidepdf.com/reader/full/measuring-public-benefit-from-energy-efficient-homes 33/40
P H O E N I X H O M E E N E R G Y E F F I C I E N C Y S T U D Y [ P A G E 32 ]
Results Direct comparisons of energy use between the three home categories – Baseline, Energy
Star ® and Guaranteed Performance – are difficult at best, given the vast number of
variables that can affect both home performance and total energy use. Swimming pools, in
particular, add significantly to the overall energy use of a home. But it is difficult (at least within this study) to isolate those pool-related costs, since most pool systems are not
metered separately from the home energy supply. Even seasonal differences in the costs of
operating electric water heaters versus gas heaters could alter energy use profiles by as
much as 900 kWh/year, invalidating certain study results. To reduce the chance for such
variables to skew the results of this study, it is essential to compare “apples to apples” and
directly compare homes only within certain definite data sets. Since no all-electric
Guaranteed Performance homes were available for this study, the cleanest
comparison is to look at gas-heated homes with no pool, within different size ranges.
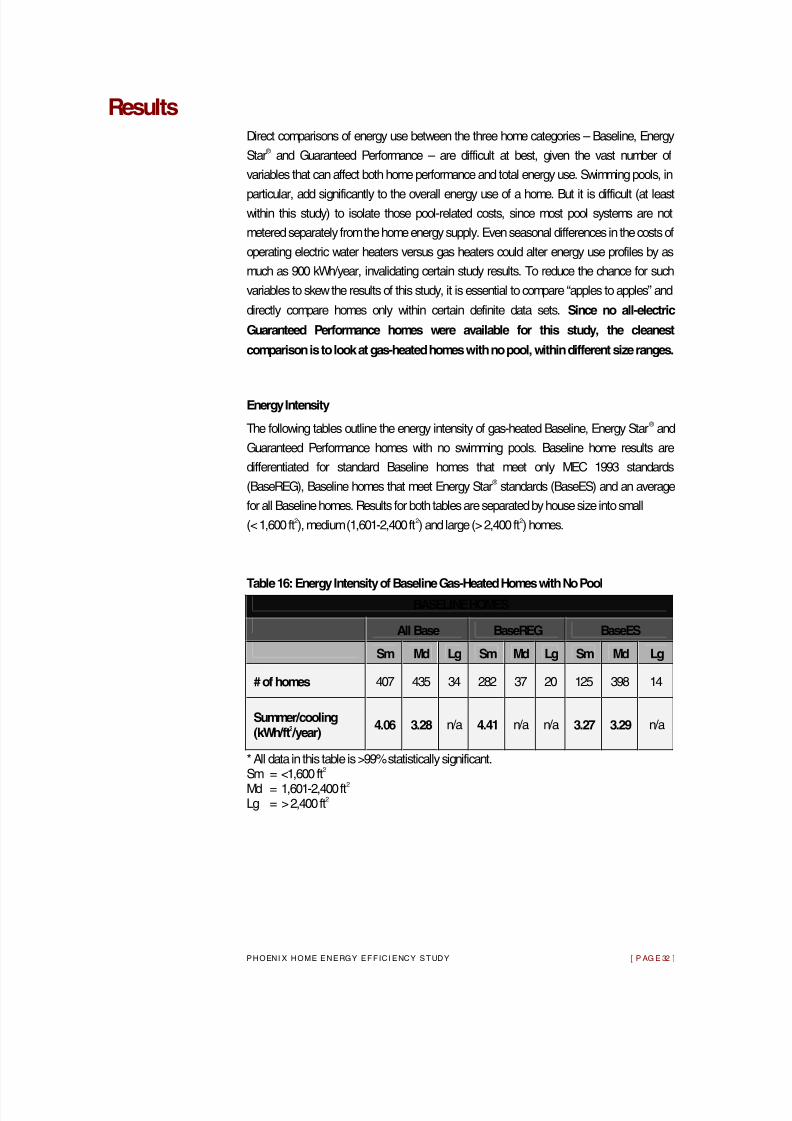
Energy Intensity
The following tables outline the energy intensity of gas-heated Baseline, Energy Star ® and
Guaranteed Performance homes with no swimming pools. Baseline home results are
differentiated for standard Baseline homes that meet only MEC 1993 standards
(BaseREG), Baseline homes that meet Energy Star ® standards (BaseES) and an average
for all Baseline homes. Results for both tables are separated by house size into small
(< 1,600 ft 2 ), medium (1,601-2,400 ft 2 ) and large (> 2,400 ft 2 ) homes.
Table 16: Energy Intensity of Baseline Gas-Heated Homes with No PoolBASELINE HOMES
All Base BaseREG BaseES
Sm Md Lg Sm Md Lg Sm Md Lg
# of homes 407 435 34 282 37 20 125 398 14
Summer/cooling (kWh/ft
2 /year)
4.06 3.28 n/a 4.41 n/a n/a 3.27 3.29 n/a
* All data in this table is >99% statistically significant.Sm = <1,600 ft 2
Md = 1,601-2,400 ft 2
Lg = > 2,400 ft 2
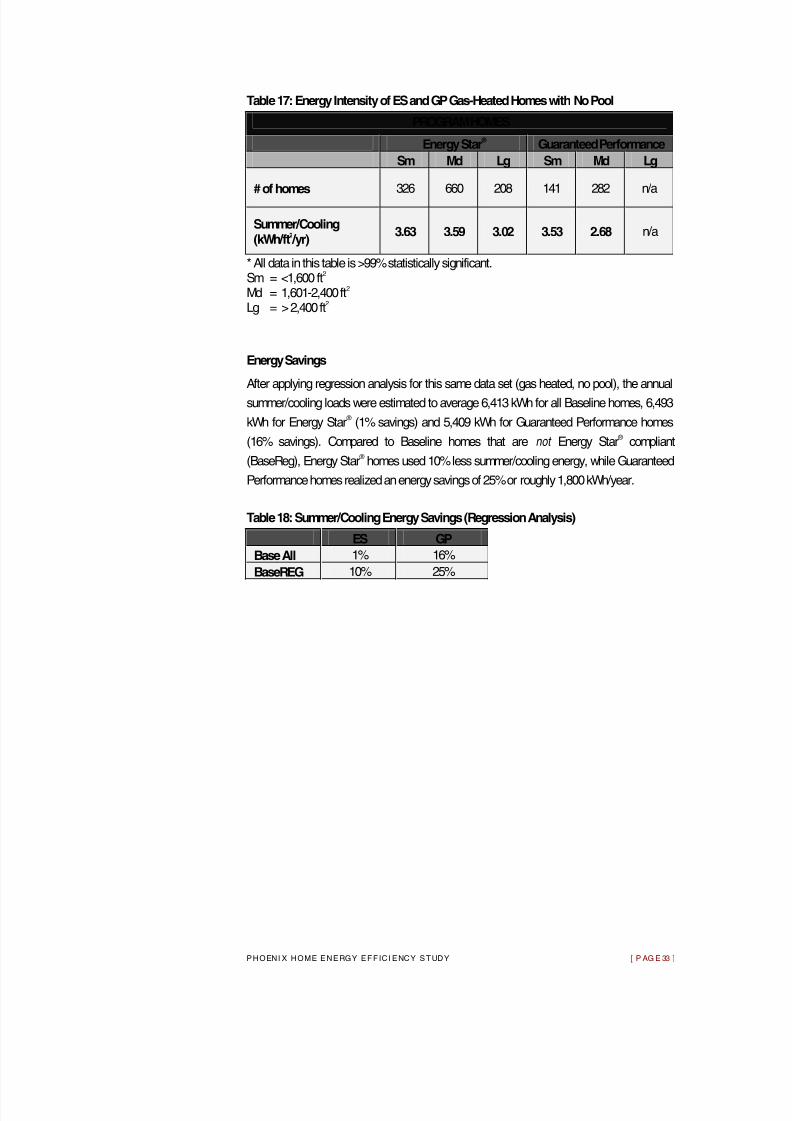
8/3/2019 Measuring Public Benefit from Energy Efficient Homes
http://slidepdf.com/reader/full/measuring-public-benefit-from-energy-efficient-homes 34/40
P H O E N I X H O M E E N E R G Y E F F I C I E N C Y S T U D Y [ P A G E 33 ]
Table 17: Energy Intensity of ES and GP Gas-Heated Homes with No Pool
PROGRAM HOMES
Energy Star ®
Guaranteed Performance
Sm Md Lg Sm Md Lg
# of homes 326 660 208 141 282 n/a
Summer/Cooling (kWh/ft
2 /yr)
3.63 3.59 3.02 3.53 2.68 n/a
* All data in this table is >99% statistically significant.Sm = <1,600 ft 2
Md = 1,601-2,400 ft 2
Lg = > 2,400 ft 2
Energy Savings
After applying regression analysis for this same data set (gas heated, no pool), the annual
summer/cooling loads were estimated to average 6,413 kWh for all Baseline homes, 6,493
kWh for Energy Star ® (1% savings) and 5,409 kWh for Guaranteed Performance homes
(16% savings). Compared to Baseline homes that are not Energy Star ® compliant
(BaseReg), Energy Star ® homes used 10% less summer/cooling energy, while Guaranteed
Performance homes realized an energy savings of 25% or roughly 1,800 kWh/year.
Table 18: Summer/Cooling Energy Savings (Regression Analysis)
ES GP
Base All 1% 16%
BaseREG 10% 25%
8/3/2019 Measuring Public Benefit from Energy Efficient Homes
http://slidepdf.com/reader/full/measuring-public-benefit-from-energy-efficient-homes 35/40
P H O E N I X H O M E E N E R G Y E F F I C I E N C Y S T U D Y [ P A G E 34 ]
Conclusions This Study Produced Statistically Valid Results
At the beginning of this project, there was much skepticism around the validity of conducting
a study to compare homes across the three categories we selected (Baseline,Energy Star ®
and Guaranteed Performance). The concern was that the amount of variability due to
factors that have nothing to do with the programs we were studying or that could not be
controlled would mask any noticeable differences. However, after having completed this
study, and confirming that there is tremendous variability, we still seestatistically significant
differences among the three categories.
While we have accumulated a body of evidence which indicates that the programs are a
driver of these savings, the data should not be viewed as proof. We recognize that there are
many issues such as and we can’t prove the exact amount of savings, but we now have a
jumping point for further investigation and benchmarking. The bottom line is this kind of
study can produce valid results, and those results will be strengthened with
additional data.
We also learned a lot along the way and are prepared to make the necessary improvements
that will generate even stronger results.
The Programs Appear To Be Working
Statistically valid energy savings were found for both the Energy Star ® and Guaranteed
Performance homes, when compared to Baseline homes (BaseREG). One surprise was
how well the BaseES houses performed, but it is our belief that this is partly due to the
impact made on the marketplace by the Energy Star ® and Guaranteed Performance
programs. Obviously, savings are directly related to how far a builder/contractor pushes
specifications (toward energy efficiency) and improves installation. A major catalyst for this
push (market transformation) is programs such as Energy Star ® and Guaranteed
Performance and all the activities that go into supporting them.
Baseloads Are Large and Need To Be Addressed
Continued efforts to reduce the overall energy usage in Phoenix, residential buildings
should not be focused solely on space cooling/heating and water heating. While the savings
are positive, the larger context of these savings is not as impressive. Space cooling/heating
and water heating are the largest individual energy users in a home, although they represent roughly 40% of the home’s overall energy usage. This means that even a 10%
reduction in cooling/heating and water heating costs – a significant reduction – only equates
to a 4% savings on the home’s total energy bill. Obviously, all areas of energy use within
residential buildings must be investigated to discover the maximum energy savings
potential.

8/3/2019 Measuring Public Benefit from Energy Efficient Homes
http://slidepdf.com/reader/full/measuring-public-benefit-from-energy-efficient-homes 36/40
P H O E N I X H O M E E N E R G Y E F F I C I E N C Y S T U D Y [ P A G E 35 ]
Need for Further Investigation
While the results of this study offer many clues into improving home energy performance,
only continued monitoring of homes in the Phoenix area will promote improvements and
demonstrate success of the Energy Star ® and Guaranteed Performance programs.
Providing feedback to these programs on a real world energy use and savings will help to make these programs more effective and further entrench the principles they teach into the
residential building trade. The data collected will also help those in the residential building
industry focus their efforts on the energy efficiency features that have the most impact –
while cost effective – and in turn provide a more energy-efficient home to the consumer.
8/3/2019 Measuring Public Benefit from Energy Efficient Homes
http://slidepdf.com/reader/full/measuring-public-benefit-from-energy-efficient-homes 37/40
P H O E N I X H O M E E N E R G Y E F F I C I E N C Y S T U D Y [ P A G E 36 ]
Recommendations
For Further Study Further studies of baseload energy usage (including lights, appliances, TV/computers and
other household loads) and energy use in swimming pools may identify additionalopportunities for significant energy savings. The Energy Star ® appliances program is one
measure to manage baseload. However, it is clear that more energy reduction methods are
needed, since the average size of new homes is increasing along with the number of
appliances. Energy Star ® has also recently developed a residential lighting program which
should prove to be a very effective means for reducing baseload usage. However, pool
pump motors, pool/outdoor lighting and plug loads that reside in a “sleep” or “standby”
mode (like computers, microwaves, and stereos) – all of which may contribute significantly
to overall energy use – have largely been ignored as a subject of study.
The following recommendations will assist in answering these questions.
Expand the energy use data set by surveying more builders and more
communities/subdivisions. A random sample of homes from each
community/subdivision would be needed (versus surveying all homes), since
each subdivision tended to consist of similar homes and homebuyers.
Research typical base energy loads and plug loads. Baseloads and plug
loads average 70% of total home energy use. A 10% to 30% savings in
base/plug loads yields overall energy savings of 7% to 21%. By comparison,
a 10% savings in cooling costs reduces total energy use by only 3%.
Research pool energy use and savings. Energy use for swimming pools (pumps, lighting and fountains) can equal the entire cooling load of a home.
By implementing efficient pool pumps, run time controllers and pool lighting,
similar energy savings can be realized at considerably less effort and cost
than cooling system upgrades.
Continue monitoring homes in Phoenix area. Long-term monitoring
(yearly) of Baseline, ES and GP houses in the Phoenix market (and others)
will provide the necessary feedback for improvement and a clearer picture of
progress.
Repeat study in different market/climate. Repeating this home energy
study in various markets and/or climates would examine differences in both
geographical and market forces, and help identify opportunities to expand
energy-efficient construction. Different locations have different drivers.
Therefore, the focus will be different – first, we must identify the drivers by
setting up a data collection and analysis system much like this study.
Include comparison of actual energy consumption to energy modeling.

8/3/2019 Measuring Public Benefit from Energy Efficient Homes
http://slidepdf.com/reader/full/measuring-public-benefit-from-energy-efficient-homes 38/40
P H O E N I X H O M E E N E R G Y E F F I C I E N C Y S T U D Y [ P A G E 37 ]
Homeowner follow-up . Advanced Energy is following up this study by
sending each of the study homeowners a survey regarding home comfort as
it relates to the HVAC system (i.e. room temperature variance, HVAC noise
and overall satisfaction).
Resources
Website references
www.advancedenergy.org
www.aps.com
www.eflhome.com
www.maricopa.gov
www.swgas.com
Published references
2004 Buildings Energy Databook , U.S. Department of Energy.
Energy Consumption Comparison of Energy Star ®
Homes in Phoenix, Arizona , Bradley Jay
Bashford, Arizona State University, May 2000.
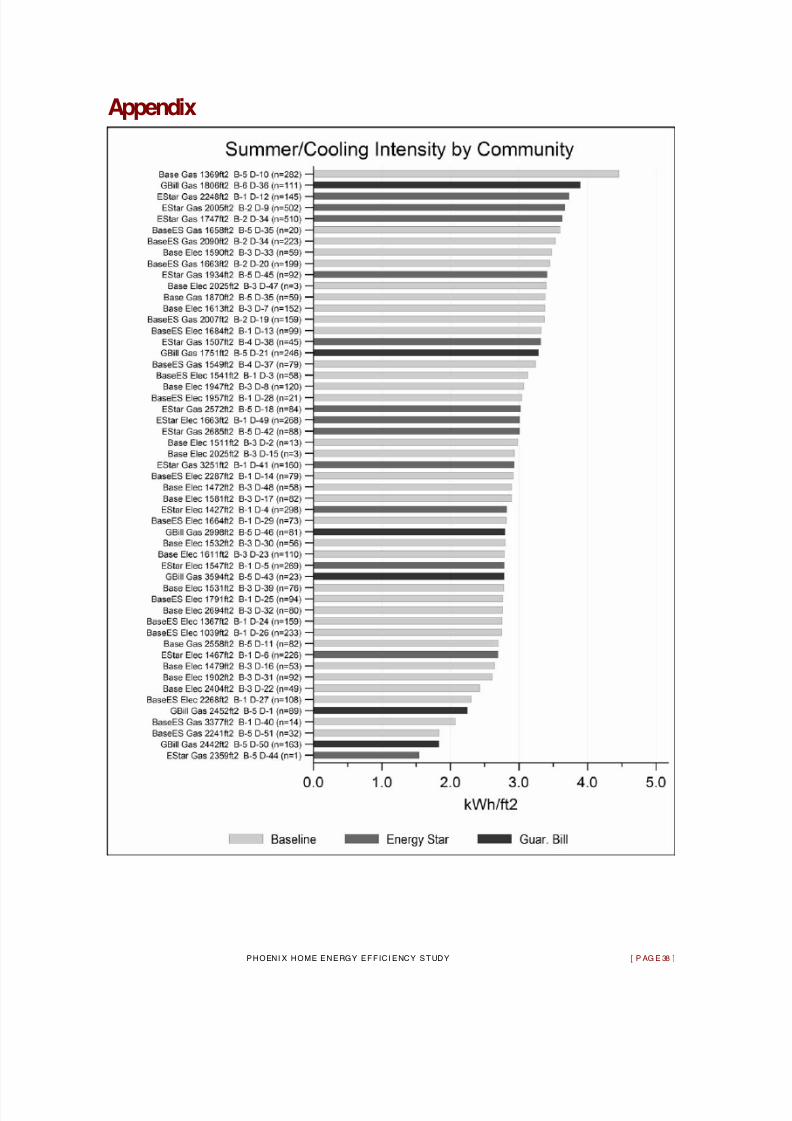
8/3/2019 Measuring Public Benefit from Energy Efficient Homes
http://slidepdf.com/reader/full/measuring-public-benefit-from-energy-efficient-homes 39/40
P H O E N I X H O M E E N E R G Y E F F I C I E N C Y S T U D Y [ P A G E 38 ]
Appendix

8/3/2019 Measuring Public Benefit from Energy Efficient Homes
http://slidepdf.com/reader/full/measuring-public-benefit-from-energy-efficient-homes 40/40