Embed Size (px)
Citation preview
© Mary R. Brooks and Tony Schellinck, 2012
Measuring Port Effectiveness in User
Service Delivery
Purpose
To understand how users evaluate the ports they use To identify which attributes of port services are most important
to users, and To identify the evaluation criteria by which users determine
that a port’s performance is satisfactory (or effective in meeting their needs).
This information can be used By relevant decision-makers—whether governments, port
authorities, or service providers—to facilitate assessment of port service delivery,
By users to provide feedback to ports, and By ports to fine tune operations to meet customers’
expectations and to compete by allocating resources to where they will have the greatest impact.
The Goal for Ports: Thinking About Supply Chain Improvements
① Identify your port’s customers’ and users’ criteria for assessing service quality
② Evaluate the port’s performance on both the criteria you control and what you influence
③ Determine what needs to be fixed based on those items of importance to the customer and determinant in their assessment of your port’s service quality performance
④ Via information-sharing, coalition-building, and identifying financial support and sources, you should be able to help your tenants and suppliers to change services under their control
3
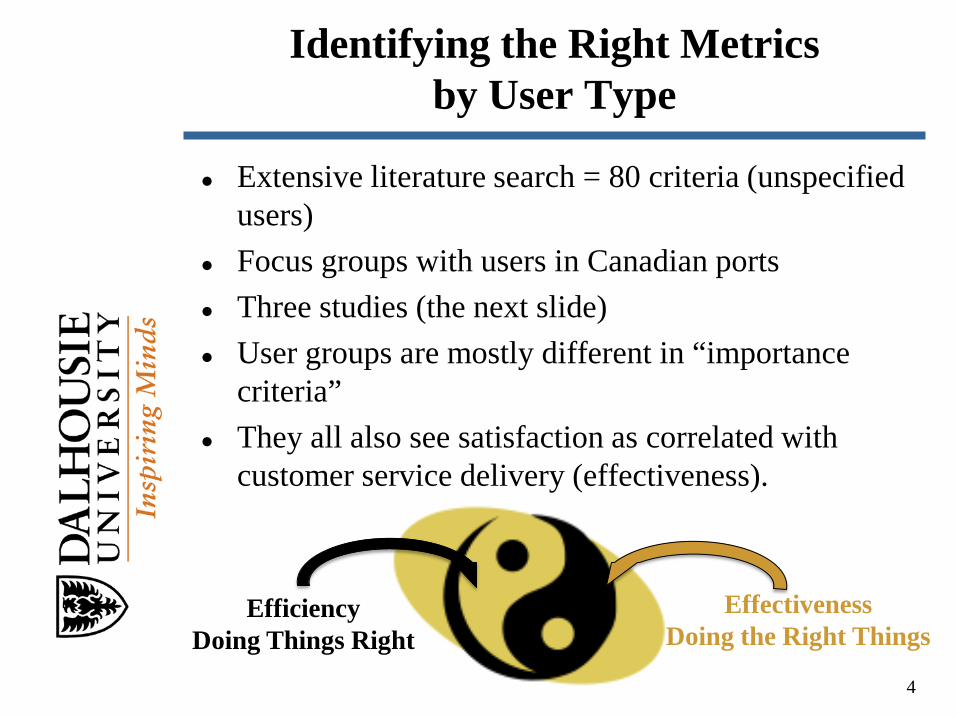
Identifying the Right Metrics by User Type
Extensive literature search = 80 criteria (unspecified users)
Focus groups with users in Canadian ports Three studies (the next slide) User groups are mostly different in “importance
criteria” They all also see satisfaction as correlated with
customer service delivery (effectiveness).
4
Efficiency Doing Things Right
Effectiveness Doing the Right Things
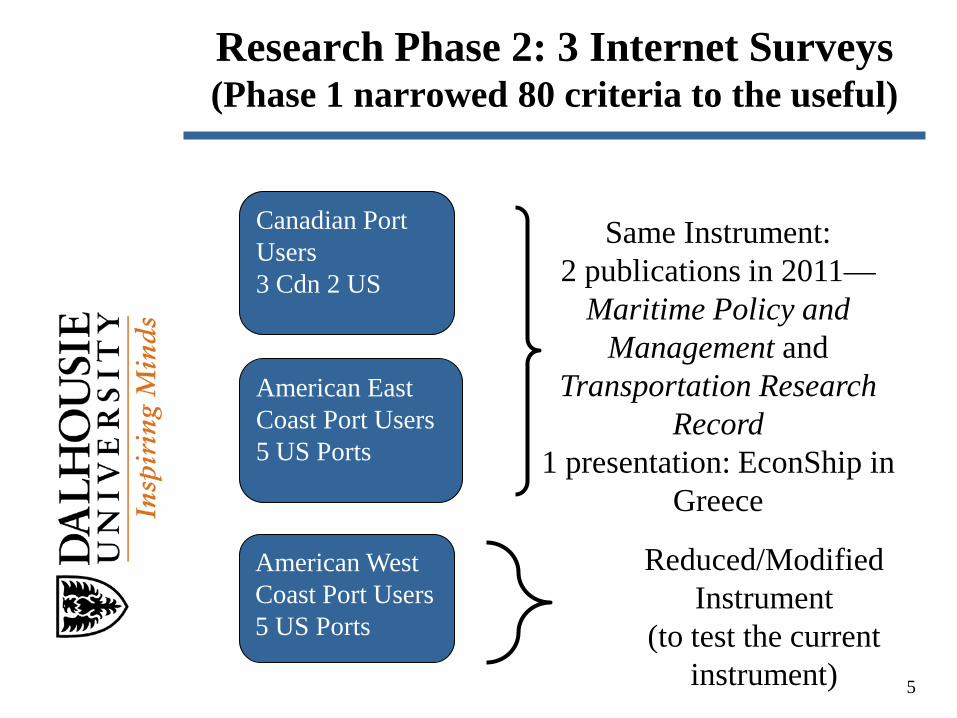
Research Phase 2: 3 Internet Surveys (Phase 1 narrowed 80 criteria to the useful)
5
Canadian Port Users 3 Cdn 2 US
American East Coast Port Users 5 US Ports
Same Instrument: 2 publications in 2011—
Maritime Policy and Management and
Transportation Research Record
1 presentation: EconShip in Greece
American West Coast Port Users 5 US Ports
Reduced/Modified Instrument
(to test the current instrument)
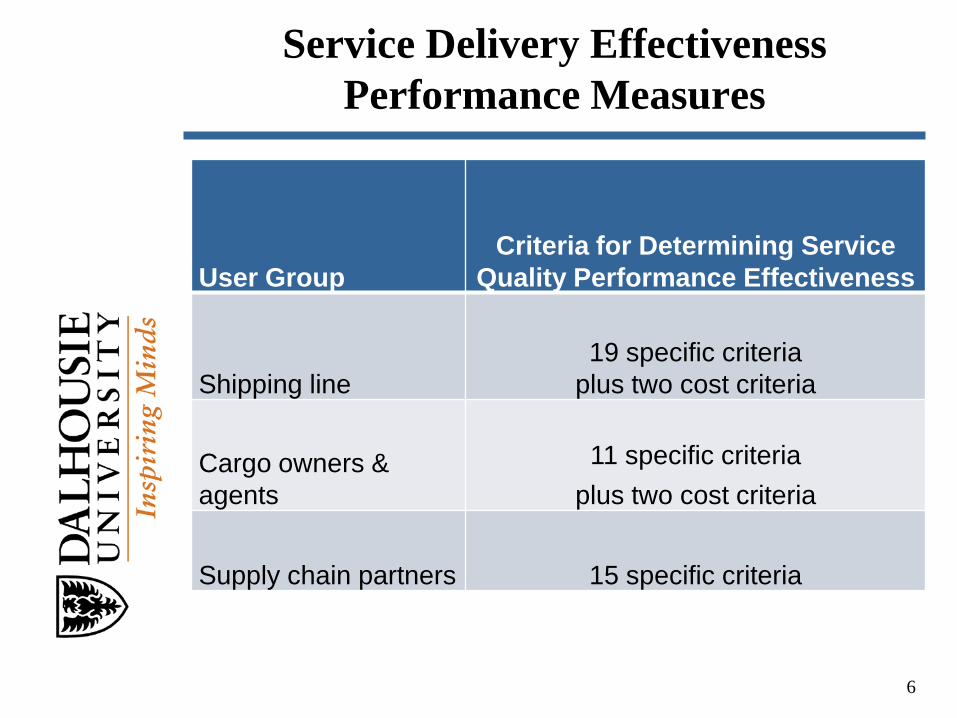
Service Delivery Effectiveness Performance Measures
User Group
Criteria for Determining Service Quality Performance Effectiveness
Shipping line 19 specific criteria
plus two cost criteria
Cargo owners & agents
11 specific criteria plus two cost criteria
Supply chain partners 15 specific criteria
6
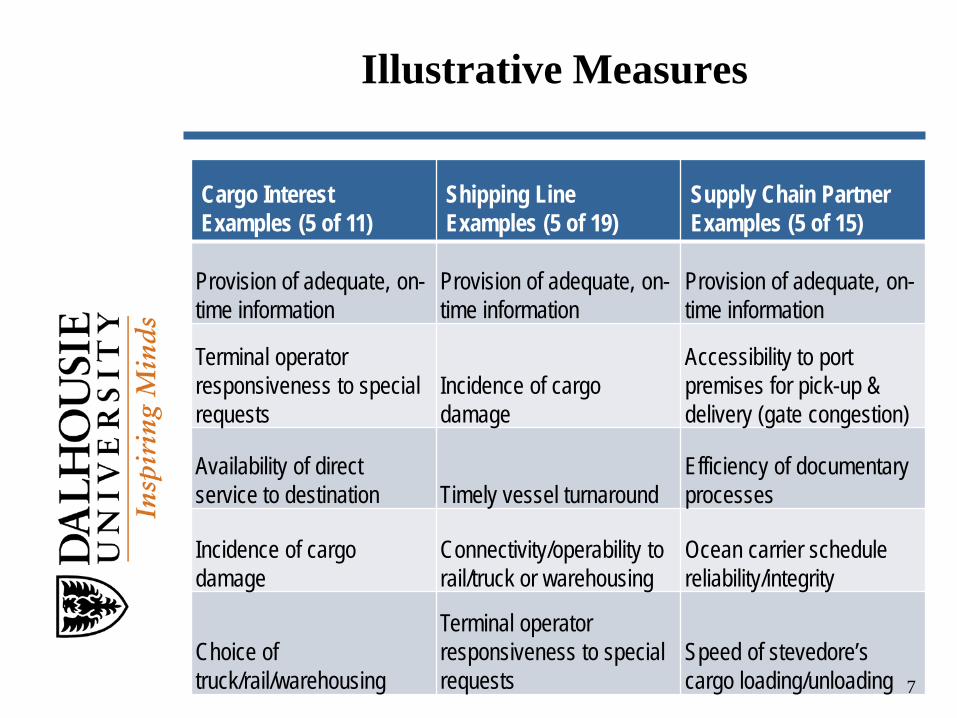
Illustrative Measures
Cargo Interest Examples (5 of 11)
Shipping Line Examples (5 of 19)
Supply Chain Partner Examples (5 of 15)
Provision of adequate, on-time information
Provision of adequate, on-time information
Provision of adequate, on-time information
Terminal operator responsiveness to special requests
Incidence of cargo damage
Accessibility to port premises for pick-up & delivery (gate congestion)
Availability of direct service to destination Timely vessel turnaround
Efficiency of documentary processes
Incidence of cargo damage
Connectivity/operability to rail/truck or warehousing
Ocean carrier schedule reliability/integrity
Choice of truck/rail/warehousing
Terminal operator responsiveness to special requests
Speed of stevedore’s cargo loading/unloading 7
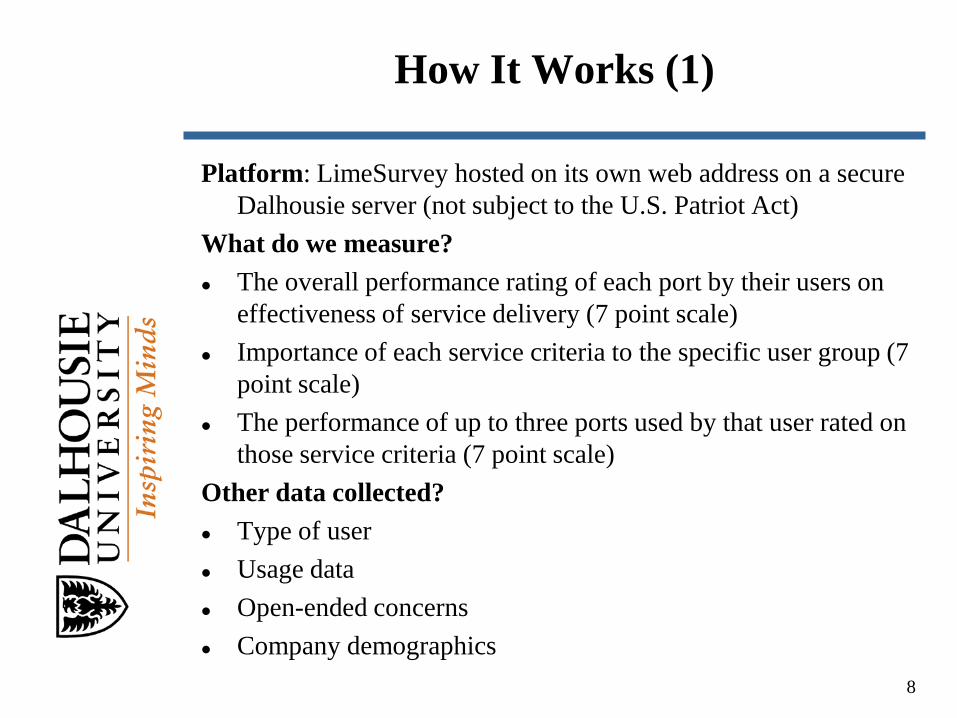
How It Works (1)
Platform: LimeSurvey hosted on its own web address on a secure Dalhousie server (not subject to the U.S. Patriot Act)
What do we measure? The overall performance rating of each port by their users on
effectiveness of service delivery (7 point scale) Importance of each service criteria to the specific user group (7
point scale) The performance of up to three ports used by that user rated on
those service criteria (7 point scale) Other data collected? Type of user Usage data Open-ended concerns Company demographics
8
How It Works (2)
What do we get as outputs? The determinants of the effectiveness of service
delivery score for each particular port (using NPE—normalized pairwise estimation)
A gap analysis (importance minus performance) for each user
Guidance for each port on its particular ratings and results
Open-ended comments for each port Demographics of the survey participants
9
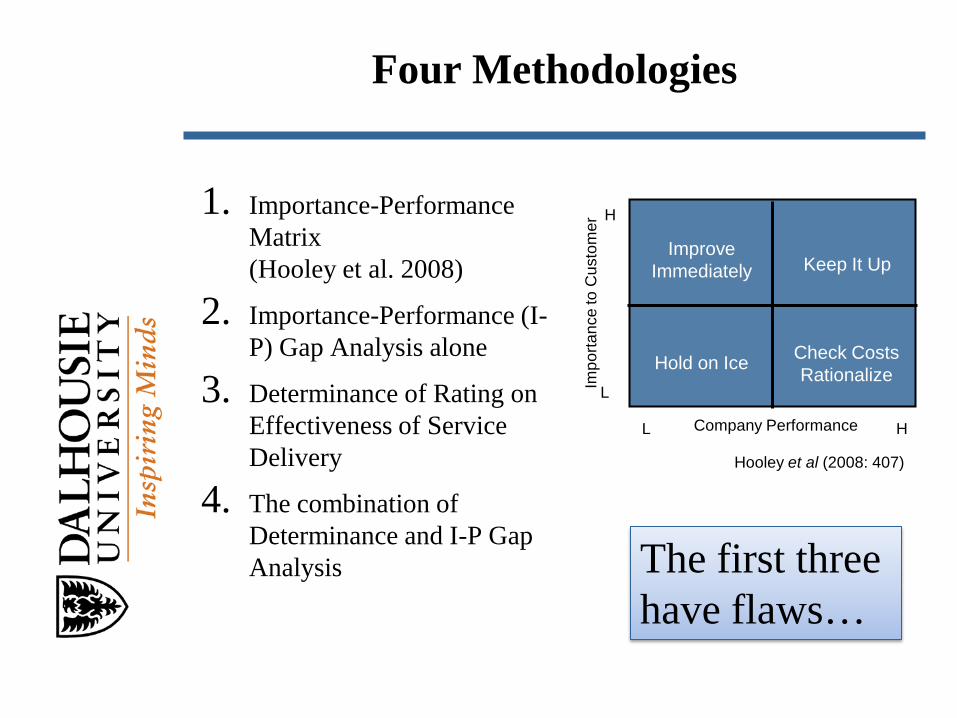
Four Methodologies
1. Importance-Performance Matrix (Hooley et al. 2008)
2. Importance-Performance (I-P) Gap Analysis alone
3. Determinance of Rating on Effectiveness of Service Delivery
4. The combination of Determinance and I-P Gap Analysis
Impo
rtanc
e to
Cus
tom
er
Company Performance
Hooley et al (2008: 407)
Improve Immediately
Check Costs Rationalize
Keep It Up
Hold on Ice
H
H
L
L
The first three have flaws…
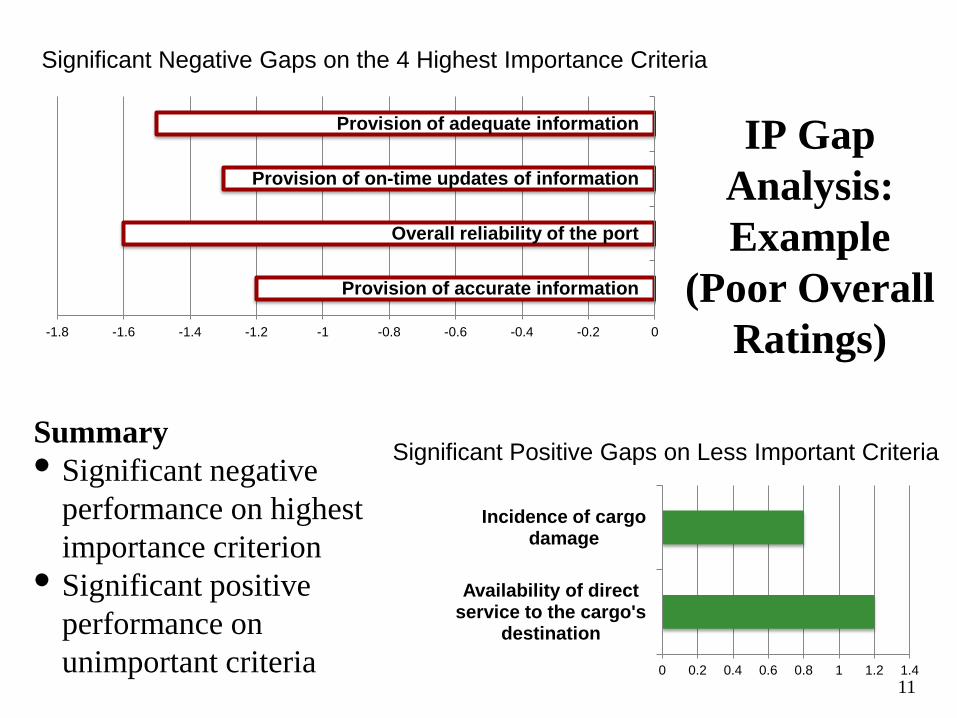
IP Gap Analysis: Example
(Poor Overall Ratings)
11
Summary • Significant negative
performance on highest importance criterion
• Significant positive performance on unimportant criteria
-1.8 -1.6 -1.4 -1.2 -1 -0.8 -0.6 -0.4 -0.2 0
Provision of accurate information
Overall reliability of the port
Provision of on-time updates of information
Provision of adequate information
Significant Negative Gaps on the 4 Highest Importance Criteria
0 0.2 0.4 0.6 0.8 1 1.2 1.4
Availability of direct service to the cargo's
destination
Incidence of cargo damage
Significant Positive Gaps on Less Important Criteria
Determinance of Attributes in Predicting Our Outcome Measures
We determine where differences in perceptions of performance on specific attributes coincide with differences in overall performance (effectiveness of service delivery)
If they coincide then we assume that perceptions on these attributes influence the overall performance measure
Attributes with the greatest influence need the greatest attention in terms of resources
Methodology: correlation called Normalized Pairwise Estimation
12
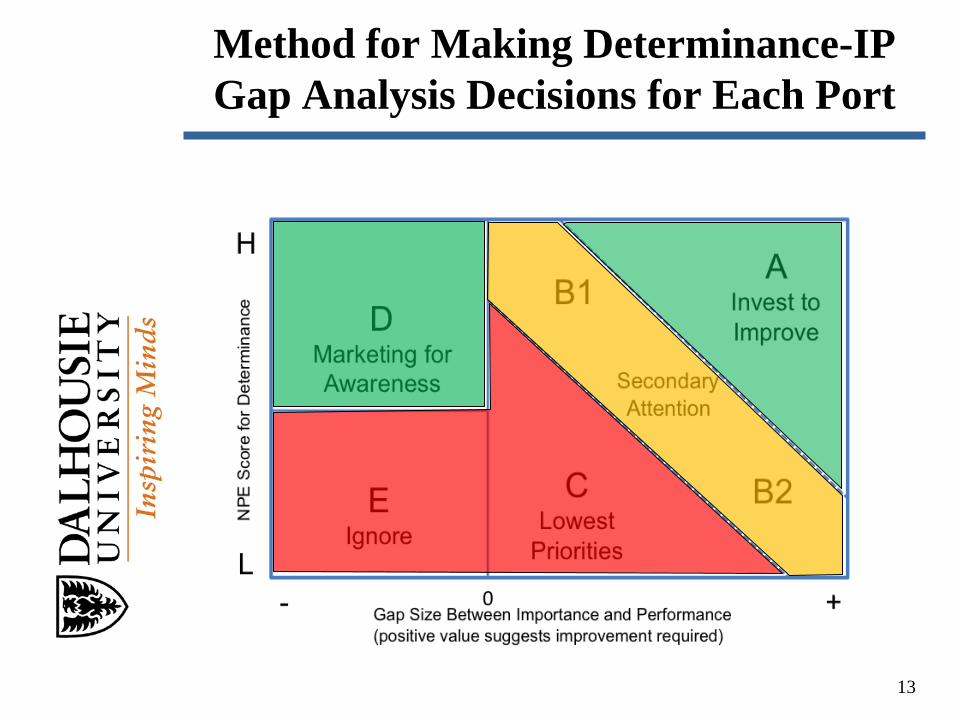
Method for Making Determinance-IP Gap Analysis Decisions for Each Port
13
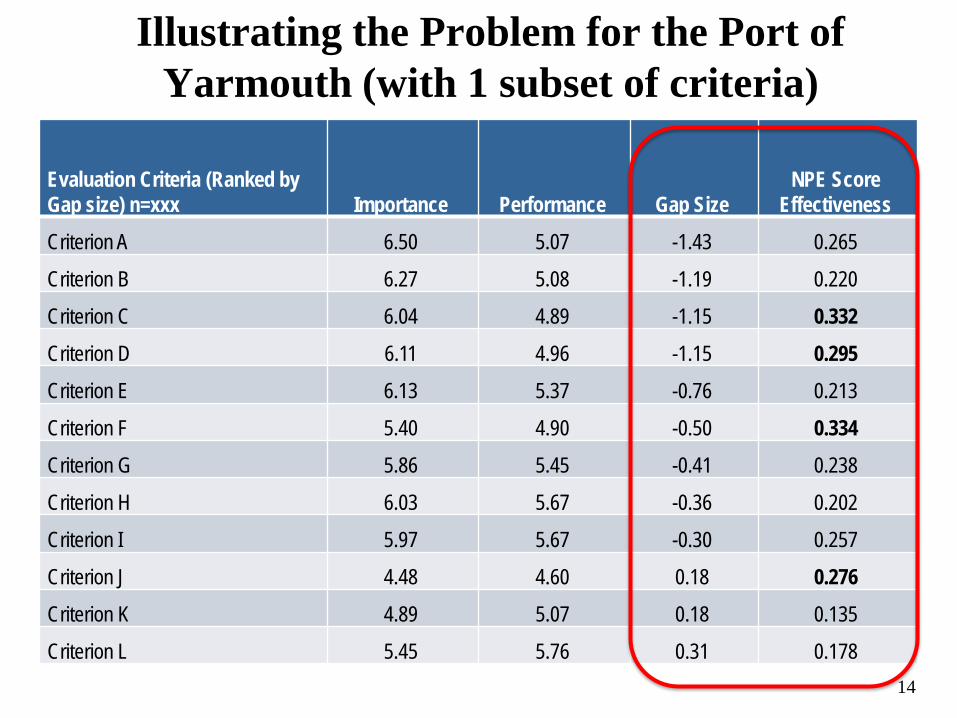
Illustrating the Problem for the Port of Yarmouth (with 1 subset of criteria)
14
Evaluation Criteria (Ranked by Gap size) n=xxx Importance Performance Gap Size
NPE Score Effectiveness
Criterion A 6.50 5.07 -1.43 0.265
Criterion B 6.27 5.08 -1.19 0.220
Criterion C 6.04 4.89 -1.15 0.332
Criterion D 6.11 4.96 -1.15 0.295
Criterion E 6.13 5.37 -0.76 0.213
Criterion F 5.40 4.90 -0.50 0.334
Criterion G 5.86 5.45 -0.41 0.238
Criterion H 6.03 5.67 -0.36 0.202
Criterion I 5.97 5.67 -0.30 0.257
Criterion J 4.48 4.60 0.18 0.276
Criterion K 4.89 5.07 0.18 0.135
Criterion L 5.45 5.76 0.31 0.178
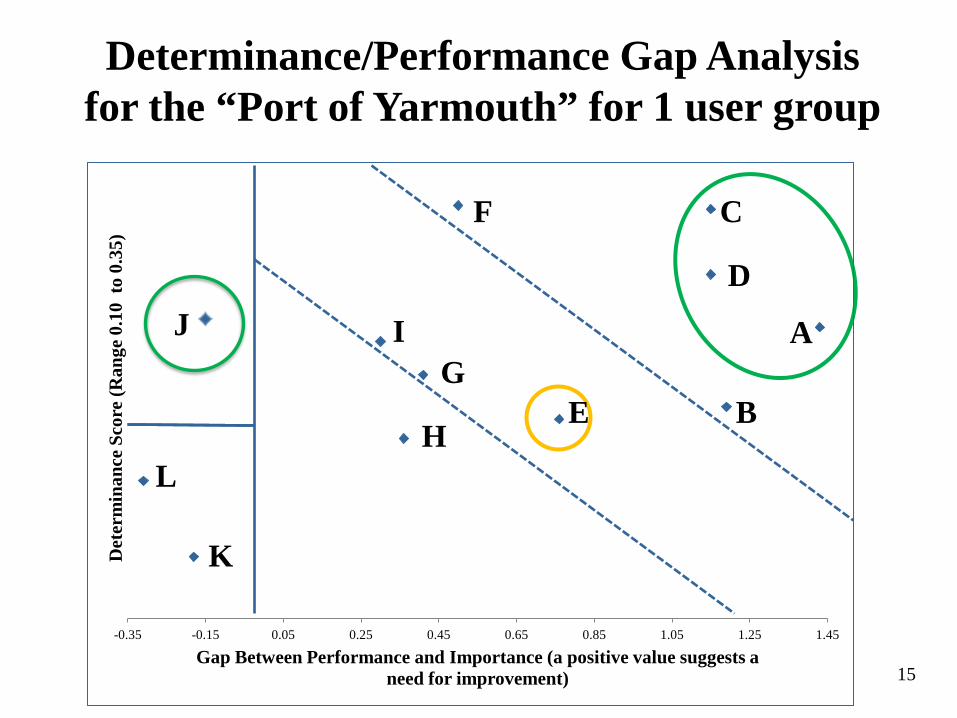
Determinance/Performance Gap Analysis for the “Port of Yarmouth” for 1 user group
15
-0.35 -0.15 0.05 0.25 0.45 0.65 0.85 1.05 1.25 1.45
Det
erm
inan
ce S
core
(Ran
ge 0
.10
to 0
.35)
Gap Between Performance and Importance (a positive value suggests a need for improvement)
C
D
A
B E
F
G
H
I J
K
L
The AAPA Customer Service Initiative Vision
• An independent third-party assessment of use to ports in effecting change and improving service delivery in supply of port services.
• An individualized report to each port that provides “best practice” scores and the port’s scores to provide context to user “importance” and that enables benchmarking for assessing resource allocation
• Each port gets its own report; AAPA gets a “state of its ports” report
16
Deliverables for the AAPA Port Customer Service Initiative
• A standardized report provided to individual participating ports containing each port’s scores on its own performance plus the best practice score on each criterion. (Data discussion and the port size and region range comparators are provided.)
• A standardized report containing the open-ended responses received from port participants and the demographics of the respondent groups.
• An AAPA Customer Service Initiative Report including key issues for all users by user group, general recommendations and advice provided to all port members based on the total dataset. (A draft report will be provided to the Executive Committee before a final report is written.)
17
18
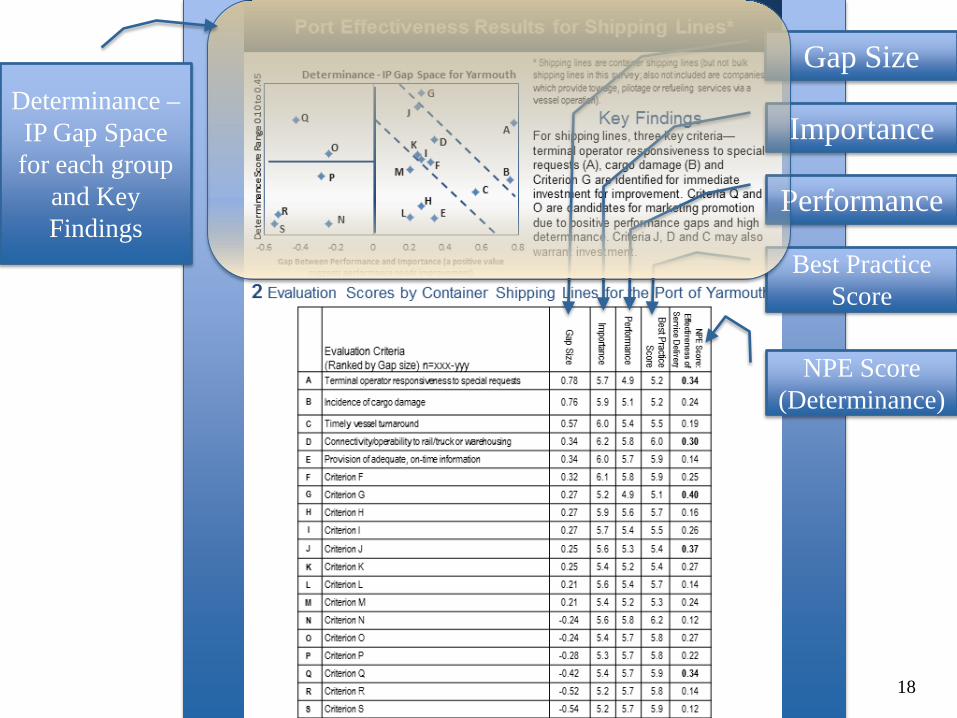
Gap Size
Importance
Performance
Best Practice Score
NPE Score (Determinance)
Determinance – IP Gap Space for each group
and Key Findings
Open-Ended Comments on Port Performance Provides Feedback
19
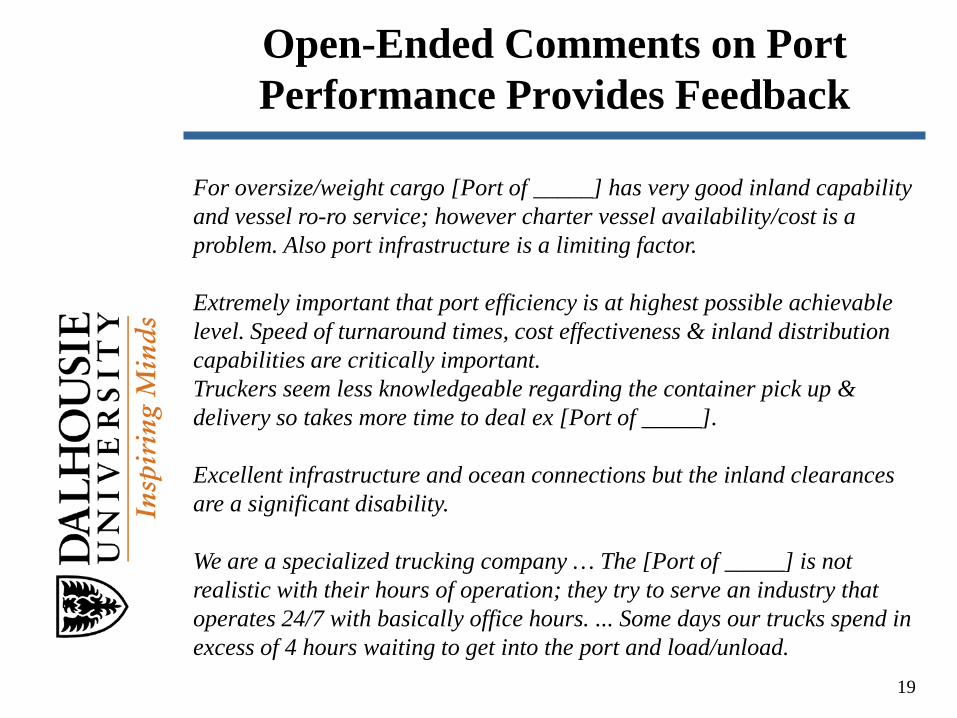
For oversize/weight cargo [Port of _____] has very good inland capability and vessel ro-ro service; however charter vessel availability/cost is a problem. Also port infrastructure is a limiting factor. Extremely important that port efficiency is at highest possible achievable level. Speed of turnaround times, cost effectiveness & inland distribution capabilities are critically important. Truckers seem less knowledgeable regarding the container pick up & delivery so takes more time to deal ex [Port of _____]. Excellent infrastructure and ocean connections but the inland clearances are a significant disability. We are a specialized trucking company … The [Port of _____] is not realistic with their hours of operation; they try to serve an industry that operates 24/7 with basically office hours. ... Some days our trucks spend in excess of 4 hours waiting to get into the port and load/unload.
Timetable
Survey execution: mid-May to end-June 2012 Data analysis: July-August 2012 Individual port reports to ports end of Sept. 2012. Draft report to AAPA Executive Committee for review at fall
meeting. Final report to AAPA December 2015.
20
Conclusions About This Methodology
Survey methodology is viable if two or more ports participate as the personal approach using port customer databases works better than the impersonal “please let us know…”
Useful/different information obtainable from all three groups
Sufficient data is collected in a ten-minute survey It is necessary to calculate and use derived IP gaps
and determinance when assessing candidates for investment
Qualitative data complements quantitative data providing rich feedback for port managers
21
Possibilities for Other Times, Modes and Geographies
Once a port has experience with the process and received its individual report, additions to the survey can be made to consider special issues ports might wish to explore.
New criteria might be added if desired. The types of those surveyed, such as other supply chain
partners, could be expanded. Developmental work could include other types of port activities
in addition to container shipments. The approach is applicable to other modes of transport and
other types of nodes in transport networks. The intention is to use this for ports on other continents.
22

© Mary R. Brooks and Tony Schellinck, 2012
Questions? Mary R. Brooks
[email protected] Tony Schellinck
With the Reports, Port Managers Can Improve Port Performance if…
• They know the importance/relevance of attributes • They know user’s perceptions of port performance
overall (e.g., effectiveness in service delivery) and by attribute (e.g., cargo handling)
• Therefore, they identify performance gaps of importance to users
• They uncover the determinance of attributes for effectiveness in service delivery
• They can combine this information using a Determinance – IP Gap Analysis to identify where to concentrate service delivery improvement efforts. (translation: where to best allocate resources!!)
24