Embed Size (px)
Citation preview

Quantifying Peace and its Benefits
The Institute for Economics and Peace (IEP) is an independent, non-partisan, non-profit think tank dedicated to shifting the world’s focus to peace as a positive, achievable, and tangible measure of human well-being and progress.
IEP achieves its goals by developing new conceptual frameworks to define peacefulness; providing metrics for measuring peace; and uncovering the relationships between business, peace and prosperity as well as promoting a better understanding of the cultural, economic and political factors that create peace.
IEP has offices in Sydney, New York, The Hague and Mexico City. It works with a wide range of partners internationally and collaborates with intergovernmental organizations on measuring and communicating the economic value of peace.
For more information visit www.economicsandpeace.org

EXECUTIVE SUMMARY 2INTRODUCTION 6
CONCEPTUAL CHALLENGES OF MEASURING PEACEBUILDING COST-EFFECTIVENESS 7Defining and Measuring Peacebuilding Cost-Effectiveness 8
Current Attempts to Measure the Cost-Effectiveness of Peacebuilding 13
CURRENT SPENDING ON PEACEBUILDING 14Introduction 15
Findings 16
CASE STUDY: HISTORY OF PEACEBUILDING EXPENDITURES IN RWANDA 22Introduction 23
Domain 1: Basic Safety and Security 25
Domain 2: Inclusive Political Processes 26
Domain 3: Core Government Functions 28
Summary 30
A GLOBAL MODEL OF THE COST-EFFECTIVENESS OF PEACEBUILDING 31Introduction 32
A Model of Peacebuilding Cost-Effectiveness 32
Estimating the Cost- Effectiveness of Peacebuilding 37
FUTURE RESEARCH 39Overview 40
Short Term: Statistical Modelling at the Global Level 40
Medium Term: Cost-Effectiveness Analysis at a Micro-Level 43
Long Term: Modelling Future Peacebuilding Expenditures 47
Conclusion 47
APPENDIX A: PEACEBUILDING CATEGORY DEFINITIONS 50
APPENDIX B: LITERATURE REVIEW 53
APPENDIX C: REFERENCES 66
END NOTES 68
1
3
2
4
5
CONTENTS
1MEASURING PEACEBUILDING COST-EFFECTIVENESS

EXECUTIVE SUMMARY
This research brief by the Institute for Economics and Peace, supported by Milt Lauenstein philanthropy is the first in a series of research briefs aiming to quantify and measure the cost-effectiveness of peacebuilding activities. It presents new and important findings and data on the positive cost-effectiveness of peacebuilding activities.
Measuring peacebuilding cost-effectiveness is a methodological and practical challenge that has significant consequences for the international community. Today, the world faces a historic decline in global peace; reaching a 25-year peak in violence and conflict in 2016. The past two years have seen the highest number of global battle deaths for 25 years, record levels of terrorism and the highest number of refugees and displaced people since World War II. When this conflict and violence subsides the critical factor to maintain durable long-term peace aside from the will of warring parties, will be peacebuilding activities — the broad set of activities targeted at reducing the risk of lapsing or relapsing into violent conflict. Peacebuilding in its preventative focus is distinct from peacekeeping and peacemaking activities — which broadly involve the activities aimed at ending violence and establishing security — peacebuilding is a prerequisite for sustainable peace.
The past two years have seen the highest number of global battle deaths for 25 years, record levels of terrorism, and the highest number of refugees and displaced people since World War II.
The need to understand what works in peacebuilding, how to measure its impact and cost-effectiveness is essential to long-term efforts to prevent violence and build peace. Yet, there is much we collectively do not know about peacebuilding, what works and doesn’t work, let alone what activities broadly define it. At a time when the international community’s resources to international development and aid are under strain due to tightened national budgets and stress from humanitarian action, the need to understand and invest in the most cost-effective ways to build long term peace is more crucial than ever.
This paper provides five critical answers and approaches to address this important question:
1) It provides a conceptual framework for counting and categorising peacebuilding activities as well as a hard working-definition of the actions that count as peacebuilding. One of the primary inhibiting factors for assessing peacebuilding cost-effectiveness has been the lack of commonly agreed definitions and confusion about what activities constitute peacebuilding. Without this, it is simply not possible to measure and compare the cost-effectiveness of peacebuilding activities.
2) A comprehensive accounting of global peacebuilding expenditures from 2002 to 2013, using the working definition that was developed in partnership with the UN Peacebuilding Support Office (PBSO) and Peacebuilding Support Group. This is the first known attempt at comprehensively accounting for peacebuilding activities — without this data it is not possible to empirically assess different peacebuilding strategies and assess the cost-effectiveness of them or individual peacebuilding actions. This data shows that peacebuilding activities are unevenly distributed geographically and thematically and are prioritised to differing extents by international donors.
3) A detailed case study of peacebuilding expenditures is presented to analyse an example of peacebuilding success — Rwanda from the wake of genocide to 2014. This analysis shows US$18.35 billion was committed to peacebuilding expenditures in Rwanda from 1995 to 2014. That means peacebuilding commitments in Rwanda from the international community were at least $27 per capita each year for the past 15 years. This demonstrates that the assistance associated with peacebuilding is not exhausted in the five or even ten years following a conflict, meaning that the success of peacebuilding cannot be judged on whether there has been a relapse into a conflict after such a short period of time has elapsed. If some moderate level of peacebuilding expenditure indeed leads to a reduction in violence, and if Rwanda is illustrative of the levels of peacebuilding required to reduce violent conflict, then the current levels of global peacebuilding expenditure are insufficient to build global peace.
2MEASURING PEACEBUILDING COST-EFFECTIVENESS

4) A global model of the cost-effectiveness of peacebuilding, based on the case study findings and the data generated from them. Using 20 years of peacebuilding expenditure, Rwanda’s experience as a baseline, and combining this with IEP’s research on the global cost of conflict, the paper presents scenario analysis and a model of peacebuilding cost-effectiveness. It finds that using conservative assumptions, the cost-effectiveness ratio of peacebuilding is 1:16, showing that increased funding for peacebuilding would be hugely beneficial not only to peacebuilding outcomes but in terms of the potential economic returns to the global economy. This means that if countries currently in conflict increased or received levels of peacebuilding funding to appropriate levels estimated by this model, then for every dollar invested now, the cost of conflict would be reduced by $16 over the long run. Projected forward ten years from 2016 this would save US$2.94 trillion in direct and indirect losses from conflict. However, achieving this outcome would require an approximate doubling of peacebuilding toward the 31 most fragile and conflict affected nations of the world. Of course, this does not preclude other important factors for peacebuilding success such as the external influence of other states or the role of political elites, but rather establishes a working framework for resources required for programmatic peacebuilding activities.
5) In order to take this research forward, this paper also provides detailed approaches for a future research agenda to look deeper into the ultimate aim of assessing the cost-effectiveness of particular peacebuilding interventions. Through drawing upon existing impact evaluations on peacebuilding interventions in Liberia, it demonstrates a basic approach to how the cost-effectiveness of specific peacebuilding interventions could be compared within a specific context. However, this approach demonstrates the long-term needs for a fully-fledged research agenda in this area. Impact evaluations are resource intensive and require a very significant upscaling of research. Currently, it is estimated that there are only 61 impact evaluations globally on programmes with peacebuilding outcomes. In other domains such as health or education there are hundreds
and thousands of such impact evaluations, which highlights the clear need for more impact evaluations in peacebuilding.
This paper introduces and examines the major issues with regard to measuring the cost-effectiveness of peacebuilding, and details practical approaches to overcome key stumbling blocks in the field. Measuring the impact of peacebuilding, let alone its cost-effectiveness, is a research problem still in its infancy, but it is an absolutely critical practical pathway to understanding how the international community, policymakers, the private sector and philanthropic actors can best prevent conflict and violence. It is hoped through further research, advocacy and collaboration with other key partners, this research can be furthered and the ultimate aim of realising more efficient investments in building peace be realised.
3MEASURING PEACEBUILDING COST-EFFECTIVENESS

KEY FINDINGS
CONCEPTUAL CHALLENGES OF MEASURING PEACEBUILDING COST-EFFECTIVENESS
j The lack of a single agreed upon definition of peacebuilding has inhibited practical research efforts to assess its effectiveness and efficiency.
j IEP’s proposed definition of peacebuilding synthesizes both qualitative and quantitative approaches to peacebuilding and provides a coding taxonomy to support future research efforts to measure the cost-effectiveness and needs for future peacebuilding.
j There are important conceptual limitations that need to be recognised in attempting to measure the cost-
effectiveness of individual peacebuilding projects. Existing efforts to measure the effectiveness of peacebuilding all recognize the enormous problem of jumping from measuring outcomes to measuring impact.
j The key is to first assess the effectiveness of particular peacebuilding strategies and then aim to measure individual program effectiveness in the broader context of those peacebuilding strategies.
COUNTING PEACEBUILDING EXPENDITURES
j Donor-funded peacebuilding expenditures are a relatively small proportion of the total aid budget.
j Conflict-affected countries do not represent the main beneficiaries of official development assistance (ODA) as in 2013 they received only slightly more than 24 percent of total ODA, or US$41 billion. These countries received US$6.8 billion for peacebuilding activities, which represents 16 percent of their total gross ODA allocation.
j Zooming into the categories of peacebuilding, almost 50 percent of peacebuilding from 2002-2013 went into only two categories — legal and judicial development; and public sector policy and administrative management.
j Peacebuilding expenditures are also distributed in a highly uneven way geographically. Over the past twelve years Afghanistan and Iraq dominated donor-financed peacebuilding expenditures.
j Donor-funded peacebuilding as a percentage of total ODA has almost stagnated in real terms for conflict-affected countries.
j Peacebuilding expenditures and priorities vary significantly across donors — the UK, US and Norway commit the largest sum toward peacebuilding at 24, 23 and 21 percent of their total ODA expenditure, respectively. Conversely, France and Japan spend only three and six percent, respectively, of their development budgets on peacebuilding.
CASE STUDY HISTORY OF PEACEBUILDING EXPENDITURES IN RWANDA
j US$18.35 billion was committed to peacebuilding ODA in Rwanda from 1995 to 2014. That means peacebuilding commitments in Rwanda from the international community were at least $27 per capita each year for the past 15 years.
j Of that US$18.35 billion, only three percent was allocated to programs in the Basic Safety and Security domain, with the majority of expenditure going towards building inclusive political processes and strengthening core government functions in the wake of the genocide.
j Peacebuilding assistance immediately after the genocide did not increase for five years and it was only until after the introduction of the Vision 2020
plan that peacebuilding expenditures alongside other development aid significantly increased in Rwanda. Since then, peacebuilding expenditure has continually increased over the past 15 years.
j The data on peacebuilding on Rwanda illustrates that the categories of assistance associated with peacebuilding are not exhausted in the five or even ten years following a conflict, meaning that the success of peacebuilding cannot be judged on whether there has been a relapse into a conflict (or conversely, an avoidance of conflict) in the immediate post-conflict timeframe.
4MEASURING PEACEBUILDING COST-EFFECTIVENESS

j If one assumes that peacebuilding ODA leads to a reduction in violence, and if Rwanda is illustrative of the levels of peacebuilding required to reduce violent
conflict, then the levels of global peacebuilding expenditure are insufficient to build global peace.
A GLOBAL MODEL OF THE COST-EFFECTIVENESS OF PEACEBUILDING
j IEP has constructed a global model of peacebuilding cost-effectiveness that shows increased funding for peacebuilding would be hugely beneficial not only to peacebuilding outcomes but in terms of the potential economic returns to the global economy.
j Using 20 years of peacebuilding expenditure in Rwanda as a guide for establishing a unit cost, IEP estimates the cost-effectiveness ratio of peacebuilding at 1:16.
j This means that if countries currently in conflict increased or received increased levels of peacebuilding funding to appropriate levels estimated by this model, then for every dollar invested now, the cost of conflict would be reduced by 16 dollars over the long run.
j The total peace dividend the international community would reap if it increased peacebuilding commitments over the next ten years from 2016 is US$2.94 trillion.
Based on the assumptions in this model, the estimated level of peacebuilding assistance required to achieve this outcome would be more than double what is currently directed toward peacebuilding for the 31 most fragile and conflict affected nations of the world.
j Only Afghanistan and Iraq have received peacebuilding expenditures at levels higher than Rwanda on a per capita basis. These exceptions underline the importance of viable political settlements and peace agreements for successful peacebuilding activities.
j While every such model may rely on important assumptions, robustness testing illustrates that even if these assumptions are changed and the unit cost of peacebuilding is increased, peacebuilding is still overwhelmingly cost-effective.
FUTURE APPROACHES AND NEXT STEPS
j At the global level, peacebuilding is overwhelming cost-effective. However, this doesn’t reveal anything about which types of peacebuilding are most effective.
j IEP has outlined a research program for the short, medium, and long-term that becomes increasingly granular. Starting from the global level, it would gradually drill down to the project level in order to fully flesh-out the cost-effectiveness of different peacebuilding activities.
j The data generated in this first phase of research provides an extensive set of further options to model the statistical link between peacebuilding and conflict onset or lack thereof.
j These methodologies can be used to calculate and estimate the future peacebuilding needs that exist in particular countries.
5MEASURING PEACEBUILDING COST-EFFECTIVENESS

INTRODUCTION
Peacebuilding as a field of practice faces challenges that are numerous, steep, and, often, seemingly insurmountable. However, those that have had success in ending violent conflicts and building up stronger, safer societies know that there are few human efforts with higher stakes or rewards. There are peacebuilding strategies that work, and those that do not; some require major international investments; some fail or succeed based on the ingenuity and dedication of those committed to peace. But all of them include a battle for attention, belief in the process, and resources. While the world lost $742 billion to violent conflict in 2015, it spent only a corresponding two percent of that on building and keeping peace. Asserting the effectiveness and worth of a particular peacebuilding strategy may be the most important step peacebuilders can take on the path to success.
The first section of this report looks at the challenges involved in defining peacebuilding itself. There is no standard international definition of what constitutes peacebuilding. As a consequence, there is no clear, comparable country-specific data on peacebuilding expenditures nor is there a clear understanding of where resources are being committed, either at the nation-state or at the programmatic level. Whilst there is some consensus around certain types of activities related to violence prevention, there are a number of areas in which there is considerable overlap between peacebuilding, state-building, and development, and consequently no clear framework for making a clear distinction between the three. There are similar questions regarding the timeframe for peacebuilding. Traditionally, peacebuilding was only thought to take place in the immediate post-conflict environment. However, there is an emerging consensus that successful peacebuilding can take decades, and that activities undertaken prior to the onset of a conflict can build up levels of peacefulness.
The second section of this report provides an overview of IEP research on the cost-effectiveness of peacebuilding. It provides a definition and counting method for measuring current peacebuilding expenditure. This section further highlights the challenges of defining and measuring both peacebuilding and cost-effectiveness, but also demonstrates that the simple act of aggregating official development assistance (henceforth in this report ‘ODA’) data into peacebuilding categories greatly increases our understanding of current peacebuilding strategies and priority areas. It allows for analysis on the composition of peacebuilding activities, and whether support is disproportionately distributed.
The third section of the report looks at IEP’s peacebuilding framework applied to the last 20 years of peacebuilding ODA in Rwanda. The purpose of this is twofold: firstly, to test whether IEP’s peacebuilding framework appropriately captures two decades of peacebuilding activity in Rwanda, which is considered
by most in the peacebuilding field to be at least a partial example of successful peacebuilding assistance. Secondly, applying this approach to Rwanda serves as the basis for constructing a ‘unit cost of peacebuilding’ which is then applied in the global model, described in detail in the following section.
The fourth section of the report illustrates that peacebuilding is cost-effective at the global level, as even if peacebuilding funding was to be greatly increased, this increase would be significantly outweighed by a significant reduction in the cost of conflict over the long run. IEP’s cost of conflict model uses the cost of peacebuilding in Rwanda over a twenty year period as ‘the unit cost’ of successful peacebuilding. If other countries increased their level of peacebuilding per capita to levels seen in Rwanda, the cost of conflict could fall drastically over the next two decades.
Finally, the fifth section of the report outlines some potential avenues for future research in this program. In the short term, this research would involve looking at the impact and effectiveness of peacebuilding at the national level. IEP’s model of peacebuilding effectiveness at the global level relies on the assumption that peacebuilding expenditure is in of itself effective at reducing violence and conflict. Though this assumption is intuitively defensible, it needs to be examined in more detail in order to try and understand exactly how much impact peacebuilding funding has on conflict, and whether different domains of peacebuilding activity have an equal impact on reducing violent conflict. Central to this approach will be developing a model that incorporates the cost of conflict or some other continuous variable as the dependent variable measuring violent conflict. Most current research in this area uses a simple binary measure of conflict/no conflict over a given time period. Furthermore, this body of research also does not typically use independent variables that are analogous or even similar to the definition of peacebuilding used by IEP.
In the longer term, IEP’s research program would look to bridge the gap between micro and macro measures of peacebuilding impact, by building on existing research that collates impact evaluations in the peacebuilding field. IEP would aim to further synthesize these efforts by collating at the national level, and also by using the peacebuilding taxonomy outlined in this paper to classify existing impact evaluations. This would allow the field of potential evaluations to be narrowed considerably, by only focusing on those evaluations where a link to violent conflict reduction could be identified. Upon completion of this categorization process, the final element of cost-effectiveness could be added in, thus allowing for (at least in theory) a measure of peacebuilding cost-effectiveness at the micro level that is directly tied to peacekeeping outcomes at the macro level.
6MEASURING PEACEBUILDING COST-EFFECTIVENESS

CONCEPTUAL CHALLENGES OF MEASURING PEACE- BUILDING EFFECTIVENESS
1
KEY FINDINGS
j There is no single agreed upon definition of peacebuilding, which has inhibited practical research efforts to assess its effectiveness and efficiency.
j IEP’s proposed definition of peacebuilding synthesizes both qualitative and quantitative approaches to peacebuilding and allows for a coding taxonomy to support research efforts to measure the cost-effectiveness and needs for future peacebuilding.
j There are important conceptual limitations that need to be recognised in attempting to measure the cost-effectiveness of individual peacebuilding projects. Existing efforts to measure the effectiveness of peacebuilding all recognize the huge problem of jumping from measuring outcomes to measuring impact.
j The key is to first assess the effectiveness of particular peacebuilding strategies and then aim to measure individual program effectiveness in the broad context of those broader peacebuilding strategies.
7MEASURING PEACEBUILDING COST-EFFECTIVENESS

DEFINING & MEASURING PEACEBUILDING COST-EFFECTIVENESS
The development community should initiate a process of preparing more detailed and accurate country-by-country estimates of the overall funding needs for sustaining peace over the longer-term. Such estimates will help the UN and partners better understand their investments, better discuss compacts with national governments about national contributions, identify prevailing gaps and justify global fundraising”
— Recommendation from the report of the Advisory Group of Experts for the Peacebuilding Architecture Review, June 2015 1
Peacebuilding involves a range of measures targeted to
reduce the risk of lapsing or relapsing into violent conflict
by strengthening national capacities and institutions at all
levels for conflict management, and to lay the foundations
for sustainable peace and development. It is distinct from
peacekeeping and peacemaking activities, which broadly
involve the activities aimed at ending violence and establishing
security. The immediate cessation of conflict is only the first
step in building long-term peace. Of the 103 countries that have
been affected by civil war during the period 1945-2009, only 44
countries avoided relapsing into conflict.2
While peacebuilding activities are extremely important, there
is no accurate measure of the size of global peacebuilding
expenditures. There is, in fact, no internationalized
standardized definition for what constitutes definitive
peacebuilding actions. As a consequence, there are no
clear comparable country specific data on peacebuilding
expenditures, nor clear understanding where resources are
being committed whether simply at the nation-state level or
at the programmatic level.
This highlights an obvious problem: without a clear
picture of the yearly recurrent expenditures and resources
committed to peacebuilding — who is spending where and
on what — it is not possible to systematically assess the
global strategic efficacy and efficiency of peacebuilding
expenditures. Without this data, it is very difficult for
governments, bilateral donors, international financial
institutions (IFIs) and UN entities to project peacebuilding
needs, and for other donors to direct funding to areas
where it would have the most impact. Equally, without an
accurate global picture of the direction of peacebuilding
resources, various research and advocacy efforts aimed at
understanding what works or doesn’t work in peacebuilding
are hampered. Some fundamental questions in the field
depend on this type of data. For example, are funds directed
in a coordinated and coherent way? Are funds appropriately
matched to country needs and levels of peace and conflict?
Are they commensurate with other donor aid and are
programmes appropriately timed with other interventions?
Are those funds having a positive long-term impact in
mitigating violence and building positive peace?
The potential benefits from investing more in peacebuilding
are enormous. The costs of violent conflict are orders of
magnitude larger than current peacebuilding expenditure.
Preliminary IEP estimates shows that the cost of violent
conflict in 2013 was over 120 times higher than peacebuilding
and peacekeeping funding. Despite this, peacebuilding is
a relatively overlooked aspect of ODA. Over the 12-year
period 2002-2013, peacebuilding expenditures averaged
US$13 per capita, per year, for conflict-affected countries.
This compares to US$62 per capita for all other official
development aid over the period. When excluding outliers
like the West Bank and Gaza and Kosovo3, peacebuilding
goes down to US$9 per capita.
8MEASURING PEACEBUILDING COST-EFFECTIVENESS
DEFINING PEACEBUILDING PARAMETERS
Cost-effectiveness analysis is an alternative to cost-benefit
analysis that measures the effectiveness (outcomes per
dollar) of two alternatives according to specific measures
of the program objectives (Kee, 1999). Although both
important, there is no known piece of literature that applies
a cost-effectiveness methodology to peacebuilding activities
around the world. This research will allow for standardized
assessments of peacebuilding operations and solid
approaches for future peacebuilding interventions.
The ultimate aim of this research program is to develop a
methodology for assessing the cost-effectiveness of different
types of peacebuilding activities. However, this aim raises
multiple definitional questions that must be answered before
the project can even begin:
j What activities count as peacebuilding?
j What is the timeframe for peacebuilding?
j What is cost-effectiveness?
j At what level should cost-effectiveness be measured?
j What attempts have already been made to measure the impact of peacebuilding?
WHAT ACTIVITIES COUNT AS PEACEBUILDING? WHAT IS THE TIMEFRAME FOR PEACEBUILDING?
There has been a certain ambiguity present in the definition
of peacebuilding since its use by former UN Secretary-
General Boutros Boutros-Ghali in the landmark UN report
“An Agenda for Peace” in 1992, which defined peacebuilding
as “action to identify and support structures which will tend
to strengthen and solidify peace in order to avoid a relapse
into [armed] conflict.” While there is a general agreement on
some or even most of the types of activities that meet this
definition, the exact borders that delineate peacebuilding
from peacemaking, peacekeeping, and development more
generally are not well-defined.
Defining peacebuilding as activities aimed at reducing
violence is a useful guideline but does not necessarily add
much clarity. An overly restrictive reading of this rule
collapses peacebuilding into peacekeeping and peacemaking,
whilst an overly broad reading encompasses the entire
spectrum of development activity, as almost every activity
that leads to development can be linked to reductions in
violence, particularly over a long enough timeframe.
Similarly, peacebuilding cannot necessarily be limited to
the post-conflict environment. The recent review of the UN
peacebuilding architecture4 suggested that:
“Peacebuilding — the term that this report proposes is sustaining peace — needs to be liberated from the strict limitation to post-conflict contexts. Many of the priorities and the tools for preventing lapse or relapse into conflict are similar and it makes little sense to divide limited energies and resources artificially.”
This concern can be extended both backwards in time to
pre-conflict attempts to prevent the outbreak of war, but also
forward, perhaps even decades after a conflict has ended.
Research by the World Bank suggests that the immediate
post-conflict period when peacebuilding activities are often
activated is usually the most critical time for peace. The
World Bank has shown that the risk of civil war restarting
is very significant at the dawn of peace after a conflict.5
However, the aforementioned UN review suggests that
building up institutional strength may take 15 to 30 years,
and the 2004 Utstein study of peacebuilding stated that
sustainable peace at the national level is ‘only available
on the basis of sustained effort lasting a decade or more’.
Restricting the timeframe of the analysis to a shorter period
might lead to premature declarations of peacebuilding
effectiveness.
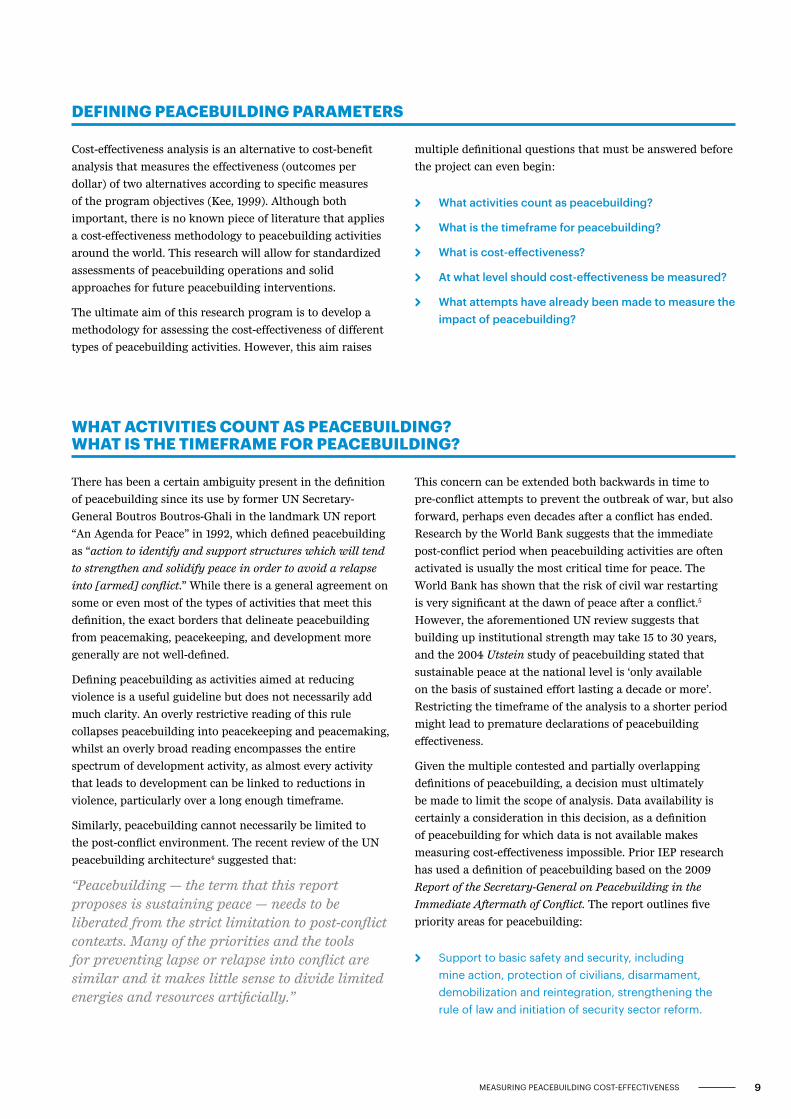
Given the multiple contested and partially overlapping
definitions of peacebuilding, a decision must ultimately
be made to limit the scope of analysis. Data availability is
certainly a consideration in this decision, as a definition
of peacebuilding for which data is not available makes
measuring cost-effectiveness impossible. Prior IEP research
has used a definition of peacebuilding based on the 2009
Report of the Secretary-General on Peacebuilding in the
Immediate Aftermath of Conflict. The report outlines five
priority areas for peacebuilding:
j Support to basic safety and security, including mine action, protection of civilians, disarmament, demobilization and reintegration, strengthening the rule of law and initiation of security sector reform.
9MEASURING PEACEBUILDING COST-EFFECTIVENESS

j Support to political processes, including electoral processes, promoting inclusive dialogue and reconciliation, and developing conflict-management capacity at national and subnational levels.
j Support to restoring core government functions, in particular basic public administration and public finance, at the national and subnational levels.
j Support to the provision of basic services, such as
water and sanitation, health and primary education, and support to the safe and sustainable return and reintegration of internally displaced persons and refugees.
j Support to economic revitalization, including employment generation and livelihoods (in agriculture and public works) particularly for youth and demobilized former combatants, as well as rehabilitation of basic infrastructure.
After further consultation with the UN Peacebuilding Contact Group, which was convened by the PBSO, IEP limited the
definition to the first three priority areas, which can be further broken up into 17 categories. The categories are taken from the
OECD Development Assistance Committee Creditor Reporting System, and are summarised in table 1.1 below.
TABLE 1.1 CATEGORIES OF PEACEBUILDING EXPENDITURESThe distinction between ‘core’ peacebuilding and ‘secondary’ peacebuilding is an attempt to distinguish some of the immediate activities related to maintaining security and those longer-term activities that support the building of institutions.
DOMAIN NUMBER CATEGORY DESCRIPTION CRS CODE
CORE PEACE-BUILDING
1. BASIC SAFETY
& SECURITY
1.1 Security system management and reform 15210
1.2 Reintegration and SALW control 15240
1.3 Removal of land mines and explosive remnants of war 15250
1.4 Child soldiers (Prevention and demobilization) 15261
1.5 Participation in international peacekeeping operations 15230
OTHER Other specific peace-related expenses
2.8 Civilian peacebuilding, conflict prevention and resolution 15220
SECONDARY PEACE-
BUILDING
2. INCLUSIVE POLITICAL
PROCESSES
2.1 Legal and judicial development 15130
2.2 Legislatures and political parties 15152
2.3 Anti-corruption organisations and institutions 15113
2.4 Democratic participation and civil society 15150
2.5 Media and free flow of information 15153
2.6 Human rights 15160
2.7 Women’s equality organisations and institutions 15170
3. CORE
GOVERNMENT FUNCTIONS
3.1 Public sector policy and administrative management 15110
3.2 Public finance management 15111
3.3 Decentralisation and support to subnational government 15112
A full description of each of these categories can be found
in Appendix A. The selection of these categories does not
mean that future research in this program will be limited to
analysing official ODA flows from OECD countries, but rather
that any program, activity, or approach by an actor, state
or civil, will have to fit within one of these categories to be
considered ‘peacebuilding’ for the purposes of this research.
Developing a precise definition with regard to the timeframe
for peacebuilding is more difficult. However, attempts should
be made to broaden the window beyond the immediate post-
conflict period.
Figure 1.1 is an attempt to conceptualise the scope of
the peacebuilding definition used by this project, where
the x-axis represents time, and the y-axis the type of
10MEASURING PEACEBUILDING COST-EFFECTIVENESS

peacebuilding activity. Those activities further up the y-axis
are further away from conflict, in the sense that they are not
direct responses to conflict or attempts to prevent violence,
but are rather better classified as development activities.
This is not to suggest that implementing basic services and
economic growth are not essential to reducing violence,
indeed, in certain circumstances and over a long time frame
they might in fact be more important drivers of peacefulness,
but rather that they are conceptually too distinct from more
direct peacebuilding activities.
The conceptualisation outlined in figure 1.1 is a first
attempt and as this research develops and feedback is
sought, amendments may be made. The initial analysis of
peacebuilding expenditure may make it clear that there
is no relationship between some of the categories and
improvements in peacefulness, or it may be necessary to
increase the number of categories, or to replace one category
with another.
Violence Containment
Violence Containment
Violence Containment
Violence Containment
Before Conflict
Before Conflict
— Economic Revitalisation
— Basic Services
— Core Government Functions
— Inclusive Political Processes
— Basic Safety and Security
Before Conflict
Before Conflict
After Conflict
After Conflict
After Conflict
After Conflict
( TIME )
( TIME )
( TIME )
( TIME )
( TYPE )
( TYPE )
( TYPE )
( TYPE )
Development
Development
Development
Development
PEACE-BUILDING
PEACE-BUILDING
FIGURE 1.1 PROPOSED SCOPE OF THE DEFINITION OF PEACEBUILDING FOR THIS RESEARCH PROGRAM
Short term Long term Medium term
11MEASURING PEACEBUILDING COST-EFFECTIVENESS

WHAT IS COST-EFFECTIVENESS & AT WHAT LEVEL SHOULD IT BE MEASURED?
Up until this point, this report and other preliminary
discussions have used the term ‘cost-effectiveness’ to describe
the ultimate aim of this project. Cost-effectiveness is most
commonly defined as the number of outputs a program
creates for each x amount of dollars invested. This method
shows the cost of each percent increase/decrease for unit
of output. In a peacebuilding context, this might be the
number of landmines removed per dollar spent on removal
for instance.
There are a number of issues with this approach in the
peacebuilding context. In some instances, determining
cost-effectiveness might be difficult or impossible given
data constraints, meaning that, finding the most cost-
effective strategy may have to be replaced with an effort
to find the ‘best’ strategy for creating a sustained peace.
Secondly, whether the output level is the most appropriate
for measuring cost-effectiveness in a peacebuilding context
is open to question. Certain peacebuilding activities may
be cost-effective in terms of producing a large number of
outputs, but if they do not lead to better peacebuilding
outcomes they are of no value in the broader peacebuilding
context. Figure 1.2 explains the difference between inputs
(in the context of this report, peacebuilding categories or
activities), outputs, outcomes, and impact.
FIGURE 1.2 INPUTS, OUTPUTS, OUTCOMES, IMPACT: HEALTH EXAMPLE
Thirdly, even if outcomes or impact are considered better
measures of effectiveness than outputs, they may be difficult
or impossible to measure. Peacebuilding outcomes are often
measured in terms of institutional performance, which may
only be measurable by proxy measures such as perception
surveys, or composite indicators, rather than by a single
easily quantifiable number. The same critique at an even
more fundamental level can be applied to measuring impact.
Simple binary measures of whether a country has fallen back
into conflict, or similar measures of the number of battle
deaths are usually used to classify whether peacebuilding
efforts have been successful, but using such measures makes
it hard to differentiate between the importance of different
types of peacebuilding, as they give no measure of the level of
peacefulness of a country. Furthermore, they cannot provide
any information on whether violent conflicts have shifted or
mutated into other forms of violence, such as an increase in
terrorism, or state repression.
At this stage, whether longer term efforts will ultimately
end up measuring ‘impact’, ‘cost-effectiveness’, or some
combination of the two (or one at the macro level and
another at the micro-level) will depend on the availability
of data and further progress in this literature. The first
stage of the research, as outlined in section 3, will focus
on illustrating the overwhelmingly cost-effective nature of
peacebuilding as a whole, which may in turn lead to the
question of cost-effectiveness at the local, project, or national
level to be left in the background and allow for a strict focus
on which peacebuilding programs have the greatest impact.
INPUTS
OUTPUTS
OUTCOMES
IMPACT Effect on living standards
Access, usage and satisfaction of users
Goods and services generated
Financial and physical resources
j infant and child mortality j prevalence of specific disease
j number of children vaccinatedj percentage within 5km of health centre
j number of nursesj availability of medicine
j spending in primary health care
Source: An introduction to Impact Evaluation, Markus Goldstein
12MEASURING PEACEBUILDING COST-EFFECTIVENESS

CURRENT ATTEMPTS TO MEASURE THE COST-EFFECTIVENESS OF PEACEBUILDING
There have been a number of major attempts to measure the
impact (although not necessarily the cost-effectiveness) of
peacebuilding in the last few years, with several additional
reports that attempt to evaluate whether such measures are
even possible.
A recent report from the International Initiative for Impact
Evaluation (henceforth 3ie)6 looked at the state of impact
evaluations in the peacebuilding field, using a framework
based on the International Dialogue on Peacebuilding
and Statebuilding (IEP’s peacebuilding taxonomy is itself
a modified form of this framework). It identifies five
intervention domains: Legitimate politics, Security, Justice,
Economic Foundations, and Revenue and Social Services.
Impact evaluations are situated as taking place in one of
these five domains, and then listed as having an outcome
in one of three domains: individual outcomes, societal
and institutional outcomes, and peacebuilding outcomes.
For example, a peacebuilding project in the security
domain might have individual outcomes, like changing an
individual’s beliefs, it might have institutional outcomes, like
increasing public confidence in the police, or it might have
peacebuilding outcomes, like directly reducing the level of
intergroup conflict. While these domains and outcomes do
not map directly onto IEP’s peacebuilding categories, they
can be transformed in such a way that they almost directly
match IEP’s peacebuilding taxonomy.
3ie’s evidence gap map highlights 61 impact evaluations with
peacebuilding outcomes, and a further 92 impact evaluations
with societal and institutional outcomes, which could
reasonably be considered to fall under IEP’s peacebuilding
categorization. The report suggests that there are a number
of intervention categories in which there are enough impact
evaluation studies for more systematic review or evidence-
synthesis work to be carried out. If this is in fact the case,
the impact evaluations highlighted by the report could serve
as the basis for comparing outcomes across different types
of interventions, which might in turn lead to a comparison
of cost-effectiveness at the outcomes level for different
peacebuilding interventions.
By contrast, the most pertinent finding in ‘Towards a
Strategic Framework for Peacebuilding: Getting Their Act
Together’ 7, (an overview report on the joint Utstein study of
peacebuilding) is that attempts at peacebuilding evaluation
at the program level may be fundamentally flawed for two
reasons: firstly, whilst impact evaluations might be able
to measure well-defined outcomes (number of landmines
removed etc.) it is much more difficult to measure the impact
on violent conflict (reduction in number of fatalities, fall
in the likelihood of conflict relapse etc.). Secondly, given
that the timeline for successful peacebuilding is so long
(estimates vary from one to three decades), even if a specific
program had a clear positive impact on reducing violent
conflict, it may itself spark a backlash over time, might
accidentally contribute to destabilization over the longer run,
or might have an impact that cannot be disentangled from
other peacebuilding projects being run simultaneously. Given
this fact, the report recommends:
“Output should continue to be evaluated as part of project evaluations to ensure that best practice is respected, projects are properly managed, and lessons are drawn from both the strengths and the weaknesses of projects. Impact assessment, however, should be removed from project evaluation and explored instead at the strategic level, asking whether the intervention strategy as a whole is working” 8
These two contrasting findings highlight the ambiguity in
outcomes for this research project. If current and future
impact evaluations are of significant quality and quantity to
allow for research results to be synthesized in different areas
of peacebuilding and compared across multiple countries,
then it may be possible to use this research to bridge the
gap between outcomes and impact. However, if the research
is insufficient for this purpose, then the research can go
no further than comparing the effectiveness of different
peacebuilding strategies, rather than individual programs.
13MEASURING PEACEBUILDING COST-EFFECTIVENESS

CURRENT SPENDING ON PEACEBUILDING
2
KEY FINDINGS
j Donor-funded peacebuilding expenditures are a relatively small proportion of the total aid budget.
j Conflict-affected countries do not represent the main beneficiaries of ODA as in 2013 they received only slightly more than 24 percent of total ODA, or US$41 billion. These countries received US$6.8 billion for peacebuilding activities, which represents 16 percent of their total gross ODA allocation.
j Zooming into the categories of peacebuilding, almost 50 percent of peacebuilding from 2002-2013 went into only two categories — legal and judicial development; and public sector policy and administrative management.
j Peacebuilding expenditures are also distributed in a highly uneven way geographically. Over the past twelve years Afghanistan and Iraq dominated donor-financed peacebuilding expenditures.
j Donor-funded peacebuilding as a percentage of total ODA has almost stagnated in real terms for conflict-affected countries.
j Peacebuilding expenditures and priorities vary significantly across donors — the UK, US and Norway commit the largest sum toward peacebuilding at 24, 23 and 21 percent of their total ODA expenditure, respectively. Conversely, France and Japan spend only three and six percent, respectively, of their development budgets on peacebuilding.
14MEASURING PEACEBUILDING COST-EFFECTIVENESS

INTRODUCTION
Because of the lack of consensus around what constitutes
peacebuilding, there has been no systematic attempt to tally
and analyse peacebuilding expenditure above the project
level. An analysis of the cost-effectiveness of peacebuilding
is impossible without first knowing how much is spent on
peacebuilding and where it is spent. This section presents
results of a stocktaking exercise on the current size,
direction and source of global peacebuilding expenditures.
It provides a categorisation of international and domestic
expenditures on peacebuilding, in line with the typology
outline in section one of this paper.
Two forms of peacebuilding expenditures are identified: (1)
donor expenditures, as measured by ODA, and (2) domestic
expenditures. This paper aims to assess in constant and
US dollars at purchasing power parity (PPP) the yearly
expenditures that go into peacebuilding. Two distinct
types of spending are counted: (1) donor expenditures as
measured by the Organisation for Economic Cooperation
and Development (OECD) Development Assistance
Committee (DAC) Creditor Reporting System (CRS); and (2)
domestically sourced and spent expenditures as measured
via the government budgets of selected conflict-affected
countries.
In order to limit the scope of this initial peacebuilding
accounting exercise, IEP focused on the countries deemed
most in need of peacebuilding expenditure. To determine
the list of countries most in need of peacebuilding
interventions, 31 countries and territories were identified
that meet at least one of the following criteria:
a) have an active multidimensional peacekeepingoperation mandated by the UN Security Council;
b) have an active special political mission with particularcountry focus mandated by the UN Security Council;
c) are eligible for funding by the Peacebuilding Fund(PBF).
Of these 31 countries, IEP was able to find data on domestic peacebuilding expenditure for 15. Table 2.1 shows the countries
included in the analysis.
TABLE 2.1 THE 31 CONFLICT-AFFECTED COUNTRIES INCLUDED IN THE ANALYSISFOR THE 15 COUNTRIES MARKED [*], DOMESTICALLY FINANCED PEACEBUILDING EXPENDITURES WERE IDENTIFIED.
Afghanistan* Iraq Palestine
Burundi* Kosovo[1]* Papua New Guinea*
Central African Republic Kyrgyzstan Sierra Leone*
Chad Lebanon Somalia
Comoros Liberia* South Sudan*
Côte d’Ivoire* Libya Sudan
Democratic Republic of the Congo Madagascar* Syria
Guatemala* Mali* Uganda*
Guinea* Myanmar Yemen
Guinea-Bissau Nepal*
Haiti Niger
15MEASURING PEACEBUILDING COST-EFFECTIVENESS

FINDINGS
This section summarises the findings from the coding
exercise of the OECD DAC CRS database for the donor side
expenditures as well as the findings from a coding exercise
of 15 domestic budgets. Debt relief, while performing
an important supporting function to development and
peacebuilding, is shown as a separate line item as it does not
represent programmatic actions of a comparable nature to
other development initiatives.
According to the OECD, net disbursements of ODA from
DAC members totalled US$135.1 billion in 2013 constant
US dollars. This is the commonly reported figure used to
summarise the size of ODA flows whereas the numbers
presented in this paper are on gross disbursements, which
allow for deeper disaggregation of the CRS codes.9
The 66 percent increase in ODA in real terms since 200010
demonstrates the notable impact of the Millennium
Development Goals (MDGs) in encouraging greater global
commitment to development. In highlighting this, it is also
important to note that total ODA as a percentage of global
national income (GNI) is at 0.29 with the very great majority
of developed countries in the world not currently reaching
the 0.7 percent of GNI target.
ANALYSING DONOR PEACEBUILDING EXPENDITURES
In the 31 conflict-affected countries where peacebuilding
expenditures are more critical, several important findings
can be noted. Conflict-affected countries do not represent
the main beneficiaries of development assistance as in 2013
they received only slightly more than 24 percent of total
ODA, or US$41 billion. As shown in figure 2.1, these countries
received US$6.8 billion for peacebuilding activities, which
represents 16 percent of their total gross ODA allocation.
Figure 2.2 shows the trend of peacebuilding as a proportion
of ODA for the 31 conflict-affected countries only. It
highlights that peacebuilding related expenditures for
conflict-affected countries is slightly increasing. It should
be noted debt relief has accounted for a very significant
proportion of total ODA in the conflict-affected countries.
However, these average numbers do not show the great
variation in the yearly size of peacebuilding investments
amongst conflict-affected countries.
In 2009, peacebuilding reached 19.2 percent of total ODA.
While peacebuilding expenditures appear to have remained
fairly constant in relative terms from 2010 to 2012, this does
not show the very large skew toward Afghanistan which had
its peacebuilding expenditure grow by 230 percent between
2005 and 2013, whereas during the same time period,
peacebuilding for the remaining 30 conflict-affected countries
experienced three consecutive years of contraction. This is
suggestive of Afghanistan’s peacebuilding expenditures in
effect hollowing out peacebuilding expenditure on the rest of
the world’s 30 conflict-affected countries.
Other ODA
PeacebuildingODA
69%
16%
Debt relief
15%
FIGURE 2.1 PEACEBUILDING EXPENDITURES VERSUS TOTAL ODA,DEBT RELIEF INCLUDED, 31 CONFLICT-AFFECTED COUNTRIES ONLY, 2013
Of the US$41 billion of ODA directed to conflict-a�ected countries, 16 percent is peacebuilding related.
16MEASURING PEACEBUILDING COST-EFFECTIVENESS

COMPOSITION OF PEACEBUILDING: DONORS AND RECIPIENTS
Looking at the composition of ODA can reveal donor
priorities and how they relate to peacebuilding. Figure 2.3
shows the total ODA given to conflict-affected countries
over twelve years from the ten largest donors of the 29
DAC members. In outright terms, the US commits the most
resources to peacebuilding followed by the International
Development Association (IDA, World Bank) and EU
Institutions. In proportional terms, the UK, US and Norway
commit the largest sum toward peacebuilding at 24, 23 and
21 percent, respectively. France and Japan conversely spend
only three and six percent, respectively, of their development
budgets on peacebuilding.
Figure 2.4 shows the ten largest recipients of the 31 conflict-
affected countries over the last twelve years. They are
representative to the extent that they attracted 71 percent
of total ODA disbursements to this grouping of countries
over the 2002-2013 period. Iraq and Afghanistan accounted
for the majority of peacebuilding expenditure over the 12-
year period and that peacebuilding was in fact a notable
proportion of their respective total ODA during the period at
18 and 31 percent, respectively.
0
10
20
30
40
50
2002 2003 2004 2005 2006 2007 2008 2009 2010 2011 2012 2013
GRO
SS D
ISBU
RSEM
ENTS
(US$
BIL
LIO
NS)
Other ODA Debt Relief Peacebuilding ODA
75% 53%71%
46% 48% 62%62% 66% 65% 67% 66%
69%
13%
36% 14%
40% 42%
23%
23%14%
18% 15% 17%
15%
11%
11% 14%
14%11%
15%
14% 19%17% 18% 17%
16%
FIGURE 2.2 PEACEBUILDING CATEGORIES VERSUS TOTAL ODA, DEBT RELIEF INCLUDED, 31 CONFLICT-AFFECTED COUNTRIES, 2002-2013
The highest peacebuilding expenditures have reached as a proportion of total ODA for the 31 conflict-a�ected countries is 19 percent of the total in 2009.
2010 30 50 70 900 40 60 80 100 110 120
United StatesIDA
EU Institutions Japan
France Germany
United Kingdom Norway
Australia Canada
GROSS DISBURSEMENTS (US$ BILLIONS)
Peacebuilding Other ODA Debt Relief
FIGURE 2.3 TEN LARGEST ODA DONORS, TOTAL ODA, 2002-2013
The ten largest donors constitute 75 percent of total ODA disbursements over the last twelve years.
17MEASURING PEACEBUILDING COST-EFFECTIVENESS

ALLOCATION TO PEACEBUILDING CATEGORIES
Furthermore, when looking at the composition of global
peacebuilding expenditures, they are also highly uneven
within the 16 selected categories (based on the OECD CRS
classification). The two largest categories (15130, legal and
judicial development; and 15110, public sector policy and
administrative management) account for almost half of total
peacebuilding to conflict-affected states in 2013. This is true
not just for 2013, but to the recent history of ODA, as can be
seen in table 2.2. Those two categories account for 48 percent
of the total peacebuilding over the 12-year period 2002 to 2013.
It is worth noting category 15220, the only category that
explicitly refers to peacebuilding (civilian peace-building,
conflict prevention and resolution) has received notable
funding in some years and is the third largest category at
12.3 percent of the total. In terms of donors, the notable
donors for 15220 were the US, Germany, the U.K., Norway,
Sweden, Switzerland and Denmark.
GROSS DISBURSEMENTS (US$ BILLIONS)
Peacebuilding Other ODA Debt Relief
IraqAfghanistan
D.R.C.*Uganda
West Bank & Gaza StripSudan
Côte d'IvoireMaliHaiti
Madagascar
0 10 20 30 40 50 60 70 80
*Democratic Republic of the Congo
FIGURE 2.4 TEN LARGEST ODA RECIPIENTS OUT OF THE 31 CONFLICT-AFFECTED COUNTRIES, 2002-2013
Iraq and Afghanistan account for 18 and 31 percent, respectively, of total peacebuilding expenditures to the 31 conflict-a�ected countries over the 2002 to 2013 period.
TABLE 2.2 CRS CATEGORIES IDENTIFIED AS PEACEBUILDING
CODE OECD CRS CATEGORY TOTAL 2002-2013 (US$ MILLIONS) PERCENTAGE
15110 Public sector policy and administrative management 19,164 31.70
15130 Legal and judicial development 9,738 16.10
15220 Civilian peacebuilding, conflict prevention and resolution 7,418 12.30
15111 Public finance management 4,725 7.80
15150 Democratic participation and civil society 4,522 7.50
15210 Security system management and reform 3,755 6.20
15230 Participation in international peacekeeping operations 2,769 4.60
15112 Decentralization and support to subnational government 2,652 4.40
15160 Human rights 1,787 3.00
15250 Removal of land mines and explosive remnants of war 1,272 2.10
15170 Women’s equality organisations and institutions 731 1.20
15240 Reintegration and SALW control 673 1.10
15153 Media and free flow of information 495 0.80
15152 Legislatures and political parties 284 0.50
15113 Anti-corruption organisations and institutions 272 0.50
15261 Child soldiers (prevention and demobilization) 128 0.20
TOTAL 60,384 100
18MEASURING PEACEBUILDING COST-EFFECTIVENESS

Peacebuilding categories are large when compared to other
forms of development assistance within conflict-affected
countries, as Figure 2.5 shows. There are three categories,
highlighted in green, that are peacebuilding categories
making up the top ten types of ODA. This figure takes the
12-year average, ironing out the large year-to-year differences
that occur in aid flows.
COMPARING DONOR PEACEBUILDING EXPENDITURES
Comparatively, peacebuilding
expenditures of US$6.8 billion were
dwarfed by the cost of conflict, which
amounted to US$817 billion in 2013,
as show in figure 2.6. Peacebuilding
expenditures were equivalent to 0.83
percent of the yearly direct economic
losses from conflict in 2013. However,
by this calculation, peacebuilding
was approximately equivalent to
peacekeeping spending for 2013,
underlining the need to better itemise
and understand the composition of
peacebuilding expenditures.
0 20 40 60 80 100
60020: Debt forgiveness
72010: Material relief assistance and services
15110: Public sector policy and adm. management
72040: Emergency food aid
51010: General budget support-related aid
21020: Road transport
15130: Legal and judicial development
43010: Multisector aid
Primary education11220:
15220: Civilian peace-building, conflict prevention and resolution
DISBURSEMENTS (US$ BILLIONS)
FIGURE 2.5 TEN LARGEST ODA CATEGORIES WITHIN THE CONFLICT-AFFECTED COUNTRIES, GROSS DISBURSEMENTS IN 2013 US DOLLARS, 2002–2013
Three peacebuilding categories highlighted in green are amongst the largest categories of development aid.
0
100
200
300
400
500
600
700
800
900 817
Economic lossesfrom conflict in 2013
GLO
BAL
VA
LUE
IN 2
013
(20
13 $
US
BILL
ION
)
167
Total ODA,Gros Disbursements
6.8Peacebuilding to
31 conflict-a�ected countries
7Total
Peacekeeping
FIGURE 2.6 WORLDWIDE LOSSES FROM CRIME, INTERPERSONAL VIOLENCE, CONFLICT VS TOTAL ODA AND PEACEBUILDING EXPENDITURES IN BILLIONS US DOLLARS, 2013.
Global peacebuilding expenditure is dwarfed by the direct economic losses from conflict. This suggests the current theoretical spending on prevention is less than one percent of the cost of the consequences of conflict.
19MEASURING PEACEBUILDING COST-EFFECTIVENESS

ANALYSING DOMESTIC PEACEBUILDING EXPENDITURES
This section presents the results of a coding exercise to
assess the domestically funded peacebuilding expenditures
that priority countries undertook in the most recent year. As
discussed in the methodology section, it covers 15 countries
and 16 categories of peacebuilding. These categories were
created during the coding process and aggregated by IEP
researchers. Numbers presented are at best exclusive of
donor peacebuilding in order to avoid double counting and
have also been converted from the local currency into 2013
PPP dollars.
Given this is representative of only half of the 31 conflict-
affected countries it cannot be taken as a conclusive
summary of the propensity for conflict-affected states to
fund their own peacebuilding activities. However, 15 country
budgets are a good indicative sample, highlighting some
interesting variations between countries. The categories for
domestic expenditure were selected as they are comparable
across the different countries. There are other categories
that were not included even though they would be relevant
to peacebuilding, such as the rule of law, as comparable
numbers could not be determined. The methodology section
of this report also highlights other important aspects and
constraints of counting these expenditures.
Figure 2.7 shows that peacebuilding averaged around four
percent of domestic government budget expenditure for the
15 countries identified; noting that headline domestic budget
figures are estimated for Madagascar. Liberia is the clear
outlier, spending over 16 percent of its budget on peacebuilding
and within that a big portion on the maintenance of parliament,
which could simply reflect one-off capital expenditures.
Figure 2.8 shows total domestic peacebuilding expenditure
for 11 of the 17 categories11 for the selected 15 conflict-affected
countries. While the results are somewhat skewed by outliers
like Liberia, which spent a lot on maintenance of parliament in
2014, a large portion of domestic expenditures in the conflict-
affected states goes into maintaining democratic institutions,
with the top four categories on maintaining parliament, funding
electoral commissions, supporting attorney general and judicial
functions and the legislature and political parties. Table 2.3
shows the full results of domestic peacebuilding expenditure
counting exercise in 2013 US dollars.
0.1%*0.4%0.7%0.9%
1.0%2.0%2.1%2.4%2.7%
4.1%4.3%
5.7%6.0%
8.1%16.4%
0% 5% 10% 15% 20%
Madagascar
Guatemala
Sierra Leone
Nepal
Mali
South Sudan
Papua New Guinea
Burundi
Kosovo
Uganda
Guinea-Bissau
Congo, DRC
Afghanistan
Cote d'Ivoire
Liberia
PEACEBUILDING EXPENDITURE AS % OF DOMESTICBUDGET, LATEST AVAILABLE YEARS FROM 2012–2015
FIGURE 2.7 TOTAL DOMESTIC PEACEBUILDING EXPENDITURE BY CATEGORY FOR 15 CONFLICT-AFFECTED COUNTRIES IN MILLIONS OF 2013 US DOLLARS
A large portion of domestic expenditures in conflict-a�ected states goes to maintaining democratic institutions.
*The domestic budget figures for Madagascar is an estimate only.
Peacebuilding expenditures of US$6.8 billion were dwarfed by the cost of conflict, which amounted to US$817 billion in 2013.
20MEASURING PEACEBUILDING COST-EFFECTIVENESS

TABLE 2.3 DOMESTIC PEACEBUILDING EXPENDITURE IN MILLIONS OF 2013 US PPP AND 2013 CONSTANT US DOLLARS
COUNTRY DOMESTIC PEACE-BUILDING PPP
TOTAL DOMESTIC BUDGET PPP
DONOR PEACE-BUILDING 2013 PPP
DONOR PEACE-BUILDING 2013 US$
Afghanistan 408 6,853.50 5,551.60 1,896.40
Burundi 29 1,188.40 275.6 95.4
Côte d’Ivoire 58.8 723.2 127.8 61
Democratic Republic of the Congo 696.6 12,300.60 493.4 293.4
Guatemala 95.6 24,361.00 524.8 250.4
Guinea-Bissau 18.7 437.3 24.1 9.5
Kosovo 108.5 3,970.80 814.7 356.2
Liberia 102.8 625 127.9 68.7
Mali 41.1 3,977.30 354.2 156.7
Nepal 163.5 17,267.40 524.8 161.9
Papua New Guinea 148.4 7,166.80 197.4 157.3
Sierra Leone 11.9 1,738.40 108.1 45.4
South Sudan 92.8 4,723.20 473.6 243.8
Uganda 338 8,172.10 459.9 180.6
Madagascar 5.9 3,970.40 71.9 23.6
231212172025
6981
175707
0 100 200 300 400 500 600 700 800
Reintegration and SALW control (1.2)
Civilian peace-building, conflict prevention and resolution (2.8)
Security system management and reform (1.1)
Women's equality organisations and institutions (2.7)
Human rights (2.6)
Anti-corruption organisations and institutions (2.3)
Democratic participation and civil society (2.4)
Public sector policy and administrative management (3.1)
Specific peace-related expenses
Legal and judicial development (2.1)
Legislature and political parties (2.2)
CONSTANT (2013) MILLIONS US$
FIGURE 2.8 TOTAL DOMESTIC PEACEBUILDING EXPENDITURE BY CATEGORY FOR 15 CONFLICT-AFFECTED COUNTRIES IN MILLIONS OF 2013 US DOLLARS
A large portion of domestic expenditures in conflict-a�ected states goes to maintaining democratic institutions.
21MEASURING PEACEBUILDING COST-EFFECTIVENESS

CASE STUDY: HISTORY OF PEACEBUILDING EXPENDITURES IN RWANDA
3
KEY FINDINGS
j US$18.35 billion dollars was committed to peacebuilding ODA in Rwanda from 1995 to 2014. That means peacebuilding in Rwanda cost the international community at least $27 per capita each year for the past 15 years.12
j Of that US$18.35 billion, only three percent was allocated to programs in the Basic Safety and Security domain with the majority of expenditure going towards building inclusive political processes and strengthening core government functions in the wake of the genocide. It should be noted this figure of course does not include the costs of the peacekeeping mission in the immediate aftermath of the genocide.
j Peacebuilding assistance immediately after the genocide did not increase for five years and it was only until after the introduction of the Vision 2020 plan that peacebuilding expenditures alongside other development
aid significant increase in Rwanda. Since then peacebuilding expenditure has continually increased over the past 15 years.
j The data on peacebuilding on Rwanda illustrates that the categories of assistance associated with peacebuilding are not exhausted in the five or even ten years following a conflict, meaning that the success of peacebuilding cannot be judged on whether there has been a relapse into a conflict after such a short period of time has elapsed.
j If one assumes that peacebuilding ODA leads to a reduction in violence, and if Rwanda is illustrative of the levels of peacebuilding required to reduce violent conflict, then the levels of global peacebuilding expenditure is insufficient to build global peace.
22MEASURING PEACEBUILDING COST-EFFECTIVENESS

CASE STUDY:HISTORY OF PEACEBUILDINGEXPENDITURES IN RWANDA
KEY FINDINGS
INTRODUCTION
This section of the report focuses on peacebuilding ODA
(as defined by IEP’s peacebuilding framework) in Rwanda,
from 1995 to 2014. Rwanda serves as an important example
of this peacebuilding framework for two reasons: firstly, it
provides a real world example over a suitable time frame
of how peacebuilding assistance was assigned to different
domains and categories. This allows for the exploration of
this data, in order to see whether any patterns or clusters
of findings emerge that might be classified as a distinct
peacebuilding ‘strategy’. Secondly, as Rwanda is perhaps
the most prominent example of successful peacebuilding,
notwithstanding the nature of its existing fragilities,
looking at the cost of peacebuilding in Rwanda can serve
as the basis for estimating the cost of future peacebuilding
efforts in other post-conflict countries. To that end, this
section looks at the overall cost of peacebuilding in Rwanda
over the last twenty years, as well as examining specific
peacebuilding projects in each peacebuilding domain. One
important limitation to this study is the lack of domestic
peacebuilding data from the Rwandan budget which means
domestically funded peacebuilding activities may not be
fully accounted for in the analysis.
PEACEBUILDING IN RWANDA
The nature and depth of ethnic divisions in Rwanda in
the wake of the genocide meant that there was significant
overlap between state building and peacebuilding. State
building efforts by the new government focused heavily on
peacebuilding categories, such as civilian peacebuilding
and conflict prevention and resolution, situating them in
a larger development strategy rather than specifically as
peacebuilding. There has been no explicitly articulated
national peacebuilding strategy in Rwanda following the
genocide in 1994,13 however peacebuilding processes and
objectives have been mainstreamed within development
efforts and aid coordination as a whole.14 Rwandan
authorities emphasise strong local ownership and the
government is the one that draws up the rules both
for cooperation and for different funding initiatives.15
Peacebuilding efforts have been driven through the
Government of Rwanda’s (henceforth GoR) developmental
strategy, Vision 2020. The central role the GoR has played
in directing peacebuilding is one of the factors that have
enabled a successful development trajectory and enabled
the government to work alongside donors to achieve
development and peacebuilding targets.
Peacebuilding
expenditure in Rwanda
in the period 1995-2014
totalled US$18.357
billion. Utilising the
domains that were
established in section
one of this report,
peacebuilding has been
broken down into its
three core domains:
Basic Safety and Security,
Inclusive Political
Processes, and Core
Government Functions.
Figure 3.1 shows total
0
500
1000
1500
2000
2500
3000
1995 1997 1999 2001 2003 2005 2007 2009 2011 2013
CO
NST
AN
T 20
14 U
S$ (M
ILLI
ON
S)
FIGURE 3.1 TOTAL PEACEBUILDING ODA COMMITMENTS, RWANDA (1995-2014)
Peacebuilding commitments have increased steadily in Rwanda over the two decades since the end of the genocide.
23MEASURING PEACEBUILDING COST-EFFECTIVENESS

peacebuilding expenditure in all domains from 1995 -2014.16
There has been a 688 percent increase in expenditure from
1995-2014 with spending going from US$337 million in 1995,
to US$2,654 million in 2014.
It is interesting to note that peacebuilding assistance
was neither front-loaded nor stable over time, and in fact
increased more or less consistently over the 20 year period
in question. Most notably, peacebuilding assistance in the
immediate aftermath of the conflict did not increase for
five years.
Peacebuilding expenditure in each domain was unbalanced,
as demonstrated in figure 3.2. Only three percent of
peacebuilding went into domain one, Basic Safety and
Security; 37 percent into domain two, Inclusive Political
Processes; and 60 percent going into domain three, Core
Government Functions. This perhaps reflects the nature
of the violence in Rwanda and the fact programmatic
actions toward security system management and reform,
reintegration and SALW control, removal of land mines and
explosive remnants of war, child soldiers (Prevention and
demobilization) were less critical than the peacebuilding
activities related to inclusive political processes and building
core government functions.
Figure 3.3 highlights the trends in each domain over time.
In the period immediately following the genocide spending
remained relatively stable. It is in 1999-2000, the same time
that Paul Kagame became President and Vision 2020 came
into effect, that funding began to increase and fluctuate
especially in the categories of peacebuilding related to
inclusive political processes and building of core government
functions. Figure 3.3 makes clear that the provision of
basic safety and security peacebuilding assistance was
considerably lower than for the other two domains, even
in the immediate post-conflict environment. This may be
entirely explainable for a range of reasons such as the fact
much of this activity may be inherently less expensive to run,
or because the nature of the conflict in Rwanda meant that
many programs associated with domain one peacebuilding
(demining etc.) were not applicable to the conflict situation.
The peacekeeping mission, UNAMIR was also present in the
country up until 1996. Further research from IEP will aim
to assess the pattern of peacebuilding expenditures in other
post-conflict environments.
Basic Safety and Security
Inclusive Political Processes
Core Government Functions
0
200
400
600
800
1000
1200
1400
1600
1800
2000
1995 1997 1999 2001 2003 2005 2007 2009 2011 2013
CO
NST
AN
T 20
14 U
S$ (M
ILLI
ON
S)
FIGURE 3.3 TOTAL PEACEBUILDING ODA COMMITMENTS, RWANDA (1995-2014)
Only three percent of peacebuilding ODA went to the Basic Safety and Security domain.
Basic Safety & Security
3%
Inclusive Political Processes
37% Core Government Functions
60%
FIGURE 3.2 PEACEBUILDING COMMITMENTS BY DOMAIN, % OF TOTAL, RWANDA (1995-2014)
Only three percent of peacebuilding ODA went to the Basic Safety and Security domain.
24MEASURING PEACEBUILDING COST-EFFECTIVENESS

DOMAIN 1: BASIC SAFETY & SECURITY
0
20
40
60
80
100
120
140
160
180
200
1995-1999 2000-2004 2005-2009 2010-2014
CO
NST
AN
T 20
14 U
S$ (M
ILLI
ON
S)
Security system management and reformRemoval of land mines and explosive remnants of war
Participation in international peacekeeping operationsReintegration and SALW control
FIGURE 3.4 TREND IN PEACEBUILDING COMMITMENTS BY DOMAIN, RWANDA (1995-2014)
There has been a significant increase in Core Government Functions peacebuilding ODA since the turn of the century.
Domain one, Basic Safety and Security
received the least amount of funding
between 1995 and 2014, totally only three
percent of all peacebuilding expenditure
in Rwanda. Of this three percent, 43
percent of total domain one expenditure
went into category 1.2: Reintegration and
small arms and light weapons control. The
objective of disarmament, demobilisation
and reintegration (DDR) is to contribute
to “security and stability in post-conflict
environments so that recovery and
development can begin”.17 This was clearly
a major focus for the country not just in the
immediate post-genocide period, but even
more recently in the 2010 to 2014 period.
Another 42 percent of domain one spending
went into category 1.5: Participation in
international peacekeeping operations
which reflects programmatic activities
related to support for peacekeeping rather
than an extant mission in the country itself.
This category of spending would be more
prevalent following the end of an armed
conflict or civil conflict between different
non-state actors. In Rwanda however, in
the immediate five years following the
genocide, spending was concentrated in two
particular categories: 2.1, legal and judicial
development and 3.1 public sector policy and
administrative management. This reflects
the way the Rwandan Patriotic Front (RPF)
took control of the country in 1994, and
focused efforts on bringing perpetrators
of the genocide to justice and establishing
institutions to consolidate their government.
AN EXAMPLE OF BASIC SAFETY & SECURITY PEACEBUILDING PROGRAM: THE RWANDA DEMOBILISATION & REINTEGRATION COMMISSION (RDRC) — CATEGORY 1.2
The Rwanda Demobilisation and Reintegration Commission (RDRC) was
formed to put the country’s disarmament, demobilisation and reintegration
programme, Rwanda Demobilisation and Reintegration Programme (RDRP),
into effect.18 The GoR emphasised local ownership of the demobilisation
process, as it did across all areas of peacebuilding and development. It focuses
on the demobilisation and reintegration of ex-combatants, regardless of
previous military affiliation, and has occurred in three stages with various
donors and partners, including the International Development Association
(IDA).19 There was a large focus on providing ex-combatants with economic
prospects and they received vocational training, apprenticeship support,
literacy training and support for formal education.
The first stage went from 1997–2000, and 18,692 Ex-Rwanda Defence Force
members were demobilised. The first stage was financed by the government
in conjunction with various donors, however funding was cut short due to the
Rwandan governments involvement in the conflict in the Democratic Republic
of the Congo (DRC), and only US$8 million of the US$39 million that was
promised was received.20 Figure 3.5 illustrates this, with funding in 1997 and
1998 falling significantly. Based on these numbers the cost of demobilising
each solider in Rwanda was between US$428 to US$2,086 per soldier.
25MEASURING PEACEBUILDING COST-EFFECTIVENESS

DOMAIN 2: INCLUSIVE POLITICAL PROCESSES
Stage II of the RDRP went from 2001-2008 and demobilised 22,685 ex-combatants. Spikes in figure 3.5 in 2001 and 2004
were caused by the increase in category 1.2 spending. In 2004, spending reached US$81 million, up US$79 million from 2003.
RDRP Stage III commenced in 2009 and is ongoing, and has currently demobilised 3,910 ex-combatants. US$53 million went
to funding the process in 2009. The main aims for stage III are to maintain capacity and allow for the integration of processes
within the Economic and Development and Poverty Reduction Strategy (EDPRS) framework.
0
500
1000
1500
2000
1995-1999 2000-2004 2005-2009 2010-2014
CO
NST
AN
T 20
14 $
US
(MIL
LIO
NS)
Legal and judicial development Democratic participation and civil society Human rights Civilian peace-building, conflict prevention
and resolution Media and free flow of information
Women's equality organisations and institutions
Legislatures and political parties Anti-corruption organisations
and institutions
FIGURE 3.6 INCLUSIVE POLITICAL PROCESSES PEACEBUILDING ODA, RWANDA (1995-2014, 5 YEAR INCREMENTS)
ODA committed towards anti-corruption e�orts was a tiny fraction of Inclusive Political Processes ODA.
0
20
40
60
80
100
120
1995 1997 1999 2001 2003 2005 2007 2009 2011 2013
CO
NST
AN
T 20
14 $
US
(MIL
LIO
NS)
FIGURE 3.5 TOTAL BASIC SAFETY AND SECURITY PEACEBUILDING ODA, RWANDA (1995-2014)
There have been several spikes in Basic Safety and Security peacebuilding ODA from 1995 to 2014.
Domain two, or inclusive political
processes accounted for 37 percent of total
peacebuilding expenditure in Rwanda over
the period. Of that 37 percent, almost half
went into the legal and judicial development
category. Three categories accounted for
over 50 percent of domain two funding:
democratic participation and civil society,
human rights, and civilian peacebuilding.
The distribution of spending within domain
two is shown in figure 3.6.
26MEASURING PEACEBUILDING COST-EFFECTIVENESS

AN EXAMPLE OF INCLUSIVE POLITICAL PROCESSES PEACEBUILDING PROGRAM: RWANDA’S NATIONAL COURT SYSTEM AND THE GACACA COURTS — CATEGORY 2.1
0
50
100
150
200
250
300
350
400
1995 1997 1999 2001 2003 2005 2007 2009 2011 2013 CO
NST
AN
T 20
14 $
US
(MIL
LIO
NS)
FIGURE 3.7 PEACEBUILDING ODA COMMITTED TO LEGAL AND JUDICIAL DEVELOPMENT, RWANDA (1995-2014)
Peacebuilding ODA committed to legal and judicial development was most consistent from 2000 to 2010.
The national court system in Rwanda
that was already weak prior to 1994,
was left devastated not only physically
with the destruction of buildings and
infrastructure, but also through the
killings of judges and administrative
staff.21 In the period following the conflict,
Rwanda faced an overloaded judicial
system dealing with a high number of
genocide perpetrators, and was confronted
with multiple problems with the judiciary
system including a lack of qualified staff,
loss of archives, and a lack of working
materials and equipment.22 In order
to move forward, the GoR realised the
necessity of justice in order to provide
long-term peace and stability. Trials began
in the national court system under the
new legislation in December 1996 and
continued for over a decade. By mid-2006
the courts had tried approximately 10,000
genocide suspects.23
The immense number of those accused
of being involved in the genocide and
awaiting trial overstretched the domestic
justice system. In 2000, the Rwandan
government, with partners including
AEGIS trust, reintroduced ‘Gacaca’, a
traditional dispute resolution system that
can be traced back to the 15th Century
in Rwanda. The courts were an effort at
community-driven peacebuilding and
have been seen as laying the groundwork
for reconciliation, peace and unity. They
provided a means where victims could
learn the truth about what happened to
loved ones and for perpetrators of the
genocide to confess, show remorse and
seek forgiveness. There were more than
12,000 community based courts that held
approximately 1.2 million cases across
Rwanda. The courts closed officially on 4
May 2012. President Kagame stated the
cost of the courts was approximately $40
million, in contrast with the International
Criminal Tribunal for Rwanda (ICTR)
which cost approximately $1.7 billlion.
In 2003, President Kagame ordered
the provisional release of certain
categories of prisoners who, before
returning home, would spend
some time in solidarity camps
called ingando. The camps aimed
at re-educating detainees and
included teaching about justice
and reconciliation processes, and
community service tasks such as
building homes for survivors of the
genocide.24 Approximately 22,000
prisoners were released at this time;
the expenditure in category 2.1 from
2003 to 2004 dropped from US$168
million to US$29 million. Despite
this, in 2005 the International
Committee of the Red Cross
estimated that 89,000 people were
still being detained, many of whom
had been in prison for the better
part of a decade.25 An unexpected
result of the Gacaca process was
that it encouraged perpetrators to
confess and name accomplices, this
increased the number of people
tried under Gacaca to an estimated
1,000,000.26 This can be a reason
why funding was erratic until 2012
when the Gacaca process officially
came to a close.
In 2000, the Rwandan government, with partners including AEGIS trust, reintroduced ‘Gacaca’, a traditional dispute resolution system that can be traced back to the 15th Century in Rwanda.
27MEASURING PEACEBUILDING COST-EFFECTIVENESS
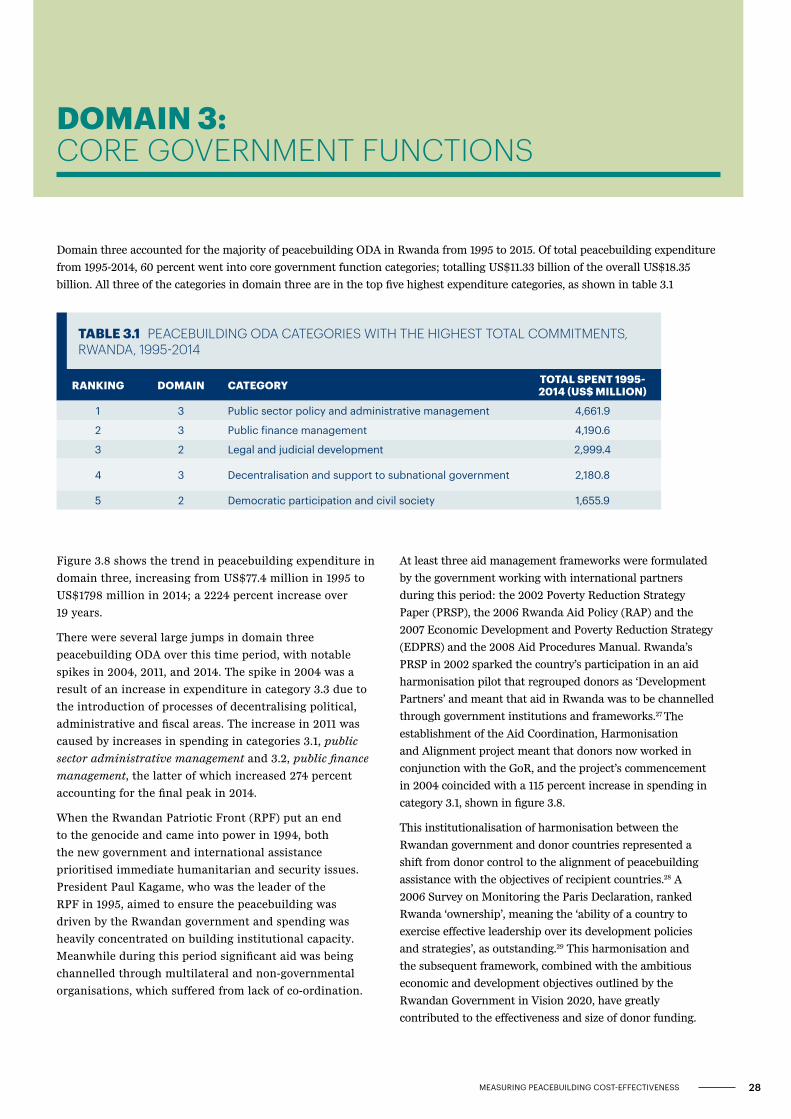
DOMAIN 3: CORE GOVERNMENT FUNCTIONS
Domain three accounted for the majority of peacebuilding ODA in Rwanda from 1995 to 2015. Of total peacebuilding expenditure
from 1995-2014, 60 percent went into core government function categories; totalling US$11.33 billion of the overall US$18.35
billion. All three of the categories in domain three are in the top five highest expenditure categories, as shown in table 3.1
TABLE 3.1 PEACEBUILDING ODA CATEGORIES WITH THE HIGHEST TOTAL COMMITMENTS, RWANDA, 1995-2014
RANKING DOMAIN CATEGORY TOTAL SPENT 1995-2014 (US$ MILLION)
1 3 Public sector policy and administrative management 4,661.9
2 3 Public finance management 4,190.6
3 2 Legal and judicial development 2,999.4
4 3 Decentralisation and support to subnational government 2,180.8
5 2 Democratic participation and civil society 1,655.9
Figure 3.8 shows the trend in peacebuilding expenditure in
domain three, increasing from US$77.4 million in 1995 to
US$1798 million in 2014; a 2224 percent increase over
19 years.
There were several large jumps in domain three
peacebuilding ODA over this time period, with notable
spikes in 2004, 2011, and 2014. The spike in 2004 was a
result of an increase in expenditure in category 3.3 due to
the introduction of processes of decentralising political,
administrative and fiscal areas. The increase in 2011 was
caused by increases in spending in categories 3.1, public
sector administrative management and 3.2, public finance
management, the latter of which increased 274 percent
accounting for the final peak in 2014.
When the Rwandan Patriotic Front (RPF) put an end
to the genocide and came into power in 1994, both
the new government and international assistance
prioritised immediate humanitarian and security issues.
President Paul Kagame, who was the leader of the
RPF in 1995, aimed to ensure the peacebuilding was
driven by the Rwandan government and spending was
heavily concentrated on building institutional capacity.
Meanwhile during this period significant aid was being
channelled through multilateral and non-governmental
organisations, which suffered from lack of co-ordination.
At least three aid management frameworks were formulated
by the government working with international partners
during this period: the 2002 Poverty Reduction Strategy
Paper (PRSP), the 2006 Rwanda Aid Policy (RAP) and the
2007 Economic Development and Poverty Reduction Strategy
(EDPRS) and the 2008 Aid Procedures Manual. Rwanda’s
PRSP in 2002 sparked the country’s participation in an aid
harmonisation pilot that regrouped donors as ‘Development
Partners’ and meant that aid in Rwanda was to be channelled
through government institutions and frameworks.27 The
establishment of the Aid Coordination, Harmonisation
and Alignment project meant that donors now worked in
conjunction with the GoR, and the project’s commencement
in 2004 coincided with a 115 percent increase in spending in
category 3.1, shown in figure 3.8.
This institutionalisation of harmonisation between the
Rwandan government and donor countries represented a
shift from donor control to the alignment of peacebuilding
assistance with the objectives of recipient countries.28 A
2006 Survey on Monitoring the Paris Declaration, ranked
Rwanda ‘ownership’, meaning the ‘ability of a country to
exercise effective leadership over its development policies
and strategies’, as outstanding.29 This harmonisation and
the subsequent framework, combined with the ambitious
economic and development objectives outlined by the
Rwandan Government in Vision 2020, have greatly
contributed to the effectiveness and size of donor funding.
28MEASURING PEACEBUILDING COST-EFFECTIVENESS

VISION 2020 — CATEGORY 3.1
Vision 2020 was the result of an extensive national
consultative process between 1997 and 2000, and was further
revised in 2012. While it was principally described as “an
ambitious plan to raise the people of Rwanda out of poverty
and transform the country into a middle-income economy”
by 2020, much of the plan involved activities in domain
three, building core government functions.30
The framework outlines six core pillars for Vision 2020:
Good governance and a capable state, human resource
development and a knowledge-based economy, private
sector-led development, infrastructure development,
productive high value and market oriented agriculture and
finally, regional and international integration. Reaching
the targets in these pillars requires spending in domain
three, and as Rwanda’s Vision 2020 outlines the country’s
development and peacebuilding trajectory, it explains how
core government functions received the most funding.
From 1999 to 2000, when Vision 2020 was released,
spending in category 3.1 increased from US$107 million to
US$409 million.
MINECOFIN — CATEGORY 3.2
The Ministry of Finance and Economic Planning
(MINECOFIN) was established in March 1997 by joining the
Ministry of Finance with the Ministry of Planning, and in
1999 also included the addition of development cooperation
from the Ministry of Foreign Affairs.31
The creation of MINECOFIN can be seen in the data, once
the institution was established in 1997, 1998 funding in
category 3.2 reached US$140 million, and then dropped to
US$20 million the following year. MINECOFIN’s mission is
to ‘raise sustainable growth, economic opportunities, and
living standards of all Rwandans’ and plays a central role in
aid coordination promoting and ensuring aid effectiveness.32
This illustrates a congruency that exists across government
institutions and frameworks like MINECOFIN and Vision
2020 that, along with the Government’s strong leadership,
have contributed to Rwanda’s peacebuilding success. As
to the broader distinction of such activities being defined
as peacebuilding, it is clear this peacebuilding framework
includes strong state building aspects which are critical to
supporting many of the other more immediate and core
peacebuilding activities directly related to the security
environment.
EXAMPLES OF CORE GOVERNMENT FUNCTIONS PEACEBUILDING PROGRAMS
0
200
400
600
800
1000
1200
1400
1600
1800
1995 1997 1999 2001 2003 2005 2007 2009 2011 2013
CO
NST
AN
T 20
14 $
US
(MIL
LIO
NS)
FIGURE 3.8 TOTAL CORE GOVERNMENT FUNCTIONS PEACEBUILDING ODA, RWANDA (1995-2014)
Core Government Functions peacebuilding ODA reached its highest ever levels in 2014.
29MEASURING PEACEBUILDING COST-EFFECTIVENESS
DECENTRALISATION & SUPPORT TO SUBNATIONAL GOVERNMENT — CATEGORY 3.3
The spike in 2000 shown in Figure 3.8 was a result of the
additional increase in spending to category 3.3 due to the
Government embarking on decentralization processes.
The process began with the adaptation of the national
decentralization policy that outlined the election of local
leaders.33
Further changes were made in 2006 as the government made
successful inroads in decentralization in all three areas:
administrative, fiscal and political, despite being traditionally
centralized.34
Rwanda has redesigned local administration and local
governments are now the main implementers of national
policies, in 2011-2012 they executed 25 percent of the
domestic budget.35
Decentralization in Rwanda has seen to foster both service
delivery and citizen participation and reconciliation,
particularly important in light of the post-1994 context.36
For example, Districts are financially and legally independent
and responsible for economic development and the provision
of services including: agriculture, tourism and small and
medium sized enterprise (SME), hospitals, water and
sanitation and schools.37
This is an important part of the country’s statebuilding and
peacebuilding outcomes.
SUMMARY
The data for peacebuilding ODA in Rwanda shows that
contrary to what might be expected in a post-conflict
environment, the majority of peacebuilding funding was not
allocated towards programs in the Basic Safety and Security
domain, but rather in the domains related to inclusive
political processes, and the provision of government services
and reform of government functions. Furthermore, the level
of peacebuilding assistance did not start high and then
taper off, nor did it remain consistent over time, but rather
actually increased steadily from 1995 to 2014.
This underlines some of the difficulty in trying to distinguish
peacebuilding from statebuilding, and from development
more generally, as those categories with more conceptual
overlap with state building and development tend on average
to be more likely to receive higher levels of funding. Finally,
there are those issues which are specific to the post-conflict
environment in Rwanda; the particular form that the
conflict took, potentially making domain one programs less
applicable, and given the focus on justice and reconciliation
in the wake of the genocide, resulting in domain two
programs being more heavily emphasised. There is also the
way in which the peacebuilding and development process
was spearheaded and directed by the GoR meaning that not
only did it take some time for peacebuilding to increase, but
that it continued to increase even 20 years after the conflict
had ended. This highlights the fact that any taxonomy
of peacebuilding cannot be divorced from definitional,
contextual, and political concerns.
Regardless of these issues, however, the data on peacebuilding
for Rwanda does illustrate that the categories of assistance
associated with peacebuilding are not exhausted in the five
or even ten years following a conflict, meaning that the
success of peacebuilding cannot be judged on whether there
has been a relapse into a conflict after such a short period
of time has elapsed. It also highlights the fact that, if the
assumption that peacebuilding ODA leads to a reduction in
violence is true, and if Rwanda is illustrative of the levels of
peacebuilding required to reduce violent conflict, then the
levels of peacebuilding currently seen around the world are
incommensurate with such a goal. This notion is explored in
more detail in the next section of this paper.
30MEASURING PEACEBUILDING COST-EFFECTIVENESS

A GLOBAL MODEL OF THE COST-EFFECTIVENESS OF PEACEBUILDING
4
KEY FINDINGS
j IEP has constructed a global model of peacebuilding cost-effectiveness that shows increased funding for peacebuilding would be hugely beneficial not only to peacebuilding outcomes but in terms of the potential economic returns to the global economy.
j Using 20 years of peacebuilding expenditure in Rwanda as a guide for establishing a unit cost, IEP estimates the cost-effectiveness ratio of peacebuilding at 1:16.
j This means that if countries currently in conflict increased their levels of peacebuilding funding to appropriate levels estimated by this model, then for every dollar invested now, the cost of conflict would be reduced by 16 dollars over the long run.
j The total peace dividend the international community would reap if it increased peacebuilding commitments over the next ten years from 2016 is US$2.94 trillion. Based on the assumptions in this model, the estimated level of peacebuilding assistance required to achieve this outcome would be more than double what is currently directed toward peacebuilding for the 31 most fragile and conflict affected nations of the world.
j While every such model may rely on important assumptions, robustness testing illustrates that even if these assumptions are changed and the unit cost of peacebuilding is increased to be made more expensive, peacebuilding is still overwhelmingly cost-effective.
31MEASURING PEACEBUILDING COST-EFFECTIVENESS

INTRODUCTION
The general purpose of cost-effectiveness analysis is to
compare two or more programs, actions, or items to see
which brings about the greatest impact per unit of spending.
It allows for policymakers to choose the appropriate mix of
programs that maximise the benefits of a given policy, while
also minimising costs.
Ultimately, measuring the cost-effectiveness of peacebuilding
would involve comparing different peacebuilding approaches,
strategies, or even individual programs to see which would
produce the greatest increase in peacefulness for the least
amount of money. However, as outlined in section one, being
able to compare specific programs across different countries
is a difficult, costly, and time-intensive process. The first step,
therefore, is to determine the general cost-effectiveness of
peacebuilding as an activity per se, that is, by determining
whether increasing peacebuilding funding would lead to
increased economic activity.
As the analysis in this section is focused on the global cost-
effectiveness of peacebuilding, it does not aim to compare
different peacebuilding programs or strategies, but rather
to compare the economic impact of greatly increasing
peacebuilding funding in conflict-affected areas today,
versus keeping peacebuilding funding at currently existing
levels. In order to construct such a model, it is necessary to
define and estimate a cost of conflict, that is, all economic
costs associated with ongoing conflict, such as battle deaths,
GDP losses, and so on. It is also necessary to outline a unit
cost of peacebuilding, which serves as an estimate of the
level of peacebuilding funding needed to reduce the cost of
conflict over some specified period of time. If the estimated
reduction in the cost of conflict is higher than the unit cost of
peacebuilding, then peacebuilding can be considered ‘cost-
effective’ over the long run.
Of course, any such model relies on a great deal of
assumptions. In this case, the model assumes that a unit
cost based on 20 years of peacebuilding data in Rwanda
is applicable to all conflict scenarios. It also assumes that
peacebuilding is the primary driver of conflict reduction,
and thus that increasing peacebuilding aid would necessarily
result in a fall in the cost of conflict. However, this paper
contends these assumptions are not unreasonable, that
they have been explained and defended elsewhere, and
furthermore that robustness testing illustrates that
even if these assumptions are changed and the unit
cost of peacebuilding is increased, peacebuilding is still
overwhelmingly cost-effective.
A MODEL OF PEACEBUILDING COST-EFFECTIVENESS
Peacebuilding involves a range of measures targeted to
reduce the risk of lapsing or relapsing into violent conflict
by strengthening national capacities and institutions at all
levels for conflict management, and to lay the foundations
for sustainable peace and development. It is distinct
from peacekeeping and peace-making activities, which
broadly involve the activities aimed at ending violence and
establishing security. The immediate cessation of conflict is
only the first step in building long-term peace.
The categories measured here and used in the model are
taken from the OECD DAC Creditor Reporting System,
and are summarised in table 1.1 on page 10, and described in
detail in Appendix A on page 50. The global model of
peacebuilding cost-effectiveness uses the same set of 31
countries outlined in section 2, table 2.1 on page 15.
The model estimates both a peace and war scenario using an
Auto-Regressive Integrated Moving Average (ARIMA)38 model
which forecasts future values using historical values of the
cost of conflict for each country. The model provides a range
of forecasts for the highest possible to the lowest possible cost
of conflict determined by the past data in the time series.
32MEASURING PEACEBUILDING COST-EFFECTIVENESS

ESTIMATING THE COST OF CONFLICT
Violent conflict leads to substantial economic costs for
a nation. It leads to the destruction of private property
and public infrastructure. Armed conflict affects business
activities by increasing risk and decreasing demand for
their products and services. It also causes the erosion of
state institutions in particular law enforcement and judicial
institutions. Conflict and fragility are usually associated
with lower income, higher poverty and economic stagnation.
Although it is not possible to fully account for all the costs
of conflict, it is possible to estimate the costs associated with
loss of life and infliction of trauma, population displacement,
terrorism, and the loss of economic activity.
The cost of conflict estimated in this study includes six
variables: costs associated with battle deaths and the
impact of terrorism (deaths, injuries, property destruction),
population displacement (internally displaced people and
refugees), and finally GDP losses from conflict. This model
uses a very conservative estimate of GDP losses from conflict
of two percent a year for each year of active and high
intensity conflict, although in many conflicts, GDP losses are
often much higher.
Many of the costs associated with violent conflict are based on
estimates from studies carried out in the US, or similar studies
carried out in a single country that have not been repeated
elsewhere. In order to adjust these estimates for every country
in the model, IEP uses a scaling system based on relative GDP
per capita (for example, if a country’s GDP per capita is 50
percent of US GDP per capita, the cost per homicide would be
50 percent of the US unit cost for homicide).
The economic costs associated with conflict deaths are based
on estimates of lost productivity and output over the life of
the person who has died. This cost is applied equally to both
battle deaths and victims of terrorism. Similarly, the cost
of violent assault is used as a proxy for the cost of injuries
caused by terrorism. The cost of population displacement
is estimated as the lost production and consumption to the
country of origin of each displaced person.
Figure 4.1 shows the trend in the cost of violence for the 31
conflict affected countries included in the model. These 31
countries are identical to those in section two of this report,
and can be found in table 2.1. The cost of conflict for these
countries has increased by over 2000 percent in constant
terms since 1995. The increase in 2011 coincides with the
increased violence due to the onset of the Syrian civil war and
the aftermath of the Arab spring.
0
50
100
150
200
250
1995 1997 1999 2001 2003 2005 2007 2009 2011 2013 2015
BILL
ION
CO
NST
AN
T U
S$
FIGURE 4.1 COST OF CONFLICT (1995-2015), 31 CONFLICT AFFECTED COUNTRIES, BILLIONS CONSTANT US$
The cost of conflict has increased dramatically since 2010, owing in large part to the Syrian civil war.
Conflict and fragility are usually associated with lower income, higher poverty and economic stagnation.
33MEASURING PEACEBUILDING COST-EFFECTIVENESS

BOX 1 METHODOLOGY AT A GLANCE
IEP’s model of peacebuilding cost-effectiveness is constructed using a 5 step process:
Step 1: IEP estimates the cost of conflict for the period of 1995-2015 using IEP’s cost of violence to the global economy methodology. The cost of conflict includes the cost of battle deaths, impact of terrorism, population displacement, and the adverse economic effects of war on the economy. Each of these components has a different type of cost associated with it: battle deaths lead to lost future economic activity from those killed, terrorist attacks lead to deaths but also property destruction, population displacement leads to reduced economic growth, and so on.
Step 2: IEP uses an ARIMA model to construct two scenarios based on the past 20 years of cost of conflict data: a peace scenario and a war scenario, where the war scenario provides an estimate of the cost of conflict if it continues to increase, whilst the peace scenario illustrates the cost of conflict where conflict drops to almost zero. Both scenarios show forecasts for every year up until 2025. The purpose of using an ARIMA model is to provide realistic forecasts of future costs of conflict, based on past levels of conflict.
Step 3: The benefits of peacebuilding (i.e. the peace dividend) is calculated as the difference in the cost of conflict between the peace and war scenarios. For example if the war scenario forecast cost of conflict in 2025 was 100, and the peace scenario was 10, then the peace dividend would be 90.
Step 4: IEP uses Rwanda as the baseline case to estimate the unit cost of successful peacebuilding. That is, the model assumes that the level of peacebuilding funding per capita required to achieve the peace scenario is the same as for Rwanda over the period 1995-2015. This allows IEP to estimate the current peacebuilding shortfall for each of the 31 conflict- affected countries included in the model.
Step 5: The cost-effectiveness ratio for each country is the ratio of the required increase in per capita peacebuilding to reach the same level as Rwanda, divided by the estimated peace dividend for that country. For the 31 conflict-affected countries as whole, the average of this ratio is 1:16, meaning that for every additional dollar spent on peacebuilding to reach the same levels of Rwanda, the future cost of conflict would be reduced by 16 dollars.
Violent deaths (battle deaths and deaths from terrorism)
account for the majority of the cost of conflict, amounting
to 63 percent of the total cost. Population displacement also
has a significant impact at 35.4 percent of the total cost of
conflict. Figure 4.2 shows the composition of the cost of
conflict.
This paper takes a conservative approach in estimating the
cost of conflict. It only includes variables for which reliable
data can be sourced. Therefore, a large number conflict
related costs are not included. For example, there is no
reliable data with good estimates on the number of injuries
from conflict (comparable to the injuries from terrorism
data) and so the costs associated with conflict casualties are
not included. Other categories of cost are inherently difficult
to quantify such as diminished financial flows such as ODA
where donors pull out in times of conflict, lower remittances
and Foreign Direct Investment (FDI) common during conflict.
The erosion of trust in formal and informal institutions has a
Other
0.3% GDP loss
from conflict
1.3%
Violent Deaths
63%
PopulationDisplacement
35.4%
FIGURE 4.2 THE COMPOSITION OF THE COST OF CONFLICT (2015)
Battle deaths and population displacement are the two largest categories of cost of conflict
34MEASURING PEACEBUILDING COST-EFFECTIVENESS

costly effect that takes years to restore to pre-war levels.
War diminishes the level of trust between communities
as well as trust in the state and its institutions. There are
enormous economic costs associated with these changes,
but they cannot be accurately quantified in a way that
is comparable between countries, and as such they are
excluded from the model.
Furthermore, conflicts often result in regional and even global
spill-over effects, leading to significant costs in countries
that border on the conflict region. Neighbouring countries
host refugees from the conflict which means increased
demand for public services. Instability also tends to spread
into neighbouring countries. Responding to transnational
terrorism at home and abroad also produces significant costs.
THE UNIT COST OF PEACEBUILDING
The literature on peacebuilding shows that many post-
conflict societies relapse into violent conflict within a decade.
As such, any approach to measuring the cost-effectiveness
of peacebuilding must incorporate a longer time frame;
an approach that relies on a five-year window is arguably
not a realistic model of the true costs associated with
successful peacebuilding. Although peacekeeping is usually
thought of as occurring only in the immediate post-conflict
environment, peacebuilding incorporates much longer term
institution building, capacity building, as well as long run
conflict de-escalation. IEP’s model of global peacebuilding
cost-effectiveness uses peacebuilding data from 1995 to 2015,
in order to get a more accurate estimation of the costs of
successful peacebuilding.
Estimating a unit cost of peacebuilding is difficult, as
there have been very few examples of successful long-term
peacebuilding strategies in the last 25 years, the period for
which detailed peacebuilding data is available. The IEP model
uses Rwanda over the period of 1995 to 2015 as an example of
‘successful’ peacebuilding, and thus as the basis for the unit
cost of peacebuilding for all countries in the model. Figure 4.3
highlights the fact that the cost of conflict has in fact fallen
significantly in Rwanda over the last twenty years. The spike
in 2009 was the result of battle deaths in the Democratic
Republic of the Congo, where Rwanda had committed troops.
Using peacebuilding commitment data over the last 20 years
for Rwanda, the unit cost of peacebuilding is derived. The
estimated unit cost is then used to approximate the level
of peacebuilding required in the 31 countries included. The
unit cost of conflict is taken to be the minimum per capita
commitment from 1995 to 2015, which is using the unit cost.
This paper estimates the cost of peacebuilding for the period
of 2016 to 2025. On average, an annual peacebuilding outlay
of US$18.1 billion is estimated for the 31 countries included in
the study.
Terrorism deaths Refugees and IDPs GDP losses Battle deaths
1995 1997 1999 2001 2003 2005 2007 2009 2011 2013 2015
0
300
200
100
400
500
700
600
1,000
900
800
MIL
LIO
N C
ON
STA
NT
US$
FIGURE 4.3 THE COST OF CONFLICT IN RWANDA (1995-2015)
Battle deaths and population displacement are the two largest categories of cost of conflict
35MEASURING PEACEBUILDING COST-EFFECTIVENESS

FORECASTING THE COST OF CONFLICT
To estimate the cost of conflict for both peace and war
scenarios, the paper uses an ARIMA model to forecast the
cost from 2016 to 2025. The ARIMA model provides a range
of possible estimates of the cost of conflict using historical
conflict data for each country. For the purposes of helping
to estimate the cost-effectiveness of conflict, three of these
estimates are highlighted in figure 4.4: a ‘war’ scenario which
represents the worst possible outcome, essentially a situation
in which conflicts in all 31 countries reignite or remain
unresolved, a ‘most likely’ scenario which represents the
most likely global cost of conflict, assuming no increases in
the current level of peacebuilding, and a ‘peace’ scenario, in
which the cost of conflict drops to its lowest probable level.
For the purposes of this analysis, the peace scenario assumes
that increasing peacebuilding expenditure will reduce the
cost of conflict over the long run, an assumption based on
existing research on the effectiveness of peacebuilding, but
also one that will be examined further as part of this research
program. Conversely, the war scenario assumes that without
an increase in peacebuilding assistance, the level of violent
conflict in each of the 31 countries will continue to grow.
300
200
100
400
500
BILL
ION
CO
NST
AN
T U
S$
Constant Conflict War Scenario Peace Scenario
0
1995 1997 1999 2001 2003 2005 2007 2009 2011 2013 2015 2017 2019 2021 2023 2025
FIGURE 4.4 THE PROJECTED COST OF CONFLICT FOR BOTH PEACE AND WAR SCENARIOS (1995-2025)
The cost of conflict could vary between the three scenarios presented in the graph. The peace scenario represents the greatest possible fall in the cost of conflict.
PEACE SCENARIO
In the peace scenario the model assumes that over time the
cost of conflict will diminish due to peacebuilding activities
leading to fewer conflict deaths and a fall in displacement, as
countries become more stable and begin to rebuild. However,
the decline in the cost of conflict is not achieved immediately
after an increase in peacebuilding. Varying levels of residual
violence that is directly related to the conflict persist in post
conflict societies. Therefore, the peace scenario includes
different levels of deteriorations in peace in post-conflict
violence for individual countries. The decline in the cost of
conflict also depends on the speed of recovery of government
institutions and the economy.
It is important to make a distinction here between the cost
of conflict and the cost of violence. The cost of conflict only
refers to violence and disruption that are caused by a given
conflict. However, the cost of violence is a broader term and
rises due to intentional violent acts such as violent assault
and homicide. As peacebuilding aims to mitigate risk factors
such as demobilisation and disarmament as well as aid the
development of law enforcement and judicial institutions,
the reduction in the cost of conflict is assumed to result
from peacebuilding. However, a fall in the cost of conflict
may not lead to a fall in the cost of violence. Therefore,
this paper uses the decline in the cost of conflict achieved
through the implementation of peacebuilding activities as the
effectiveness measure in the cost-effectiveness model, rather
than a fall in the total cost of violence.
36MEASURING PEACEBUILDING COST-EFFECTIVENESS

WAR SCENARIO
There is no guarantee that peacebuilding assistance at
current levels will lead to fall in violent conflict. Despite
peacebuilding and other preventative activities, war and
conflicts can persist. The ‘war’ scenario highlighted in figure
4.4 assumes that current levels of peacebuilding efforts will
be more or less completely ineffective, leading to an increase
in deaths from conflict, terrorism, GDP losses from conflict,
and so on.
ESTIMATING THE COST-EFFECTIVENESS OF PEACEBUILDING
Given the assumptions on the effectiveness of peacebuilding
outlined above, the model can now be used to estimate a
cost-effectiveness ratio for increased peacebuilding aid.
Admittedly, at this stage of the research program there
are a significant number of caveats attached to any such
estimate: that the level of violent conflict will get worse
without increased peacebuilding, and that the Rwandan
per capita average represents the optimal or even minimal
threshold necessary for reducing violent conflict. Therefore,
the following estimates should only be considered
broadly indicative of the possible benefits of increased
peacebuilding assistance.
The cost-effectiveness ratio is estimated using the peace
dividend and the estimates of the unit cost of peacebuilding
derived from the Rwanda case study. The total peace dividend
(the difference between the ‘war’ and ‘peace’ scenarios in
figure 4.4) over the ten years from 2016 is $2.94 trillion, while
the estimated level of peacebuilding assistance necessary to
achieve this peace dividend is $184 billion over ten years.
Therefore, each dollar invested in peacebuilding will lead to a
$16 decline in the cost of conflict, assuming that the $27 per
capita threshold is met for each country. Table 4.1 provides
annual cost of conflict for the peace and war scenario for the
period of 2016-2025.
There is no guarantee that peacebuilding assistance at current levels will lead to fall in violent conflict.
37MEASURING PEACEBUILDING COST-EFFECTIVENESS

TABLE 3.1 ESTIMATES OF THE COST OF CONFLICT, PEACEBUILDING, THE PEACE DIVIDEND AND THE COST-EFFECTIVENESS RATIO FOR 2016-2025Peace dividend and the cost-effectiveness ratio increases overtime as the cost of conflict falls in the peace scenario
YEARCOST OF CONFLICT PEACEBUILDING PEACE
DIVIDEND
WAR SCENARIO PEACE SCENARIO CURRENT
ESTIMATESAT THE RWANDA
RATE WAR — PEACE
SCENARIOS
2016 290,480 203,146 5,924 16,438 87,334
2017 324,975 148,968 6,043 16,848 176,007
2018 351,932 128,306 6,163 17,268 223,627
2019 375,024 112,577 6,287 17,695 262,448
2020 395,673 99,372 6,412 18,132 296,301
2021 414,602 87,766 6,541 18,574 326,836
2022 432,242 77,284 6,671 19,023 354,958
2023 448,871 67,644 6,805 19,475 381,227
2024 464,684 58,666 6,941 19,931 406,018
2025 479,816 50,222 7,080 20,392 429,594
TOTAL 3,978,301 1,033,951 64,867 183,778 2,944,350
Source: IEP COST-EFFECTIVENESS RATIO: 1:16
Compare this scenario with a counterfactual in which the
level of peacebuilding remains at current levels. In this
scenario, the cost of conflict is not reduced down to the
‘peace’ scenario, but rather follows the ‘most likely’ path
in figure 4.4. If this were to occur (the ratio of ‘most likely’
to ‘war’ scenarios) the fall in the cost of conflict would be
much smaller. In this scenario, the peace dividend would
be equivalent to US$91 billion, meaning that each dollar
invested in peacebuilding would only yield a return of a fall
of $1.60 in the cost of conflict.
The total peace dividend (the difference between the ‘war’ and ‘peace’ scenarios) over the ten years from 2016 is $2.94 trillion, while the estimated level of peacebuilding assistance necessary to achieve this peace dividend is $184 billion over ten years. Therefore, each dollar invested in peacebuilding will lead to a $16 decline in the cost of conflict, assuming that the $27 per capita threshold is met for each country.
38MEASURING PEACEBUILDING COST-EFFECTIVENESS
FUTURE RESEARCH
5
KEY FINDINGS
j At the global level, peacebuilding is overwhelmingly cost-effective. However, this doesn’t reveal anything about which types of peacebuilding which are most effective.
j IEP has outlined a research program for the short, medium, and long-term that becomes increasingly granular. Starting from the global level, it would gradually drill down to the project level in order to fully flesh-out the cost-effectiveness of different peacebuilding activities.
j The data generated in this first phase of research provides an extensive set of further options to model the statistical link between peacebuilding and conflict onset or lack thereof.
j These methodologies can be used to calculate and estimate the future peacebuilding needs that exist in particular countries.
39MEASURING PEACEBUILDING COST-EFFECTIVENESS

OVERVIEW
Elsewhere in this paper, IEP has tried to demonstrate
that peacebuilding activities can be suitably defined
and quantified in order to produce research on the cost-
effectiveness of peacebuilding. This definition has been
tested by looking at its application to the last two decades of
peacebuilding in Rwanda, and then applied globally.
This section also draws upon existing impact evaluations
in Liberia to demonstrate a basic approach to how the
cost-effectiveness of specific peacebuilding interventions
could be compared within a specific context. However,
this type of approach demonstrates the need for many
more impact evaluations that build the baseline data upon
which this approach can be tested. Currently there are only
approximately 61 impact evaluations on programmes with
related peacebuilding outcomes, future research will require
many more to advance knowledge of the cost-effectiveness of
particular peacebuilding programs.
The findings of this initial research find that peacebuilding
is overwhelmingly cost-effective at the global level, with
robustness testing suggesting that even if the model vastly
underestimated the level of peacebuilding funding required to
end conflict, it would still be a cost-effective way of reducing
the cost of conflict in the long run. However, such research,
while a necessary precursor to more granular analysis, reveals
nothing about which types of peacebuilding activity are
more cost-effective than others. The ultimate target remains
a body of research that can pinpoint the most cost-effective
peacebuilding interventions, equally applicable across all
countries and contexts.
Whether such a research outcome is possible or even feasible
remains to be seen. There has been an increasing focus by
the international community on measuring the effectiveness
of peacebuilding, however, some critiques suggest that a
quantitative, globally applicable model is undesirable and
counterproductive. Peacebuilding needs to be tailored to the
context and every context is different posing methodological
limitations on how generalizable findings in this field can
be. For this reason it is likely that a review of peacebuilding
effectiveness can only drill down so far before becoming
pointless, meaning that peacebuilding can only be assessed at
the strategic, rather than programmatic level.
In order to try and take these potential problems into
account, IEP has constructed a potential research program
that outlines short, medium, and long term research outputs,
each of which would become progressively more granular
in assessing peacebuilding effectiveness. Starting at the
global level, this program would first examine the causal link
between peacebuilding assistance and conflict reduction, then
look at comparisons between the 17 peacebuilding categories
identified by IEP, before ultimately drilling down to the
project level, with a focus on impact evaluation. The details of
each of these stages are outlined below.
SHORT TERM: STATISTICAL MODELLING AT THE GLOBAL LEVEL
The model of peacebuilding cost-effectiveness at the global
level, outlined in section three of this paper, takes as an
assumption that peacebuilding assistance is the primary
driver of reducing conflict in the long run. However, even
if this assumption is conceptually and instinctively sound,
it is not detailed enough to allow for discussion of the
average scope of conflict decrease, and whether different
peacebuilding funding strategies have a greater impact in
conflict reduction, and so on. Thus, the research question that
needs to be answered at this stage is:
DOES PEACEBUILDING EXPENDITURE REDUCE THE COST OF CONFLICT, AND IF SO, TO WHAT EXTENT?
At a global level we can attempt to answer this question with
statistical analysis. IEP has compiled a data set of the cost of
conflict and peacebuilding expenditures for 31 conflict affected
countries from 2002 to 2014. Figure 5.1 shows the log of the
cost of conflict by country over this time period, while figure
5.2 shows the log of peace building expenditures by country.
40MEASURING PEACEBUILDING COST-EFFECTIVENESS
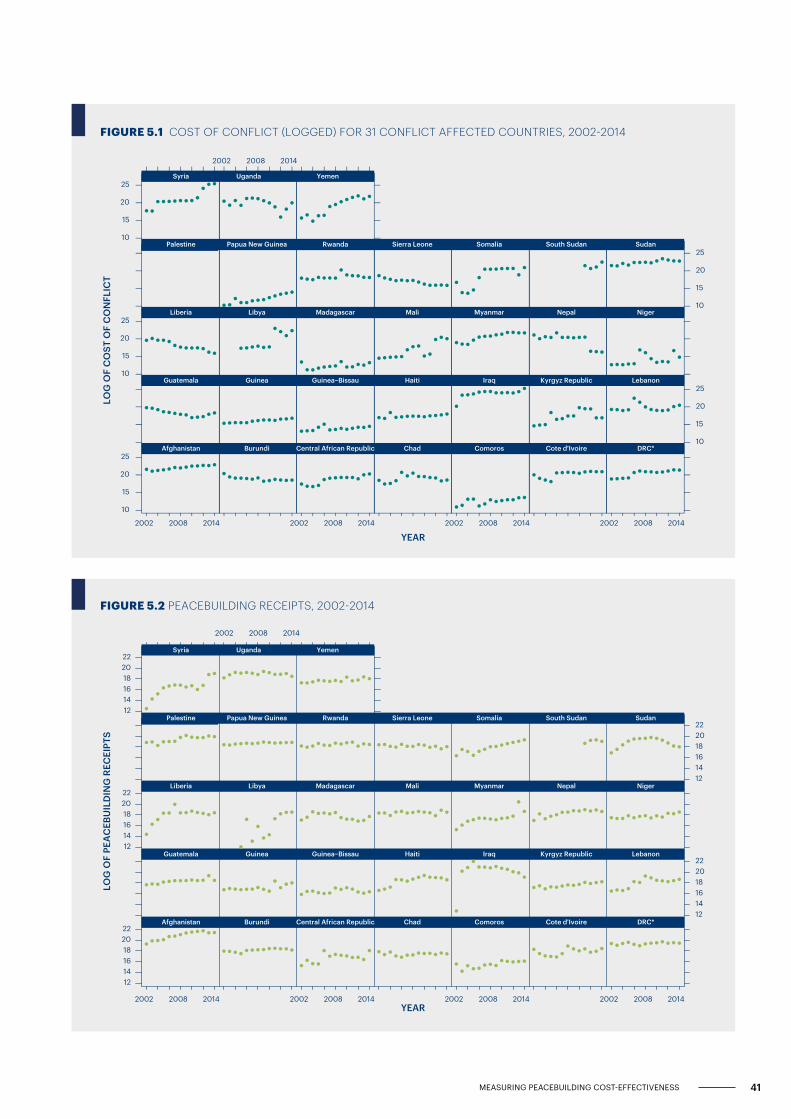
FIGURE 5.1 COST OF CONFLICT (LOGGED) FOR 31 CONFLICT AFFECTED COUNTRIES, 2002-2014
YEAR
LOG
OF
CO
ST O
F C
ON
FLIC
T
10
15
20
25
2002 2008 2014
Afghanistan Burundi
2002 2008 2014
Central African Republic Chad
2002 2008 2014
Comoros Cote d'Ivoire
2002 2008 2014
DRC*
Guatemala Guinea Guinea−Bissau Haiti Iraq Kyrgyz Republic
10
15
20
25Lebanon
10
15
20
25Liberia Libya Madagascar Mali Myanmar Nepal Niger
Palestine Papua New Guinea Rwanda Sierra Leone Somalia South Sudan
10
15
20
25Sudan
10
15
20
25Syria
2002 2008 2014
Uganda Yemen
FIGURE 5.2 PEACEBUILDING RECEIPTS, 2002-2014
YEAR
LOG
OF
PEA
CEB
UIL
DIN
G R
ECEI
PTS
121416182022
2002 2008 2014 2002 2008 2014 2002 2008 2014 2002 2008 2014
121416182022
121416182022
121416182022
121416182022
2002 2008 2014
Afghanistan Burundi Central African Republic Chad Comoros Cote d'Ivoire DRC*
Guatemala Guinea Guinea−Bissau Haiti Iraq Kyrgyz Republic Lebanon
Liberia Libya Madagascar Mali Myanmar Nepal Niger
Palestine Papua New Guinea Rwanda Sierra Leone Somalia South Sudan Sudan
Syria Uganda Yemen
41MEASURING PEACEBUILDING COST-EFFECTIVENESS

The expected relationship would be for peacebuilding
expenditure to reduce violence and thus the cost of conflict
tomorrow. At the most fundamental level we can test this
hypothesis using dynamic panel data regression of the
following basic form:
Where y, our dependent variable, is the cost of conflict
(logged), and x, our independent variable is peacebuilding
receipts (logged). We include a lagged level of the cost of
conflict (logged) as an independent variable. In the above
equation, i indexes country and t indexes time period.
To further this analysis, the literature on determinants of cost
of conflict could be assessed to determine relevant control
variables to include in the statistical model, and collect data
on these to include in the cost of conflict data set. This would
aim to incorporate important contextual factors like the state
of the political settlement and whether there is a viable peace
agreement in place. The model could be further refined by
expanding the selection of countries beyond those that are on
the UN’s list of 31 conflict affected countries.
The second stage of the short-term research agenda would
repeat the structure of the first, but the independent variables
would be disaggregated by peacebuilding domain (if not
by category, although it is likely a model with so many
independent variables would be too unwieldy to produce
useful results). This approach would allow for at least some
initial analysis of whether some peacebuilding areas or
strategies are more influential than others in reducing the
cost of conflict.
Another way in which IEP might seek to explore the
connection between peacebuilding ODA and conflict
would be to examine the lagged relationship between the
level of conflict and the level of peacebuilding ODA. The
preliminary results shown above in figure 5.3 tentatively
suggest a relationship between conflict and peacebuilding:
countries with a higher cost of conflict have higher levels of
peacebuilding ODA. Of course, such a relationship would be
expected inasmuch as countries with high levels of conflict
are better candidates for peacebuilding assistance. The
better question is whether peacebuilding ODA is effective
in reducing the level of violent conflict at some point in the
future. This approach could also be extended by attempting
to look for ‘thresholds’ of necessary peacebuilding, such that
violent conflict begins to recede once a level of assistance is
reached, but that there isn’t a linear relationship between
peacebuilding ODA and violent conflict reduction below
this threshold.
Figure 5.3 shows how cost of
conflict and peacebuilding
receipts are related (in a log-
log relationship to account for
outliers). It seems plausible that
there is a positive and linear
relationship between these two
variables.
LOG OF PEACEBUILDING RECEIPTS
LOG
OF
CO
ST O
F C
ON
FLIC
T
1e+06
1e+08
1e+10
1e+06 1e+07 1e+08 1e+09
FIGURE 5.3 COST OF CONFLICT AND PEACEBUILDING RECEIPTS, 31 CONFLICT AFFECTED COUNTRIES
42MEASURING PEACEBUILDING COST-EFFECTIVENESS

ADVANTAGES AND DRAWBACKS OF THIS APPROACH
Macro-level statistical analysis enables us to find general
patterns in data, and show correlational relationships
between variables of interest, in this case, the cost of conflict
and peacebuilding expenditure. Regression analysis cannot,
however, begin to answer the question of causality — at most
it can show a correlational relationship between variables of
interest. Moreover, nuances of individual country contexts get
lost in a global analysis. Furthermore, there may be so little
difference between the structure of peacebuilding aid between
countries (in terms of differences in domain expenditure),
that disaggregating these domains produces no meaningful
differences. The approach outlined above also cannot account
for dynamic effects, that is, the idea that there may be a
particular order to the structure of peacebuilding that is most
effective in reducing the cost of conflict. Finally, there is the
issue of the method in which peacebuilding ODA is delivered,
for example, whether it is distributed in partnership with the
national government, whether the country has the necessary
capacity to ensure it is used effectively, and so on. Specifying
a model that can take into account these factors would be the
most significant challenge at this phase of the research.
MEDIUM TERM: COST-EFFECTIVENESS ANALYSIS AT A MICRO-LEVEL
The second stage of the proposed research program, which
would take place over the medium term, would aim to take
the results of the first stage and further disaggregate them,
drilling down to the micro-level in order to compare the
effectiveness of specific peacebuilding programs. An example
of similar research is given below.
Peacebuilding activities come in many forms targeted at many
kinds of outcomes. A recent stocktaking exercise conducted
by 3ie in collaboration with Innovations for Poverty Action
has described the current state of impact evaluations of
peacebuilding activities aimed at one of five broad areas:
legislative politics, security, justice, economic foundations,
and revenues and social services39. These evaluations have
targeted different outcomes classified as targeting either the
individual level (for example, attitudes and knowledge), the
societal level (for example participation or social inclusion),
and the peacebuilding level (for example, interpersonal
conflict and violence).
Although the stocktake is not comprehensive, it provides a
structured way of thinking about impacts of peacebuilding,
and an avenue for trying to assess cost-effectiveness at a more
micro-level. See table 5.1 for the stocktaking map.
One research avenue would focus on a similar stock-taking
exercise of the cost-effectiveness of these completed impact
evaluations, in particular, programs that were aimed at
affecting peacebuilding outcomes (as opposed to individual or
societal level outcomes). For example, comparing the impact
on the cost of violence of a program on dispute resolution
versus a program on peace education and dialogue, both
of which are aimed at affecting violence outcomes. A close
collaboration with 3ie and/or IPA would be required to
access as much detail of each impact evaluation as possible,
including cost estimates for programs. Supposing cost of
programming data is available for the impact evaluations
carried out, IEP could compare the cost of implementation
per capita to the changes in cost of violence per capita
between baseline and end-line of evaluation.
IEP has a measure of cost of violence per country per year,
which can easily be broken down to a per capita basis. This
is an imperfect measure of the cost-effectiveness of program
outcomes which specify intergroup conflict, interpersonal
conflict and violence and crime and gang violence as specific
programmatic outcomes (it is difficult to disentangle the IEP
cost measure into these sub-components), nonetheless the IEP
measure would give an overall sense of the cost of all violence.
43MEASURING PEACEBUILDING COST-EFFECTIVENESS

TABLE 5.1 3IE/IPA STOCKTAKING MAP OF PEACEBUILDING IMPACT EVALUATIONS
PEACEBUILDING OUTCOMES
Domain Area
P1: Displacement & repatriation
P2: Intergroup
conflict
P3: Interpersonal
conflict & violence
P4: Crime & gang
violence
P5: Perceptions of safety or
security
LEG
ITIM
ATE
PO
LITI
CS
LP1: Demand-side governance and civil society 2 1
LP2: Support to peace processes and negotiation 1
LP3: Peace education or dialogue 1 3 2
LP4: Peace messaging and media-based interventions 1 2
LP5: Support for elections 1
SEC
UR
ITY
SS1: Security sector reform
SS2: Disarmament and demobilisation 1
SS3: Gender-based violence programmes 3
SS4: Community security and policing
SS5: Civilian police reform
SS6: Demining . .
JUST
ICE
J1: Capacity building and reform of justice institutions
J2: Dispute resolution 1 1
J3: Transitional justice .
J4: Reconciliation and services to victims .
J5: Human rights awareness and legal frameworks . . .
ECO
NO
MIC
FO
UN
DA
TIO
NS
EF1: Life skills and employment training 3 .
EF2: Jobs, cash-for-work, cash and in-kind transfers 2 4 .
EF3: Land reform .
EF4: Natural resource management .
EF5: Ex-combatant reintegration
REV
ENU
ES
AN
D S
OC
IAL
SERV
ICES
RSS1: Public sector governance capacity building and reform 1 1
RSS2: Provision of public services .
RSS3: Community-driven development and reconstruction 2 1 1
RSS4: Urban design for prevention of violence 1 1
44MEASURING PEACEBUILDING COST-EFFECTIVENESS

CASE STUDY: PEACEBUILDING IN LIBERIA
Liberia is a conflict affected country which has undergone
a slow but steady transition from a situation of civil war to
a situation of relative stability with democratic institutions.
Between 1989-96 and 1999-2003, two civil wars wracked the
country. After the last round of fighting ended in 2003, a lot
of money was poured into the country from international
donors in support of peacekeeping and peacebuilding. Figure
5.4 shows the cost of conflict per capita and the peacebuilding
expenditures per capita since 2002. The cost of conflict peaked
in 2003, the year that the second civil war officially ended,
while the peacebuilding expenditure peaked in 2007, four years
after the end of the conflict.
Liberia provided fertile ground for experimenting with
different kinds of peacebuilding activities, and the academic
community took an interest in trying to assess the impact
of particular activities on a range of individual, social and
peacebuilding outcomes including violence.
Two such peacebuilding projects are compared in terms of
their cost-effectiveness — as measured by the outcomes related
to violence, both programs were evaluated by randomized
control trial, and in both cases, by Professor Chris Blattman
from the University of Chicago.40
PEACEBUILDING PROGRAM ONE: AN EMPLOYMENT PROGRAM TO REDUCE LAWLESSNESS AND REBELLIONOne of the priorities for the Liberian government after
fighting ended was to ensure that ‘high-risk’ men would not
have incentives to re-engage in conflict or rebellion. By 2008,
the government estimated that about 9000 of these high-
risk men were living in remote hotspots which made them
susceptible to resource theft and rebellion. One of the highest
priorities for the government was thus to create economic
opportunity by creating stable jobs for high risk men.
In response to this situation, the non-profit Action on Armed
Violence (AOAV), in coordination with the government
of Liberia designed a four step program which included:
residential coursework and practical training in farming,
counselling and life-skills class, transport to the community
of their choice after graduation with access to farmland, and,
a two-stage package of tools tailored to the trainees interests.
The program was run in two counties — Bong County and
Sinoe County.
Limited funding available for the program meant that a
decision needed to be made as to the beneficiaries — an ideal
setting for a randomized control trial since assignment to
treatment could be randomized. The AOAV, in collaboration
with the team of researchers used this opportunity to test
the impact of such a program. Full details can be found in
Blattman and Annan 2015. The study sample included 1123
men, of which 1025 had end-line data available. The program
was run at an estimated cost of $1275 per person in 2009.
Baseline data was collected in 2009 prior to the beginning
of the program, and end-line data was collected in 2011 — 14
months after training.41 Between 2009 and 2011, the cost of
conflict in Liberia decreased from $9.82 per capita to $9.33
per capita, a reduction of five percent.
The economic impact of the intervention resulted in an
$11.82 increase in monthly wages for the treated men, which
is 11 percent of the program cost. The violence impact of
the program is measured by recruitment effects, which is
measured as the extent to which treated men were engaged
in any recruitment activity related to engaging in conflict in
neighbouring Cote d’Ivoire. The treatment effect here was 24
percent — i.e. treated men were 24 percent less likely to be
re-engaged in violent conflict.
If we assume propensity to re-engage in
conflict is directly proportional to the
cost of conflict (a very crude assumption),
then in the absence of the peacebuilding
program, the cost of violence would be 24
percent higher in 2011 than the actual level
in 2011, that is, the 2011 cost of conflict
per capita would be $11.57. Using the most
crude measure of cost-effectiveness, cost/
effectiveness, the cost-effectiveness ratio of
this program would then be $1275/ ($11.57-
$9.82) = 726. Of course this is a particularly
crude estimate since the program, rolled out
to scale, would almost certainly benefit from
economies of scale making the per capita
costs significantly less.
0
20
40
60
80
100
120
140
160
180
2002 2003 2004 2005 2006 2007 2008 2009 2010 2011 2012 2013 2014
Cost of conflict per capita Peacebuilding per capita
CO
NST
AN
T 20
15 U
SD
FIGURE 5.4 LIBERIA’S COST OF CONFLICT AND PEACEBUILDING EXPENDITURE PER CAPITA, 2002-2014
The cost of conflict in Liberia fell steadily from 2003 onwards.
45MEASURING PEACEBUILDING COST-EFFECTIVENESS

PEACEBUILDING PROGRAM TWO: COGNITIVE BEHAVIOURAL THERAPY TO REDUCE CRIME AND VIOLENCEMen at high risk of anti-social behaviour, defined as violence
and drug use, were recruited in Monrovia, Liberia and
randomly assigned to take part in an intervention designed
around non-cognitive skill acquisition to reduce the likelihood
of such anti-social behaviour.
The intervention was three pronged — an 8 week cognitive
behavioural therapy program, a $200 cash transfer, or a
combination of both therapy and the cash transfer. 999
men most aged between 18 and 35 were recruited into the
program. The study period was 2009 to 2012.42
The cost of delivering both interventions was $530 per head:
$189 for the cognitive behavioural therapy, $216 for the cash
grant, and $125 for registration and administration. The
cost of conflict in Liberia fell from $9.82 per capita in 2009
to $7.32 in 2012 — a reduction of 25 percent. The treatment
effect for reduction in anti-social behaviour was estimated to
be between 40 and 50 percent depending on the particular
antisocial behaviour in question.
Taking the lower bound as a conservative estimate, we
assume that the effect of the program was to reduce the
likelihood of violent conflict by 40 percent. If we assume
propensity to re-engage in conflict is directly proportional
to the cost of conflict (a very crude assumption), then in the
absence of the peacebuilding program, the cost of violence
would be 40 percent higher in 2012 than the actual level in
2012, that is, the 2012 cost of conflict per capita would be
$10.25. Using the most crude measure of cost-effectiveness,
cost/effectiveness, the cost-effectiveness ratio of this program
would then be $530/($10.25-$9.82) = 1215.
Taking the upper bound as an estimate, we assume that the
effect of the program was to reduce the likelihood of violent
conflict by 50 percent. Thus in the absence of the program,
the cost of conflict per capita in 2012 would be $10.98. The
cost-effectiveness ratio of the program with this level of
impact is then 453.
COST-EFFECTIVENESS COMPARISON OF PROGRAM ONE AND PROGRAM TWOThis example shows one method by which to compare the
cost-effectiveness of two different kinds of peace-building
activity. A crude measure, the cost-effectiveness ratio
compares the cost of program per capita to the reduction of
cost of conflict per capita, and the results are summarised in
table 5.2.
A more refined version of the methodology shown in this
Liberia example, could be used to assess the cost-effectiveness
of a range of peacebuilding programs that have already been
evaluated for impact/
ADVANTAGES AND DRAWBACKS OF THIS APPROACHThis method would provide a novel way of thinking about
impact of peacebuilding which may be comparable across
different country contexts, since cost-effectiveness is
measured in relation to the particular costs of a country. It
will allow one to compare, at a glance, the cost-effectiveness
of different kinds of peacebuilding activity in one country,
but also, similar kinds of peacebuilding activity in different
countries. Furthermore, since the impact evaluations under
consideration have been completed, the data needed for the
research should all be available, thus becoming a question of
collecting and analysing.
Because the cost of violence is hard to quantify, however,
and because assumptions need to be made generalizing the
impact from relatively small scale experiments to talk about
effects at a country level, the measures that are derived
will only ever be rough estimates of cost-effectiveness. The
key challenge remains making the jump from measuring
the outcome of a particular intervention, to the impact of
that outcome on the level of violent conflict in a country,
particularly when the intervention takes place at the local
level and involves a relatively small number of people.
PEACEBUILDING INTERVENTION OPTIMISTIC COST-EFFECTIVENESS RATIO
CONSERVATIVE COST-EFFECTIVENESS RATIO
Employment program 726
Cognitive behavioural therapy 435 1215
TABLE 5.2 COST-EFFECTIVENESS COMPARISONS OF PEACEBUILDING INTERVENTIONS
46MEASURING PEACEBUILDING COST-EFFECTIVENESS

LONG TERM: MODELLING FUTURE PEACEBUILDING EXPENDITURES
One serious issue facing the peacebuilding community is
estimating the appropriate level of peacebuilding when
responding to outbreaks of conflict. Section four of this report
estimated the cost-effectiveness of peacebuilding at the global
level, using peacebuilding in Rwanda as the model for the
appropriate level of peacebuilding spending. However, this is
a very general approach, and the actual level of appropriate
peacebuilding for each country is likely to vary considerably,
taken into account the level of conflict in a country, its
economic situation, the number of parties involved in a
conflict, and any other number of pertinent factors.
Furthermore, the model only used the cost of conflict in
previous years, as well as the OECD DAC database, as the
basis for estimating the cost-effectiveness of peacebuilding.
This data does provide some information, and can serve as
the basis for realistically estimating future ODA from donor
countries. It is also useful in that it highlights discrepancies
in the allocation of peacebuilding funding, with some
countries receiving disproportionate levels of peacebuilding
funding, given the size of the conflict within a country.
However, it is not accurate enough to use as the sole basis for
predicting future peacebuilding needs. It does not provide any
information about the ability of a recipient country to absorb
and properly distribute peacebuilding funding, for example.
If the research outlined above for the short and medium
term proves successful, IEP could look at building a model
that provides estimates of peacebuilding needs in response
to future conflicts. The model would build upon the results
in stage two and three of the research, and then look to
add other pertinent variables, for example looking at the
intensity of a conflict, the existence of a peace treaty, the
social and political complexities of a given post-conflict
society, and so on.
It is essential to build on the country’s development plans,
peacebuilding needs assessment and other risk and fragility
assessment that might be available. Additionally, consultation
and coordination with local and international organisations
involved would ensure country ownership and efficiency in
allocation of funding to required activities.
Moreover, it might be required to allocate peacebuilding
funds to new areas to mitigate new risks or build on new
opportunities for peace. As peacebuilding activities progresses
the priority areas for funding might change. For instance,
immediately after the conflict areas such as demobilization
and disarmament might need more attention as compared to
the decentralisation and anti-corruption institutions.
CONCLUSION
The results of the analysis in this paper point to a few very
clear goals that IEP’s research program on peacebuilding
cost-effectiveness will aim to achieve. Firstly, the program
will aim to build awareness and consensus around the
suggested definition of peacebuilding, as this provides the
best framework for quantitative analysis of peacebuilding
at the national level. This in turn allows for broad estimates
of the cost-effectiveness of peacebuilding as a whole to be
constructed, and possibly for the development of country
specific funding targets for future peacebuilding interventions
in post-conflict societies.
Secondly, the program will aim to show that peacebuilding
funding in the form of ODA is effective at reducing violent
conflict at the national level. This will hopefully lead
to a series of more granular models that disaggregate
peacebuilding ODA by domain type, conflict context, and
possibly even specific peacebuilding categories, although
whether such research will prove to be fruitful or even
desirable remains to be seen. Analysis at this level would
also try to identify clusters of peacebuilding assistance that
could be defined as distinct strategies (for example, funding
for categories in a certain order, different ratios of category
funding, reviewing appropriate documents to see if an explicit
peacebuilding strategy has been outlined etc.), in order to
conduct research on which strategies are more successful in
reducing violent conflict.
47MEASURING PEACEBUILDING COST-EFFECTIVENESS

Thirdly, and at this stage, the most difficult and speculative
goal, IEP’s program will aim to bridge two gaps in existing
attempts at measuring the cost-effectiveness of peacebuilding.
There is a clear gap between measuring outcomes and
impact with regards to peacebuilding, as the unit of account
usually differs (with outcomes generally measured at the
project level, and impact more appropriately measured at the
national level). The proliferation of impact evaluations related
to peacebuilding may allow this gap to be bridged over the
longer run. There is also a parallel gap between measuring
impact and cost-effectiveness. The root of the problem is
essentially identical, albeit slightly more complicated: without
a way to effectively measure the impact of a given project on
violent conflict, there is no way to put a price the cost per unit
of increased peacefulness.
One serious issue facing the peacebuilding community is estimating the appropriate level of peacebuilding when responding to outbreaks of conflict.
48MEASURING PEACEBUILDING COST-EFFECTIVENESS

APPENDICES
49MEASURING PEACEBUILDING COST-EFFECTIVENESS
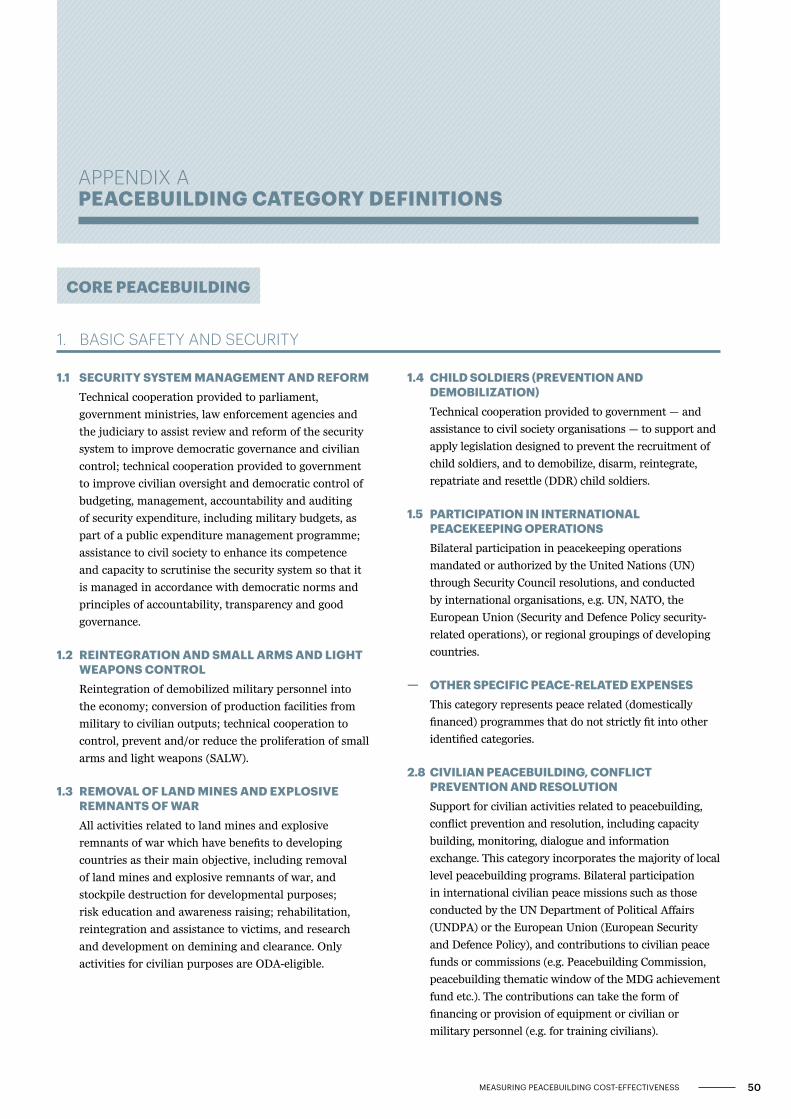
1.1 SECURITY SYSTEM MANAGEMENT AND REFORMTechnical cooperation provided to parliament,
government ministries, law enforcement agencies and
the judiciary to assist review and reform of the security
system to improve democratic governance and civilian
control; technical cooperation provided to government
to improve civilian oversight and democratic control of
budgeting, management, accountability and auditing
of security expenditure, including military budgets, as
part of a public expenditure management programme;
assistance to civil society to enhance its competence
and capacity to scrutinise the security system so that it
is managed in accordance with democratic norms and
principles of accountability, transparency and good
governance.
1.2 REINTEGRATION AND SMALL ARMS AND LIGHT WEAPONS CONTROLReintegration of demobilized military personnel into
the economy; conversion of production facilities from
military to civilian outputs; technical cooperation to
control, prevent and/or reduce the proliferation of small
arms and light weapons (SALW).
1.3 REMOVAL OF LAND MINES AND EXPLOSIVE REMNANTS OF WARAll activities related to land mines and explosive
remnants of war which have benefits to developing
countries as their main objective, including removal
of land mines and explosive remnants of war, and
stockpile destruction for developmental purposes;
risk education and awareness raising; rehabilitation,
reintegration and assistance to victims, and research
and development on demining and clearance. Only
activities for civilian purposes are ODA-eligible.
APPENDIX A PEACEBUILDING CATEGORY DEFINITIONS
1. BASIC SAFETY AND SECURITY
CORE PEACEBUILDING
1.4 CHILD SOLDIERS (PREVENTION AND DEMOBILIZATION)Technical cooperation provided to government — and
assistance to civil society organisations — to support and
apply legislation designed to prevent the recruitment of
child soldiers, and to demobilize, disarm, reintegrate,
repatriate and resettle (DDR) child soldiers.
1.5 PARTICIPATION IN INTERNATIONAL PEACEKEEPING OPERATIONSBilateral participation in peacekeeping operations
mandated or authorized by the United Nations (UN)
through Security Council resolutions, and conducted
by international organisations, e.g. UN, NATO, the
European Union (Security and Defence Policy security-
related operations), or regional groupings of developing
countries.
— OTHER SPECIFIC PEACE-RELATED EXPENSESThis category represents peace related (domestically
financed) programmes that do not strictly fit into other
identified categories.
2.8 CIVILIAN PEACEBUILDING, CONFLICT PREVENTION AND RESOLUTIONSupport for civilian activities related to peacebuilding,
conflict prevention and resolution, including capacity
building, monitoring, dialogue and information
exchange. This category incorporates the majority of local
level peacebuilding programs. Bilateral participation
in international civilian peace missions such as those
conducted by the UN Department of Political Affairs
(UNDPA) or the European Union (European Security
and Defence Policy), and contributions to civilian peace
funds or commissions (e.g. Peacebuilding Commission,
peacebuilding thematic window of the MDG achievement
fund etc.). The contributions can take the form of
financing or provision of equipment or civilian or
military personnel (e.g. for training civilians).
50MEASURING PEACEBUILDING COST-EFFECTIVENESS

2. INCLUSIVE POLITICAL PROCESSES
SECONDARY PEACEBUILDING
2.1 LEGAL AND JUDICIAL DEVELOPMENTSupport to institutions, systems and procedures of
the justice sector, both formal and informal; support
to ministries of justice, the interior and home affairs;
judges and courts; legal drafting services; bar and
lawyers associations; professional legal education;
maintenance of law and order and public safety; border
management; law enforcement agencies, police, prisons
and their supervision; ombudsmen; alternative dispute
resolution, arbitration and mediation; legal aid and
counsel; traditional, indigenous and paralegal practices
that fall outside the formal legal system. Measures
that support the improvement of legal frameworks,
constitutions, laws and regulations; legislative and
constitutional drafting and review; legal reform;
integration of formal and informal systems of law.
Public legal education; dissemination of information
on entitlements and remedies for injustice; awareness
campaigns.
2.2 LEGISLATURES AND POLITICAL PARTIESAssistance to strengthen key functions of legislatures/
parliaments including subnational assemblies and
councils (representation; oversight; legislation), such as
improving the capacity of legislative bodies, improving
legislatures’ committees and administrative procedures;
research and information management systems;
providing training programmes for legislators and
support personnel. Assistance to political parties and
strengthening of party systems.
2.3 ANTI-CORRUPTION ORGANISATIONS AND INSTITUTIONSSpecialized organisations, institutions and frameworks
for the prevention of and combat against corruption,
bribery, money-laundering and other aspects of
organized crime, with or without law enforcement
powers, e.g. anti-corruption commissions and
monitoring bodies, special investigation services,
institutions and initiatives of integrity and ethics
oversight, specialized NGOs, other civil society
and citizens’ organisations directly concerned with
corruption.
2.4 DEMOCRATIC PARTICIPATION AND CIVIL SOCIETYSupport to the exercise of democracy and diverse forms
of participation of citizens beyond elections; direct
democracy instruments such as referenda and citizens’
initiatives; support to organisations to represent and
advocate for their members, to monitor, engage and
hold governments to account, and to help citizens learn
to act in the public sphere; curricula and teaching for
civic education at various levels.
2.5 MEDIA AND FREE FLOW OF INFORMATIONActivities that support free and uncensored flow of
information on public issues; activities that increase
the editorial and technical skills and the integrity of the
print and broadcast media, e.g. training of journalists.
2.6 HUMAN RIGHTSMeasures to support specialized official human rights
institutions and mechanisms at universal, regional,
national and local levels in their statutory roles to
promote and protect civil and political, economic,
social and cultural rights as defined in international
conventions and covenants; translation of international
human rights commitments into national legislation;
reporting and follow-up; human rights dialogue.
Human rights defenders and human rights NGOs;
human rights advocacy, activism, mobilization;
awareness raising and public human rights education.
Human rights programming targeting specific groups,
e.g. children, persons with disabilities, migrants, ethnic,
religious, linguistic and sexual minorities, indigenous
people and those suffering from caste discrimination,
victims of trafficking, victims of torture.
2.7 WOMEN’S EQUALITY ORGANISATIONS AND INSTITUTIONSSupport for institutions and organisations
(governmental and non-governmental) working for
gender equality and women’s empowerment.
51MEASURING PEACEBUILDING COST-EFFECTIVENESS
3.1 PUBLIC SECTOR POLICY AND ADMINISTRATIVE MANAGEMENTInstitution-building assistance to strengthen core
public sector management systems and capacities.
This includes macro-economic and other policy
management, coordination, planning and reform;
human resource management; organizational
development; civil service reform; e-government;
development planning, monitoring and evaluation;
support to ministries involved in aid coordination;
other ministries and government departments when
sector cannot be specified.
3.2 PUBLIC FINANCE MANAGEMENTFiscal policy and planning; support to ministries
of finance; strengthening financial and managerial
accountability; public expenditure management;
improving financial management systems; tax
policy and administration; budget drafting; inter-
governmental fiscal relations, public audit, public debt.
3. CORE GOVERNMENT FUNCTIONS
3.3 DECENTRALISATION AND SUPPORT TO SUBNATIONAL GOVERNMENTDecentralisation processes (including political,
administrative and fiscal dimensions);
intergovernmental relations and federalism;
strengthening departments of regional and local
government, regional and local authorities and their
national associations.
52MEASURING PEACEBUILDING COST-EFFECTIVENESS

APPENDIX B LITERATURE REVIEW
INTRODUCTION
Better understanding of the different types of impact evaluation is a prerequisite for improved peacebuilding practices. The
objective of the paper is to understand ways to measure the impact of peacebuilding interventions on the rule of law and
security institutions. It aims to identify impact evaluation methodologies that can be applied in complex, multi-layered post-
conflict interventions.
TABLE B.1 OVERVIEW OF APPROACHES EXAMINED
TYPE APPROACH APPLICATION
ATTRIBUTION Scientific-experimental Claims attribution through use of counterfactual analysis
CONTRIBUTION
Theory-based Supports contribution by testing assumptions at each level of the theory of change
Participatory Supports contribution by listening to perceptions of the beneficiaries of what initiatives have made a difference in their lives
NON-CAUSAL
Action evaluation Supports the collective definition of goals — therefore helps to identify jointly what impact should be measured. Does not support attribution or contribution
Goal-free evaluationExamines the ‘actual’ impacts of an intervention by deliberately avoiding knowledge of the intended goals and objectives of the project team. Does not support attribution or contribution
Results-based evaluation Seeks to measure impact to the extent that it focuses on that level of the results chain (i.e. with the use of indicators)
Utilisation-focused Can address impact depending on methods and the designated use of the evaluation
SOURCE 1: Measuring the Impact of Peacebuilding Interventions on Rule of Law and Security Institutions | Scherrer, V (2012)
53MEASURING PEACEBUILDING COST-EFFECTIVENESS
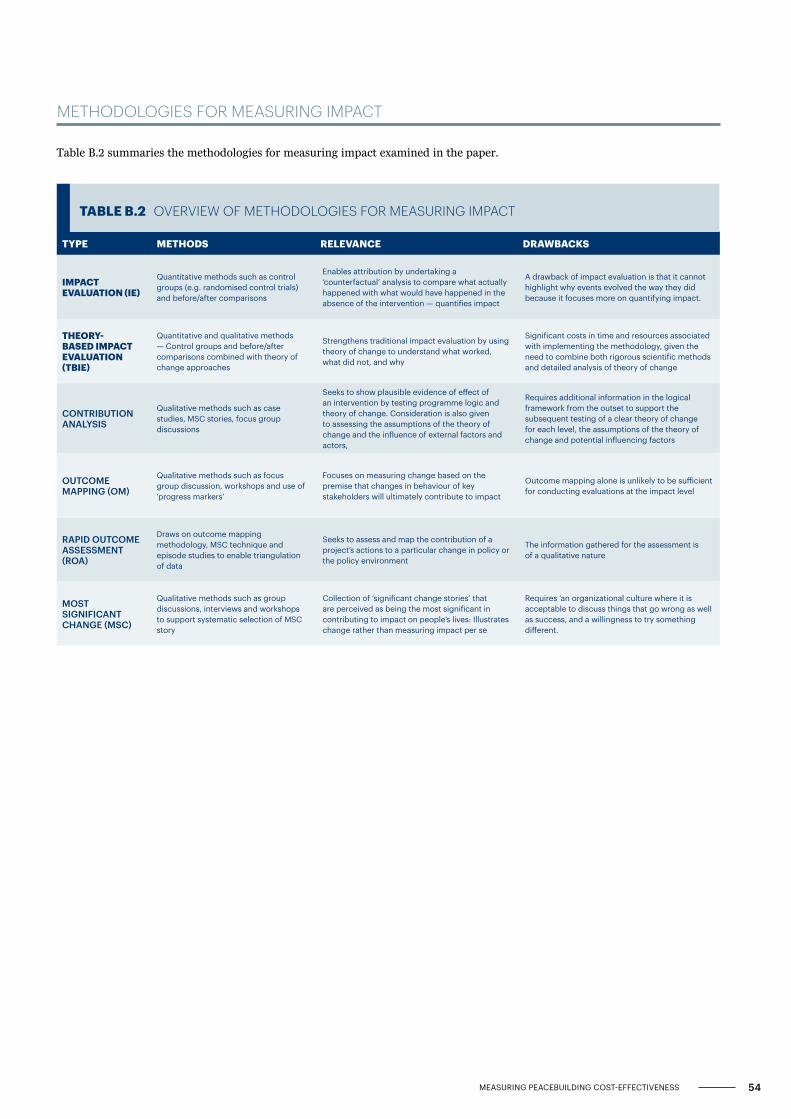
Table B.2 summaries the methodologies for measuring impact examined in the paper.
METHODOLOGIES FOR MEASURING IMPACT
TYPE METHODS RELEVANCE DRAWBACKS
IMPACT EVALUATION (IE)
Quantitative methods such as control groups (e.g. randomised control trials) and before/after comparisons
Enables attribution by undertaking a ‘counterfactual’ analysis to compare what actually happened with what would have happened in the absence of the intervention — quantifies impact
A drawback of impact evaluation is that it cannot highlight why events evolved the way they did because it focuses more on quantifying impact.
THEORY-BASED IMPACT EVALUATION (TBIE)
Quantitative and qualitative methods — Control groups and before/after comparisons combined with theory of change approaches
Strengthens traditional impact evaluation by using theory of change to understand what worked, what did not, and why
Significant costs in time and resources associated with implementing the methodology, given the need to combine both rigorous scientific methods and detailed analysis of theory of change
CONTRIBUTION ANALYSIS
Qualitative methods such as case studies, MSC stories, focus group discussions
Seeks to show plausible evidence of effect of an intervention by testing programme logic and theory of change. Consideration is also given to assessing the assumptions of the theory of change and the influence of external factors and actors,
Requires additional information in the logical framework from the outset to support the subsequent testing of a clear theory of change for each level, the assumptions of the theory of change and potential influencing factors
OUTCOME MAPPING (OM)
Qualitative methods such as focus group discussion, workshops and use of ‘progress markers’
Focuses on measuring change based on the premise that changes in behaviour of key stakeholders will ultimately contribute to impact
Outcome mapping alone is unlikely to be sufficient for conducting evaluations at the impact level
RAPID OUTCOME ASSESSMENT (ROA)
Draws on outcome mapping methodology, MSC technique and episode studies to enable triangulation of data
Seeks to assess and map the contribution of a project’s actions to a particular change in policy or the policy environment
The information gathered for the assessment is of a qualitative nature
MOST SIGNIFICANT CHANGE (MSC)
Qualitative methods such as group discussions, interviews and workshops to support systematic selection of MSC story
Collection of ‘significant change stories’ that are perceived as being the most significant in contributing to impact on people’s lives: Illustrates change rather than measuring impact per se
Requires ‘an organizational culture where it is acceptable to discuss things that go wrong as well as success, and a willingness to try something different.
TABLE B.2 OVERVIEW OF METHODOLOGIES FOR MEASURING IMPACT
54MEASURING PEACEBUILDING COST-EFFECTIVENESS

Table B.3 summaries the different approaches taken by multilateral organisations with regards to impact evaluation.
MEASURING IMPACT: APPROACHES OF INTERNATIONAL ACTORS
TABLE B.3 EXAMPLES OF MULTILATERAL ACTORS’ APPROACHES TO MEASURING IMPACT
ORGANISATION APPROACHES ADVOCATED IN THEORY APPROACHES DEMONSTRATED IN PRACTICE
UN ORGANISATIONS
DPKO N/AImpact assessment to measure the ten-year impact of UNSCR 1325 in peacekeeping based on a participatory approach
OHCHR Results-based management with a focus on evidence-based reporting and contribution analysis
N/A
PBSOM&E approach under development
N/AApproach will be based on understanding that results should be ‘attributable’.
UNDPImpact evaluations mentioned in M&E handbook although challenges are recognised Joint or UNDP country office-commissioned impact assessments
Contribution and attribution mentioned but not methodology
UNFPA Participatory evaluations are advocated Recognised as weak in UNFPA meta-evaluation
UNHCR Promotes participatory and utilisation-focused approaches, and is striving to foster a results-based management culture
Independent impact evaluation commissioned in southern Sudan
UNICEFContribution analysis and participatory performance story reporting are all promoted as are utilisation-focused approaches
Impact evaluations carried out, (e.g. in Mozambique)
MSC techniques are also promoted MSC approaches used in India and the Solomon Islands
UNODC Advocates utility-focused and participatory approachConsidered weak in UNODC report, but efforts being made
MSC used for a criminal justice reform programme and an anti-drug-trafficking coordination centre
UN WOMEN
Participatory approaches advocatedRecognised as weak in UNIFEM meta-evaluation; noted that measuring impact would require participatory and innovative approaches and more resources
Methodologies used that are under review
Outcome mapping
Impact evaluation strategy being implemented in a global programme
OTHER MULTILATERAL ORGANISATIONS
AFRICAN DEVELOPMENT BANK
Focus on impact evaluations is emergingSeveral impact assessments carried out in areas of poverty alleviation, energy sector and water supply although they do not all use quantitative methods
Promotes attribution with ‘before-and-after’ methods MSC
EUROPEAID
Guidelines mention impactThere appear to be no reports or sections of reports addressing impact in isolation
Counterfactuals, contribution analysis and attribution analysis are mentioned
Isolated examples of most significant change and contribution analysis
Impact is mentioned as a criteria in many evaluations although they are not explicitly impact evaluations
OECD Impact evaluation Evaluations conducted by the aid agencies of member states
WORLD BANK
Overall evaluation approach is objective-based but also undertakes scientific-experimental evaluations Multiple impact evaluations available online including quasi-experimental and
non-experimental
Member of NONIE with a similar theoretical approach as OECD
55MEASURING PEACEBUILDING COST-EFFECTIVENESS
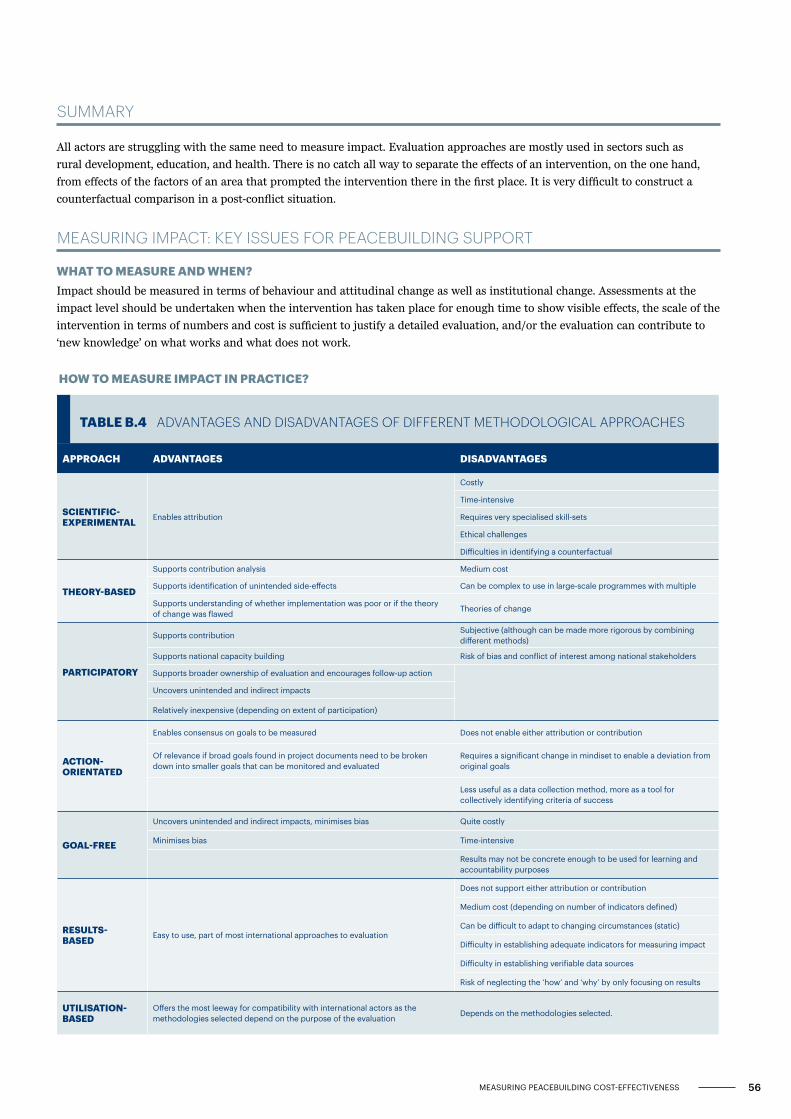
WHAT TO MEASURE AND WHEN?Impact should be measured in terms of behaviour and attitudinal change as well as institutional change. Assessments at the
impact level should be undertaken when the intervention has taken place for enough time to show visible effects, the scale of the
intervention in terms of numbers and cost is sufficient to justify a detailed evaluation, and/or the evaluation can contribute to
‘new knowledge’ on what works and what does not work.
All actors are struggling with the same need to measure impact. Evaluation approaches are mostly used in sectors such as
rural development, education, and health. There is no catch all way to separate the effects of an intervention, on the one hand,
from effects of the factors of an area that prompted the intervention there in the first place. It is very difficult to construct a
counterfactual comparison in a post-conflict situation.
SUMMARY
MEASURING IMPACT: KEY ISSUES FOR PEACEBUILDING SUPPORT
TABLE B.4 ADVANTAGES AND DISADVANTAGES OF DIFFERENT METHODOLOGICAL APPROACHES
APPROACH ADVANTAGES DISADVANTAGES
SCIENTIFIC- EXPERIMENTAL Enables attribution
Costly
Time-intensive
Requires very specialised skill-sets
Ethical challenges
Difficulties in identifying a counterfactual
THEORY-BASED
Supports contribution analysis Medium cost
Supports identification of unintended side-effects Can be complex to use in large-scale programmes with multiple
Supports understanding of whether implementation was poor or if the theory of change was flawed
Theories of change
PARTICIPATORY
Supports contributionSubjective (although can be made more rigorous by combining different methods)
Supports national capacity building Risk of bias and conflict of interest among national stakeholders
Supports broader ownership of evaluation and encourages follow-up action
Uncovers unintended and indirect impacts
Relatively inexpensive (depending on extent of participation)
ACTION-ORIENTATED
Enables consensus on goals to be measured Does not enable either attribution or contribution
Of relevance if broad goals found in project documents need to be broken down into smaller goals that can be monitored and evaluated
Requires a significant change in mindiset to enable a deviation from original goals
Less useful as a data collection method, more as a tool for collectively identifying criteria of success
GOAL-FREE
Uncovers unintended and indirect impacts, minimises bias Quite costly
Minimises bias Time-intensive
Results may not be concrete enough to be used for learning and accountability purposes
RESULTS- BASED Easy to use, part of most international approaches to evaluation
Does not support either attribution or contribution
Medium cost (depending on number of indicators defined)
Can be difficult to adapt to changing circumstances (static)
Difficulty in establishing adequate indicators for measuring impact
Difficulty in establishing verifiable data sources
Risk of neglecting the ‘how’ and ‘why’ by only focusing on results
UTILISATION-BASED
Offers the most leeway for compatibility with international actors as the methodologies selected depend on the purpose of the evaluation
Depends on the methodologies selected.
HOW TO MEASURE IMPACT IN PRACTICE?
56MEASURING PEACEBUILDING COST-EFFECTIVENESS

TABLE B.5 ADVANTAGES AND DISADVANTAGES OF IMPACT ASSESSMENT METHODOLOGIES
METHODOLOGY ADVANTAGES DISADVANTAGES
IMPACT EVALUATION
Enables attribution Establishing control groups may be challenging
Enables quantification of impact and provides statements for donors Sufficient baseline data may be missing
Cost can be ‘significant’
Requires sophisticated skill-sets (limits availability of consultants)
THEORY-BASED IMPACT EVALUATION
Combines quantitative methods with qualitative methods that enable an understanding of why impact has or has not occurred in addition to supporting attribution
The same challenges as faced by impact evaluation
CONTRIBUTION ANALYSIS
Enables contribution
Does not support attributionEnables identification of unintended and negative impacts
Provides opportunity to learn
OUTCOME MAPPING (OM)
Supports contribution
If used as originally intended, can be time-consuming and relies on an open organisational culture; but can be adapted for use in a less ‘invasive’ manner as a tool for external consultants
Useful in situations where outcomes are unpredictableCan be used to evaluate projects or programmes, but these must be specific enough to enable the identification of groups that will change
Flexible and adaptable
RAPID OUTCOME ASSESSMENT (ROA)
Useful in assessing contribution to policy changes (through use of episode studies) Can be time-consuming and relies on an open organisational
culture.Flexible and adaptable
MOST SIGNIFICANT CHANGE (MSC)
Useful in situations where outcomes are unpredictable Does not measure attribution but can support contribution
Identifies how change has come about and what change has been the most important
Requires an open organisational culture
Supports participatory identification of impact and provides capacity building
Less useful when there are well-defined and measurable outcomes
Can be used to supplement other techniques in order to highlight change
Time-consuming when used as originally intended
Requires combination with other methodologies/approaches
WHAT IS THE ROLE OF INDICATORS IN MEASURING IMPACT?
CONCLUSION
It must be emphasised that indicators are not adequate
tools for measuring impact on their own. The impact
of indicators depend on what level we are evaluating;
for example, local, regional, or global impact; or short,
medium, long term impact. Indirect or proxy indicators
are used when the variable being measured is abstract. For
example, a DDR programme measures impact (“security
situation improved”) by using four proxy indicators
(violence, confiscated ammunition, confiscated weapons,
suspects detained). One of the essential considerations in
peacebuilding is the need to capture behavioural change,
which can be difficult to measure.
THE KEY FINDINGS OF THIS PAPER ARE:
1) There is no common agreement among international
actors on the best approach to measuring impact.
2) The scientific-experimental approach to evaluations,
has been promoted in the development field as the only
‘rigorous’ approach to measuring impact because it is
based on counterfactual analysis.
3) There are small steps that can be taken to strengthen
traditional evaluation approaches to focus more on impact.
4) Measuring impact can be a significantly political
undertaking. There is a risk that an evaluation may shed
light on the failings of an intervention to achieve its
desired impact, and in that case there needs to be clarity
on whether all actors are willing to confront this reality
and what they can do with this information.
5) Finally, and against this background, attempting to
measure impact is — or ought to be — more expensive
and time-consuming than an evaluation at a lower level
of the results chain. It should be clear that there is no
need to measure impact on a yearly basis.
57MEASURING PEACEBUILDING COST-EFFECTIVENESS

LESSON 1: ARTICULATE THE COMPLEX INITIATIVE’S THEORY
The theory can be used to serve as framework for interpreting
initiative, most commonly used by creating logic model/
tree. The model can be used to identify initiative activities
and how they relate to short, intermediate, and long-term
outcomes. Began by developing a broad conceptual model,
illustrating goals and relationships. Advantages of creating
model include: 1) socialization tool allowing stakeholders
to understand what initiative is trying to achieve; 2) how
individual activities fit within the initiative’s broader context;
3) outcome identification; 4) sustainability: model becomes
organizing structure for evaluation’s design and management.
SUMMARY
The paper aims to simplify complex initiative evaluation. It looks at two emerging evaluation methods: Theory-of-change and
cluster evaluation. Lessons on evaluating complex initiatives:
LESSON 2: USE THE INITIATIVE’S THEORY AS A FRAMEWORK FOR DESIGNING THE EVALUATION
Identify benchmarks or indicators connected to outcomes
and methods needed to track them. Make sure that if you
focus on the theory’s parts (boxes in the logic model), you
don’t lose sight of their connections (arrows in the logic
model). In addition, you want to develop a design that is easy
to manage and keeps data collection an reporting focused on
what is being learned about the initiative’s theory as a whole
and not only on its parts.
FIGURE B.1 WKKF DEVOLUTION INITIATIVE
Devolution grantees WKKF
Inform policy agenda and
decisions
Build local participation in
decision making
Build national, state and local
capacityReach groups, individual/media at
state/local levels
Accessinformation
needs
Develop information
Disseminateinformation
SOURCE 2: Program Evaluation Cost Benefits and Cost-effectiveness | Kee, J (1999)
58MEASURING PEACEBUILDING COST-EFFECTIVENESS

TIP: DEVELOP EVALUATION OBJECTIVES LINKED DIRECTLY TO THE MODEL
Break down the model into evaluation objectives in order to make evaluation more manageable. Objectives focus on distinct
pieces of the model and their relationships to one another, example below. Objectives become the essential managing structure
for the evaluation.
COST-BENEFIT ANALYSIS AND COST-EFFECTIVENESS ANALYSIS IN PROGRAM EVALUATION
Cost-benefit analysis attempts to assess service program by
determining whether total societal welfare has increased
because of a given project or program. It consists of three steps:
1) determine the benefits of a proposed or existing program
and place a dollar value on those benefits
2) calculate the total costs of the program
3) compare the benefits and the costs
Cost-effectiveness analysis relates the cost of a given
alternative to specific measures of the program objectives.
Cost-effectiveness analysis does not produce a “net benefit”;
instead, it show how many units of outputs are created with
x amount of dollars and the cost of each percent increase/
decrease in unit of output.
CHALLENGES IN CONDUCTING COST-BENEFIT AND COST-EFFECTIVENESS ANALYSIS
IDENTIFYING AND MEASURING COSTS
When identifying and benefit or cost, it is important to
state its nature clearly, to state how it is being measured,
and to list any assumptions make in the calculation of the
dollars involved.
IDENTIFYING AND MEASURING BENEFITS
As with costs, there are direct, indirect, and intangible
benefits. Attaching a dollar value is hard because you
don’t always know whether to use market value or a proxy
measure such as willingness to pay. Who benefits as well
as the amount of benefits is important. Where quantifying
benefits is difficult, costly, or viewed as inappropriate, cost-
effectiveness analysis can be used, for example ‘lives saved’.
When conducting a cost-effectiveness analysis comparing
programs with multiple benefits, evaluator might need to
place weights on relative benefits. Keep in mind spill over
effects when determining geographic scope and be sure to
include details of analysis to decision makers.
DECIDING BETWEEN COST-EFFECTIVENESS AND COST-BENEFIT ANALYSIS
The more intangible the benefit, the more likely that a CE
analysis will be of greater use to decision makers. Ask these
questions:
HOW WILL YOU USE THE RESULTS?
Cost-benefit analysis enables you to compare strategies
that do not have same outcomes, or to compare strategies
across different areas. Cost-effectiveness analysis is useful
for comparing strategies that are trying to achieve the
same objective.
WHAT RESOURCES DO YOU HAVE?
Cost-benefit analyses typically require more resources,
because they take more time for analysis and involve
significant methodological expertise.
HOW DIFFICULT ARE COSTS AND BENEFITS TO VALUE?
You must weight the value of the increased accuracy
gained from the accumulation of new data against the
costs associated with the data collection. Thus, any analysis
should begin by assimilating existing data to determine
whether it is sufficient.
59MEASURING PEACEBUILDING COST-EFFECTIVENESS

SOURCE 3A: Spending to Save? An Analysis of the Cost-effectiveness of Conflict Prevention | Chalmers, M (2004)
The paper finds that conflict prevention is (or would have been) a cost effective investment for the international community in
all the case studies chosen, even allowing for large margins of error in the estimation of costs and benefits:
j A spend of £1 on conflict prevention will, on average, generate savings of £4.1 to the international community (with a range of 1.2 to 7.1)
j Some of the most cost-effective ‘packages’ take place in the gestation phase of conflict. But estimates of impact depend critically on the willingness of local political authorities to allow implementation
j The cost-effectiveness of preventive military action is greater when the potential for resistance is small and the scale of deployments is limited
j The balance of CP components, the timing of their use, and the availability of entry points are all critical to cost-effective intervention
The paper finds that the cost of inaction considerably
outweighed the cost of hypothetical conflict prevention.
Yet the results of such analysis can be misleading, since the
results of inaction can never be known in advance and so the
estimated costs are likely to be very different from the actual
costs. Conversely the benefits of prevention are also unknown.
Preventative actions may be unsuccessful or may simply delay
the onset of violence. Alternatively, even without preventative
action, conflict may not have taken place. Such an approach
needs to take into account the predicted probabilities of
conflict onset (both in the absence and presence of proposed
CP measures), together with estimates of the expected costs of
war and of preventative actions.
KEY FEATURES OF METHODOLOGY
What mix of CP measures and instruments adopted by
the international community would be most cost-effective
in preventing conflict if adopted now? And how do these
compare with the possible costs of conflict?
Breakeven probability is the reduction in probability of
conflict which a given CP Package has to achieve in order for
its additional cost to be equivalent to the likely savings to the
international community.
Packages include: deployment of troops and provision
of a level of ODA and promote longer-term processes of
institutional and normative change that can reduce the future
resort to political violence, reflecting the assessment that
large-scale conflict is primarily a medium-term, rather than
short-term, risk.
KEY FINDINGS: COST-EFFECTIVENESS OF CONFLICT PREVENTION PACKAGES TO THE INTERNATIONAL COMMUNITY
The estimates of conflict probability reduction used by the
paper depend critically, in both cases, on the willingness of
local political authorities to allow their implementation.
Perhaps the most obviously effective conflict prevention
package amongst those studied, therefore, is the second
Rwanda package. The proposed military action was clearly
feasible, did not depend on host government approval, and
would almost certainly have achieved its defined objective
of stopping the genocide, with all the other consequences
that followed.
SUMMARY
60MEASURING PEACEBUILDING COST-EFFECTIVENESS
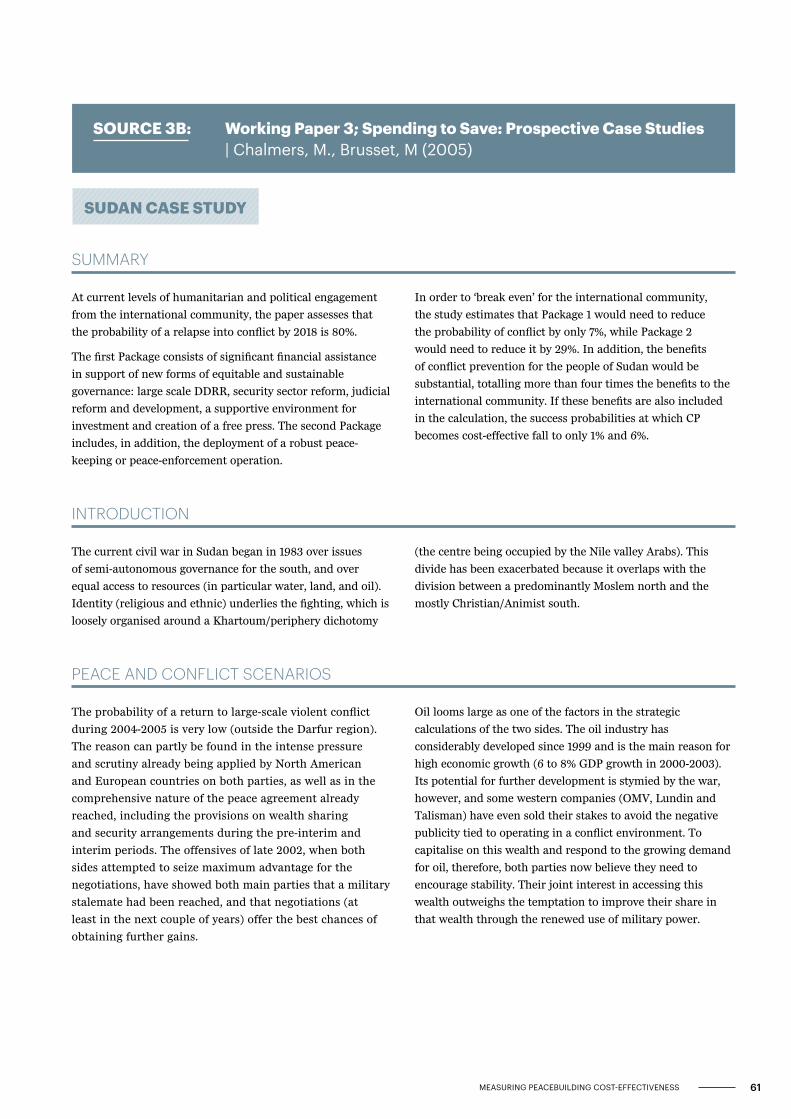
SOURCE 3B: Working Paper 3; Spending to Save: Prospective Case Studies | Chalmers, M., Brusset, M (2005)
SUMMARY
At current levels of humanitarian and political engagement
from the international community, the paper assesses that
the probability of a relapse into conflict by 2018 is 80%.
The first Package consists of significant financial assistance
in support of new forms of equitable and sustainable
governance: large scale DDRR, security sector reform, judicial
reform and development, a supportive environment for
investment and creation of a free press. The second Package
includes, in addition, the deployment of a robust peace-
keeping or peace-enforcement operation.
In order to ‘break even’ for the international community,
the study estimates that Package 1 would need to reduce
the probability of conflict by only 7%, while Package 2
would need to reduce it by 29%. In addition, the benefits
of conflict prevention for the people of Sudan would be
substantial, totalling more than four times the benefits to the
international community. If these benefits are also included
in the calculation, the success probabilities at which CP
becomes cost-effective fall to only 1% and 6%.
INTRODUCTION
The current civil war in Sudan began in 1983 over issues
of semi-autonomous governance for the south, and over
equal access to resources (in particular water, land, and oil).
Identity (religious and ethnic) underlies the fighting, which is
loosely organised around a Khartoum/periphery dichotomy
(the centre being occupied by the Nile valley Arabs). This
divide has been exacerbated because it overlaps with the
division between a predominantly Moslem north and the
mostly Christian/Animist south.
PEACE AND CONFLICT SCENARIOS
The probability of a return to large-scale violent conflict
during 2004-2005 is very low (outside the Darfur region).
The reason can partly be found in the intense pressure
and scrutiny already being applied by North American
and European countries on both parties, as well as in the
comprehensive nature of the peace agreement already
reached, including the provisions on wealth sharing
and security arrangements during the pre-interim and
interim periods. The offensives of late 2002, when both
sides attempted to seize maximum advantage for the
negotiations, have showed both main parties that a military
stalemate had been reached, and that negotiations (at
least in the next couple of years) offer the best chances of
obtaining further gains.
Oil looms large as one of the factors in the strategic
calculations of the two sides. The oil industry has
considerably developed since 1999 and is the main reason for
high economic growth (6 to 8% GDP growth in 2000-2003).
Its potential for further development is stymied by the war,
however, and some western companies (OMV, Lundin and
Talisman) have even sold their stakes to avoid the negative
publicity tied to operating in a conflict environment. To
capitalise on this wealth and respond to the growing demand
for oil, therefore, both parties now believe they need to
encourage stability. Their joint interest in accessing this
wealth outweighs the temptation to improve their share in
that wealth through the renewed use of military power.
SUDAN CASE STUDY
61MEASURING PEACEBUILDING COST-EFFECTIVENESS

ADDITIONAL ANNUAL COSTS OF THE CONFLICT SCENARIO
In the case of a situation of renewed conflict, the cost of
conflict can be obtained by subtracting what is lost national
income or GNI (Gross National Income) from the evolution of
national income in a peace scenario.
Forecasting cost of conflict through loss of GNI and increased
military expenditures. GNI stagnates in Sudan in 2012 as
source of revenue decreases and opportunities of investments
disappears. The diversion of financial resources into military
expenditure, and the disruption created by conflict, would
also have a negative effect on provision of social services,
including health and education. Also cost on neighbouring
countries and IC.
Third, the net costs of refugee inflows, once adjusted
both for international community contributions and the
economic benefits that refugees can bring, for example in
new skills, increased international investment in transport
infrastructure.
PROBABILITY OF THE CONFLICT WITHOUT CONFLICT PREVENTION PACKAGES
Because the peace process has only laid out the framework
of a lasting peace, it has not resolved older and more
structural tensions. The baseline measures are not sufficient
to achieve that type of change. Should there be a wavering
of international attention, as is frequently the case in
international resolution efforts, or should US pressure in
Sudan shift (for example because a new administration
takes over the White House), the fragile momentum which
prevailed at the talks could disappear rapidly.
CONFLICT PREVENTION PACKAGES
CONFLICT PREVENTION PACKAGE 1: Governance Assistance. This package seeks to address these
and other concerns by the provision of significant external
financial assistance in support of the development of new
forms of equitable and sustainable governance. This is
achieved through support for large scale DDRR, security
sector reform, judicial reform and development, a supportive
environment for investment and the creation of a free press.
CONFLICT PREVENTION PACKAGE 2: Peace Enforcement. This package consists of all the measures
under Package 1, but in addition foresees the deployment of a
robust peacekeeping or peace-enforcement operation.
PROBABILITY OF CONFLICT WITH CONFLICT PREVENTION PACKAGESThe probability of conflict over the 15 year period is estimated
at 15% if CP Package 2 is applied. If Package 1 is applied,
that is only the governance measures outlined above, the
probability of conflict is still quite low, at 30%.
NET PRESENT VALUE AND ASSESSMENTBoth the packages discussed here are of relatively modest
monetary cost, compared with the potential benefits to the
international community. CP Package 1 breaks even if it
reduces the probability of large-scale conflict by 7% and CP
Package 2 has a breakeven probability of 29%. In both cases,
it is estimated, the reduction in conflict probability exceeds
these levels by a substantial margin. In addition, the benefits
of conflict prevention for the people of Sudan would be
substantial, totalling more than four times the benefits to the
international community. If these benefits are also included
in the calculation, the success probabilities at which CP
becomes cost- effective fall to only 1% and 6%.
62MEASURING PEACEBUILDING COST-EFFECTIVENESS

DEFINING IMPACT EVALUATIONS
DEFINITION Evaluations that draw from a set of methods
designed to establish a counterfactual or valid comparison,
to the intervention in question. Objective is to measure net
impact of intervention, which is difference in outcome with
and without intervention.
METHODOLOGY Create experiments of randomly controlled
trials that receive version of intervention (aka. treatment) and
quasi-experiments. Difference between experiment and
quasi-experiments is the use of random assignment of the
target population to treatment or control in experiments.
SOURCE 4: Impact Evaluation of Conflict Prevention and Peacebuilding Interventions | Gaardner, M., Annan, J (2013)
SUMMARY
Important to understand the impacts and effectiveness
of development interventions operating in contexts of
conflict and fragility. It is possible to carry out IEs in violent
conflicts. Source examines practices of impact evaluators in
addressing evaluation design, data collection, and conflict
analysis. Source argues that said evaluations are crucial
for understanding how development interventions affect
change which help understand results on the ground.
INTRODUCTION
Levels of resources increase in fragile state but see no
sustainable results — “no fragile state has yet to reach any
of the MDGs”. But is IE feasible? Four major concerns:
(i) unethical to identify comparison group in situation of
conflict and fragility; (ii) operationally difficult; (iii) IEs don’t
address most important evaluation questions; (iv) too costly.
ARE IMPACT EVALUATIONS OF INTERVENTIONS IN CONFLICT PREVENTION AND PEACEBUILDING FEASIBLE?
Samii, Brown, and Kulma (2012) have concluded that impact evaluations of peacebuilding interventions in conflict-affected settings
are possible in a number of circumstances, often regarded as stabilization interventions. Source explores (i) evaluation design issues
in conflict-affected situations; (ii) evaluations as interventions, and the implications for the risks and reliability of results; (iii) the
importance and value-added of IEs; and (iv) ethical concerns about impact evaluations in conflict prevention and peacebuilding.
WHY ARE IMPACT EVALUATIONS IMPORTANT?
TESTING THEORIES OF CHANGE OF CONFLICT PREVENTION AND PEACEBUILDING INTERVENTIONSLarge n impact evaluations allow us to measure net
impact and thus attribute the effects of the intervention.
Counterfactual is necessary to see the variance in
improvements without external factors and attributing
improvement to program’s activities. Key tenets of impact
evaluation: accounting for other possible confounding factors
and focusing on results rather than implicit intentions in
the process. Limitation of impact evaluations is that large n
impact evaluations can only be applied in large n situations,
therefore limiting the questions that can be addressed. Source
continues to provide examples of how impact evaluations
have been used to test commonly held assumptions about
development interventions affect change.
SMALL n IMPACT EVALUATIONSSmall n impact evaluations are when a treatment and
comparison group of sufficient size cannot be identified, thus
tests of statistical significance are not possible. When large
n impact evaluation is not possible, evaluators use process
evaluations or impact assessments.
CONCLUSION: HIGH RISK, HIGH RETURN?
The effectiveness of impact evaluations is still in question, but nonetheless important to carry out impact evaluations to better
design and implement conflict prevention and peacebuilding programs
63MEASURING PEACEBUILDING COST-EFFECTIVENESS

Recently, there has been more focus in accurately
measuring impact of peacebuilding projects because of the
rise in systematic approaches to project monitoring and
evaluation. This trend is driven by donor demand for greater
accountability and cost-effectiveness and desire to capture
lessons learned in a manner that fosters knowledge. 1990’s
also witnessed dramatic increase in conflicts — showed that
conventional development approaches were insufficient. This
led to new post-conflict approaches that address root causes,
integrating peacebuilding, conflict prevention, and conflict
management into reconstruction and development.
Initial efforts to integrate peacebuilding were rejected
because they challenged standard operating procedures of
foreign aid and donors sometimes had their own political
motives. Early years of peacebuilding mainly contributed of
advocacy, and when accepted, focused on project design and
implementation. Two types of peacebuilding projects emerged:
(1) “indirect peacebuilding,” in which peacebuilding objectives
are integrated into sectoral aid projects, and (2) “direct
peacebuilding,” projects devoted exclusively to the promotion
of dialogue, consolidation of peace, building of local capacity
to manage conflicts, and prevention of recurrence of conflict.
Unfortunately conventional measurements tools for evaluating
peacebuilding project impacts fall short because the borrowed
models do not correspond to the unique circumstances found
in conflict situations.
METHODOLOGICAL CHALLENGES TO IMPACT ASSESSMENT
PROBLEMS OF MEASUREMENTIndicators to measure peace are hard to justify because
peace, communal trust, and good governance are intangibles;
they are process-oriented objectives, not products. It is
also impossible to predict what would have happened in
the absence of a peacebuilding intervention. Organisations
and donor agencies have tried to draw up basic criteria for
evaluations but general consensus is that peacebuilding is not
amenable to fixed templates of indicators.
CAUSALITY OR ATTRIBUTIONVirtually impossible to attribute a causal link between a
change in social or political environment and a single or
bundle of projects. Other problems include correlations
without causal links, delayed causality, mutual causality,
and interactive causality. The Peacebuilding project can
do everything right but not see any positive impact due to
force majeure — unforeseeable circumstances that prevent
someone from fulfilling a contract. Limitations to social
science methodologies — cannot show causality but only
inferences to causality. The real challenge is to be thoughtful,
rigorous, and pragmatic to project evaluations.
PROJECT STAFF “BUY-IN.”Project staff can feel uneasy about IEs because they often
attribute impact evaluations to mechanisms of oversight,
control, and accountability. Project teams may not feel like
stakeholders in evaluations. Evaluations are resisted because
they have the potential to reveal that the peacebuilding work
is not succeeding.
TEACHING TO THE TEST One danger of establishing indicators and benchmarks come
when reward systems for personnel are linked to meeting fixed
benchmarks, instead of the objective itself. This incentivizes
personnel to achieve results within the indicator alone and
ignore the overall objective of the peacebuilding project.
SOURCE 5: Impact Assessment in Post-Conflict Peacebuilding: Challenges and Future Directions | Menkhaus, K (2007)
INTRODUCTION: THE GRADUAL ACCEPTANCE OF ‘PEACEBUILDING’
64MEASURING PEACEBUILDING COST-EFFECTIVENESS
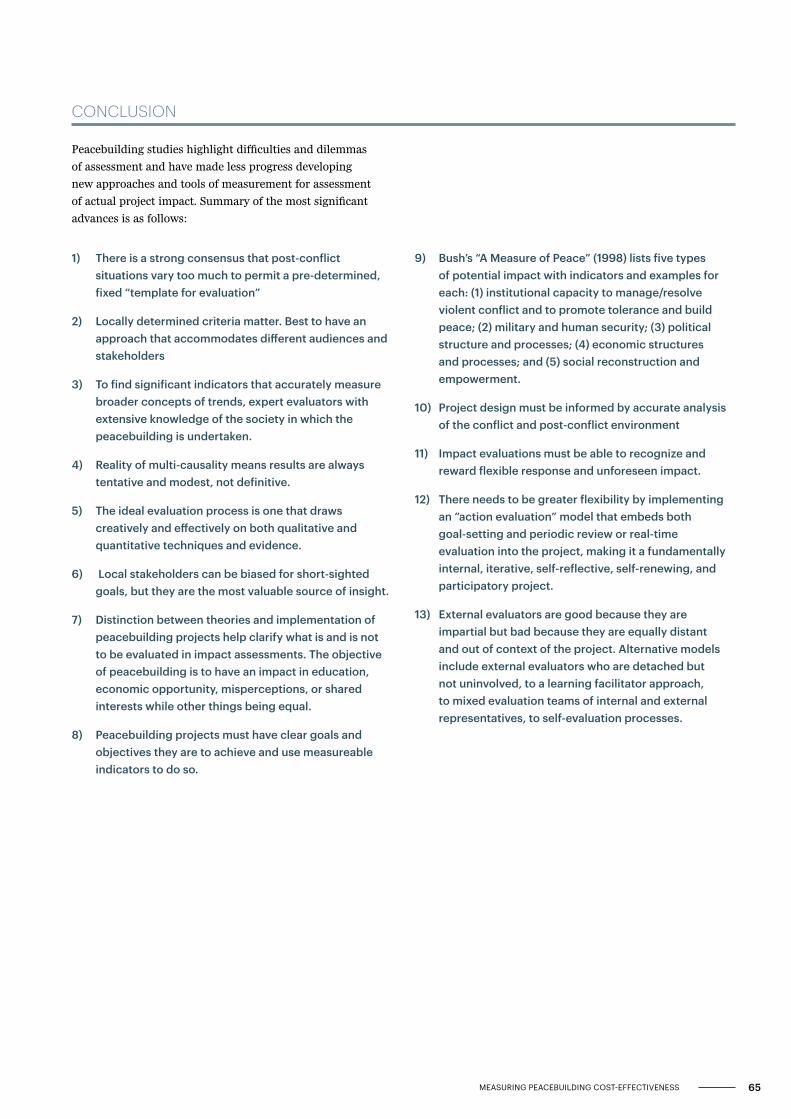
CONCLUSION
Peacebuilding studies highlight difficulties and dilemmas
of assessment and have made less progress developing
new approaches and tools of measurement for assessment
of actual project impact. Summary of the most significant
advances is as follows:
1) There is a strong consensus that post-conflict situations vary too much to permit a pre-determined, fixed “template for evaluation”
2) Locally determined criteria matter. Best to have an approach that accommodates different audiences and stakeholders
3) To find significant indicators that accurately measure broader concepts of trends, expert evaluators with extensive knowledge of the society in which the peacebuilding is undertaken.
4) Reality of multi-causality means results are always tentative and modest, not definitive.
5) The ideal evaluation process is one that draws creatively and effectively on both qualitative and quantitative techniques and evidence.
6) Local stakeholders can be biased for short-sighted goals, but they are the most valuable source of insight.
7) Distinction between theories and implementation of peacebuilding projects help clarify what is and is not to be evaluated in impact assessments. The objective of peacebuilding is to have an impact in education, economic opportunity, misperceptions, or shared interests while other things being equal.
8) Peacebuilding projects must have clear goals and objectives they are to achieve and use measureable indicators to do so.
9) Bush’s “A Measure of Peace” (1998) lists five types of potential impact with indicators and examples for each: (1) institutional capacity to manage/resolve violent conflict and to promote tolerance and build peace; (2) military and human security; (3) political structure and processes; (4) economic structures and processes; and (5) social reconstruction and empowerment.
10) Project design must be informed by accurate analysis of the conflict and post-conflict environment
11) Impact evaluations must be able to recognize and reward flexible response and unforeseen impact.
12) There needs to be greater flexibility by implementing an “action evaluation” model that embeds both goal-setting and periodic review or real-time evaluation into the project, making it a fundamentally internal, iterative, self-reflective, self-renewing, and participatory project.
13) External evaluators are good because they are impartial but bad because they are equally distant and out of context of the project. Alternative models include external evaluators who are detached but not uninvolved, to a learning facilitator approach, to mixed evaluation teams of internal and external representatives, to self-evaluation processes.
65MEASURING PEACEBUILDING COST-EFFECTIVENESS

APPENDIX C REFERENCES
African Development Bank Group (2011) ‘Evaluation of Policy Based Operations in the African Development Bank, 1999-2009: Country Case Study: Rwanda’, Operations Evaluation Department (OPEV) High Level Evaluations Division (OPEV.2), March 2011.
An Agenda for Peace (1992) Preventive diplomacy, peacemaking and peace-keeping, A/47/277 — S/24111 http://www.unrol.org/files/A_47_277.pdf
Barnett, M., Kim, H., Madalene O’Donnell, M., and Sitea, L. ‘Peacebuilding: What Is in a Name?’ Global Governance, vol.13, no.1 (2007) 35-58
Berdal, Mats ‘The United Nations, Peacebuilding, and the Genocide in Rwanda’ Global Governance, 11 (2005) 115-130
Beswick, Danielle ‘Aiding State Building and Sacrificing Peace Building? The Rwanda-UK Relationship 1994-2011’ Third World Quarterly, Voume 32, Number 10, (2011) 1911-1930
Call, Charles. T ‘Knowing Peace When You See It: Setting Standards for Peacebuilding Success’ Civil Wars, Volume 10 (2008) 173-194
Chalmers, M. (2004). Spending to Save ? An Analysis of the Cost-effectiveness of Conflict Prevention, (June).
Chalmers, M. (2005). Working Paper 3 : SPENDING TO SAVE : Prospective Case Studies, (April).
Chemouni, B. (2014) ‘Explaining the design of the Rwandan decentralization: elite vulnerability and the territorial repartition of power’, Journal of Eastern African Studies, 8:2, pp.246-262
Department for International Development (2011), ‘DFID’s Approach to Value for Money (VfM)’
Ed. Zelizer, C, (2013) Integrated Peacebuilding, Innovative approaches to transforming conflict, Westview Press, Spring 2013
Edmonds, M, Mills, G & McNamee, T (2009) ‘Disarmament, Demobilization and Reintegration and Local Ownership in the Great Lakes: The Experience of Rwanda, Burundi, and the Democratic Republic of Congo’, African Security, 2:1, pp29-58
Fitz-Gerald, A.M (2012) ‘SSR and Peacebuilding: Thematic Review of Security Sector Reform (SSR) to Peacebuilding and the Role of the Peacebuilding Fund’, UNPBSO
Gaarder, M., Annan, J., & Bank, W. (2013). Impact Evaluation of Conflict Prevention and Peacebuilding Interventions. World Bank Policy Research Working Paper, (WPS6496), 29.
Gacaca Courts, Ministry of Justice, http://www.minijust.gov.rw/uploads/media/GACACA_COURTS_IN_RWANDA.pdf
Goldstein, M. (World B. (n.d.). An introduction to Impact Evaluation Markus Goldstein Poverty Reduction Group The World Bank.
GSDRC, (2010) ‘Statebuilding and Peacebuilding in Situations of Conflict and Fragility’
GSDRC, (2015) ‘Indicators for Conflict, Stability, Security, Justice, and Peacebuilding’ Helpdesk Research Report
Hegre, H., Nygard, H.M., Strand, H., Gates, S., Flaten, R.D., (2001) ‘ The Conflict Trap’
High-Level Panel on Humanitarian Financing Report to the Secretary-General (2016) ‘Too Important to Fail — Addressing the Humanitarian Financing Gap’
Holvoet, N. & Rombouts, H. (2008) ‘The challenge of monitoring and evaluation under the new aid modalities: experiences from Rwanda’, The Journal of Modern African Studies, 46(4), pp.577-602
Hyslop, D, (IEP), Murray, A. (IEP), Theodore, C. (IEP), Schreuder, J. (IEP), & Brinkman, H.-J. (IEP). (2016). Stocktaking of Global Peacebuilding Expenditures.
Institute for Economics and Peace, Economic cost of violence containment, 2014 URL: http://economicsandpeace.org/wp-content/uploads/2015/06/The-Economic-Cost-of-Violence-Containment.pdf
Joint Utstein Study of Peacebuilding: National report on Germany (2003) Commissioned by the Evaluation Division of the German Federal Ministry for Economic Cooperation and Development (BMZ)
Kee, J. E. (1999). Evaluating Collaboratives: Challenges and Practice. The Evaluation Exchange — Harvard Family Research Project, V(2), 1–20.
Lambourne, Wendy ‘Transitional Justice and Peacebuilding After Mass Violence’ The International Journal of Transitional Justice, Volume 3, 2009, 28-48
Lawry-White, S (2003) ‘Review of the UK Government Approach to Peacebuilding’ Contribution to the Joint Utstein Study of Peacebuilding
MacGinty, R (ed) (2013) Routledge Handbook of Peacebuilding, Routledge
66MEASURING PEACEBUILDING COST-EFFECTIVENESS

Menkhaus, K. (2007). Impact assessment in post-conflict peacebuilding, (July), 19. Retrieved from papers2://publication/uuid/A23B2175-4E1A-4AE0-9CF0-D715DD10E00F
MINECOFIN, 2016, Ministry of Finance and Economic Planning Republic of Rwanda, http://www.minecofin.gov.rw/index.php?id=37
OECD (2015), States of Fragility 2015: Meeting Post-2015 Ambitions, OECD Publishing, Paris. http://dx.doi.org/10.1787/9789264227699-en
OECD/DAC. (2007) ‘2006 Survey on Monitoring the Paris Declaration: Rwanda chapter’, Paris: OECD/DAC.
Peacebuilding 2.0, Mapping the Boundaries of an expanding field, Alliance for Peacebuilding, Fall 2012. http://www.allianceforpeacebuilding.org/site/wp-content/uploads/2013/08/AfP-Mapping-Report_online_FINAL.pdf
Peacebuilding Support Office. (2010). UN Peacebuilding: an Orientation, 51. Retrieved from http://www.un.org/en/peacebuilding/pbso/pdf/peacebuilding_orientation.pdf
Research Report on the Gacaca, Report VI: From camp to hill, the reintegration of released prisoners, PRI with the support of the Department for International Development (DfID), May 2014.
Rwanda Demobilisation and Reintegration Commission (RDRC), http://www.demobrwanda.org.rw/81.0.html
Rwanda Vision 2020 (2000) Republic of Rwanda Ministry of Finance and economic planning, Kigali July 2000, http://www.sida.se/globalassets/global/countries-and-regions/africa/rwanda/d402331a.pdf
Rwanda Vision 2020: Revised 2012 (2012) Republic of Rwanda, http://www.minecofin.gov.rw/index.php?id=148
Samset, Ingrid ‘Building a Repressive Peace: The Case of Post-Genocide Rwanda’ Journal of Intervention and Statebuilding, Volume 5, Number 3 (2011)
Schabas, W.A. (2005) ‘Genocide Trials and Gacaca Courts’, Journal of International Criminal Justice,
Schrerrer, V. (DCAF). (2012). Measuring the Impact of Peacekeeping Missions on Rule of Law and Security Institutions, 23.
Smith, D (2004) Towards a Strategic Framework for Peacebuilding: Getting Their Act Together: Overview report of the Joint Utstein Study of Peacebuilding, Evaluation Report 1/2004, Utenriksdepartementet Ministry of Foreign Affairs, April 2004. Available at: https://www.regjeringen.no/globalassets/upload/kilde/ud/rap/2004/0044/ddd/pdfv/210673-rapp104.pdf
Smith, Dan (2004) ‘Towards a Strategic Framework for Peacebuilding: Getting Their Act Together’, Overview report of the Joint Utstein study of Peacebuilding
The Challenge of Sustaining Peace, Report of the Advisory Group of Experts for 2015 review of the United Nations Peacebuilding Architecture (2015). http://www.un.org/en/peacebuilding/pdf/150630%20Report%20of%20the%20AGE%20on%20the%202015%20Peacebuilding%20Review%20FINAL.pdf
United Nations (2009) Report of the Secretary General on Peacebuilding in the immediate aftermath of conflict. http://www.un.org/en/peacebuilding/pbso/pdf/s2009304.pdf
United Nations (2012) The Justice and Reconciliation Process in Rwanda, Outreach Programme on the Rwanda Genocide and the United Nations, Published by the Department of Public Information, March 2012 http://www.un.org/en/preventgenocide/rwanda/pdf/bgjustice.pdf
USAID (2012) Foreign Operations FY 2012 Performance Report. http://www.usaid.gov/sites/default/files/documents/1870/FY%202012%20APR%20FY%202014%20APP_FINAL_4-2-2013.pdf
Wilén, N (2012) A Hybrid Peace through Locally Owned and Externally Financed ssr-ddr in Rwanda?, Third World Quarterly, 33:7, pp1323-1336
Wilen, Nina (2012) ‘A Hybrid Peace through Locally Owned and Externally Financed SSR-DDR in Rwanda?’ Third World Quarterly, Volume 33, Number 7, 1323-1336
67MEASURING PEACEBUILDING COST-EFFECTIVENESS

END NOTES
1. The Challenge of Sustaining Peace, Report of the Advisory Group of Experts for the 2015 review of the United Nations Peacebuilding Architecture, 29 June 2015, United Nations
2. Walter, B “Conflict Relapse and the Sustainability of Post-Conflict Peace”, World Development Report 2011, Background Paper: “civil wars have a surprisingly high recidivism rate. Of the 103 countries that experienced some form of civil war between 1945 [and] 2009 […], only 44 avoided a subsequent return to civil war”.
3. All reference to “Kosovo”, whether to the territory, institutions or population, should be understood in full compliance with Security Council resolution 1244 (1999) and without prejudice to the status of Kosovo.
4. The Challenge of Sustaining Peace, Report of the Advisory Group of Experts for 2015 review of the United Nations Peacebuilding Architecture (2015).
5. World Bank, Breaking the Conflict Trap (2003) — On figure 3.10 p. 83 (2002): the risk of civil war is nearly twice higher at the dawn of peace (43.6 per cent) than at the eve of civil war (24.8 per cent) — https://openknowledge.worldbank.org/bitstream/handle/10986/13938/567930PUB0brea10Box353739B01PUBLIC1.pdf?sequence=1
6. 3ie ‘The current state of peacebuilding programming and evidence’, April 2015, joint initiative of IPA and World Bank
7. Smith, D (2004) “Towards a Strategic Framework for Peacebuilding: Getting Their Act Together”, Evaluation Report
8. Ibid.
9. Gross ODA is on average 20 to 25 percent higher than net ODA. Gross becomes net once repayments of the principal on loans made in prior years (but not interest) are taken into account, as well as offsetting entries for forgiven debt and any recoveries made on grants. OECD does not provide net ODA figures along CRS codes.
10. OECD, April 2015, “Development aid stable in 2014 but flows to poorest countries still falling”, Media Release http://www.oecd.org/dac/stats/development-aid-stable-in-2014-but-flows-to-poorest-countries-still-falling.htm
11. Categories for which a figure could be found in the domestic budgets
12. Note this is calculated by the minimum of commitments over the period of analysis from 1995-2014. This number is in fact double the disbursements allocated to Rwanda from 2005 to 2015. Disbursement data was not used as it was not available from 1995 to 2005.
13. Smith, D (2004) Towards a Strategic Framework for Peacebuilding, Joint Utstein Study of Peacebuilding: National report on Germany (2003) Commissioned by the Evaluation Division of the German Federal Ministry for Economic Cooperation and Development (BMZ)
14. Ibid.
15. Wilen, Nina (2012) ‘A Hybrid Peace through Locally Owned and Externally Financed SSR-DDR in Rwanda?’ Third World Quarterly, Volume 33, Number 7, 1323-1336
16. Commitment Data only, as disbursement data was only available from 2005 to 2014.
17. Edmonds, Mills & McNamee, 2009
18. Ibid
19. Wilen, 2012
20. Edmonds, Mills & McNamee, 2009
21. Gacaca Courts, Ministry of Justice, http://www.minijust.gov.rw/uploads/media/GACACA_COURTS_IN_RWANDA.pdf
22. Ibid
23. UN, 2012
24. DFID, 2014
25. Schabas, 2005
26. ibid
27. African Development Bank Group, 2011
28. Holvoet & Rombouts, 2008
29. ibid
30. Vision 2020, 2012
31. MINECOFIN, 2016, Ministry of Finance and Economic Planning Republic of Rwanda, http://www.minecofin.gov.rw/index.php?id=37
32. MINECOFIN, 2016; African Development Bank Group (2011) ‘Evaluation of Policy Based Operations in the African Development Bank, 1999-2009: Country Case Study: Rwanda’, Operations Evaluation Department (OPEV) High Level Evaluations Division (OPEV.2), March 2011.
33. Chemouni, B. (2014) ‘Explaining the design of the Rwandan decentralization: elite vulnerability and the territorial repartition of power’, Journal of Eastern African Studies, 8:2, pp.246-262
34. Department for International Development (2011), ‘DFID’s Approach to Value for Money (VfM)’
35. ibid
36. ibid
37. ibid
38. Auto-Regressive Integrated Moving Average: ARIMA models combine autoregressive models with moving average models to predict future values of the time series, in this case the cost of conflict. Using a unit root test a suitable order for auto-regression and moving average as well as the degree of differencing was determined. Different models were used for each country determined by the time series of the cost of conflict for that country.
39. Brown, AN, McCollister, F, Cameron, DB, Ludwig, J, 2015. The current state of peacebuilding programming and evidence. 3ie scoping paper 2, available at: http://www.3ieimpact.org/media/filer_public/2016/08/05/3ie_scoping_paper_2.pdf
40. See Chris Blattman’s website for all his research and data: http://chrisblattman.com/
41. Blattman, Christopher and Annan, Jeannie, Can Employment Reduce Lawlessness and Rebellion? A Field Experiment with High-Risk Men in a Fragile State (June 12, 2015). Available at SSRN:https://ssrn.com/abstract=2431293 or http://dx.doi.org/10.2139/ssrn.2431293
42. Blattman, Christopher and Jamison, Julian C. and Sheridan, Margaret, Reducing Crime and Violence: Experimental Evidence from Cognitive Behavioral Therapy in Liberia (October 18, 2016). Available at SSRN:https://ssrn.com/abstract=2594868 or http://dx.doi.org/10.2139/ssrn.2594868
68MEASURING PEACEBUILDING COST-EFFECTIVENESS
AVAILABLE FOR DOWNLOAD AT WWW.ECONOMICSANDPEACE.ORG
Other publications from the Institute for Economics and Peace
Pillars of PeaceInstitute for Economics and Peace, Sept 2013
Pillars of Peace is a new conceptual framework for
understanding and describing the factors that create
a peaceful society.
The Economic Cost of Violence ContainmentInstitute for Economics and Peace, Feb 2014
A new methodology that calculates the cost of preventing
and containing violence in over 150 countries.
2014 Global Peace IndexInstitute for Economics and Peace, Feb 2014
The 2014 GPI Report analyses the state of peace
around the world and identifies countries most at risk
of becoming less peaceful.
A GLOBAL STATISTICAL ANALYSIS ON THE EMPIRICAL LINK BETWEEN PEACE AND RELIGION
The Link between Peace and ReligionInstitute for Economics and Peace, Oct 2014
A global statistical analysis on the empirical link
between peace and religion.
2014
MEASURING AND UNDERSTANDING THE IMPACT OF TERRORISM
2014 Global Terrorism Index ReportInstitute for Economics and Peace, Nov 2014
The 2014 Global Terrorism Index Report analyses the
impact of terrorism in 162 countries and identifies the
social, economic and political factors associated with it.
2015 Mexico Peace IndexInstitute for Economics and Peace, Mar 2014
The Mexico Peace Index measures the state of peace in
all 32 Mexican states analysing trends and drivers of
peace over the last decade.
Peace and CorruptionInstitute for Economics and Peace, May 2015
The relationship between peace and corruption is
statistically significant, as corruption is a leading
indicator of peace.LOWERING CORRUPTION
— A TRANSFORMATIVE FACTOR FOR PEACE
GlobalPeaceIndex
2016 Positive Peace ReportInstitute for Economics and Peace, Aug 2016
This report investigates the eight domains of Positive Peace,
why they are important, and how they work together to
reduce levels of violence and improve resilience.
2016 Global Peace IndexInstitute for Economics and Peace, June 2016
A statistical analysis of the state of peace in 163
countries outlining trends in peace and conflict, the
economic cost of violence, and an assessment of SDG 16.
2015 Global Peace IndexInstitute for Economics and Peace, June 2015
A statistical analysis of the state of peace in
162 countries and an assessment of the attitudes,
structures and institutions that sustain peaceful
societies.
2015 Positive Peace ReportInstitute for Economics and Peace, Oct 2015
This report introduces new thinking and evidence
about Positive Peace. It includes the Positive Peace
Index, which measures Positive Peace in 162 countries,
covering 99 per cent of the world’s population.
CONCEPTUALISING AND MEASURING THE ATTITUDES, INSTITUTIONS AND STRUCTURES
THAT BUILD A MORE PEACEFUL SOCIETY
2015 Global Terrorism IndexInstitute for Economics and Peace, Nov 2015
The 2015 Global Terrorism Index Report analyses the
impact of terrorism in 162 countries and identifies the
social, economic and political factors associated with it.MEASURING AND UNDERSTANDING THE IMPACT OF TERRORISM
2016 Mexico Peace IndexInstitute for Economics and Peace, Apr 2016
The 2016 Mexico Peace Index analyses Mexico’s progress
in improving peacefulness from the height of the drug war
through 2015.
Radical RealismInstitute for Economics and Peace, Sept 2015
Twelve interviews with peacebuilders on developing the
attitudes, institutions and structures of Positive Peace
in Mexico.
12 ENTREVISTAS CON CONSTRUCTORES DE PAZ

MAR 2017 / IEP REPORT 46
9 780994 603470 >
ISBN 978-0-9946034-7-0
IEP is an independent, non-partisan, non-profit think tank dedicated to shifting the world’s focus to peace as a positive, achievable, and tangible measure of human well-being and progress.
IEP has offices in Sydney, New York, The Hague and Mexico City. It works with a wide range of partners internationally and collaborates with intergovernmental organizations on measuring and communicating the economic value of peace.