Embed Size (px)
Citation preview

IEEE P
roof
IEEE JOURNAL OF BIOMEDICAL AND HEALTH INFORMATICS, VOL. 00, NO. 00, 2018 1
Measuring Oxygen Saturation With SmartphoneCameras Using Convolutional Neural Networks
1
2
Xinyi Ding , Damoun Nassehi, and Eric C. Larson3
Abstract—Arterial oxygen saturation (SaO2) is an indi-4cator of how much oxygen is carried by hemoglobin in the
Q1
5blood. Having enough oxygen is vital for the functioning of6cells in the human body. Measurement of SaO2 is typically7estimated with a pulse oximeter, but recent works have8investigated how smartphone cameras can be used to9infer SaO2. In this paper, we propose methods for the mea-10surement of SaO2 with a smartphone using convolutional11neural networks and preprocessing steps to better guard12against motion artifacts. To evaluate this methodology, we13conducted a breath-holding study involving 39 participants.14We compare the results using two different mobile phones.15We compare our model with the ratio-of-ratios model that16is widely used in pulse oximeter applications, showing that17our system has significantly lower mean absolute error18(2.02%) than a medical pulse oximeter.19
Index Terms—Convolutional neural networks, mobile20sensing, oxygen saturation.21
I. INTRODUCTION22
W ITH various embedded sensors, mobile devices like23
smartphones and tablets have been increasingly used as24
out-of-the-clinic health care platforms. Such mobile health care25
platforms enable physiological parameters like blood pressure,26
heart rate, and arterial oxygen saturation (SaO2) to be measured27
more frequently, without travel to a health clinic. Re-purposing28
sensors on a mobile phone for health care sensing has been in-29
vestigated by a number of researchers: Mehta et al. used the ac-30
celerometer of smartphone to detect voice disorders [1]. Kaiser31
et al. utilized the smart phone built in audio sensor to capture32
signals from a vortex whistle to track pulmonary function [2].33
Chandrasekaran et al. used smartphones to estimate blood pres-34
sure [3] and Scully et al. used smartphones to measure oxygen35
saturation [4]. In this work, we also measure oxygen satura-36
tion using smartphone cameras, investigating methods that use37
convolutional neural networks for automatically extracting fea-38
tures from spatially averaged video streams of a participant’s39
finger.40
Manuscript received August 13, 2018; revised October 31, 2018 andNovember 16, 2018; accepted December 13, 2018. (Corresponding au-thor: Xinyi Ding.)
X. Ding and E. C. Larson are with the Department of Computer Scienceand Engineering, Southern Methodist University, Dallas, TX 75205 USA(e-mail:,[email protected]; [email protected]).
D. Nassehi is with digiDoc Technologies, 4372 Egersund, Norway(e-mail:,[email protected]).
Digital Object Identifier 10.1109/JBHI.2018.2887209
Convolutional neural networks have been used to solve many 41
practical problems in the biomedical field. For example, mea- 42
surement of various physiological signals like pupil dilation [5] 43
and blood pressure [3]. We propose using 1D convolutional 44
neural networks for regressing oxygen saturation. To train and 45
evaluate our model, we conducted an IRB-approved human sub- 46
jects study with 39 participants. We show that convolutional 47
networks are able to achieve better estimates of Sp O2 than the 48
most common methodology, the ratio-of-ratios model [4], when 49
measuring on mobile devices. The contributions of our work are 50
five-fold: 51
1) We combine large motion detection with Singular Value 52
Decomposition (SVD) technique to remove motion arti- 53
facts and impute sensors stream quantities, which is more 54
robust than the previous work [6]. 55
2) We investigate a number of different convolutional neural 56
network architectures for their ability to measure oxygen 57
saturation from mobile phone videos. 58
3) We conduct a 39 participant human study and show that 59
our model is able to achieve significantly better Sp O2 60
estimates than the ratio-of-ratios model [4]. 61
4) We evaluate our proposed model on two different devices 62
and show that results for each device are similar. 63
5) We investigate the use of different video frame rates, 64
showing that the methods work similarly in the range 65
from 30FPS to 240FPS. 66
II. PULSE OXIMETRY PRIMER AND RELATED WORK 67
Mobile technology touches every aspect of our daily lives, 68
from gaming to social life. The accessibility of mobile devices 69
makes them a natural choice for health care delivery. Based 70
on a report from Centers for Medicare and Medicaid Services 71
(CMS) [7], the U.S. health care costs were $3.3 trillion in 2016, 72
which equals 17.9 percent of GDP that year and it is projected 73
that spending will grow 5.3 percent per year until 2024. The 74
U.S. health care system could save up to $7 billion a year by 75
using mobile health apps according to IQVIA [8]. Mobile health 76
apps could provide users more immediate and more frequent 77
feedback about their health conditions and, thus, have gained 78
popularity in recent years. Pulse oximetry measurement from 79
mobile phones is no exception to this trend. 80
Oxygen is vital for the functioning of cells in our body. Nor- 81
mally, the oxygen saturation of a healthy individual is above 82
95%. If the oxygen saturation level drops below 95%, it is a 83
strong indicator of oxygen delivery imbalance [9]. Extremely 84
2168-2194 © 2018 IEEE. Personal use is permitted, but republication/redistribution requires IEEE permission.See http://www.ieee.org/publications standards/publications/rights/index.html for more information.

IEEE P
roof
2 IEEE JOURNAL OF BIOMEDICAL AND HEALTH INFORMATICS, VOL. 00, NO. 00, 2018
Fig. 1. Experimental setup of ground truth pulse oximetry data collec-tion and custom phone application.
low oxygen saturation could lead to hypoxia. However, oxy-85
genation can be used as a indicator for other diseases. For in-86
stance, oxygen delivery imbalance could be the result of diseases87
like pneumonia and asthma, for which pulse oximetry can be88
used to differentiate them from less severe illnesses like the89
common cold [9].90
Hemoglobin is a protein that helps deliver oxygen molecules91
to our body through the circular system. One hemoglobin cell92
can carry up to four oxygen molecules and, when this occurs, it is93
called oxyhemoglobin (HbO2). When there are fewer than four94
molecules, it is called deoxyhemoglobin or reduced hemoglobin95
(Hb). The arterial oxygen saturation SaO2 in blood can be esti-96
mated using the following equation:97
Sa O2 = cHbO2
cHbO2 + cHb100%
Here, cHbO2 is the concentration of oxyhemoglobin and cHb98
is the concentration of deoxyhemoglobin. Although there are99
other kinds of hemoglobins like methemoglobin and carboxy-100
hemoglobin, their concentration levels are sufficiently low and101
can be safely ignored when calculating the SaO2.102
The gold standard for measuring SaO2 is a gas chromatograph103
[10]. However, this process is invasive and requires a blood104
sample, which makes it unsuitable for continuous measurement.105
Takuo Aoyagi [11] first proposed exploiting the pulsation of106
arterial blood to measure oxygen saturation, thus this technique107
is called pulse oximetry and the measurement device is called a108
pulse oximeter.109
Pulse oximeters are the most widely used devices for mea-110
suring oxygen saturation in hospitals, critical care units, and111
homes. The measurement from a pulse oximeter is typically112
written as Sp O2. Sp O2 and SaO2 are highly correlated, usually113
with discrepancy less than 3% provided the SaO2 is above 70%114
[11]. The most widely implemented model used in pulse oxime-115
ters is called the ratio-of-ratios model [11]. In this model, two116
LEDs are shown onto the finger at 660 nm red light and 940 nm117
infrared light with detectors on the opposite side of the finger.118
Oxyhemogoblin and deoxyhemoglobin have different extinction119
coefficient rates for these two wavelengths as shown in Fig. 2. By120
Fig. 2. Extinction coefficients for different wavelength lights.
analyzing the light incidents measured by each detector, oxygen 121
saturation level can be estimated. We briefly derive the ratio-of- 122
ratios model here using the same notation as used in [11]. 123
During systole, the arteries have increased blood compared 124
to diastole. When shining light on the finger, this results in 125
changing the path that light travels through before encountering 126
the detector. The light path consists of two biological areas [11]: 127
The first area we denote as dDC which does not change in terms 128
of time t . This area mainly contains tissue, venous blood, and 129
non-pulsatile arterial blood. The second area is the pulsatile 130
arterial blood which changes in terms of time t . Let dmin denote 131
the minimum path of the pulsatile arterial blood the light has 132
to pass through (diastole) and dmax denote the maximum path 133
(systole). Using Beer-Lambert’s law, we have 134
IH = αe−βdmin
IL = αe−βdmax
where
α = I0e−εDC (λ)cDC dDC
β = εHb(λ)cHb + εHbO2 (λ)cHbO2
where I0 is the incident light and λ refers to the wavelength of 135
light. During diastole, the path is minimal, thus the transmitted 136
light has large amplitude (IH ). During systole, the transmitted 137
light has small amplitude (IL ). If we let %d = dmax − dmin, then 138
the light intensity that reaches the detector can be expressed as: 139
I = IH e−β%d
The ratio of absorption of two lights is given by R in equation (1). 140
If we assume the two different lights have the same path length 141
through the finger then the %d cancels and we can rearrange 142
the equation to get equation (2), containing the SaO2 term. This 143
assumption simplifies the derivation of the ratio-of-ratios model. 144
In practice, a calibration process is usually required. 145
R = At,660
At,940= ln (IL ,660/IH,660)
ln (IL ,940/IH,940)(1)
R = εHb(λ660) + [εHbO2 (λ660) − εHb(λ660)]Sa O2
εHb(λ940) + [εHbO2 (λ940) − εHb(λ940)]Sa O2(2)
IEEE P
roof
DING et al.: MEASURING OXYGEN SATURATION WITH SMARTPHONE CAMERAS USING CONVOLUTIONAL NEURAL NETWORKS 3
Petersen et al. [9] applied this ratio-of-ratios model using146
an external sensor that connected to a mobile phone headphone147
jack. The Phone-based oximeter required a conventional clinical148
oximeter finger sensor, which sent collected data through the149
audio headset interface to the smartphone. The smartphone was150
used as a data analysis platform.151
Scully et al. [4] used a similar model, given in equation (3)152
to estimate the oxygen saturation using a mobile phone camera.153
Their system did not require the clinical sensor and, instead,154
used the built-in flash and red/blue channels of the camera. The155
main difference is that they used the blue channel instead of156
infrared and normalize each measure by the DC value.157
Sp O2 = A − BACRE D/DCRE D
ACBLU E/DCBLU E(3)
where A and B must be found through calibration. The ratio-of-158
ratios model simplifies the situation by ignoring the light scat-159
tering issue, thus a calibration process is required [11]. Reddy160
et al. [12] proposed a calibration free model. Their model as-161
sumes portions of the signal to be linear, which is an opti-162
mistic assumption and usually results in reduced performance in163
practice.164
One major issue when estimating oxygen saturation from165
a finger is motion artifacts that mask the signal differences be-166
tween systole and diastole. Yadhuraj et al. [13] compared differ-167
ent motion artifact removal techniques and found two techniques168
that usually work better in practice: Singular value decomposi-169
tion (SVD) [6] and Fourier series analysis [14]. Both techniques170
attempt to recreate the signal cycle-by-cycle. In our work, we171
modify the SVD method to make it more robust to large motion172
artifacts, detailed later on.173
Researchers have also investigated remote oxygen satura-174
tion measurement techniques [15]–[17]. Their methods typi-175
cally employ detecting a user’s face and using the RGB camera176
and ambient light to estimate differences between systole and177
diastole on the surface of the skin. However, these remote mea-178
surement techniques require the user to sit in a fixed position179
and have distance limitations. Moreover, the signals are often180
more noisy, resulting in decreased performance.181
III. EXPERIMENTAL PROCEDURES182
To evaluate our model, we conducted an human subjects study183
involving 39 participants (male = 27, female = 12, ag e = 18–184
30), approved by university IRB, Study ID H17-146-LARE. All185
participants were college students who identified as not having186
pulmonary or heart diseases. Fig. 1 shows the set up of the187
experiment with a custom iPhone data collection application and188
ground truth pulse oximeter. All experiments were conducted in189
a controlled room on campus.190
During the experiment, participants sat in a comfortable chair191
with all equipment on a desk in front of them. Optionally, the192
participant could elect to perform some physical activity before193
the experiment (such as jumping jacks), which can help to de-194
oxygenate the blood more quickly when the participant holds195
their breath. The participant took the following measurements:196
Baseline measurement: A pulse oximeter (Nellcor PM10N 197
[18]) was clamped on the participant’s right index finger. The 198
pulse oximeter reports the Sp O2 once per second and has an 199
accuracy of ±2% when the oxygenation level is above 70%. At 200
the same time, the camera of an iPhone 6 s was placed on the 201
right middle finger and the white LED torch was turned on. A 202
black cloth was placed in between the middle and index finger 203
to prevent light transference between the oximeter and torch. 204
The brightness of the white LED was set to 20% to prevent 205
overheating (found by trial and error for keeping the torch lit 206
for extended periods without discomfort). The participant was 207
asked to keep their hand as still as possible for the duration of 208
the experiment. The participant then breathed normally for 30 209
seconds. Oxygen saturation and heart rate were collected during 210
this time. 211
Breath-Holding: After 30 seconds, the participant was asked 212
to hold their breath as long as they could, to the point that it 213
caused some discomfort. The participant was asked not to move 214
while holding their breath as this can influence the accuracy 215
of the oxygen measurement. Once the participant determines 216
that they cannot hold their breath any longer, they are asked to 217
breath normally until they feel ready to repeat the procedure. 218
The participant was allowed to take a break at anytime (or 219
discontinue if they felt overly fatigued). 220
The above baseline and breath-holding experiments were con- 221
ducted three times for each participant. After completing three 222
iterations for the iPhone 6 s, we repeat the above procedure 223
using an iPhone 7 Plus. The reason for doing this is because we 224
wanted to investigate the effect of the longer distance between 225
the camera and flash of the iPhone 7 Plus. The iPhone 7 plus 226
has two cameras, telephoto and wide-angle. We only use the 227
telephoto because it is closer to the white LED. For the iPhone 228
7 Plus, we changed the brightness level of the torch to 60% 229
to increase strength signal. The iPhone 7 Plus can sustain 60% 230
torch brightness without discomfort (compared to the iPhone 231
6 s that required 20% brightness; both measure found through 232
informal trial and error). We set the frames per second (FPS) 233
of the camera to the maximum allowed by the firmware, which 234
is 240 for both iPhone 6 s and iPhone 7 Plus. The recording 235
format was also set to use lossless compression. However, due 236
to limited computing resources and the time required to stream 237
the lossless video to file, the FPS could not maintain 240FPS 238
while running our application. The actual frame rate recorded 239
was about 220FPS for the iPhone 6 S, on average, and about 240
235FPS for the iPhone 7 Plus. To eliminate issues with frame 241
rate, we interpolate to 240 FPS using linear interpolation before 242
any further processing. 243
This session, which includes consenting the participant and 244
data collection, took approximately 30 minutes to complete. The 245
participant was asked to complete the entire session twice on two 246
different days. For involvement in the study, we gave participants 247
a $10 gift card for finishing both sessions. For iPhone 6 s, we 248
recorded 39 participants’ data, resulting in a total of 34,716 249
seconds. The average of each iteration was 156 seconds. For 250
the iPhone 7 Plus, we recorded 37 participants’ data, with total 251
32,521 seconds. The average of each iteration was 154 seconds. 252
Fig. 3 shows the distribution of all Sp O2 values recorded during 253
IEEE P
roof
4 IEEE JOURNAL OF BIOMEDICAL AND HEALTH INFORMATICS, VOL. 00, NO. 00, 2018
Fig. 3. SpO2 distribution of all participants.
Fig. 4. Flowchart of data processing.
the experiments from the ground truth pulse oximeter (reported254
at once per second). Counts are grouped by whether they are255
taken during baseline measurement or during breath-holding.256
Most values during the baseline period are above 95%. During257
breath holding, the values varies from 73% to 100%. However,258
we noticed the recovery is very fast once the participant stops259
holding their breath, so there are not so many low Sp O2 values260
in the histogram.261
IV. METHOD262
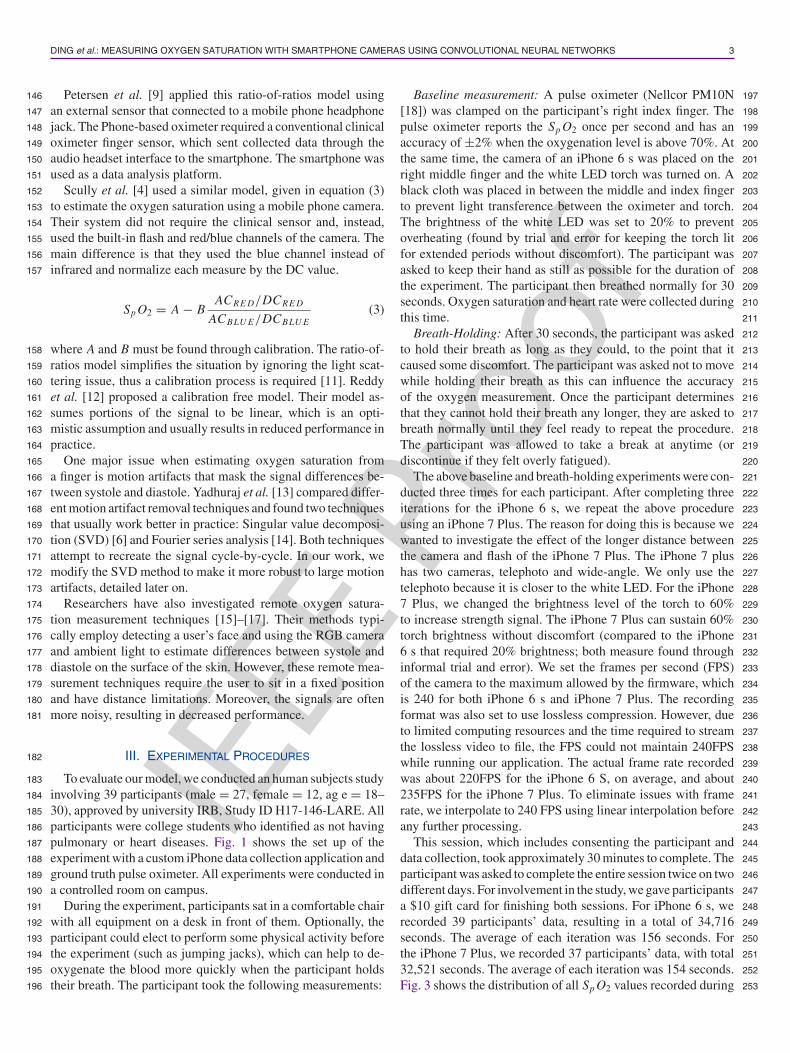
Fig. 4 gives an overview of our data processing pipeline. We263
first convert RGB frames to photoplethysmography (PPG) sig-264
nals by averaging pixel values from candidate regions of interest265
(ROIs). Each ROI is a square area in the frame of the video. Two266
competing approaches are investigated for calculating the PPG267
signal from candidate ROIs. The first approach is to average268
pixel values from the middle 100 × 100 window. The second269
approach is to first divide the frame into 16 × 16 different ROIs270
(320 × 180 per ROI). The final signal is a weighted average271
of the different ROIs, where each weight is calculated from the272
signal to noise ratio (SNR) of a given ROI, as follows:273
P PGt,i = SN Rt,i
&i SN Rt,iRO It,i (4)
SN Rt,i =µRO It,i
σRO It,i
(5)
Our weighted averaged method is similar to that used by274
Gauzzi et al. [15]. However, we use a simpler SNR equation275
because we notice the texture of fingertip is relatively uniform276
compared to captured videos from the face used in [15]. We 277
compared these two approaches showing that they perform ap- 278
proximately equal (discussed further in the result section). 279
A. Motion Artifact Removal 280
Even though the participants are asked to remain still dur- 281
ing data collection, we notice there are many motion artifacts, 282
especially during the seconds immediately before the oxygen 283
saturation level is lowest. This is understandable because the 284
participant is maximally discomforted during these seconds. 285
Based on a survey paper [13], there are two popular methods 286
for motion artifact removal from the PPG: Fourier analysis [14] 287
and Singular Value decomposition (SVD) [6]. Both methods try 288
to recreate the new signal cycle-by-cycle. The Fourier analysis 289
method requires a good estimate of the heartrate period, which 290
is impractical when there is a considerably large motion. As 291
such, we decided to use the SVD method and modify it to make 292
it more robust to large motion artifacts. Intuitively, the idea of 293
SVD method is to create a matrix where each row is a period of 294
the PPG signal. Ideally, the rank of this matrix would be singu- 295
lar because all subsequent rows are repetitions of the first (and 296
thus only one eigenvalue of the matrix would be non-zero). The 297
specifics of the SVD methods are as follows: we first reshape 298
the signal into a matrix with row length approximately equal to 299
the period, 300
X =
⎡
⎢⎢⎢⎢⎣
x(1) x(2) ... x(n)
x(n + 1) x(n + 2) ... x(2n)...
... ......
x(nm − n + 1) x(mn − n + 2) ... x(mn)
⎤
⎥⎥⎥⎥⎦
In the ideal situation, the first eigenvalue of the matrix will 301
be nonzero and all other eigenvalues will be zero. However, 302
because of noise and slight irregularities in the PPG signal, all 303
eigenvalues will be nonzero. Thus, we vary the row length n and 304
calculate the ratio of the first two eigenvalues. When this ratio 305
is maximized, n should approximately match the actual period 306
of the heart rate. 307
When applying the SVD method, there is a fixed size window 308
(8 seconds for example) working like a queue. The window 309
of data is reshaped to a matrix and the best row length, n, is 310
found. We then average all the rows in the matrix to create a 311
“new” cycle, and replace the first n samples with this average 312
cycle. Finally, n samples are removed from the queue and n 313
new samples are added to the end of the queue, and the process 314
repeats. In this way, motion artifacts are replaced by the average 315
of cycles in a window. 316
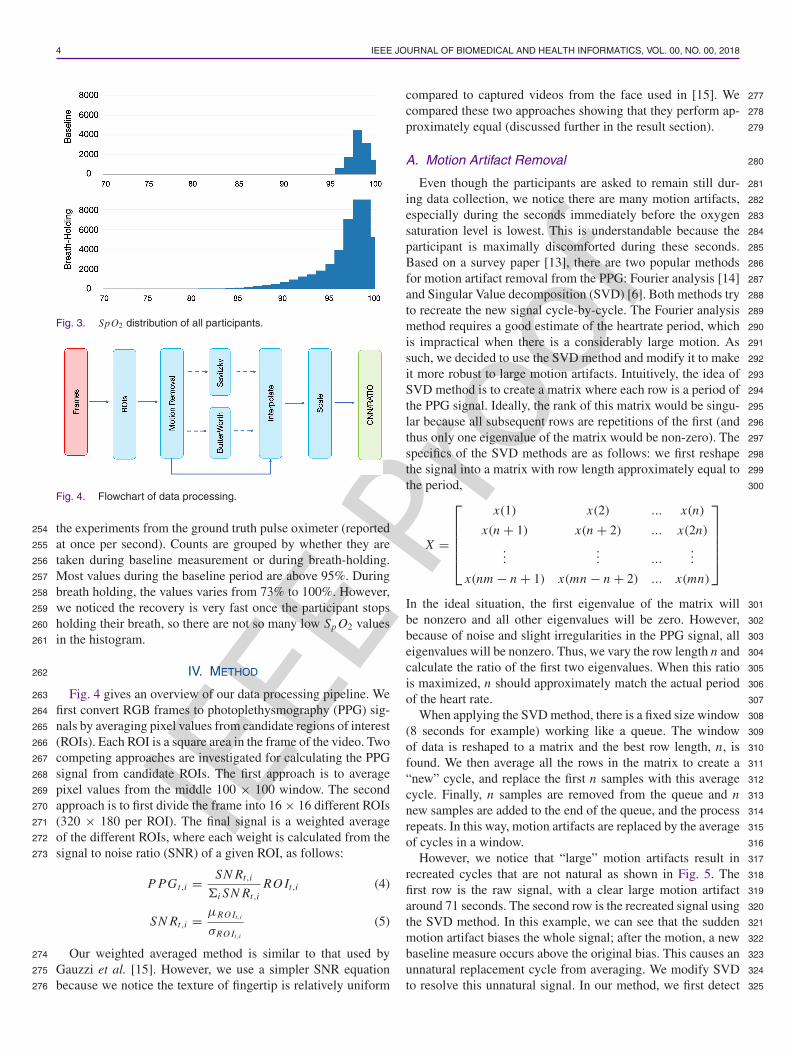
However, we notice that “large” motion artifacts result in 317
recreated cycles that are not natural as shown in Fig. 5. The 318
first row is the raw signal, with a clear large motion artifact 319
around 71 seconds. The second row is the recreated signal using 320
the SVD method. In this example, we can see that the sudden 321
motion artifact biases the whole signal; after the motion, a new 322
baseline measure occurs above the original bias. This causes an 323
unnatural replacement cycle from averaging. We modify SVD 324
to resolve this unnatural signal. In our method, we first detect 325
IEEE P
roof
DING et al.: MEASURING OXYGEN SATURATION WITH SMARTPHONE CAMERAS USING CONVOLUTIONAL NEURAL NETWORKS 5
Fig. 5. Comparison of signals using different artifact removal methods.Bottom: our proposed method.
large motion artifacts and then shift the signal by a margin. To326
detect the motion artifacts, we use a similar method as in [19]:327
we first calculate the average gradient of the PPG signal in half328
second windows. If two consecutive windows’ average gradient329
differs by more than 50%, we flag that window as containing a330
motion artifact. We then calculate the mean difference between331
the previous and immediately following five heart rate cycles.332
We shift the signals after the motion artifact up/down by this333
mean difference, effectively removing any sustained shift in the334
bias of the signal due to motion. Furthermore, we alter the pro-335
cess for replacing cycles from the original SVD method. When336
constructing the signal matrix, if we detect there are motion337
artifacts in a coming cycle, we do not add this amount of data338
to the SVD matrix but use the following same amount of data339
before calculating the average. We perform this simplification340
because we notice that neighboring cycles are typically similar341
in shape and it is difficult to recover signals having large motion342
artifacts. As we can see in Fig. 5 (bottom), using our method,343
the recreated signal is visibly more natural.344
B. Filtering345
The resulting PPG signal includes a tremendous amount of346
information. When processing the PPG signal for heart rate or347
or heart rate variability, we usually apply a bandpass filter to348
detrend the signal and the signal is often inverted [19], [20].349
However, we observe that, for the red channel, the trend of the350
PPG signal decreases as the oxygen saturation level decreases.351
This agrees with the fact that as the oxygen saturation decreases,352
there will be more deoxyhemoglobin and less oxyhemoglobin.353
Deoxyhemoglobin absorbs more red light than oxyhemoglobin,354
which results in less red light that reaches the camera. This355
makes us hypothesize that this bias information is also important356
for estimating the Sp O2. Therefore, we decompose the signal357
into bandpass and lowpass filtered versions. We calculate the358
Fig. 6. 1D Convolutional Neural Network Architecture. Best parametersfound through grid search.
bandpass version by applying a Butterworth bandpass filter from 359
0.7 HZ to 4 HZ, traditionally used in the calculation of the 360
PPG signal. The bias is calculated through lowpass filtering 361
the signal using a Savitzky-Golay filter (10 seconds, order 3). 362
We run experiments with these signals used as input features, 363
investigating if there is any advantage to using them separately, 364
combined, or using the unfiltered raw signal. Before sending 365
these data into the model, they are interpolated to be 240 samples 366
per second and scaled to have zero mean and unit standard 367
deviation. We do not invert the signal, because we believe the 368
convolutional neural network can learn such information from 369
the input data. 370
C. Convolutional Network Architecture 371
After preprocessing, we have a raw PPG signal, bandpass 372
filtered signal, and bias signal for each color channel. In order 373
to extract features automatically from these signal streams, we 374
investigate the use of Convolutional Neural Networks or CNNs. 375
CNNs are feedforward neural networks with filtering layers that 376
are learned via back-propagation. Each convolutional layer ap- 377
plies a multiple convolution operations to the input, concatenates 378
the results, and passes these results to the next layer. More inter- 379
ested readers can refer to [21]. Fig. 6 gives the overview of our 380
1-D convolutional neural network model. Compared with the 381
ratio-of-ratios model that only uses two wavelengths of light, 382
we input all three channel data, keeping as much information as 383
possible. Our network consists of two temporal convolutional 384
layers comprised of max pooling and 25% dropout (to help 385
mitigate overfitting). The number of convolutional layers was 386
investigated as a hyperparameter. The input window size, filters, 387
and filter length are also considered hyperparameters. We use 388
a cross validated grid search process to find the best combina- 389
tion of hyperparameters (a total of 3800 parameter combina- 390
tions were investigated). The best hyperparameters are shown 391
in Fig. 6. We use both dropout and early stopping to prevent 392
overfitting and optimize our model in mini-batches using adap- 393
tive momentum (ADAM) [22]. We implemented our convolu- 394
tional neural network models using Python 3.5 and Tensorflow 395
1.2 [23]. We trained our models on a cluster of 36 nodes each 396
having 256 GB memory and accelerated by an NVIDIA P100 397
GPU. Total training time for the grid search took approximately 398
4 weeks. 399

IEEE P
roof
6 IEEE JOURNAL OF BIOMEDICAL AND HEALTH INFORMATICS, VOL. 00, NO. 00, 2018
TABLE IOVERALL RESULTS COMPARISON
V. RESULTS400
For each model, we cross validate training and testing data401
using leave-one-participant-out for each phone. That is, when402
testing on a given participant, we never use their data in train-403
ing the models and we use training and testing data within a404
particular device (6s or 7 Plus). Table I gives the overall results405
comparison of different models and devices averaged over the406
39 participants (37 participants for iPhone 7 Plus). When com-407
paring the ground truth pulse oximeter to the predicted Sp O2,408
we report the root mean square error (RMSE) and mean absolute409
error (MAE).410
As mentioned, we also investigate using different input411
streams for the convolutional architecture: Raw PPG, Butter-412
worth bandpass filtered (BW), and Butterworth bandpass fil-413
tered with bias term from a Savitsky-Golay filter (BW + Bias).414
Moreover, we augment the training data using an oversampling415
technique during training, which will be explained in next sub-416
section. In the raw PPG case, the model learns from the three417
RGB channels only, but in the BW+Bias case, it learns from 6418
channels (three channels for the BW filtered signal and three419
channels for the bias). We can see the results of using the But-420
terworth filtered PPG signal (BW) is typically the worst convo-421
lutional network performer, but the difference is not significant.422
All convolutional approaches perform similarly—however the423
Raw PPG and BW+Bias signals are more consistent which sup-424
ports a conclusion that separating the Bias and bandpass com-425
ponents of the signal is unnecessary. Thus, we suggest using426
the Raw PPG signal to reduce computational complexity and let427
the model optimize a strategy for extracting filter-based features428
automatically.429
Also apparent from Table I, the estimates from the iPhone 7430
Plus are slightly worse than from the iPhone 6 s. This is true431
for both the ratio-of-ratios model and convolutional models.432
Even though we use the telephoto camera, which is closer to433
the white LED, the signal is still not as strong as that from the434
iPhone 6 s. However, the convolutional model is better than the435
ratio-of-ratios model (based on an F-test of residual variance,436
p < 0.01) and the mean absolute error is within an acceptable437
range compared with the pulse oximeter that has ±2% error438
from the SaO2.439
Fig. 7 shows a box and swarm plot comparison of RMSE440
and MAE for all users from the ratio model and convolutional441
model (Raw PPG). We observe there are more outliers on the442
iPhone 7 Plus. The measures for the convolutional architecture443
are visibly better than the ratio-of-ratios model and the differ-444
ence is significant based on an F-test of the residual variance445
(p < 0.01).446
Fig. 7. Root Mean Square Error (RMSE) and Mean Absolute Error(MAE) comparison of iPhone 6 s and iPhone 7 Plus using the convolu-tional model (Raw PPG) and the ratio-of-ratios method.
Fig. 8. Convolutional (Raw PPG) model prediction results from differentparticipants. Top: predictions from three participants when oxygen levelis above 85%. Middle: predictions from three participants when oxygensaturation level goes below 85% Bottom: predictions from the samethree participants when oxygen level goes below 85% but with dataaugmentation.
Fig. 8 top and middle row gives six iterations of breath- 447
holding from six different participants. We can clearly see that 448
when the participants start to hold their breath at around 30 449
seconds, the oxygen saturation level does not decrease imme- 450
diately. It takes different amount of time to drop for different 451
participants, which is due to how quickly oxygen is consumed 452
by each participant. In the top row, we can see, our model fol- 453
lows the true value quite well when the oxygen saturation level 454
is above 85%. However, in the middle row, when the oxygen 455
saturation level drops below 85%, our CNN model tends to 456
predict higher Sp O2 values. One reason for this is because of 457
our breathe-holding experimental setup, it is difficult to obtain 458
training data below 85%. This could be solved by using a more 459
controlled hypoxic environment but greatly increases the risks 460
associated with the experiment. 461

IEEE P
roof
DING et al.: MEASURING OXYGEN SATURATION WITH SMARTPHONE CAMERAS USING CONVOLUTIONAL NEURAL NETWORKS 7
Fig. 9. Modified Bland-Altman plot for all participants using the iPhone6 S after data augmentation. Red dash boxed points are from one singleparticipant.
One interesting observation is from Participant ID 3000462
shown in Fig. 8 top right. At around 110 seconds, there is an463
increase in the oxygen saturation level, which means the partici-464
pant may have taken a breath involuntarily and the convolutional465
model is able to capture this.466
A. Data Augmentation467
In previous analyses the predictions of our current model bias468
towards normal values because there are fewer “low oxygen”469
training points. Due to the biased nature of the data we are col-470
lecting, it is difficult to create a truly unbiased training dataset.471
Thus, we created a nearly unbiased dataset by 1) Reducing the472
baseline data to 10 seconds instead of using the entire 30 sec-473
onds. 2) We calculate the portions of data in each period and474
augment by reusing part of iterations while maintaining the time475
series properties. For example, if there are fewer training points476
in period 85–90, then, we augment our data by reusing (oversam-477
pling) a continuous part of an iteration that it is approximately478
in this range. Moreover, we used data from different participants479
for augmentation, avoiding some participants from being vastly480
overrepresented in the training data.481
We only augment our data for training folds—the testing482
data is not manipulated. As we can see from Fig. 8, bottom,483
our model is able to predict oxygen saturation levels below484
85% more consistently. However, we also notice the RMSE485
and MAE increased to 2.81% and 2.19% as listed in Table I.486
As discussed above, the data points below 90% include more487
motion artifacts because participants are more likely to move488
while breathe-holding, especially when the experiment become489
uncomfortable. Thus by oversampling these training points, we490
are also including more motion artifacts. This performance de-491
crease is more severe for iPhone 7plus when the signal is already492
noisy before augmentation.493
Fig. 9 shows the modified Bland-Altman Plot of all partici-494
pants of our best convolutional model for iPhone 6 s (the x-axis495
is not the mean of the two devices, but is instead the ground496
truth measurement) with data augmentation. Because the497
training labels from pulse oximeter are integer values only,498
Fig. 10. Convolutional (Raw PPG) model prediction using differentFPS.
we can see there are some gap between points in the plot. 499
The 95% prediction intervals (PI) for the plot are as follows 500
(µ ± 1.96 × σ ): 501! For all points the PI is (−7.02, 4.04). 502! When Sp O2 is 95%—100% the PI is (−6.49, 2.43) 503! When Sp O2 is 90%—95% the PI is (−6.01, 5.85). 504! When Sp O2 is 85%—90% the PI is (−2.22, 9.22). 505
As we can see, the augmented model tends to predict in- 506
creased values compared to the ground truth when the oxygen 507
saturation level drops below 90%. However, without data aug- 508
mentation these prediction intervals are noticeably worse for 509
low oxygen saturation levels. The red dash boxed points are 510
from one single participant. It is the only participant that has 511
oxygen saturation level below 80% in our dataset. Since we are 512
using leave one subject out cross validation, there are no training 513
points below 80% when predicting this user, which explains the 514
large prediction errors. 515
B. Compare Different FPS 516
Modern smart phones allow video recording at high frequency 517
to support “slow motion” capture. When designing our exper- 518
iment, we exploit this advantage, hoping to get as much data 519
as possible for our CNN model. However, it is unclear if this 520
high FPS recording is advantageous for the CNN model—it is 521
possible that there might be simply redundant data when cap- 522
turing at a high FPS. As a further analysis, we downsampled 523
our 240FPS signal to 30FPS, 60FPS and 120FPS and trained 524
new CNN models for each framerate. Boxplots of the RMSE 525
and MAE are given in Fig. 10. We observe similar boxplots 526
regardless of the FPS. This supports a conclusion that the CNN 527
model can achieve similar predictions even if the capture rate is 528
only 30FPS. 529
C. Discussion 530
All the results reported are from the estimate of the PPG 531
calculated from the center 100 × 100 ROI. When comparing this 532
estimate to the weighted average of ROIs, the result are nearly 533
identical. We hypothesize this is because the texture distribution 534

IEEE P
roof
8 IEEE JOURNAL OF BIOMEDICAL AND HEALTH INFORMATICS, VOL. 00, NO. 00, 2018
of the fingertip is quite uniform, such that each ROI is likely535
to include the same amount of information. Thus, weighted536
averaging of ROIs is unnecessary when capturing data from the537
finger.538
Signal processing techniques like motion artifact detection539
and filtering are computationally intensive, especially for mobile540
devices. Modern smart phones are equipped with a number of541
sensors, including an accelerometer and gyroscope. The built542
in accelerometer on modern smartphones is fairly sensitive and543
could capture motion artifacts independent of the camera. Such544
processing methods could be key for performing motion artifact545
removal in real-time.546
One limitation of convolutional networks is that they require547
many example data to properly train. Because we train a CNN548
for each smartphone type, it is unclear if a generalizing CNN549
model can be trained that generalizes across smartphones. We550
leave this analysis to future work.551
VI. CONCLUSION552
In this paper, we conducted a systematic analysis of mea-553
suring oxygen saturation on mobile phones with convolutional554
neural networks. We combined SVD motion artifact removal555
with motion detection to create more natural signals at extreme556
conditions. We conducted a breath-holding human subjects ex-557
periment involving 39 participants to evaluate our model. We558
compared the results from two different mobile phones that559
have different distances between the camera and light source.560
Using leave-one-participant-out cross validation, our model is561
able to achieve better results than the commonly used ratio-of-562
ratios method, with mean absolute error of 2.02% compared to563
a medical pulse oximeter.564
REFERENCES565
[1] D. D. Mehta, M. Zanartu, S. W. Feng, H. A. Cheyne II, and R. E. Hillman,566“Mobile voice health monitoring using a wearable accelerometer sensor567and a smartphone platform,” IEEE Trans. Biomed. Eng., vol. 59, no. 11,568pp. 3090–3096, Nov. 2012.569
[2] S. Kaiser et al., “Design and learnability of vortex whistles for managing570chronic lung function via smartphones,” in Proc. ACM Int. Joint Conf.571Pervasive Ubiquitous Comput., 2016, pp. 569–580.572
[3] V. Chandrasekaran, R. Dantu, S. Jonnada, S. Thiyagaraja, and K. P. Subbu,573“Cuffless differential blood pressure estimation using smart phones,” IEEE574Trans. Biomed. Eng., vol. 60, no. 4, pp. 1080–1089, Apr. 2013.575
[4] C. G. Scully et al., “Physiological parameter monitoring from optical576recordings with a mobile phone,” IEEE Trans. Biomed. Eng., vol. 59,577no. 2, pp. 303–306, Feb. 2012.578
[5] C. Wangwiwattana, X. Ding, and E. C. Larson, “Pupilnet, measuring 579task evoked pupillary response using commodity RGB tablet cameras: 580Comparison to mobile, infrared gaze trackers for inferring cognitive load,” 581Proc. ACM Interactive, Mobile, Wearable Ubiquitous Technol., vol. 1, 582no. 4, 2018, Art. no. 171. 583
[6] K. A. Reddy and V. J. Kumar, “Motion artifact reduction in photoplethys- 584mographic signals using singular value decomposition,” in Proc. IEEE 585Instrum. Meas. Technol. Conf., 2007, pp. 1–4. 586
[7] “Historical” Centers for Medicare & Medicaid Services, Balti- 587more, MD, USA. Accessed: May 17, 2018. [Online]. Available: 588https://tinyurl.com/cm5jfk4 589
[8] “Medicine use and spending in the U.S. A review of 2017 and outlook to 5902022,” IQVIA, Durham, NC, USA. Accessed: May 17, 2018. [Online]. 591Available: https://tinyurl.com/ydatt7bx 592
[9] C. L. Petersen, T. P. Chen, J. M. Ansermino, and G. A. Dumont, “Design 593and evaluation of a low-cost smartphone pulse oximeter,” Sensors, vol. 13, 594no. 12, pp. 16882–16893, 2013. 595
[10] F. ABL800, “reference manual. 201206.” Q2596[11] J. G. Webster, Design of Pulse Oximeters. Boca Raton, FL: CRC Press, 597
1997. 598[12] K. A. Reddy, B. George, N. M. Mohan, and V. J. Kumar, “A novel 599
calibration-free method of measurement of oxygen saturation in arterial 600blood,” IEEE Trans. Instrum. Meas., vol. 58, no. 5, pp. 1699–1705, May 6012009. 602
[13] S. Yadhuraj and H. Harsha, “Motion artifact reduction in photoplethysmo- 603graphic signals: A review,” Int. J. Innovative Res. Develop., vol. 2, no. 3, 604pp. 626–640, 2013. 605
[14] K. A. Reddy, B. George, and V. J. Kumar, “Use of fourier series analysis for 606motion artifact reduction and data compression of photoplethysmographic 607signals,” IEEE Trans. Instrum. Meas., vol. 58, no. 5, pp. 1706–1711, May 6082009. 609
[15] A. R. Guazzi et al., “Non-contact measurement of oxygen saturation with 610an RGB camera,” Biomed. Opt. Express, vol. 6, no. 9, pp. 3320–3338, 6112015. 612
[16] L. Kong et al., “Non-contact detection of oxygen saturation based on 613visible light imaging device using ambient light,” Opt. Express, vol. 21, 614no. 15, pp. 17464–17471, 2013. 615
[17] D. Shao et al., “Noncontact monitoring of blood oxygen saturation using 616camera and dual-wavelength imaging system,” IEEE Trans. Biomed. Eng., 617vol. 63, no. 6, pp. 1091–1098, 2016. 618
[18] “Nellcor PM10N portable SPO2 patient monitoring system infosheet,” 619Medtronic, Minneapolis, MN, USA. Accessed: Jun. 17, 2018. Available: 620https://tinyurl.com/y7tq9xrh 621
[19] R.-C. Peng, X.-L. Zhou, W.-H. Lin, and Y.-T. Zhang, “Extraction of heart 622rate variability from smartphone photoplethysmograms,” Comput. Math. 623Methods Med., vol. 2015, 2015, Art. no. 516826. 624
[20] S. Lopez and R. Americas, “Pulse oximeter fundamentals and de- 625sign,” Freescale Semiconductor Inc. Application Note Document Number 626AN4327 Rev. 2, 2011. 627
[21] A. Krizhevsky, I. Sutskever, and G. E. Hinton, “Imagenet classification 628with deep convolutional neural networks,” in Proc. Adv. Neural Inf. Pro- 629cess. Syst., 2012, pp. 1097–1105. 630
[22] D. P. Kingma and J. Ba, “Adam: A method for stochastic optimization,” 6312014, arXiv:1412.6980. 632
[23] M. Abadi et al., “Tensorflow: A system for large-scale machine learning,” 633in Proc. 12th USENIX Conf. Operating Syst. Des. Implementation, 2016, 634pp. 265–283. 635

![Saturation overshoot and hysteresis for twophase ow in ...hilfer/... · for many applications [1{10]. [2323.1.2] Despite its popularity the accepted macroscopic theory of two phase](https://img.pdfslide.us/doc/110x75/5e6f7de0a89b897c3463f687/saturation-overshoot-and-hysteresis-for-twophase-ow-in-hilfer-for-many.jpg)