Embed Size (px)
Citation preview
Measuring Outcomes in Behavioral Health: What, When & How
June 2013
Andrew Bertagnolli, PhD
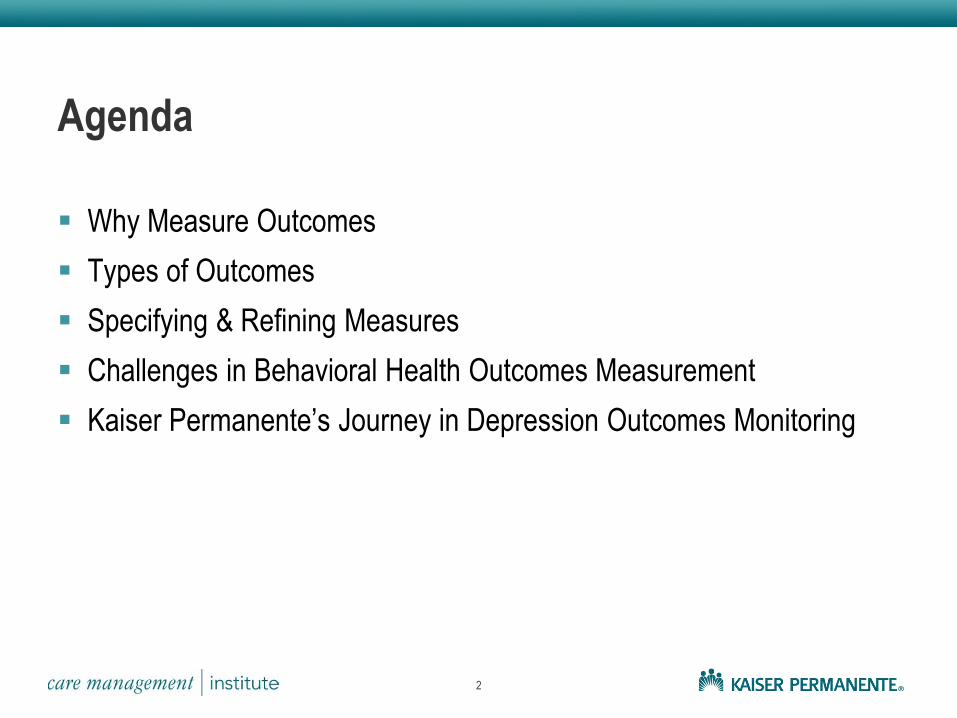
Agenda
Why Measure Outcomes
Types of Outcomes
Specifying & Refining Measures
Challenges in Behavioral Health Outcomes Measurement
Kaiser Permanente’s Journey in Depression Outcomes Monitoring
2
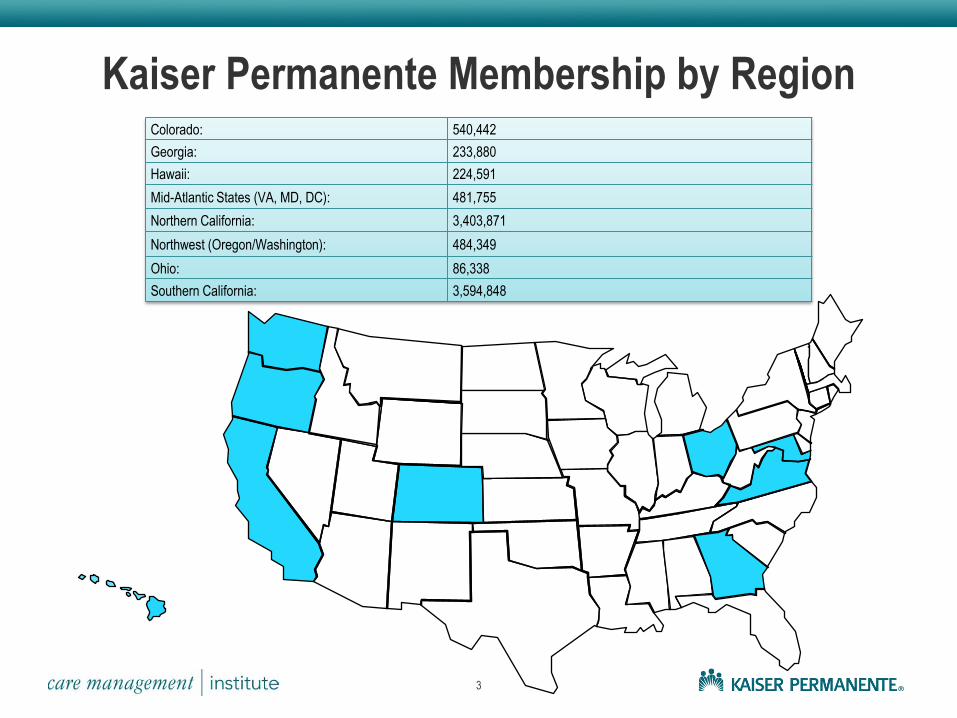
Kaiser Permanente Membership by Region Colorado: 540,442
Georgia: 233,880
Hawaii: 224,591
Mid-Atlantic States (VA, MD, DC): 481,755
Northern California: 3,403,871
Northwest (Oregon/Washington): 484,349
Ohio: 86,338
Southern California: 3,594,848
3
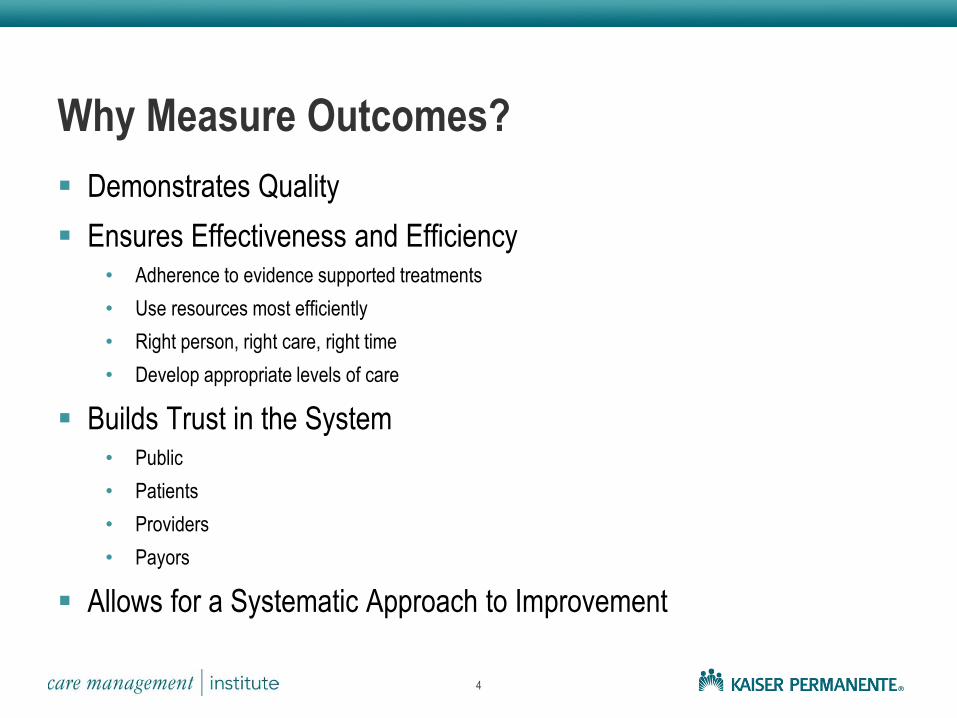
Why Measure Outcomes?
Demonstrates Quality
Ensures Effectiveness and Efficiency • Adherence to evidence supported treatments
• Use resources most efficiently
• Right person, right care, right time
• Develop appropriate levels of care
Builds Trust in the System • Public
• Patients
• Providers
• Payors
Allows for a Systematic Approach to Improvement
4

What is Quality?
A measure of whether services increase the likelihood of desired mental health
outcomes and are consistent with evidence-based practice.
5
World Health Organization, 2003
6
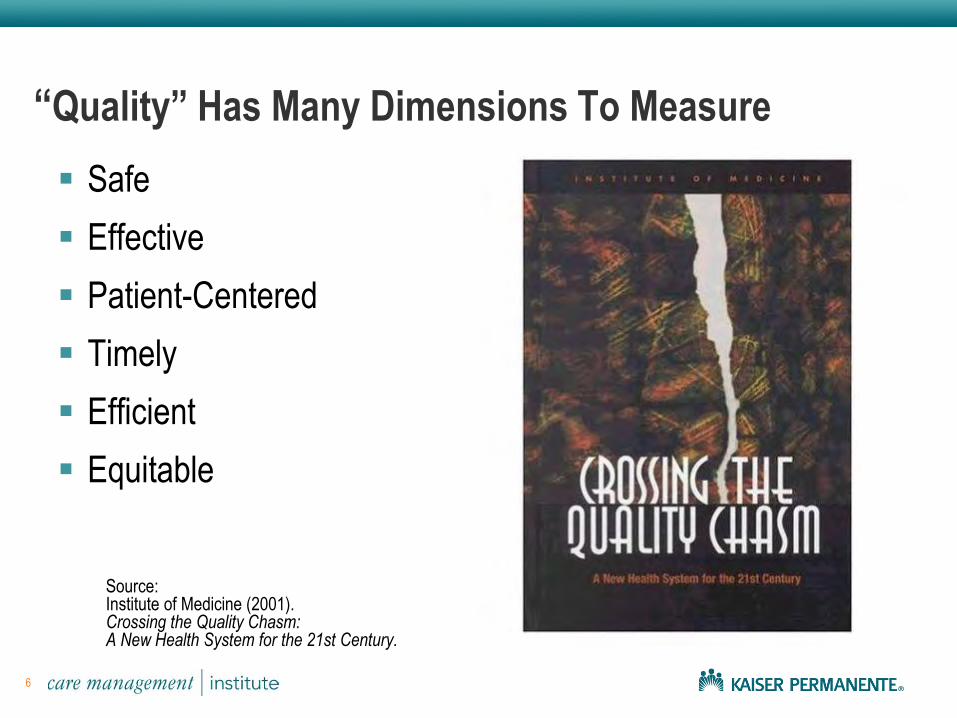
“Quality” Has Many Dimensions To Measure
Safe
Effective
Patient-Centered
Timely
Efficient
Equitable
Source: Institute of Medicine (2001). Crossing the Quality Chasm: A New Health System for the 21st Century.
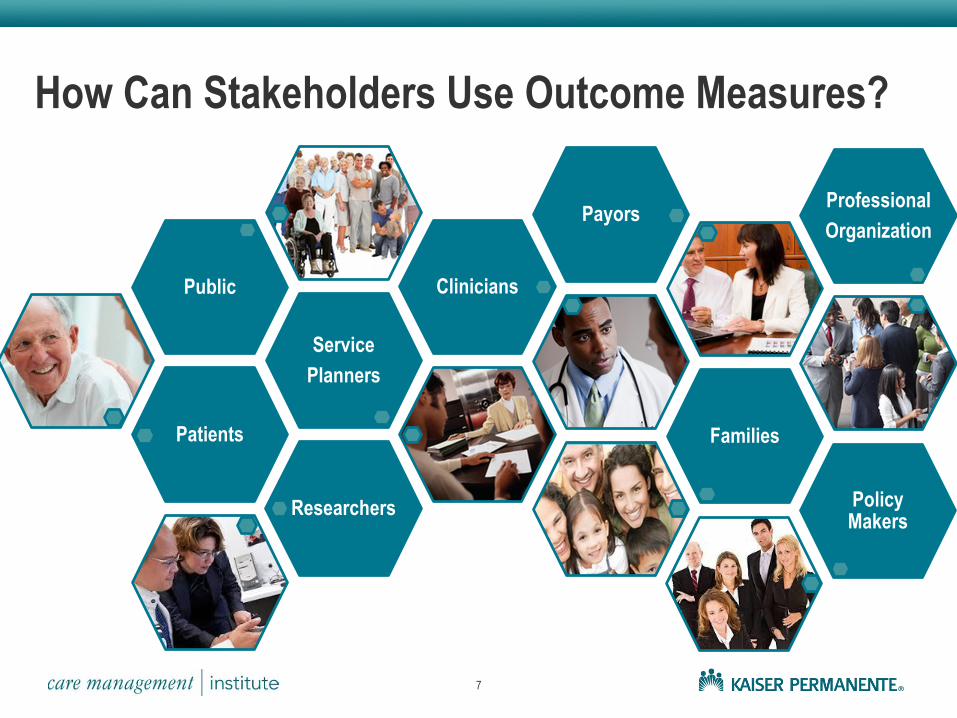
How Can Stakeholders Use Outcome Measures?
7
Patients
Service
Planners
Public Clinicians
Payors
Families
Researchers Policy Makers
Professional
Organization
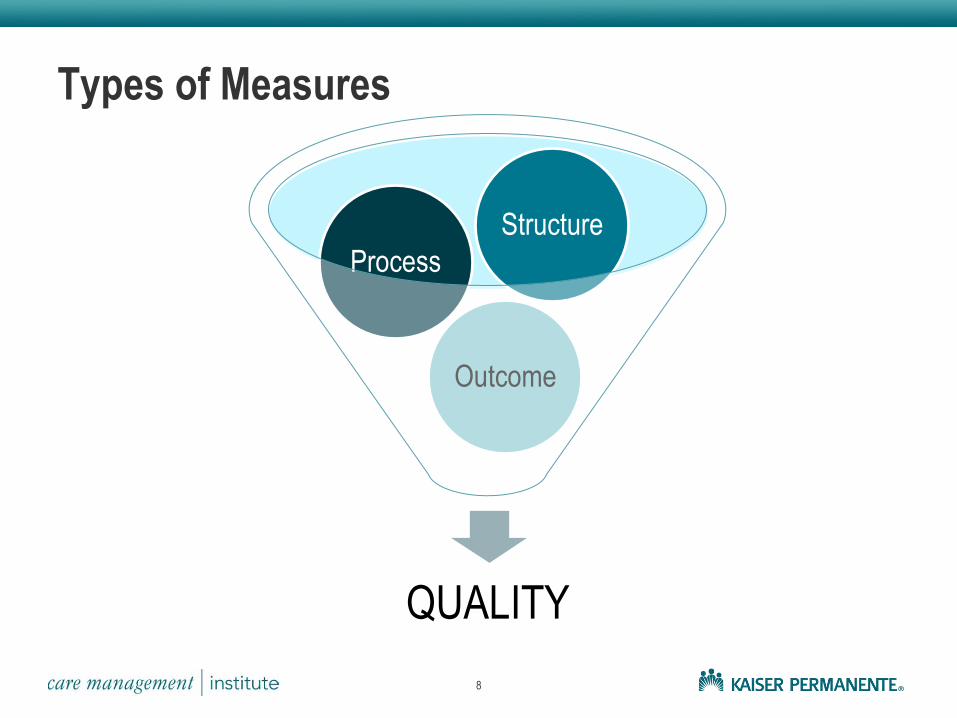
Types of Measures
8
QUALITY
Outcome
Process
Structure
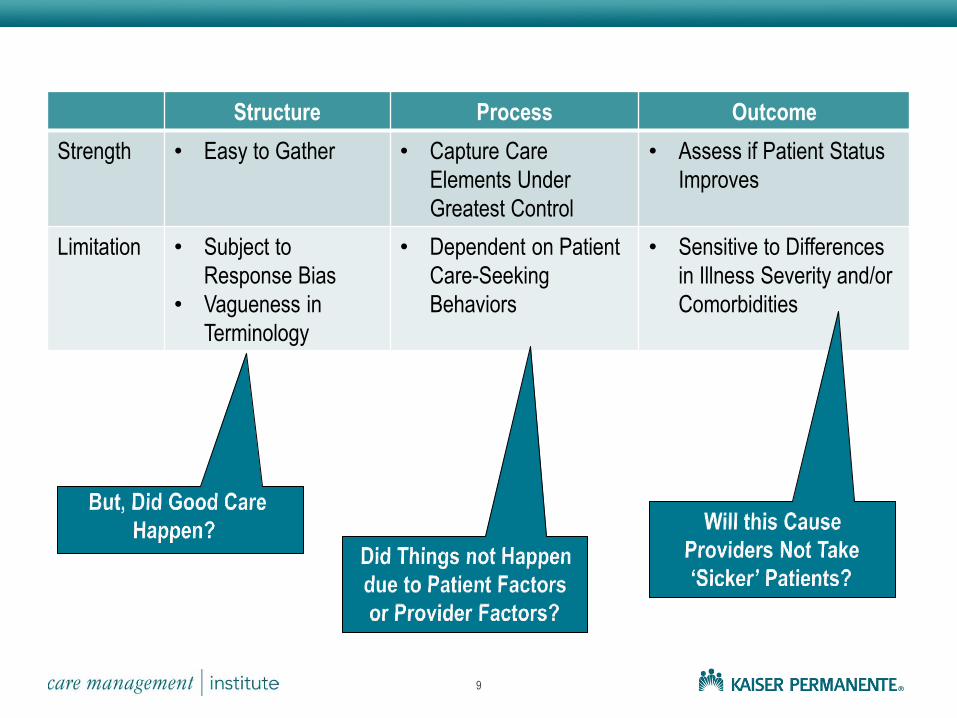
Structure Process Outcome
Strength • Easy to Gather • Capture Care
Elements Under
Greatest Control
• Assess if Patient Status
Improves
Limitation • Subject to
Response Bias
• Vagueness in
Terminology
• Dependent on Patient
Care-Seeking
Behaviors
• Sensitive to Differences
in Illness Severity and/or
Comorbidities
9
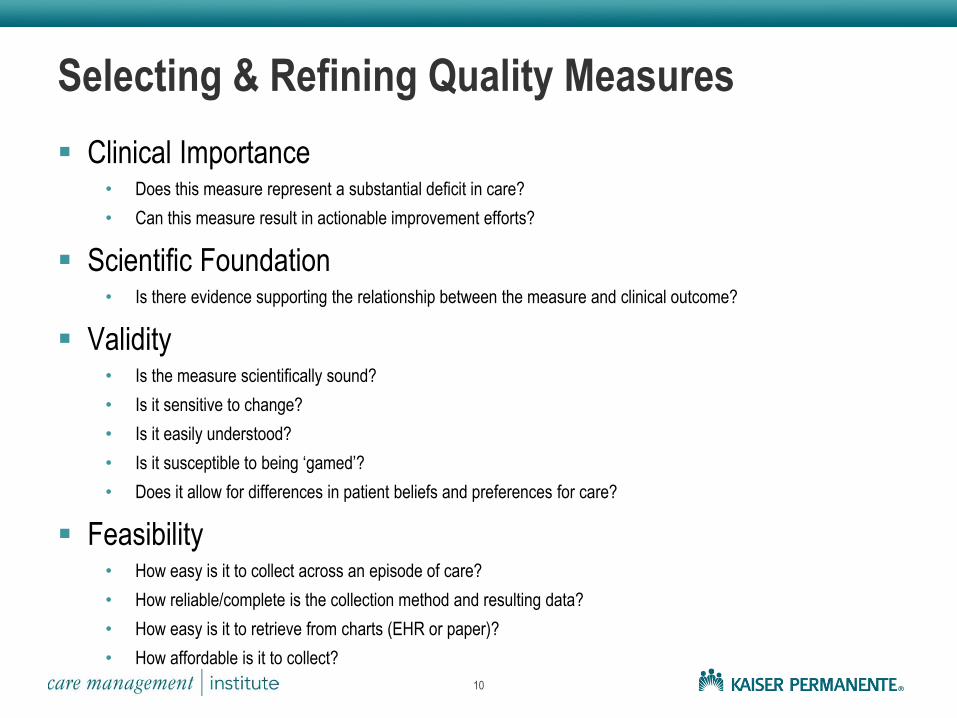
Selecting & Refining Quality Measures
Clinical Importance • Does this measure represent a substantial deficit in care?
• Can this measure result in actionable improvement efforts?
Scientific Foundation • Is there evidence supporting the relationship between the measure and clinical outcome?
Validity • Is the measure scientifically sound?
• Is it sensitive to change?
• Is it easily understood?
• Is it susceptible to being ‘gamed’?
• Does it allow for differences in patient beliefs and preferences for care?
Feasibility • How easy is it to collect across an episode of care?
• How reliable/complete is the collection method and resulting data?
• How easy is it to retrieve from charts (EHR or paper)?
• How affordable is it to collect?
10
11
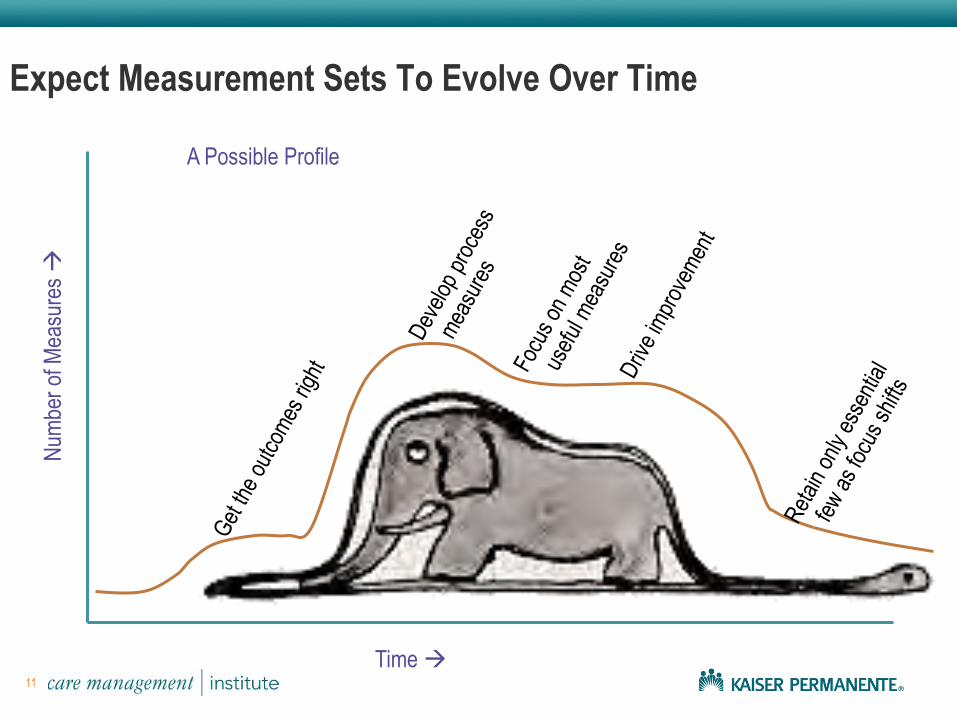
Expect Measurement Sets To Evolve Over Time
Time
Num
ber
of M
easu
res
A Possible Profile
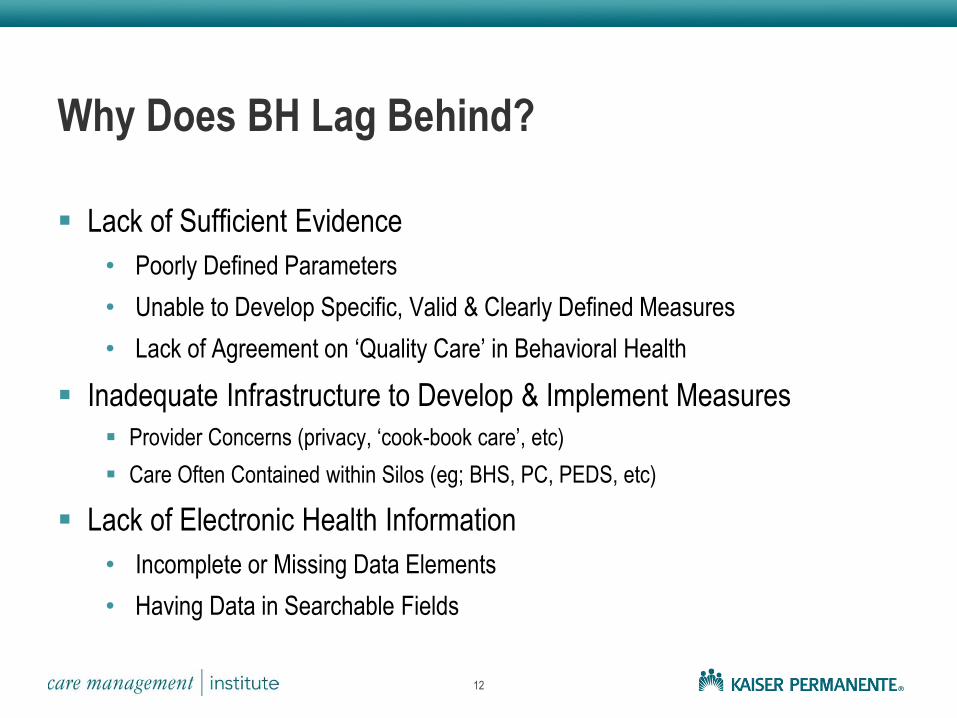
Why Does BH Lag Behind?
Lack of Sufficient Evidence
• Poorly Defined Parameters
• Unable to Develop Specific, Valid & Clearly Defined Measures
• Lack of Agreement on ‘Quality Care’ in Behavioral Health
Inadequate Infrastructure to Develop & Implement Measures
Provider Concerns (privacy, ‘cook-book care’, etc)
Care Often Contained within Silos (eg; BHS, PC, PEDS, etc)
Lack of Electronic Health Information
• Incomplete or Missing Data Elements
• Having Data in Searchable Fields
12

Kaiser Permanente’s Journey
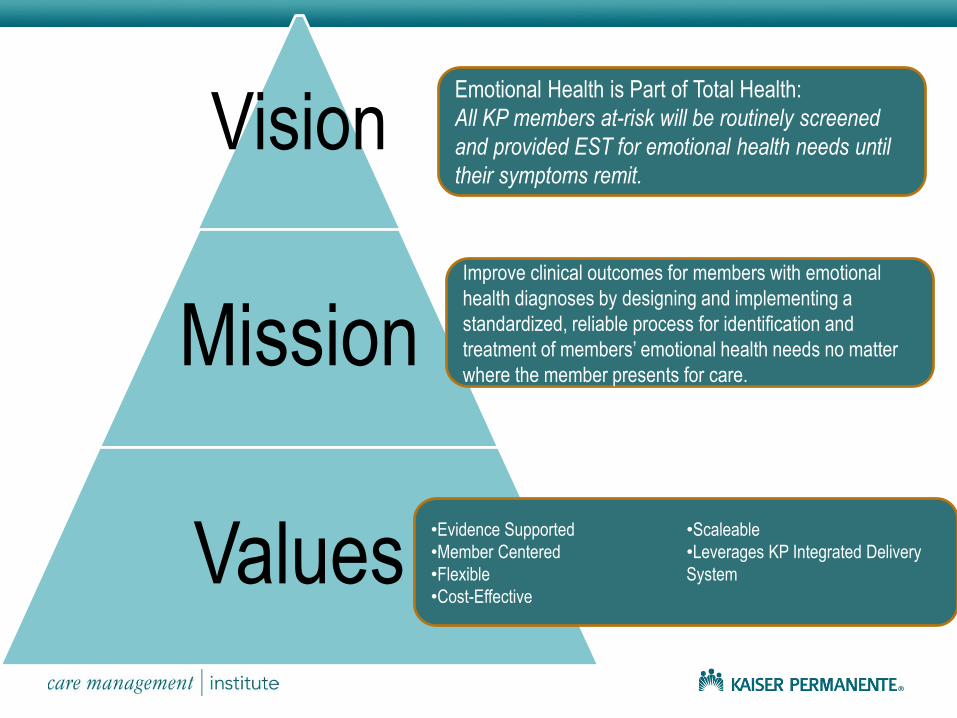
Vision
Mission
Values
Emotional Health is Part of Total Health:
All KP members at-risk will be routinely screened
and provided EST for emotional health needs until
their symptoms remit.
Improve clinical outcomes for members with emotional
health diagnoses by designing and implementing a
standardized, reliable process for identification and
treatment of members’ emotional health needs no matter
where the member presents for care.
•Evidence Supported
•Member Centered
•Flexible
•Cost-Effective
•Scaleable
•Leverages KP Integrated Delivery
System
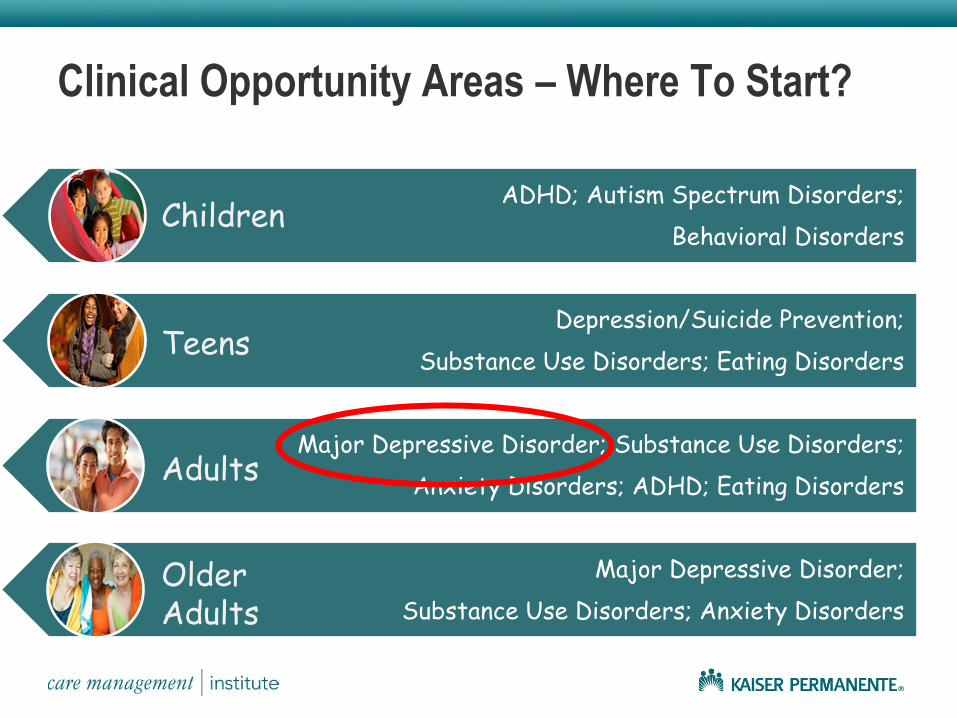
Clinical Opportunity Areas – Where To Start?
ADHD; Autism Spectrum Disorders;
Behavioral Disorders
Depression/Suicide Prevention;
Substance Use Disorders; Eating Disorders
Major Depressive Disorder; Substance Use Disorders;
Anxiety Disorders; ADHD; Eating Disorders
Major Depressive Disorder;
Substance Use Disorders; Anxiety Disorders
Children
Teens
Adults
Older Adults
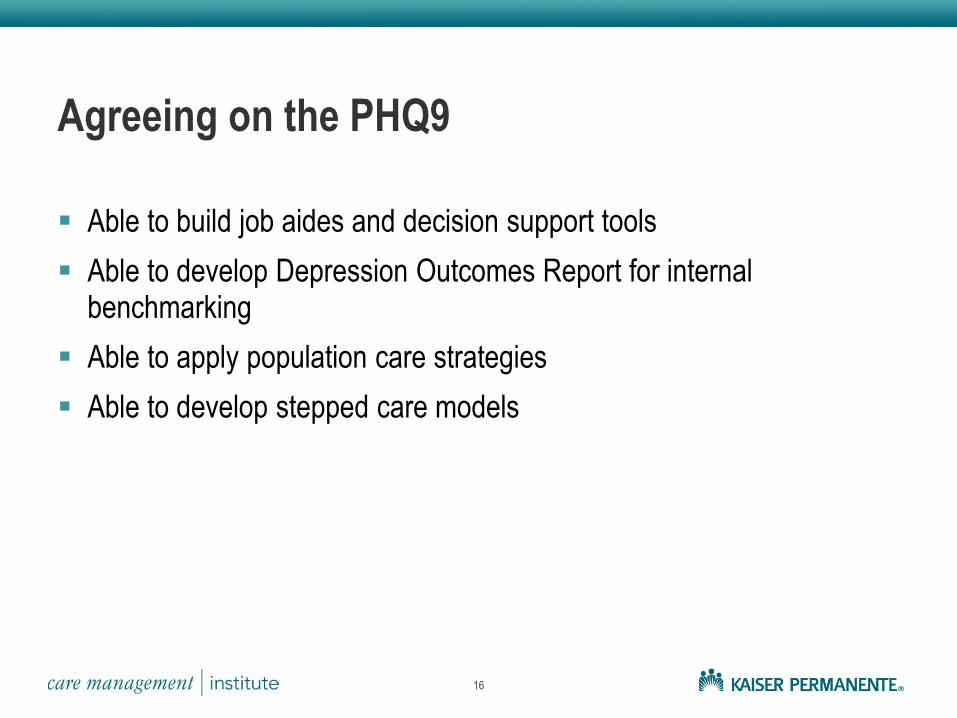
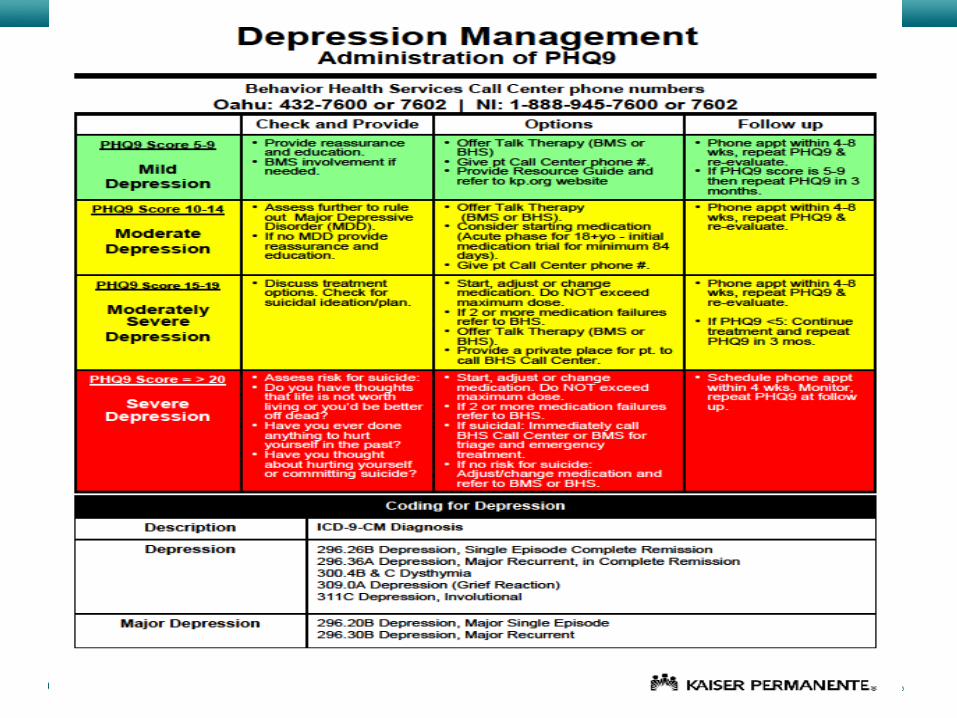
Agreeing on the PHQ9
Able to build job aides and decision support tools
Able to develop Depression Outcomes Report for internal benchmarking
Able to apply population care strategies
Able to develop stepped care models
16

PHQ9 – The New Standard of Depression Care at Kaiser Permanente
17
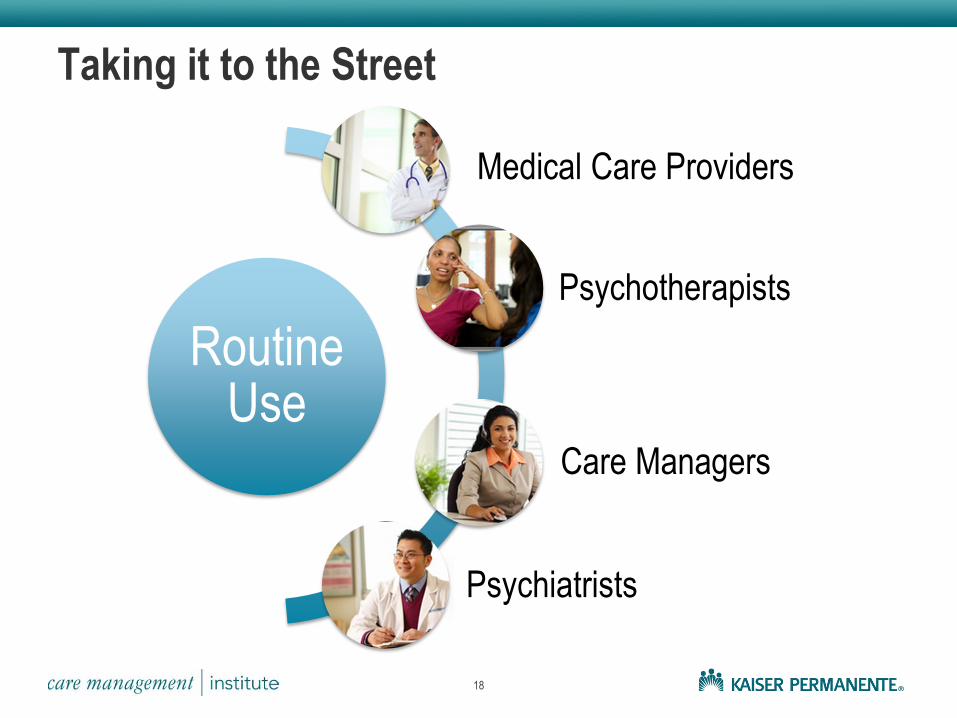
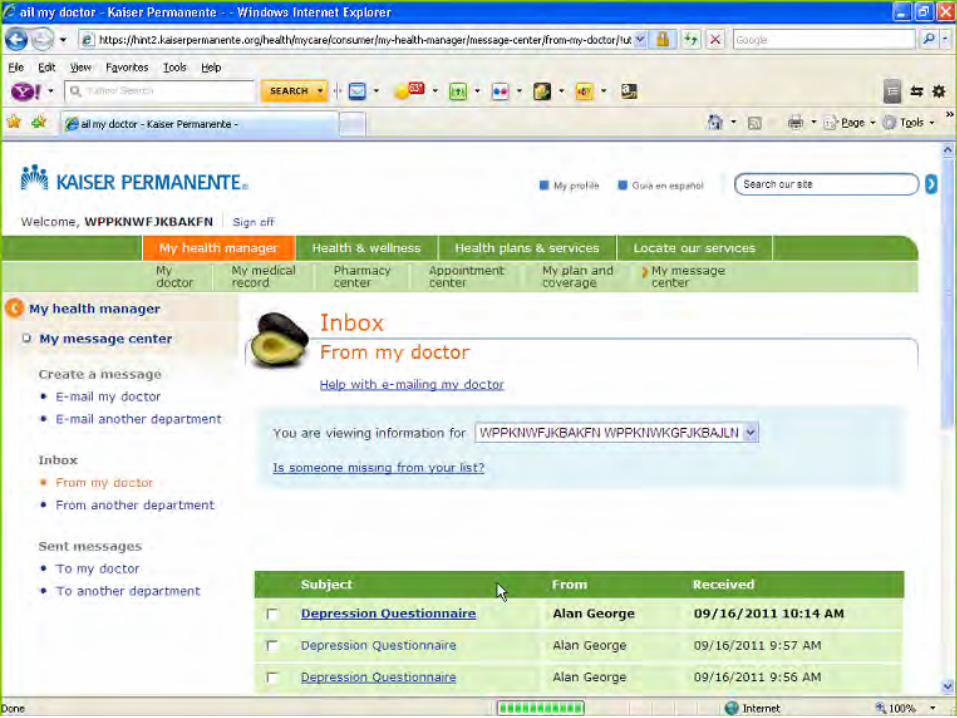
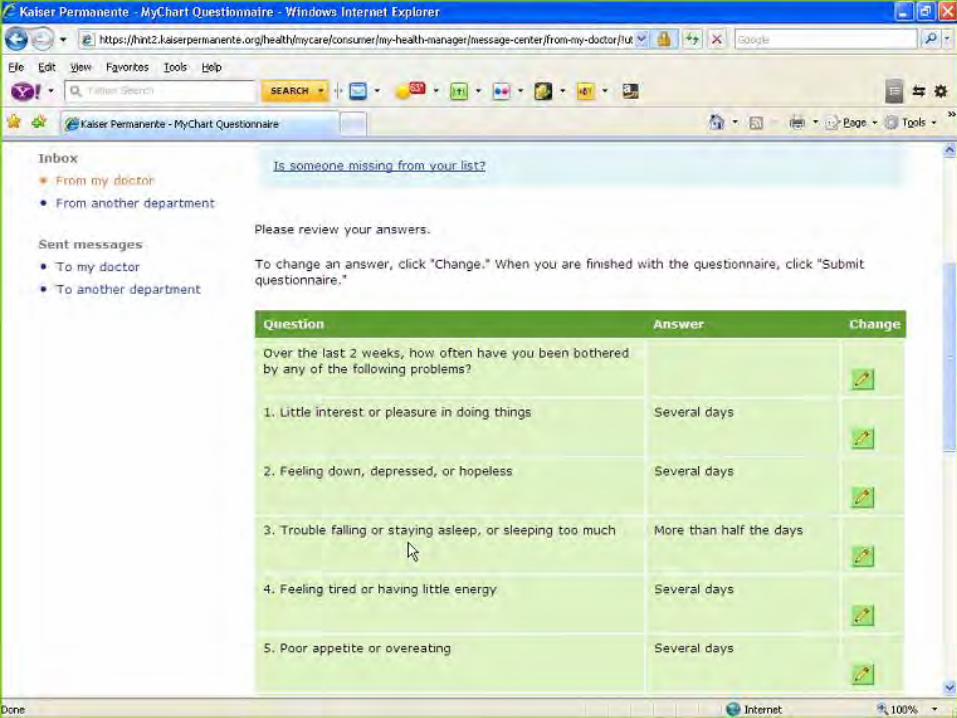
Taking it to the Street
18
Routine Use
Medical Care Providers
Psychotherapists
Care Managers
Psychiatrists
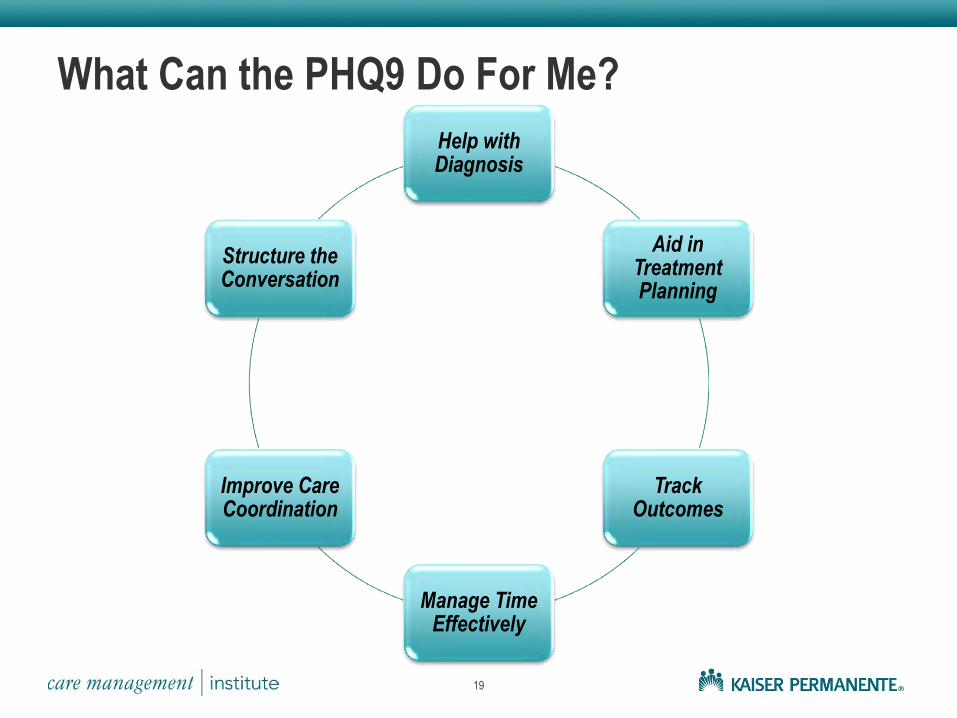
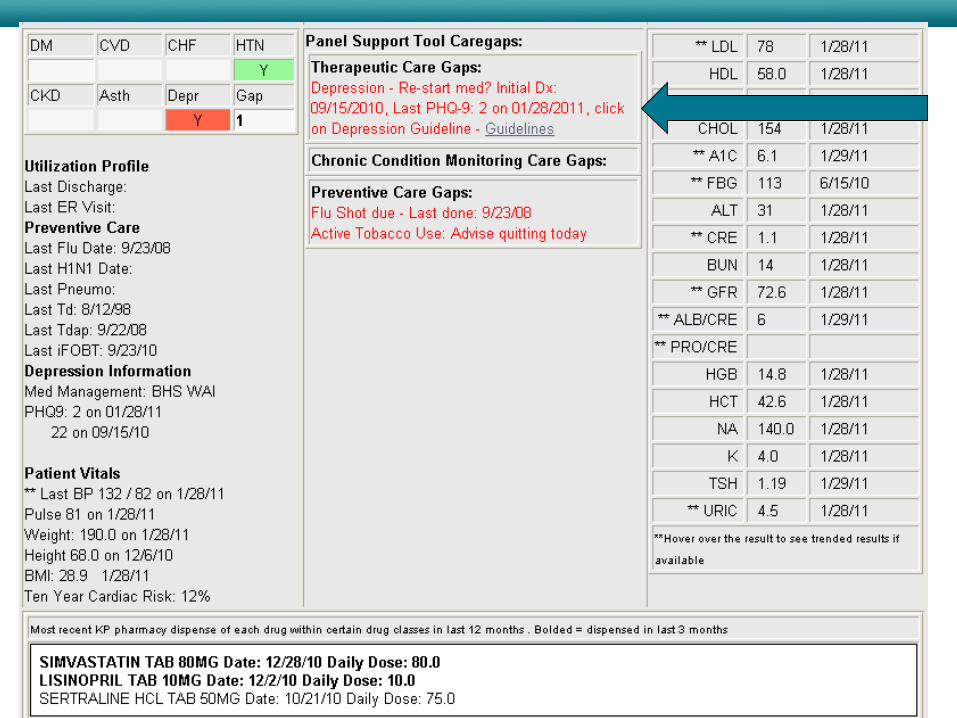
What Can the PHQ9 Do For Me?
19
Help with Diagnosis
Aid in Treatment Planning
Track Outcomes
Manage Time Effectively
Improve Care Coordination
Structure the Conversation

20
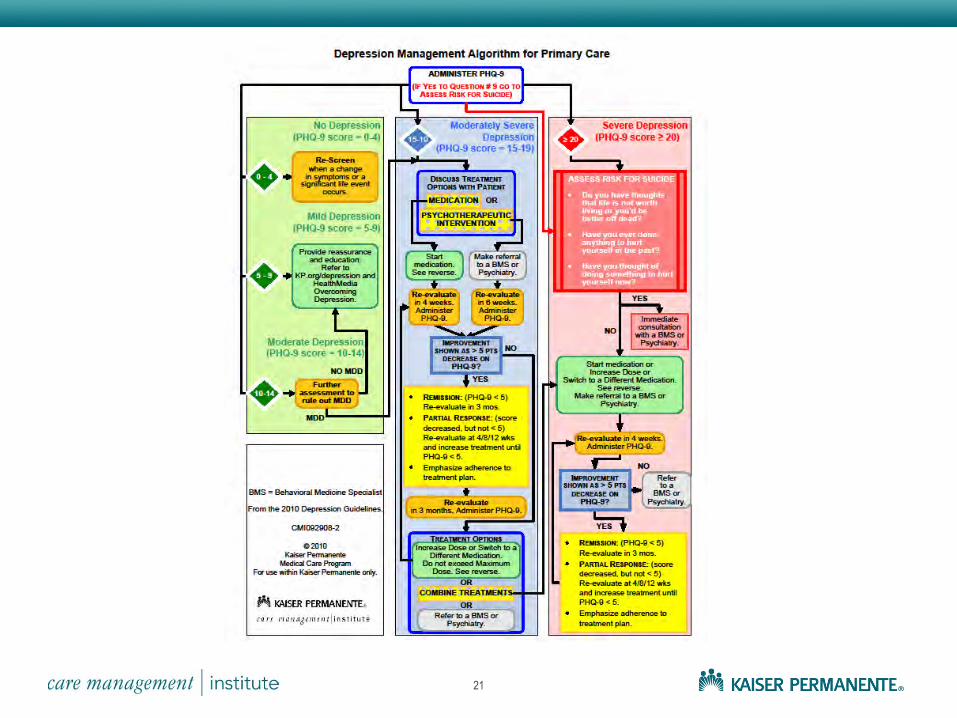
Diagnosis
21
Talking with Patients About Depression
22
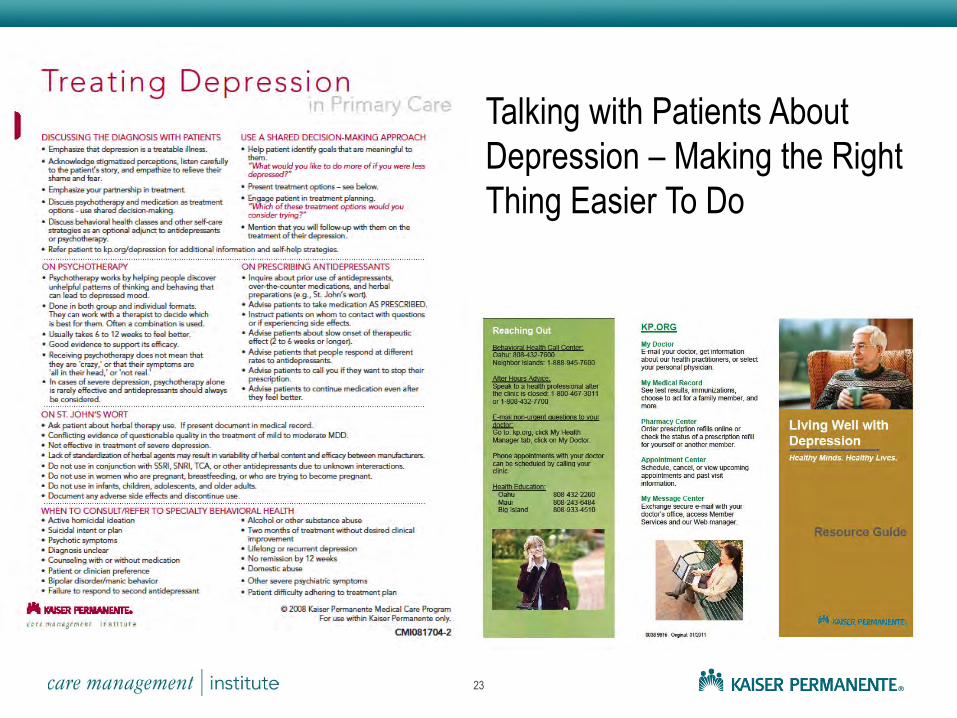
23
Talking with Patients About
Depression – Making the Right
Thing Easier To Do
Treatment Decisions
24
25
Monitoring Progress
26
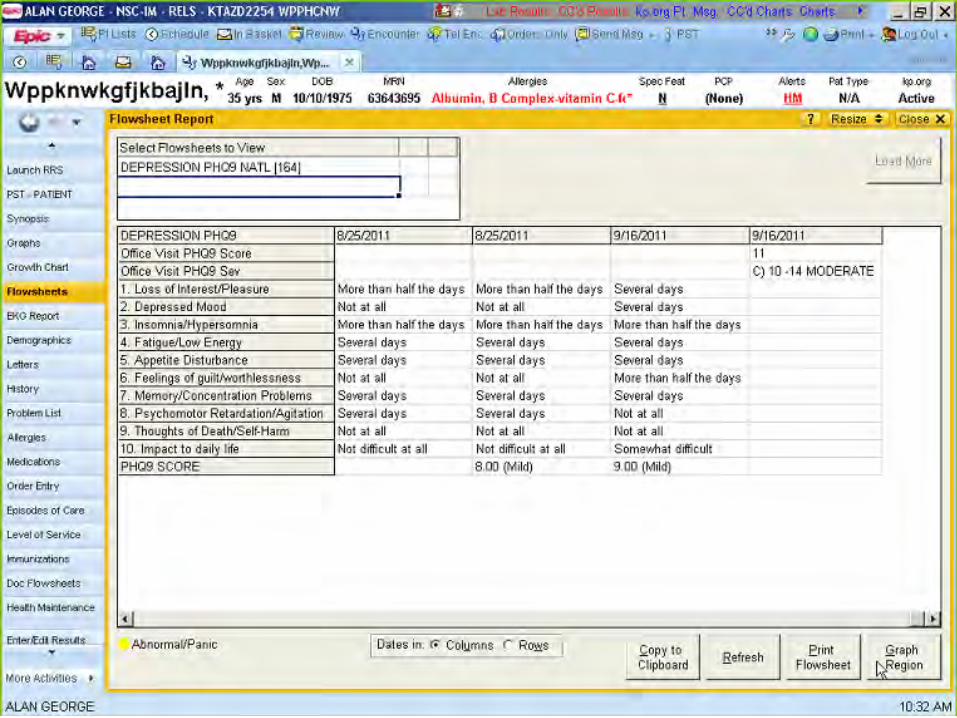
27
28
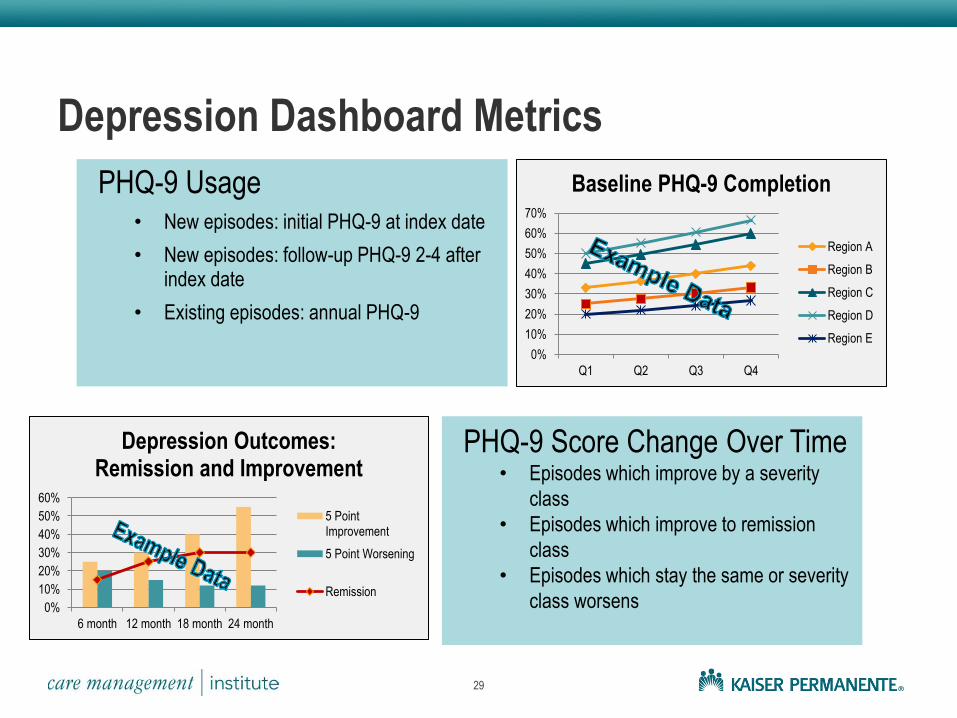
Depression Dashboard Metrics
PHQ-9 Usage • New episodes: initial PHQ-9 at index date
• New episodes: follow-up PHQ-9 2-4 after index date
• Existing episodes: annual PHQ-9
29
0%
10%
20%
30%
40%
50%
60%
70%
Q1 Q2 Q3 Q4
Baseline PHQ-9 Completion
Region A
Region B
Region C
Region D
Region E
0%
10%
20%
30%
40%
50%
60%
6 month 12 month 18 month 24 month
Depression Outcomes: Remission and Improvement
5 PointImprovement
5 Point Worsening
Remission
PHQ-9 Score Change Over Time • Episodes which improve by a severity
class
• Episodes which improve to remission
class
• Episodes which stay the same or severity
class worsens
Care Coordination
30
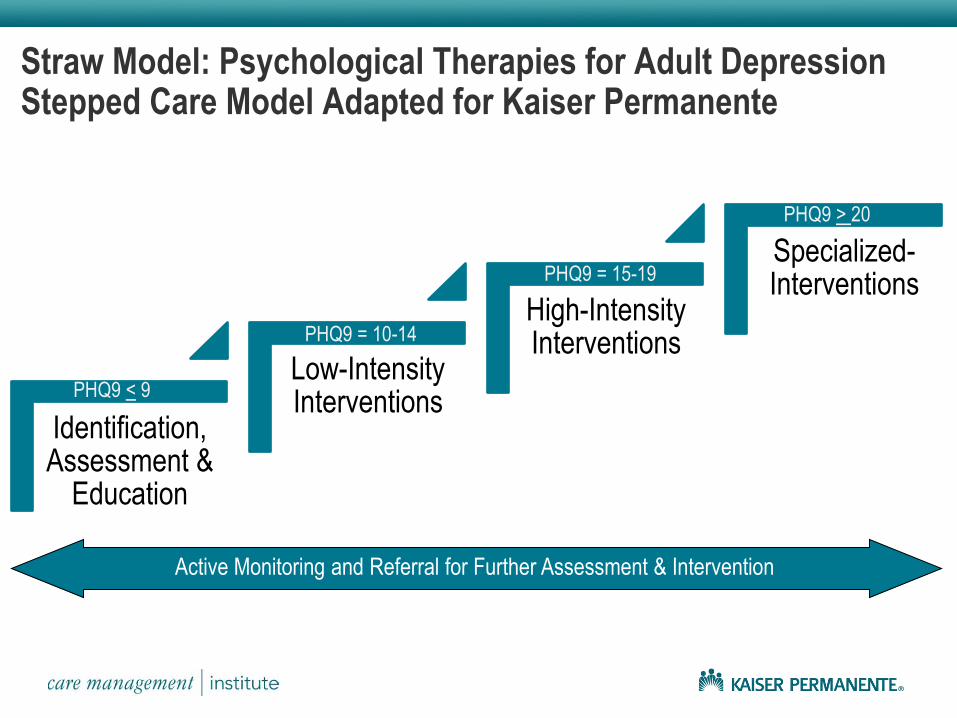
Straw Model: Psychological Therapies for Adult Depression Stepped Care Model Adapted for Kaiser Permanente
Identification, Assessment &
Education
Low-Intensity Interventions
High-Intensity Interventions
Specialized-Interventions
Active Monitoring and Referral for Further Assessment & Intervention
PHQ9 < 9
PHQ9 = 10-14
PHQ9 = 15-19
PHQ9 > 20
But Will Patients Like It……?
32
33
34

Acknowledging it Takes Time
35

Questions - - Comments
36


![Biomedical Instrumentation/ - VoWi · Biomedical Instrumentation/ Biomedizinische Technik 2015, [354.042] Professors: Kaniusas, Wanzenböck, Bertagnolli, Mayr,... Basic Principles](https://img.pdfslide.us/doc/110x75/5e7697081f9ffe701a741e6f/biomedical-instrumentation-vowi-biomedical-instrumentation-biomedizinische-technik.jpg)