Embed Size (px)
Citation preview
Measuring Observed Race: Preliminary Findings from the Observed Measures
SupplementAnthony Daniel Perez and Charles HirschmanCSDE Colloquium Presentation, UW-BHS Workshop19 October 2007
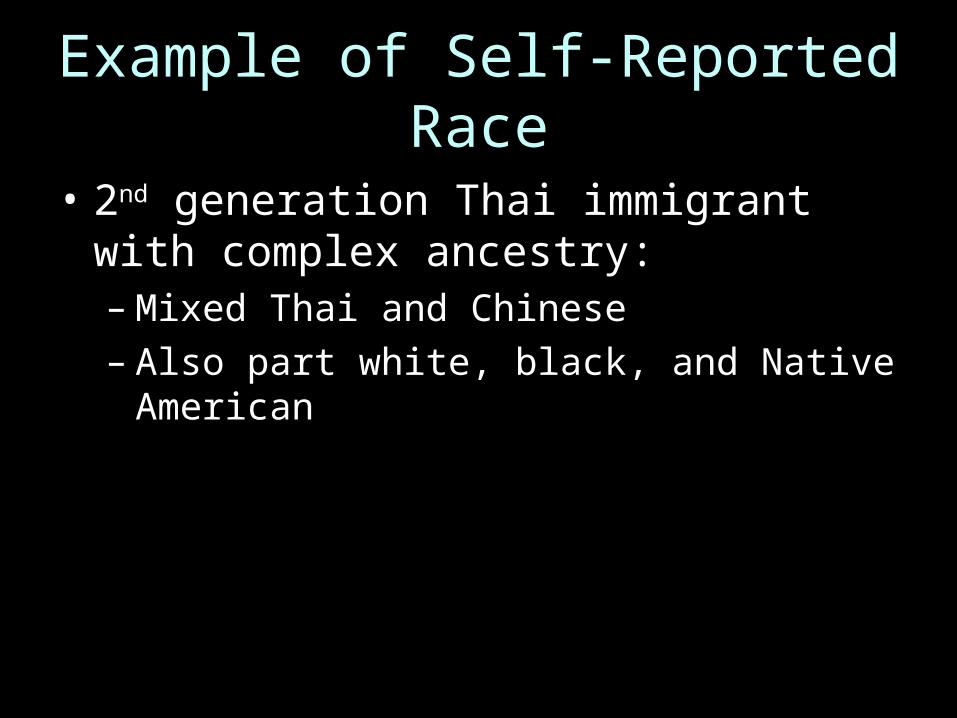
Example of Self-Reported Race
• 2nd generation Thai immigrant with complex ancestry:– Mixed Thai and Chinese– Also part white, black, and Native American
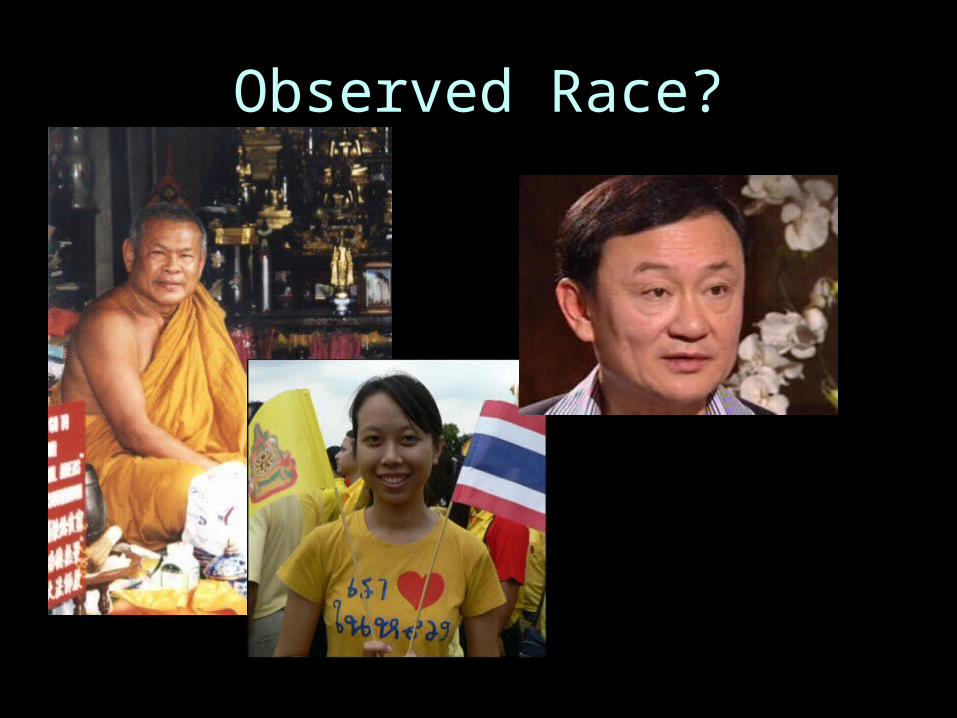
Observed Race?
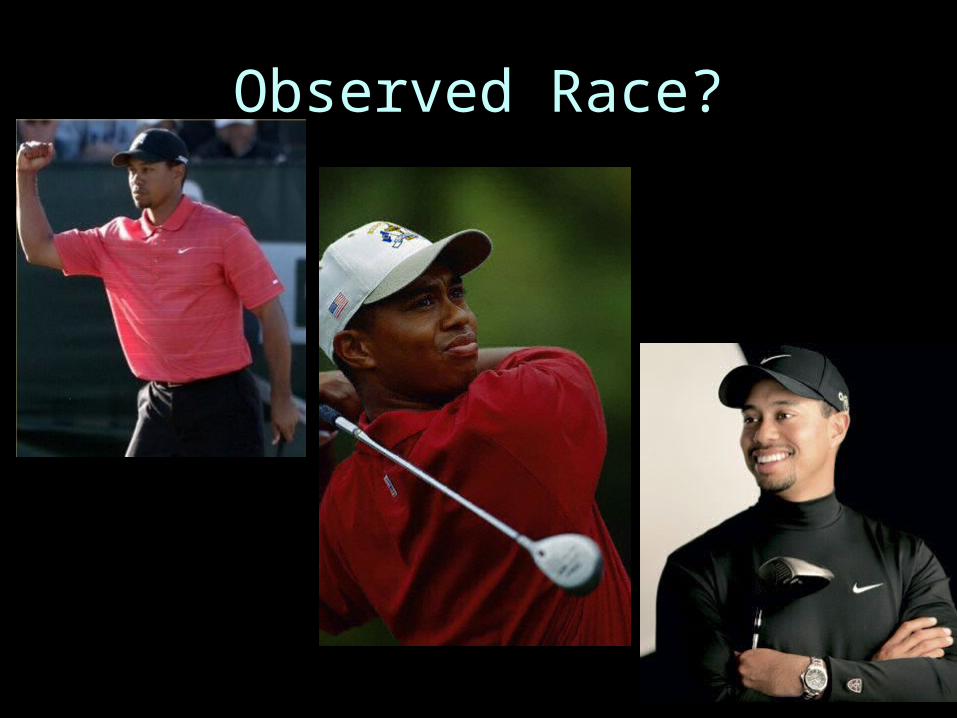
Observed Race?
Other Opinions
• In America…when you look like me, you're black. –Colin Powell
• It's not that we don't respect Tiger Woods's right to call himself a Cablinasian. We just don't think it will help him get a cab in D.C. –Lonnae O'Neal Parker
A Question of Perspective
• Physical appearance is important– Racial profiling – Some forms of interpersonal discrimination
• Reflected race may be a good proxy for appearance, but makes assumptions
• When appearance outweighs identity, better if measured directly: External or observed race
The Observed Measures Supplement (OMS)
• Auxiliary data collection effort– External measurement of BHS respondents’
race, body type, and physical attractiveness– Sourced from high school yearbooks
purchased during BHS survey years
OMS Pre-test Design and Characteristics
• Web-based questionnaire– Raters drawn from UW summer classes– 19 raters X 25 pictures = 475 ratings– Three dimensions measured
• Pre-test pictures selected for ambiguity
• Key questions of interest:– Are measures of observed race reliable?– How many ratings are needed?
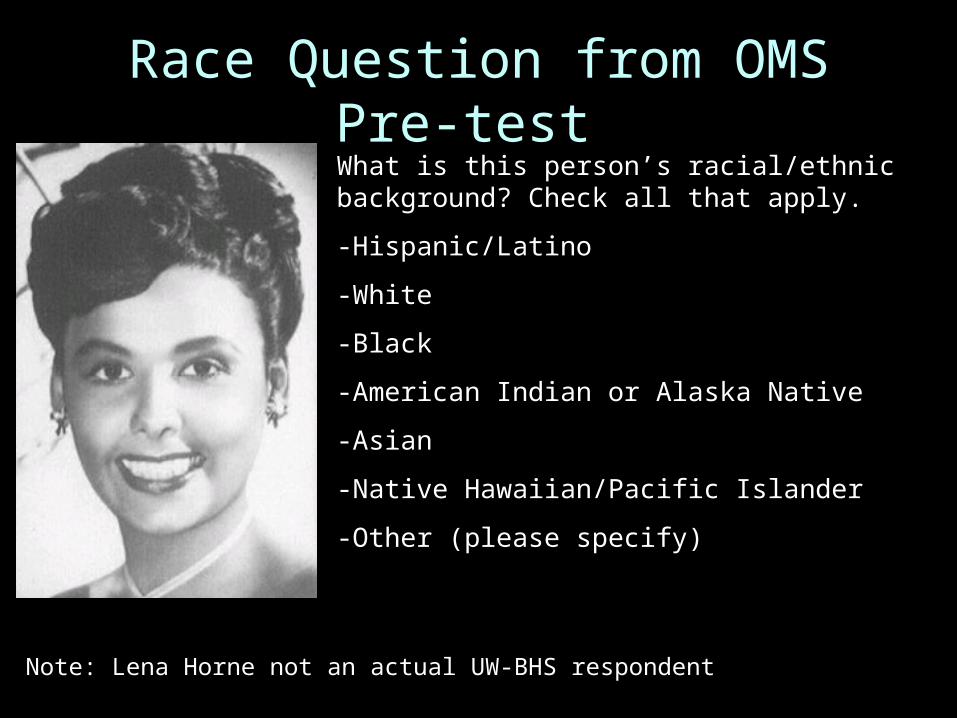
What is this person’s racial/ethnic background? Check all that apply.
-Hispanic/Latino
-White
-Black
-American Indian or Alaska Native
-Asian
-Native Hawaiian/Pacific Islander
-Other (please specify)
Note: Lena Horne not an actual UW-BHS respondent
Race Question from OMS Pre-test
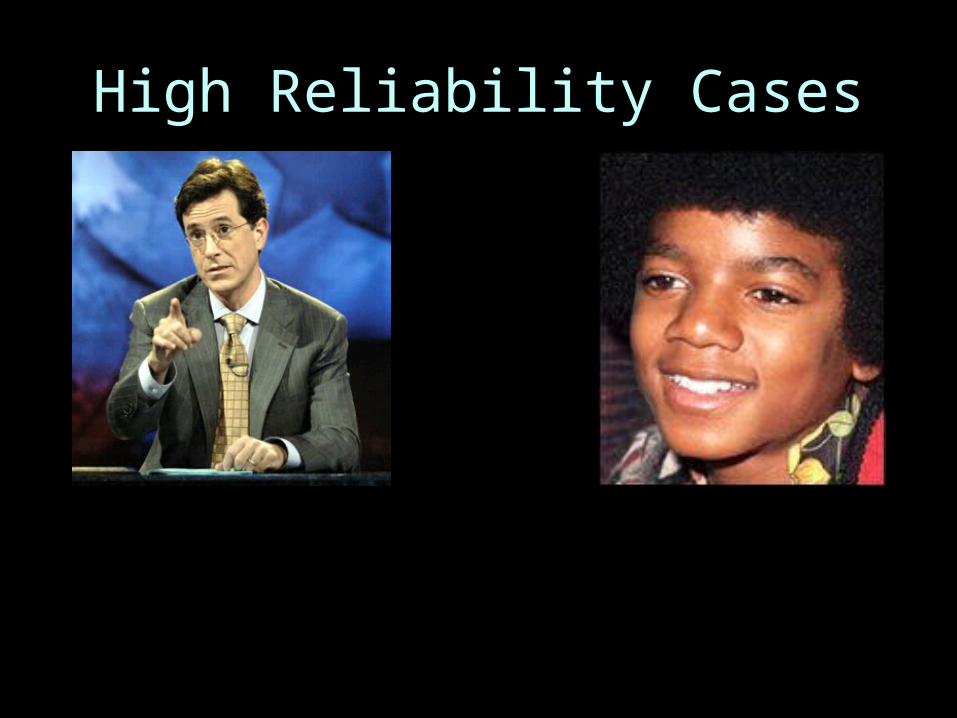
High Reliability Cases
Race n %Black 19 100.00
Race n %White 19 100.00
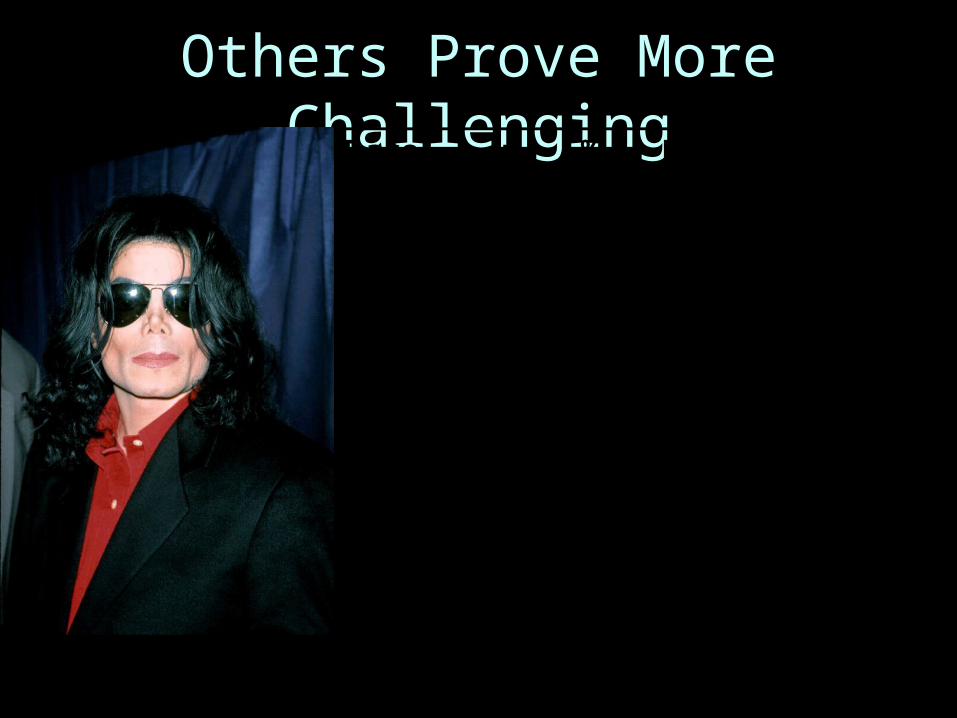
Others Prove More ChallengingBest RaceHisp 7 36.84Black 3 15.79Indian 2 10.53Asian 4 21.05NHPI 1 5.26Other 2 10.53
Race n %Hisp 4 21.05Indian 1 5.26Asian 1 5.26NHPI 1 5.26Other 1 5.26Hisp/Wht 1 5.26Hisp/blk 1 5.26wht/blk 1 5.26wht/asn 1 5.26blk/asn 1 5.26asn/nhp 1 5.263 race 5 26.32
Are Ratings Reliable? Summary of Inter-Rater Agreement (IRA)
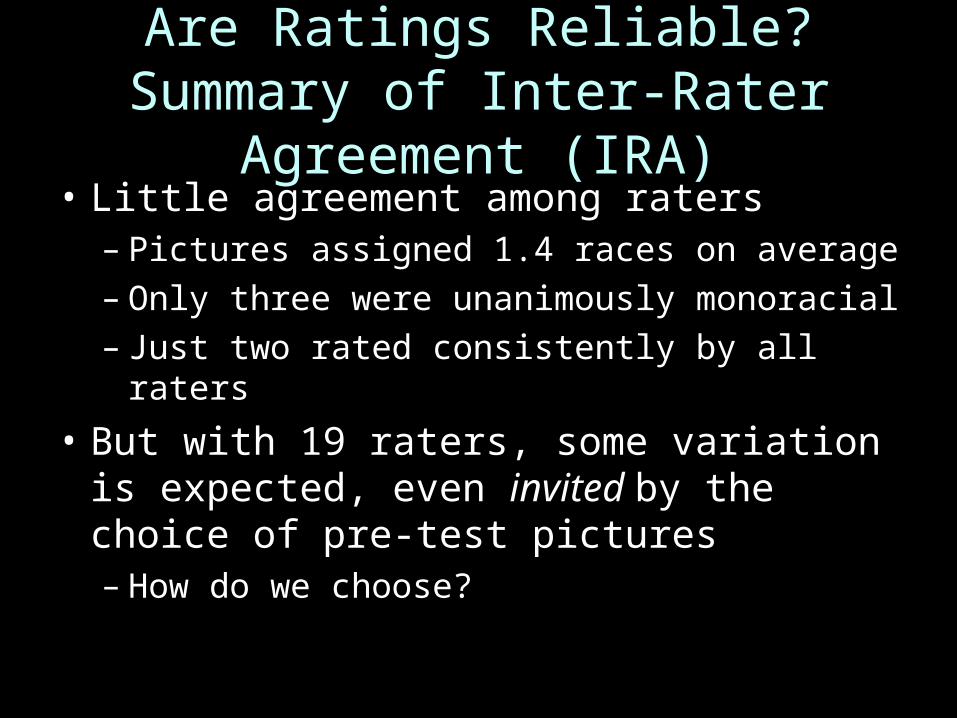
• Little agreement among raters– Pictures assigned 1.4 races on average– Only three were unanimously monoracial– Just two rated consistently by all raters
• But with 19 raters, some variation is expected, even invited by the choice of pre-test pictures– How do we choose?
How to Obtain Consistent Ratings
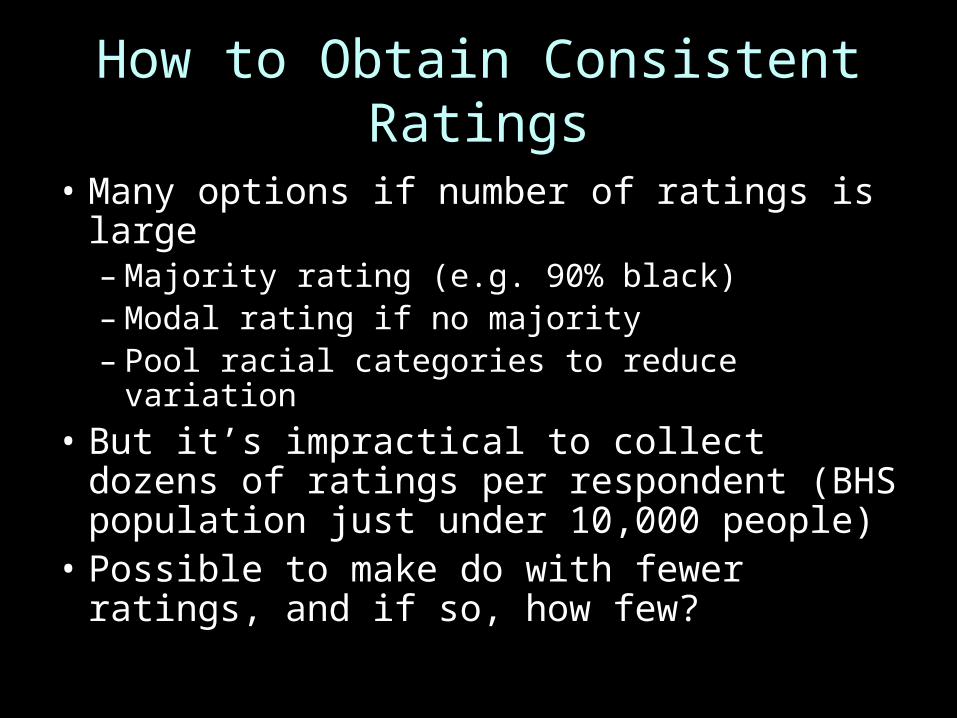
• Many options if number of ratings is large– Majority rating (e.g. 90% black)– Modal rating if no majority– Pool racial categories to reduce variation
• But it’s impractical to collect dozens of ratings per respondent (BHS population just under 10,000 people)
• Possible to make do with fewer ratings, and if so, how few?
Redefining Inter-rater Agreement
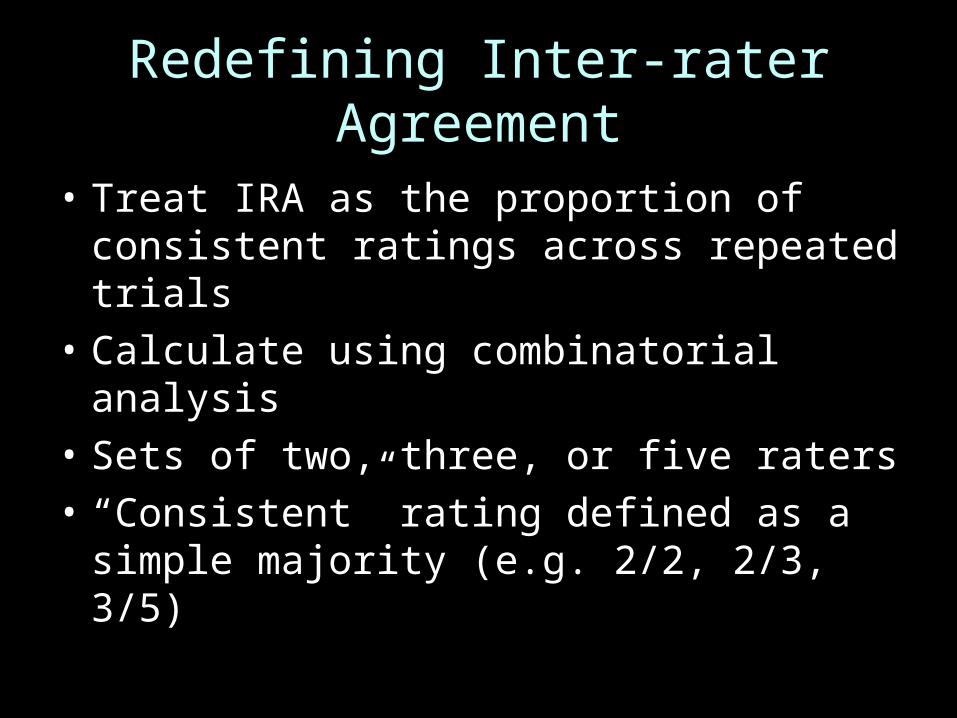
• Treat IRA as the proportion of consistent ratings across repeated trials
• Calculate using combinatorial analysis
• Sets of two, three, or five raters
• “Consistent” rating defined as a simple majority (e.g. 2/2, 2/3, 3/5)
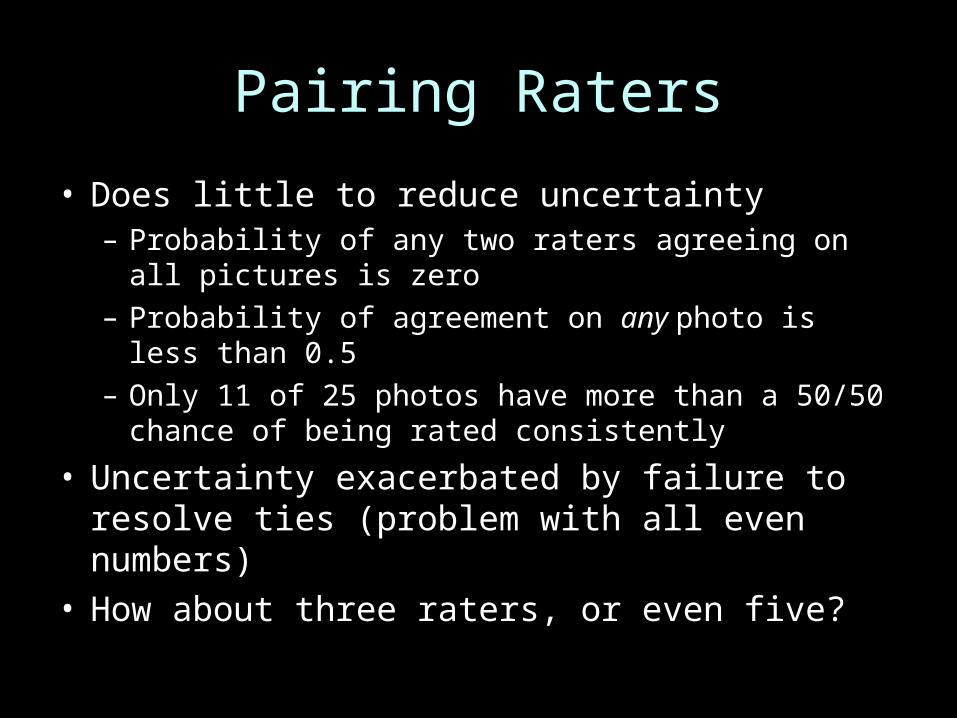
Pairing Raters
• Does little to reduce uncertainty– Probability of any two raters agreeing on all pictures is
zero– Probability of agreement on any photo is less than 0.5
– Only 11 of 25 photos have more than a 50/50 chance
of being rated consistently
• Uncertainty exacerbated by failure to resolve ties (problem with all even numbers)
• How about three raters, or even five?
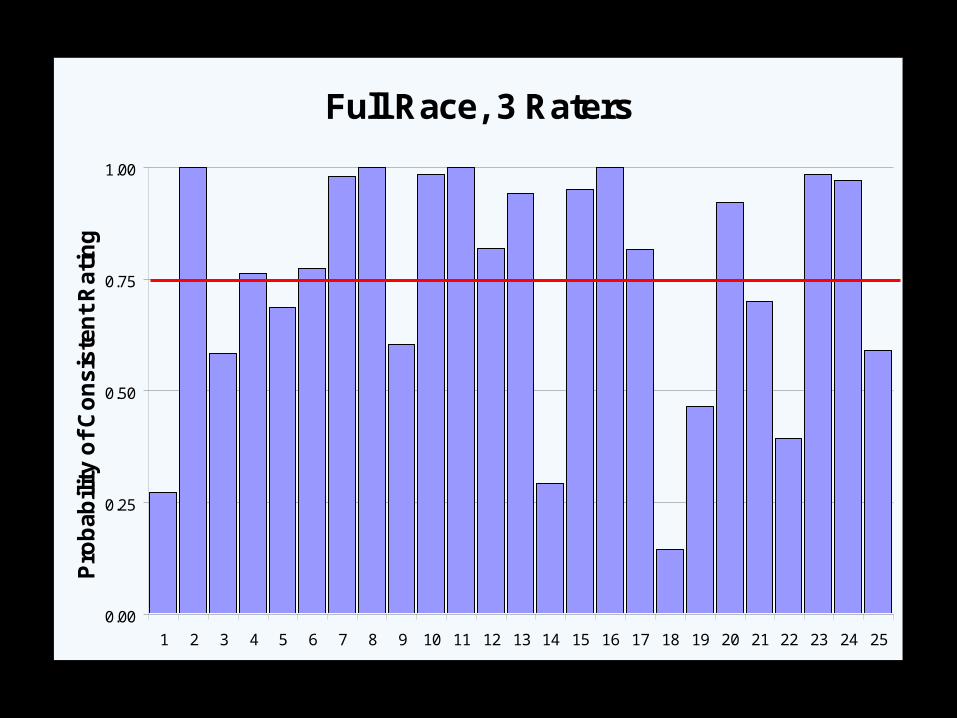
Full Race, 3 Raters
0.00
0.25
0.50
0.75
1.00
1 2 3 4 5 6 7 8 9 10 11 12 13 14 15 16 17 18 19 20 21 22 23 24 25
Pro
ba
bili
ty o
f C
on
sis
ten
t R
ati
ng
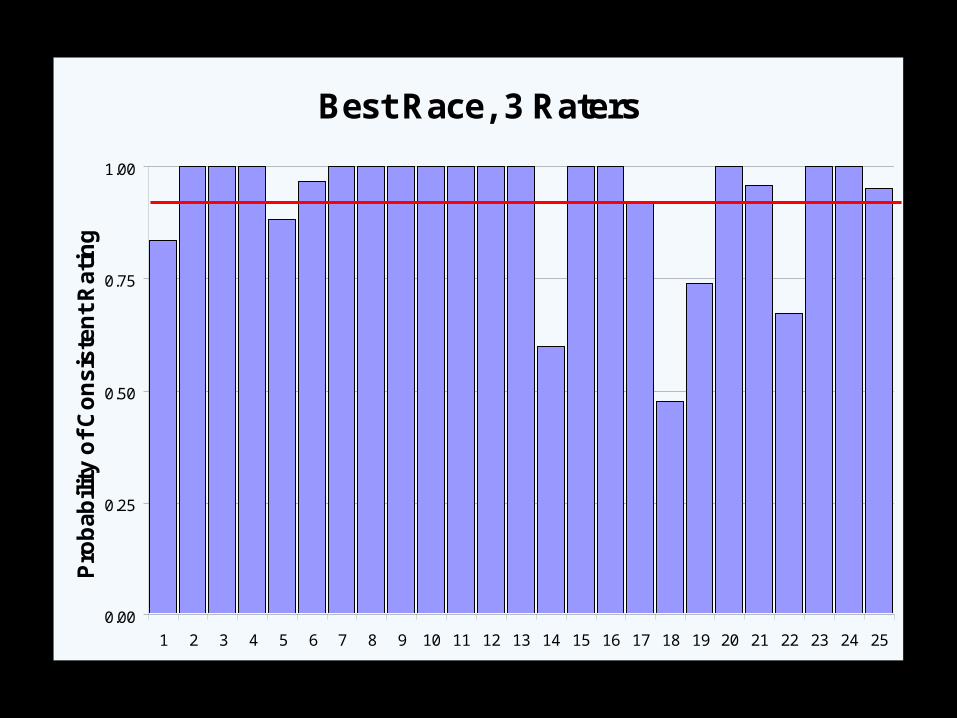
Best Race, 3 Raters
0.00
0.25
0.50
0.75
1.00
1 2 3 4 5 6 7 8 9 10 11 12 13 14 15 16 17 18 19 20 21 22 23 24 25
Pro
ba
bili
ty o
f C
on
sis
ten
t R
ati
ng
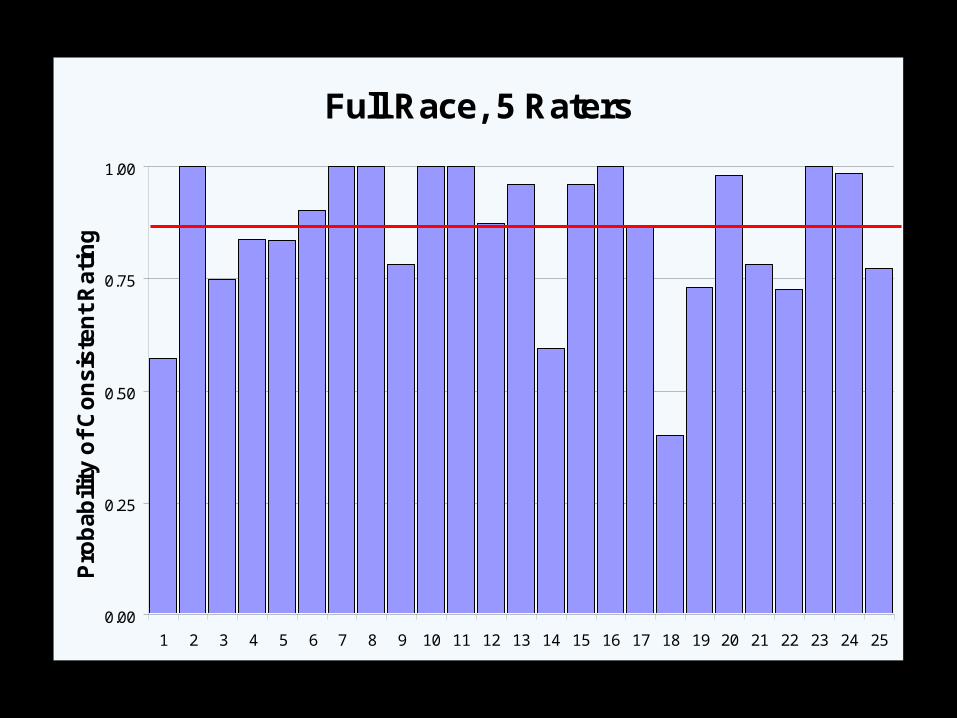
Full Race, 5 Raters
0.00
0.25
0.50
0.75
1.00
1 2 3 4 5 6 7 8 9 10 11 12 13 14 15 16 17 18 19 20 21 22 23 24 25
Pro
ba
bili
ty o
f C
on
sis
ten
t R
ati
ng
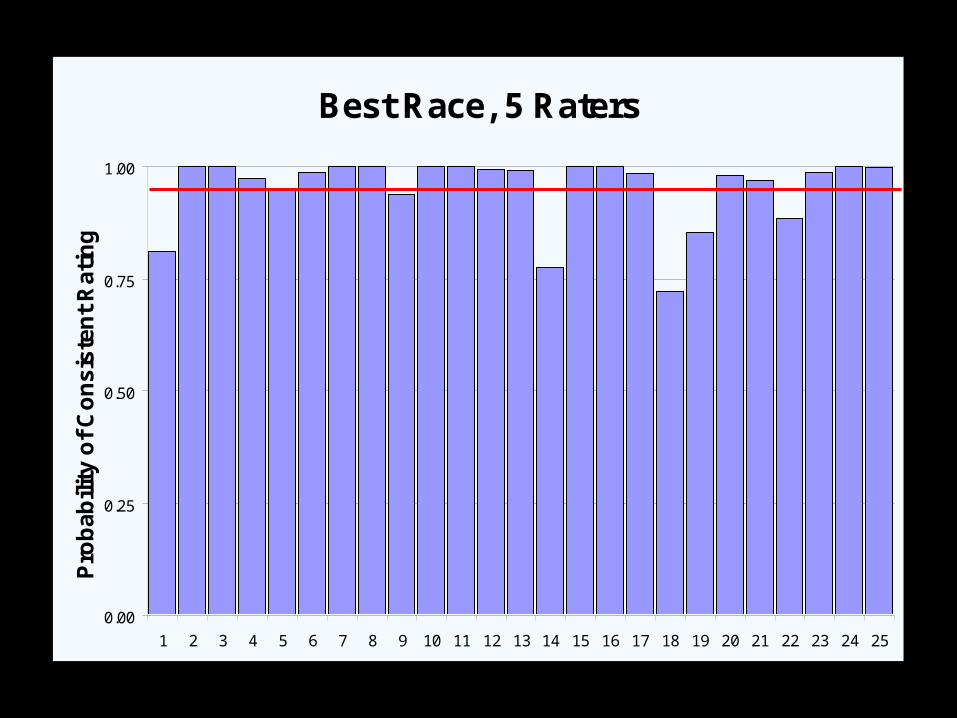
Best Race, 5 Raters
0.00
0.25
0.50
0.75
1.00
1 2 3 4 5 6 7 8 9 10 11 12 13 14 15 16 17 18 19 20 21 22 23 24 25
Pro
ba
bili
ty o
f C
on
sis
ten
t R
ati
ng
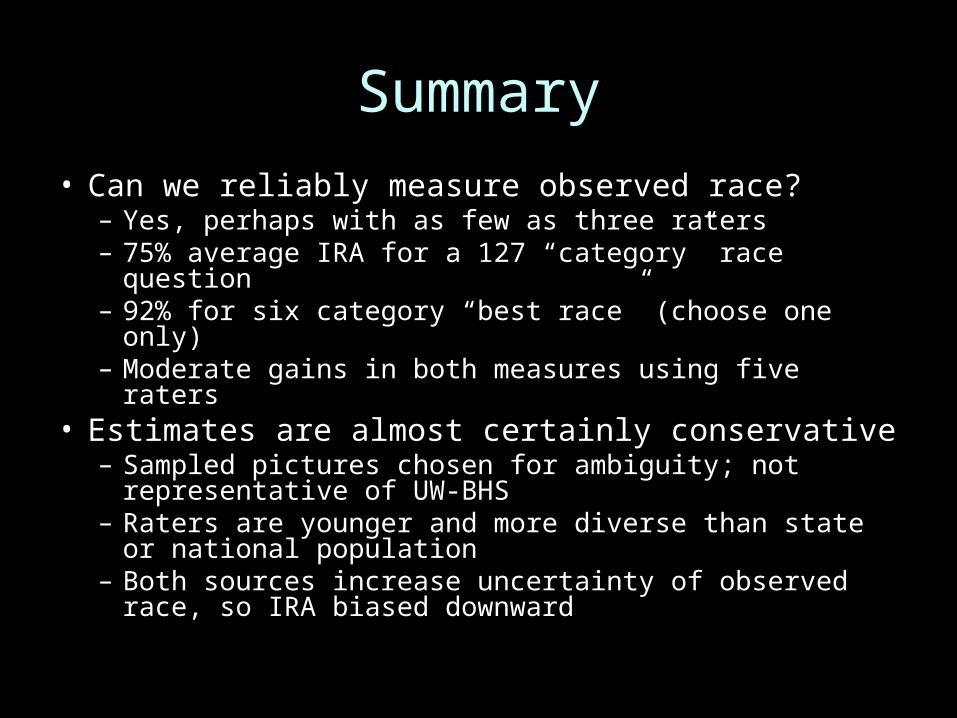
Summary
• Can we reliably measure observed race?– Yes, perhaps with as few as three raters– 75% average IRA for a 127 “category” race question– 92% for six category “best race” (choose one only)– Moderate gains in both measures using five raters
• Estimates are almost certainly conservative– Sampled pictures chosen for ambiguity; not
representative of UW-BHS– Raters are younger and more diverse than state or
national population– Both sources increase uncertainty of observed race,
so IRA biased downward