Embed Size (px)
Citation preview
Measuring Morbidity following Major Surgery
Dr Michael Patrick William GROCOTT
BSc MBBS MRCP FRCA
UCL
Doctor of Medicine, 2010

2
I, Michael Patrick William GROCOTT, confirm that the work presented in this
thesis is my own. Where information has been derived from other sources, I
confirm that this has been indicated in the thesis (below).
Chapter 1 (nil)
Chapter 2
Assistance with data collection, data entry and analysis by Mark Hamilton
Chapter 3
Data collection and data entry by Sidhartha Sinha, Shrestha Sinha,
Elizabeth Ashby, Raja Jayaram
Chapter 4 and Chapter 5
Data collection and data entry by Claire Matejowsky and Maj Mutch
Assistance with analysis by John Browne
Chapter 6 (nil)
3
Abstract
A systematic review of the efficacy of a specific perioperative haemodynamic
management strategy was performed to explore the balance between therapeutic
benefit and adverse effects. Whilst mortality and length of hospital stay were
reduced in the intervention group, pooling of morbidity data for between-group
comparisons was limited by the heterogeneity of morbidity reporting between
different studies. Classification, criteria and summation of morbidity outcome
variables were inconsistent between studies, precluding analyses of pooled data
for many types of morbidity. A similar pattern was observed in a second
systematic review of randomised controlled trials of perioperative interventions
published in high impact surgical journals.
The Post-operative Morbidity Survey (POMS), a previously published method of
describing short-term postoperative morbidity, lacked validation. The POMS was
prospectively collected in 439 patients undergoing elective major surgery in a UK
teaching hospital. The prevalence and pattern of morbidity was described and
compared with data from a similar study using the POMS in a US institution.
The type and severity of surgery was reflected in the frequency and pattern of
POMS defined postoperative morbidity. In the UK institution, many patients
remained in hospital without morbidity as defined by the POMS, in contrast to the
US institution, where very few patients remained in hospital in the absence of
POMS defined morbidity. The POMS may have utility as a tool for recording bed
occupancy and for modelling bed utilization.
Inter-rater reliability was adequate and a priori hypotheses that the POMS would
discriminate between patients with known measures of morbidity risk, and predict
length of stay were generally supported through observation of data trends. The
POMS was a valid descriptor of short-term post-operative morbidity in major
surgical patients.
4
ACKNOWLEDGEMENTS
Monty (Professor Michael [Monty] Mythen), inspiration, friend and unique
supervisor.
Denny (Dr Denny Levett), proofreader extraordinaire, and angel.
My parents, for lifelong support and encouragement.
Claire and Maj (Sr Claire Matejowsky and Sr Maj Mutch) for patience and
friendship.
Intellectual input from Dr John Browne (in particular), Professor Kathy
Rowan, Dr Van Der Meulen, Mr Mark Emberton, Dr Mark Hamilton, and Dr
Denny Levett.
The Special Trustees of the Middlesex Hospital for funding the work of the
UCLH Surgical Outcome Research Centre (SOuRCe) where the work
described in Chapters 4 and 5 was undertaken.
The patients.

5
6
Table of Contents
Table of Contents 6
Table of Tables 10
Table of Figures 13
Abbreviations 15
Chapter 1: Background 17
1.1 Introduction 17
1.2 Why measure outcomes relating to surgery? 17
1.3.1 UK Perspective 20
1.3.2 USA Perspective 21
1.4 Evaluating Outcome following Surgery 22
1.4.1 Performance and quality indicators in healthcare 22
1.4.2 Dimensions of quality in relation to surgery 24
1.4.2 Perspectives on outcome following surgery 27
1.4.3 A conceptual model for outcome following surgery 28
1.4.4 The importance of risk (case-mix) adjustment 29
1.4.6 Terminology: Perioperative or Surgical Outcomes? 30
1.5 Risk (case-mix) adjustment of outcomes and surgery 31
1.5.1 Introduction 31
1.5.2 American Society of Anesthesiologists Physical Status Classification 31
1.5.3 Surgical Risk Score and other ASA derivatives 33
1.5.4 Criteria for “High-risk major surgery” 34
1.5.5 Charlson Score 35
1.5.6 Physiological and Operative Severity Score for the Enumeration of Mortality
and Morbidity 36
1.5.7 National Surgical Quality Improvement Program: a US approach 41
1.5.8 Cardiac risk scores for non-cardiac major surgery 42
1.5.9 Miscellaneous approaches to describing surgical risk 44
1.6 Postoperative Outcome Measures 45
1.6.1 Introduction and definition of scope 45
1.6.2 Death 47
1.6.3 Duration of Hospital (and Critical Care) Stay 49
1.6.4 Postoperative morbidity 49
1.7 Clinical Measurement Scales 60
1.7.1 Introduction 60
1.7.3 Clinimetrics and Psychometrics 62
7
1.7.3 Reliability 65
1.7.4 Deriving a score from multiple items 68
1.7.5 Validity 69
1.8 Summary 71
Chapter 2: “Perioperative increase in global blood flow to explicit defined goals
and outcomes following surgery”: a systematic review 72
2.1 Introduction 72
2.1.1 Context 72
2.1.2 Aims 74
2.2 Methods 74
2.2.1 Summary 74
2.2.2 Search Strategy 74
2.2.3 Data extraction 75
2.3 Results 76
2.3.1 Description of studies 76
2.3.2 Risk of bias in included studies 77
2.3.4 Data Synthesis 86
2.4 Discussion 102
2.4.1 Summary of findings 102
2.4.2 Strengths and weaknesses of this study 102
2.5 Summary 105
Appendix 1: “Optimization Systematic Review Steering Group” 107
Appendix 2: Search filter for randomized controlled trials with and without blinding 108
Appendix 3: Modified search filter for randomized controlled trials with and without
blinding 109
Appendix 4: List of Key Words used in electronic searches 110
Appendix 5: Component checklist for methodological quality of clinical trials (Gardner
2000) 111
Chapter 3 Morbidity reporting in surgical RCTs 112
3.1 Introduction 112
3.2 Methods 113
3.2.1 Summary 113
3.2.1 Selection of journals and identification of RCTs 113
3.2.2 Data extraction 113
3.2.3 Data analysis 114
3.3 Results 114
3.4 Discussion 118
8
3.4.1 Summary 118
3.4.2 Reporting of morbidity in surgical RCTs 118
3.4.3 Reporting of methodological characteristics of surgical RCTs 119
3.4.4 “Quality” of surgical RCTs 120
3.4.5 Limitations of this study 121
3.5 Summary 122
CHAPTER 4: The POMS in a UK teaching hospital 123
4.1 Introduction 123
4.2 Methods 123
4.2.1 General 123
4.2.2 Setting 124
4.2.3 Patients 124
4.2.4 Sample size calculation 124
4.2.5 Data collection 125
4.2.6 Analysis plan 125
4.2.7 Statistical approach 126
4.3 Results 126
4.3.1 Characteristics of study population 126
4.3.2 Prevalence and pattern of post-operative morbidity 131
4.3.3 Relationship between postoperative morbidity and stay in hospital 136
4.3.4 Comparison with US data 137
4.4 Discussion 141
4.4.1 Summary of findings 141
4.4.2 Epidemiology of POMS defined morbidity 142
4.4.3 Comparison with other postoperative morbidity estimates in the literature
142
4.4.4 POMS and stay in hospital (bed occupancy) 144
4.4.5 Comparison between the Middlesex (UK) and Duke (US) Cohorts 145
4.4.6 Limitations of POMS and this study 147
4.5 Summary 147
CHAPTER 5: Validation of the POMS in adults 148
5.1 Introduction 148
5.2 Methods 148
5.2.1 Overview 148
5.2.2 Acceptability 148
5.2.3 Reliability 149
5.2.4 Scaling properties 149
9
5.2.5 Validity: Construct validity 149
5.2.6 Statistical Approach 150
5.3 Results 150
5.3.1 Summary of findings 150
5.3.2 Acceptability 150
5.3.3 Reliability 150
5.3.4 Scaling properties – internal consistency 150
5.3.5 Validity 151
5.4 Discussion 162
5.4.1 Acceptability 162
5.4.2 Reliability 162
5.4.3 Internal consistency 162
5.4.4 Validity 163
5.4.5 POMS domain criteria 168
5.5 Summary 170
Chapter 6: Conclusions and further work 171
6.1 Summary of contents of thesis 171
6.2 Outstanding questions 173
6.2.1 Current literature 173
6.2.2 POMS internal validity 173
6.2.3 POMS external validity 173
6.2.4 Does perioperative morbidity constitute a syndrome? 174
6.2.5 POMS applications 174
6.3 Conlusions 175
REFERENCES 176
Appendix 1: Published manuscripts arising from this MD thesis 202
10
Table of Tables
Table 1 Classification Matrix of Quality in Healthcare (with examples) ..................27
Table 2 American Society of Anesthesiologists Physical Status Score (ASA 2008)
...............................................................................................................................................32
Table 3 The Surgical Risk Score (Sutton et al 2002) ........................................................34
Table 4 Criteria for “high-risk general surgical patients” (Shoemaker et al 1988) ..
...............................................................................................................................................35
Table 5 Charlson Score (Charlson et al 1987) ....................................................................36
Table 6 POSSUM physiological variables (Copeland et al 1992).................................38
Table 7 POSSUM Operative Severity Variables (Copeland et al 1992) .....................39
Table 8 Goldman cardiac risk index (Goldman et al 1977) ...........................................43
Table 9 Lee Cardiac Risk Index (Lee et al 1999)................................................................44
Table 10 Morbidity reporting in a sample of perioperative epidemiological
studies ..........................................................................................................................................54
Table 11 Quality of recovery score (QoR score) (Miles et al 1999) ...........................57
Table 12 The Postoperative Morbidity Survey (POMS)..................................................59
Table 13 Excluded studies and reason for exclusion.......................................................78
Table 14 Characteristics of included studies .....................................................................79
Table 15 Outcomes reported (excluding morbidity) .......................................................80
Table 16 Morbidity outcomes reported................................................................................81
Table 17 Risk of bias: allocation concealment and study size category ...................84
Table 18 Methodological quality of included studies for each of the 24 questions
of the “Gardner” checklist (Appendix 5) .........................................................................85
Table 19 Sensitivity analyses for mortality at longest follow-up................................90
Table 20 Criteria for renal impairment/failure .................................................................91
Table 21 SOFA criteria for renal failure ................................................................................92
Table 22 Characteristics of studies reported in four high impact surgical journals
in 2005 ...................................................................................................................................... 115
Table 23 Characteristics of 42 surgical RCTs meeting the inclusion criteria for
this study.................................................................................................................................. 116
Table 24 Reporting of adverse events in 42 surgical RCTs assessed against the
modified CONSORT criteria............................................................................................... 117
Table 25: The Middlesex Hospital postoperative morbidity study (n=439),
patient and perioperative characteristics. (LOS=hospital length of stay) ...... 128
11
Table 26 The Middlesex hospital postoperative morbidity study (n=439).
Percentage of patients with postoperative morbidity (as defined by POMS)
according to discharge status by surgical speciality. Percentage of patients
with morbidity in each POMS domain by surgical speciality at all
postoperative timepoints................................................................................................... 133
Table 27 The Middlesex Hospital postoperative morbidity study (n=439),
frequency of developing subsequent POMS defined morbidity after being
morbidity free as defined by POMS................................................................................ 137
Table 28 Surgical procedure categories included in the Middlesex postoperative
morbidity study (UK cohort) (n=439) compared with those included in the
Duke postoperative morbidity study (USA cohort) (n=438)............................... 140
Table 29 Comparison of POMS domain frequencies and the number of patients
remaining in hospital on postoperative days 5, 8 and 15 between the
Middlesex postoperative morbidity study (UK cohort) (n=439) and the Duke
postoperative morbidity study (USA cohort) (n=438)........................................... 141
Table 30: Middlesex postoperative morbidity study (UK cohort) (n=439). Kuder-
Richardson coefficient of reliability (KR-20) for the 9 domains of the POMS on
postoperative day 3 (433 patients remaining in hospital on Day 3). ............... 154
Table 31: Middlesex postoperative morbidity study (UK cohort) (n=439). Kuder-
Richardson coefficient of reliability (KR-20) for the 9 POMS domains on
postoperative day 5 (407 patients remaining in hospital on Day 5). ............... 154
Table 32: Middlesex postoperative morbidity study (UK cohort) (n=439). Kuder-
Richardson coefficient of reliability (KR-20) for the 9 POMS domains on
postoperative day 8 (299 patients remaining in hospital on Day 8). ............... 155
Table 33: Middlesex postoperative morbidity study (UK cohort) (n=439). Kuder-
Richardson coefficient of reliability (KR-20) for the 9 POMS domains on
postoperative day 15 (111 patients remaining in hospital on Day 15). .......... 155
Table 34 Middlesex postoperative morbidity study (UK cohort) (n=439).
Remaining length of stay (days) in patients with and without POMS-defined
morbidity on postoperative day three.......................................................................... 156
Table 35: Middlesex postoperative morbidity study (UK cohort) (n=439).
Remaining length of stay (days) in patients with and without POMS-defined
morbidity on postoperative day five. ............................................................................ 157
12
Table 36: Middlesex postoperative morbidity study (UK cohort) (n=439).
Remaining length of stay (days) in patients with and without POMS-defined
morbidity on postoperative day eight. ......................................................................... 158
Table 37: Middlesex postoperative morbidity study (UK cohort) (n=439).
Remaining length of stay (days) in patients with and without POMS-defined
morbidity on postoperative day fifteen. ...................................................................... 159
Table 38: Middlesex postoperative morbidity study (UK cohort) (n=439). Rates
(%) of POMS-defined morbidity on postoperative day 3 in patients with
different ASA-PS score categories* and in different POSSUM-defined
morbidity risk categories................................................................................................... 160
Table 39: Middlesex postoperative morbidity study (UK cohort) (n=439). Rates
(%) of POMS-defined morbidity on postoperative day 5 in patients with
different ASA-PS score categories* and in different POSSUM-defined
morbidity risk categories................................................................................................... 160
Table 40: Middlesex postoperative morbidity study (UK cohort) (n=439). Rates
(%) of POMS-defined morbidity on postoperative day 8 in patients with
different ASA-PS score categories* and in different POSSUM-defined
morbidity risk categories................................................................................................... 161
Table 41: Middlesex postoperative morbidity study (UK cohort) (n=439). Rates
(%) of POMS-defined morbidity on postoperative day 15 in patients with
different ASA-PS score categories* and in different POSSUM-defined
morbidity risk categories................................................................................................... 161
13
Table of Figures
Figure 1 Mortality at longest follow-up ................................................................................89
Figure 2 Post-hoc analysis of pooled hospital and 28-day data mortality ..............89
Figure 3 Renal impairment (study authors criteria) .......................................................92
Figure 4 Respiratory failure/ARDS (study authors criteria)........................................93
Figure 5 Infection (study authors criteria)..........................................................................93
Figure 6 Number of patients with complications.............................................................94
Figure 7 Length of hospital stay...............................................................................................94
Figure 8 Length of critical care stay .......................................................................................94
Figure 9 Mortality by timing of intervention (pre- vs. intra- vs. postoperative) ..96
Figure 10 Mortality by type of intervention (fluids and inotropes vs. fluids alone)
......................................................................................................................................97
Figure 11 Mortality by goals of intervention (CO, DO2 vs. Lactate, SvO2 vs. SV) .99
Figure 12 Mortality by mode of surgery (elective vs. emergency).......................... 100
Figure 13 Mortality by type of surgery (vascular vs. cardiac vs. general)............ 101
Figure 14 Scatter plot of POSSUM morbidity risk (%) against postoperative
length of hospital stay (days) ........................................................................................... 129
Figure 15 Scatter plot of ASA-PS Score against postoperative length of hospital
stay (days)................................................................................................................................ 129
Figure 16 Scatter plot of duration of surgical procedure (minutes) against
postoperative length of hospital stay (days).............................................................. 130
Figure 17 Scatter plot of estimated intraoperative blood loss (mls) against
postoperative length of hospital stay (days).............................................................. 130
Figure 18 The Middlesex Hospital postoperative morbidity study (n=439),
frequency of POMS domains on postoperative day 3 (POD 3) and
postoperative day 5 (POD 5) by surgical specialty .................................................. 134
Figure 19 The Middlesex Hospital postoperative morbidity study (n=439),
frequency of POMS domains on postoperative day 8 (POD 8) and
postoperative day 15 (POD 15) by surgical specialty............................................. 135
Figure 20 The Middlesex Hospital postoperative morbidity study (n=439), the
frequency of patients remaining in hospital with prevalence of postoperative
morbidity (POMS defined) on postoperative days 3,5,8 and 15 (PODs 3, 5, 8
and 15). .................................................................................................................................... 136
14
Figure 21 Comparison of the ASA-PS score distribution between the Middlesex
postoperative morbidity study (UK cohort) (n=439) and the Duke
postoperative morbidity study (USA cohort) (n=438)........................................... 139
Figure 22 Distribution of ASA-PS Score and POSSUM Morbidity and Mortality
Risk by Surgical Specialty in the Middlesex postoperative morbidity study
(n=438). .................................................................................................................................... 166
Figure 23 Distribution of POSSUM Physiological and Operative Severity Scores by
Surgical Specialty in the Middlesex postoperative morbidity study (n=438).
..................................................................................................................................... 167
15
Abbreviations
ACS American College of Surgeons
APACHE Acute Physiology and Chronic Health Evaluation
ARDS Acute Respiratory Distress Syndrome
ASA-PS American Society of Anesthesiologists (ASA) Physical Status
Classification
ASN Association of Surgery of the Netherlands
BUPA British United Provident Association
BHOM Biochemistry and Haematology Outcomes Model
CONSORT Consolidated Standards of Reporting Trials
CO Cardiac Output
CI Cardiac Index
DO2 Oxygen Delivery Index
DUMC Duke University Medical Centre
GDP Gross Domestic Product
HDU High Dependency Unit
HLOS Hospital Length of Stay
HMO Health Management Organisation
HRQoL Health Related Quality of Life Instrument
HQCFA High Quality Care for all
HTA Health Technology Assessment
ICC Interclass correlation
ICU Intensive Care Unit
KR20 Kuder-Richardson formula 20
MD Mean Differences
MODS Multiple Organ Dysfunction Syndrome
NCEPOD National Confidential Enquiry into Perioperative Death
NSQUIP National Surgical Quality Improvement Program
NVASRS National Veterans Affairs Surgical Risk Study
NYHA New York Heart Association
OE ratio Observed to expected ratio
OR Odds Ratio
16
P4P Payment for Performance
POD Post Operative Day
POMS Postoperative Morbidity Survey
POSSUM Physiological and Operative Severity Score for the
Enumeration of Mortality and Morbidity
P-POSSUM Portsmouth version of the POSSUM
PROMS Patient Reported Outcome Measures
QALYs Quality-adjusted life years
QoR Quality of Recovery Score
RCRI Revised Cardiac Risk Index or Lee Cardiac Risk Index
RCT Randomized controlled trials
RC Reliable Change
ROC Receiver Operator Curve
SOFA Sepsis Related Organ Failure Assessment Score
SIRS Systemic Inflammatory Response Syndrome
SF-36 Short Form (36) Health Survey
SRS Surgical Risk Score
SSI Surgical Site Infection
SV Stroke Volume
SVO2 Mixed Venous Oxygen Saturation
TRACS Trauma Registry of the American College of Surgeons
USATS United States Association of Thoracic Surgeons
VA US Department of Veterans Affairs
VO2 Oxygen consumption
WHO World Health Organisation
17
Chapter 1: Background
1.1 Introduction
This chapter will discuss the potential value of high quality reporting of outcomes
following major surgery, review the currently available metrics for achieving this
aim, and discuss some of the methodological issues surrounding validation of these
clinical measurement tools.
I will start by discussing the value and utility of being able to describe
quantitatively the elements of the surgical journey and their impact on the patient,
and by briefly placing this area in the current political context.
I will then review the available metrics for describing risk in relation to surgery
and outcome following surgery; interpretation of outcome is profoundly limited in
the absence of a contextual description of risk. The lack of an adequate validated
tool for describing clinically significant, short-term non-fatal postoperative harm
will be highlighted.
Finally I will discuss the technical issues surrounding the development and
validation of outcome metrics in general, and in the perioperative environment in
particular. Specifically I will explore the contrasting conceptual models, and
consequent statistical differences, of the psychometric and clinimetric approaches
to survey and score development.
1.2 Why measure outcomes relating to surgery?
Outcome following surgery is a significant public health issue. Data published in a
recent study sponsored by the World Health Organisation (WHO) suggest that
more than 234·2 (95% CI 187·2—281·2) million major surgical procedures are
undertaken every year worldwide 1. In this study major surgery was defined as
“any intervention occurring in a hospital operating theatre involving the incision,
excision, manipulation, or suturing of tissue, usually requiring regional or general
anaesthesia or sedation.” The authors concluded, “In view of the high death and
complication rates of major surgical procedures, surgical safety should now be a
18
substantial global public-health concern.” and that “Public-health efforts and
surveillance in surgery should be established.”
Surgical procedures have major physical, psychological and social impacts on
patients and consume significant resources. The goals of surgical intervention are
to increase length (e.g. cancer surgery) or quality of life (e.g. joint replacement
surgery). However the tissue trauma related to surgical procedures and the
associated physiological disturbance of anaesthesia and other perioperative
interventions may cause significant harm to some patients: surgery (and
particularly major surgery) is associated with a significant risk of death or other
adverse outcome.
The United States has the highest per capita and total healthcare expenditure in
the world 2 and might therefore be expected to produce surgical outcomes that are
amongst the best possible. The US National Veterans Affairs Surgical Risk Study
reported an overall mortality of 1.2-5.4% for major non-cardiac surgery 3 and a
morbidity rate between 7.4 and 28.4% 4. A larger US epidemiological study (1994-
1999) including more than 2.5 million patients reported mortality rates between
2.0% and 23.1% for major surgical procedures including cardiac and thoracic
surgery 5. More recent US data from the 20,000 patients in the National Surgical
Quality Improvement Program (NSQIP) reported a mortality rate of 1.7-2.2% for
major surgery and corresponding morbidity rates of 13.1-14.3% 6.
In a UK dataset of more than 4 million surgical admissions to hospital (1999-
2004), mortality was 0.44% following elective surgery and 5.4% following
emergency surgery 7. In this cohort the authors identified a high-risk group,
comprising 0.5 million patients (12.5%) with a mortality of 12.3% 7. Accepting the
WHO estimate of total global surgical volume and assuming a global mortality rate
relating to surgery between 0.44 7 and 2.2% 6 (probably conservative as developed
world outcomes are likely to be better than developing world outcomes) then
death following surgery occurs between 1 and 5 million times per year and
significant complications at approximately 5-10 times this rate. Furthermore,
long-term outcome following major surgery is becoming recognised as a
significant public health problem. A recent follow-up study (16-19 years later) of a
19
prospective cohort (1985-1988) of more than 6000 civil servants in the UK,
sickness absence of > 7 days for any surgical operation was associated with a
hazard ratio for mortality of 1.9 (95% CI 1.2 to 3.1) after adjustment for age,
gender and employment grade, and this was the second largest category effect
after circulatory diseases (adjusted hazard ratio 2.2, 95% confidence intervals 1.3
to 2.1) 8. This effect may be modulated by immediate (in-hospital) postoperative
outcome. In a US study of more than 100,000 patients who underwent major
surgery between 1991 and 1999 and were followed up for an average of 8 years,
the most important determinant of decreased postoperative survival was the
occurrence of one of 22 predetermined complications within 30 days of surgery 9.
Median survival was reduced by 69% in patients meeting this criterion and this
was a more important determinant than preoperative risk or intraoperative events
9.
There is a moral and political imperative to improve quality of care and cost-
effectiveness with respect to healthcare in general, and surgery in particular.
Maximising the benefit gained from the scarce resources available within health
systems and minimising the harm of surgery should be self-evident and accepted
goals of those involved with healthcare systems, be they consumers, providers,
managers, policy makers or community members. However it is unclear how
these goals can be achieved if we are unable to describe the quality, or cost-
effectiveness, of care.
In this context, meaningful description and reporting of outcomes following major
surgery has a number of potential merits. First, it allows monitoring and
comparison of the process and delivery of care between peers (people, teams or
institutions) 3. Thus it is possible to spread best practice, highlight and remediate
situations where practice may be less good, and thereby improve the overall
standard of healthcare delivery 10. Second it allows informed choice for the
consumers of healthcare: patients 11 and purchasers 12. Interestingly, although
there is data to suggest that some patients may be both ambivalent and poorly
informed about choosing providers based on performance indicators 13,14, more
recent data suggest that performance data and information on other patients
experiences are valued 15. Third it permits more effective evaluation of innovations
20
in healthcare 16. Fourth it facilitates rational decisions about resource distribution
within a health care system 17. Finally reporting outcomes may have direct value
in engaging healthcare professionals (clinicians and managers) more closely with
the consequences of their actions, and thereby drive improvements in care at a
local level 18.
1.3.1 UK Perspective
The 1942 Beveridge Report identified the ‘Five Giants’ (want, disease, ignorance,
squalor and idleness) that a civilised society should seek to collectively address.
Following legislation by the Labour government of 1946, the National Health
Service (NHS) was formally established on 5 July 1948. The underlying principals,
universal provision of healthcare, free at the point of contact and paid for out of
general taxation are for the most part intact at the beginning of the 21st century.
However, by the beginning of the 21st century a chronic funding deficit relative to
comparable developed nations (proportion of Gross Domestic Product) had
resulted in a perception, in some cases supported by data 19, that clinical outcomes
were worse than comparator nations.
In addition high-profile “scandals”, including the case of Manchester general
practitioner Harold Shipman and the enquiry into excess deaths following
children’s cardiac surgery at the Bristol Royal Infirmary 20, had undermined
government and public confidence in the idea of professional self-regulation. The
resulting changes aimed to introduce openness and accountability into monitoring
of health care in the UK. In the surgical arena, the publication of outcome data for
cardiac surgery on a named surgeon basis is a direct result of the Bristol enquiry
and similar changes will follow in other surgical specialties 21.
In response to press comments about the quality of UK healthcare in the winter of
2001, the government announced a major new NHS funding initiative with the
specific aim of bringing UK funding levels up to equivalence with the European
Union average over 5 years. An important element of the proposed plan was that
additional accountability within the NHS was essential to demonstrate that the
additional funding was resulting in improved outcomes. However, the majority of
indicators reported by the Health Care Commission were measures of process not
outcome (see below, 1.4.2), and none were risk adjusted (see below, 1.4.4).
21
Explicit performance targets are now an integral part of how hospitals are
assessed and rewarded financially. In an effort to performance manage the NHS,
the UK government introduced “Payment by Results” in 2002, with money
supposedly following improved performance 22. However the current financial
flows almost universally relate to activity measures rather than measures of
clinical quality, and have been labelled “payment for activity” to reflect that
“money flows irrespective of outcomes.” 23.
Most recently the “NHS Next Stage Review” chaired by Lord Darzi, and the
publication of the final report of this process “High Quality Care For All” 24 have
changed the context of outcome reporting within the UK healthcare economy. This
document places “quality” at the centre of the national healthcare agenda. The key
aims of the report are to give patients and the public more information and choice,
“work in partnership” and to have quality of care at the heart of the NHS (quality
defined as clinically effective, personal and safe) 24. Three key domains of metrics
are identified: safety, clinical effectiveness (including patient reported outcomes)
and personal experience (see below, 1.4.1 Performance and quality indicators in
healthcare). The need for reliable and valid measures of outcome is now at the
centre of the UK health agenda.
1.3.2 USA Perspective
An alternative model for healthcare exists in the US with the majority of richer
individuals and families receiving private healthcare paid for by employer
provided or private insurance schemes. Some older and poorer individuals and
families have access to health care provision by government-funded schemes paid
for out of general taxation: Medicare provides for patients aged over 65 (or
meeting other special criteria) and Medicaid provides for families with low
incomes or limited resources. Although both these systems are perceived to offer
a lower standard of care than the private system, the published data suggests that
risk adjusted mortality is similar for public and for-profit hospitals but lower for
not-for-profit hospitals 25. Interestingly cost per patient for delivered care is
similar for public, for-profit and not-for-profit hospitals 26, and in comparison with
the NHS 27 but the scope of delivered care differs. The Veterans Affairs program is
a separate government funded health system supervised by the Department of
22
Veterans Affairs and caring for veterans of the American military services and their
close family.
Escalating costs, particularly in the private sector, have resulted in a position
where healthcare costs are close to 15% of Gross Domestic Product 2 and cost
containment has become high priority for both the government funded and private
systems. In the private sector, market driven changes have led to the aggregation
of purchaser power in Health Management Organisations (HMOs) with aggressive
cost-containment programs and this is driving cost-containment across the
healthcare spectrum 28. Political pressure for cost containment within the public
sector has led to several cost containment programs and quality/cost-effectiveness
initiatives. In relation to surgery the United States Association of Thoracic
Surgeons (USATS) has a track record of reporting named surgeon and institutional
cardiac surgery outcomes 29.
For patients undergoing other types of surgery the National Surgical Quality
Improvement Program (NSQIP) has been developed and validated within the
Veterans Administration hospitals and is embedded within their process of care
for surgical patients (see below, 1.5.7) 30. More recently the NSQIP has been
validated within a number of private hospitals 10 and it is now being extended
nationwide in a process being driven by the American College of Surgeons under a
congressional mandate (July 2005). In the US “Payment for performance” (P4P)
has been introduced and in the surgical specialties it is anticipated that P4P will be
linked directly to outcomes as defined by the ACS-NSQIP 31.
1.4 Evaluating Outcome following Surgery
1.4.1 Performance and quality indicators in healthcare
Performance targets can be used to guide progress towards defined objectives in
healthcare 32. Measurement of performance for organisations developed from the
work of Peters and Waterman in the early 1980s 33. A variety of performance
measurement systems are now in use in the healthcare environment, for example
the “balanced scorecard” 34-36. Performance targets should be defined by stated
organisational objectives and should reflect critical success factors. Critical
success factors are elements (processes or events) that are essential for the
23
successful achievement of defined objectives 37,38. They should be simple to
understand, focus attention on major concerns, be easy to communicate and easy
to monitor 37. Organisational objectives or targets (within or without healthcare)
are believed to be most effective when they fulfil the following “SMART”
conditions: specific, measurable, achievable, realistic and time-bound 39,40.
Organisational objectives of healthcare institutions are commonly published in the
public domain. For example, the mission statement of the University College
London Hospitals (a UK teaching hospital) states: “UCLH is committed to
delivering top quality patients care, excellent education and world class research.”
41. Interestingly, and consistent with national targets, of the ten stated UCLH
objectives (2008-2009), only three relate directly to patient quality, perhaps
reflecting a tension between desired objectives and measurable outcomes.
Quality indicators are a subgroup of performance indicators. Quality is defined as
“the degree of excellence” of the object of concern 42. Within the context of
healthcare in the UK, “High Quality Care for all” (HQCFA) has categorised quality
into three domains 24: safety, clinical effectiveness and personal experience. Safety
is not explicitly defined in HQCFA but the implicit meaning in the document
centres around the injunction to “do no harm,” to reduce avoidable harm (e.g.
healthcare associated infections and drug errors) and to eradicate “never events”
(events that should never happen, e.g. wrong-side surgery). Clinical effectiveness
is defined as success rates from treatments measured by clinicians and/or patients
(Patient Reported Outcome Measures (PROMs)). These are clinical outcomes (see
below, 1.4.2) and include mortality, complication rates (e.g. morbidity), subjective
function (e.g. pain-free movement of a joint: a PROM) as well as well-being and
quality of life measures. Personal experience is defined by the analysis and
understanding of patient satisfaction including satisfaction with quality of caring
(compassion, dignity and respect).
The use of quality measures can be divided into three areas: internal quality
improvement, external accountability (performance management) and external
“data for judgement” 43. The two external uses of data can be distinguished by
whether the data is used in a non-perjorative manner to prompt further
investigation and remedial measures, or whether the data is used for sanction or
24
reward (e.g. suspension for poor performance, financial benefit for good
performance) 43.
1.4.2 Dimensions of quality in relation to surgery
The dimensions by which quality of healthcare can be assessed are commonly
divided into structure, process and outcomes 44. Structure consists of the
components of the environment in which health care is delivered (institution,
equipment, personnel etc). Process comprises actions of the healthcare providers
in relation to the patient (preoperative preparation, intraoperative management
including choice of procedure, and postoperative care). Outcome refers to the
patient’s subsequent heath status (including mortality, morbidity and quality of
life).
There is debate about which element of the quality dimension triad is the most
suitable for assessing quality of care. Although clearly fundamental to the quality
of delivered care, structural measures are relatively stable over time and therefore
not amenable to performance measurement and management. Whilst a structural
measure may be a critical success factor for a clinical objective (e.g. commencing
an ambulatory surgery service requires a day-theatre and staff), structure is
generally considered to be a component of the environment that permits quality
rather than an element or quality itself. Process measures reflecting structural
factors (hospital size), including the number of procedures of a particular type
performed each year by an individual surgeon (surgical volume) 45 or hospital
(hospital volume) 5, are associated with outcome (surgical mortality). On a smaller
scale, process measures such as the correct (evidence based) administration of
perioperative antibiotics (correct antibiotic, within one hour of incision,
discontinued within 24 hours), have also been associated with better outcomes 15.
However, although structural and process measures may be associated (and in
some cases causally related) with outcomes, and thereby merit monitoring and
improvement initiatives, their validity rests on their relationship with, and
influence on, patient outcomes (as demonstrated in the studies cited above).
Lilford and others have argued persuasively that process measures are more
suitable than outcome measures for judging and rewarding quality 43. They cite a
low signal to noise ratio and “risk-adjustment” fallacy as reasons why outcome
25
measurement has limited utility. Correlation between quality of care and mortality
is low in some studies 46,47 whereas others are able to detect small differences in
hospital risk adjusted mortality in association with differences in hospital
performance 48. Low correlation between these two measures indicates that a
limited amount of variance in the measured outcome (mortality) can be attributed
to variance in quality (low signal to noise ratio) suggesting that factors other than
quality of care may be affecting mortality. Alternatively, these data might be
interpreted as indicating limitations in the quality metrics (many of which were
process based) 46,47 or in the assumption that process measures accurately reflect
outcome measures (which is central to the validity of process measures) or in the
risk adjustment metrics. Limitations in risk adjustment complicate the
interpretation of outcome data. Residual confounding from unmeasured (perhaps
unknown) determinant variables, variation in outcome definitions, and flawed
modelling assumptions may all limit the precision of risk estimates 43,49. Finally,
when patients are the reporters of outcomes, reporting of outcomes can be
confounded by patient expectations 50.
Process measures have some advantages including reduced stigma (or fault
attribution), reduced risk of “case-mix bias”, reduced focus on “sick” outliers, and
ease of recording, but these benefits are relative, not absolute. Theoretically,
empirically, and in practice, the validity of process measures of clinical care rests
on their relationship with outcome. World-class outcomes in association with
imperfect processes are self-evidently preferable to perfect processes with poor
outcomes. However process measures have significant limitations. When quality
or performance is defined by process measures (e.g. volume of procedures
completed, compliance with care bundle) there is a risk that perverse incentives
may arise as an unintended consequence of well-intended measurement
initiatives. For example, managers may be compelled to meet imposed process
targets (with financial consequences if they fail) despite the fact that this may
result in overall worse outcomes. A specific example occurs in relation to so-
called extreme-value targets such as the four-hour-wait in emergency
departments: overall costs have risen as clinicians have admitted patients to
hospital who previously were safely discharged home, in order to meet the
26
imposed target 51. In relation to such targets, it is recognised that “typically
avoiding extremes consumes disproportionate resources.” 52
Lilford’s critique highlights potential limitations of outcome measurement that
must be overcome if outcome measures are to be valid. However, rather than
making a convincing case for process as superior to outcome measurement, his
comments highlight the importance of outcome measures. Comprehensive quality
reporting is likely to involve the complementary use of process and outcome
measures, particularly where outcomes verification (and therefore assessment) is
delayed. Comprehensive quality reporting will require ongoing validation of
outcome measures (in relation to changes in populations and patterns of care) as
well as validation of process measures to ensure that the underlying assumption of
relationship with outcome remains valid.
Public reporting of outcomes and outcomes-funding linkage will increase the
incentives for those involved in the system to subvert results in order to improve
the reputational or financial position of individuals and institution. This
subversion may take the form of fraud, whereby results are deliberately
inaccurately recorded to misrepresent outcomes, or may be more subtle whereby
results are accurately recorded but patterns of behaviour/referral/patient
selection/coding are altered to improve results: so-called “gaming”. Gaming is
clearly different to fraud, but may result in unintended consequences. If methods
of assessment are seen to favour either low- or high-risk procedures the result
may be that patterns of clinical decision-making are distorted. The hazard
inherent in gaming is that deliberate patient selection to optimize measured
outcomes results in worse care on a population level but improved reported
outcomes (perverse incentives). For example high-risk patients who might have
the greatest relative gain from a procedure may be denied access to surgery
because they have significant potential to adversely affect reported outcomes.
This occurred in New York State when cardiac surgery outcomes were first
published and referral patterns changed 53.
In conclusion, from the perspective of monitoring of quality, structure elements
are both easy to monitor, and slow to change, and therefore not suitable for
27
monitoring quality and performance in relation to delivery of care. Process and
outcome measures may both be used to evaluate quality following surgery and
understanding the strengths and limitations of each category of measure is
important.
The subject of this thesis is outcome measurement. I will therefore confine
subsequent discussion of process measures to situations where process is used as
a surrogate of outcome (e.g. duration of hospital stay following surgery).
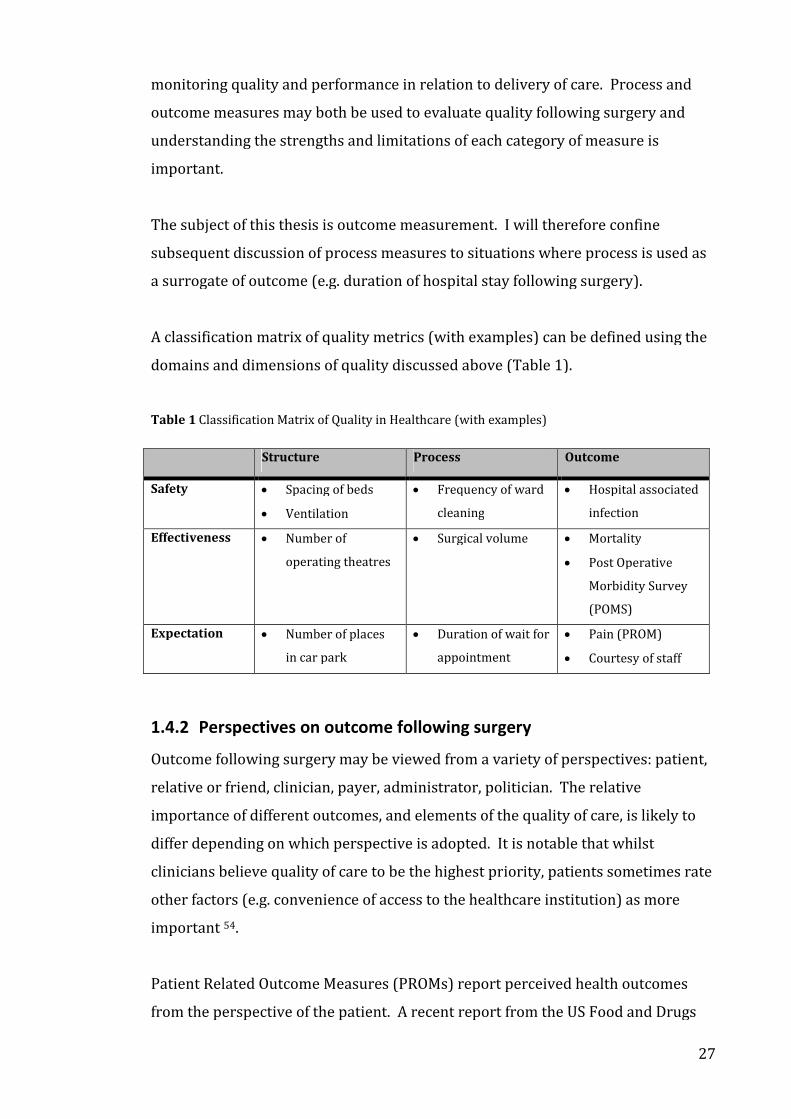
A classification matrix of quality metrics (with examples) can be defined using the
domains and dimensions of quality discussed above (Table 1).
Table 1 Classification Matrix of Quality in Healthcare (with examples)
Structure Process Outcome
Safety Spacing of beds
Ventilation
Frequency of ward
cleaning
Hospital associated
infection
Effectiveness Number of
operating theatres
Surgical volume Mortality
Post Operative
Morbidity Survey
(POMS)
Expectation Number of places
in car park
Duration of wait for
appointment
Pain (PROM)
Courtesy of staff
1.4.2 Perspectives on outcome following surgery
Outcome following surgery may be viewed from a variety of perspectives: patient,
relative or friend, clinician, payer, administrator, politician. The relative
importance of different outcomes, and elements of the quality of care, is likely to
differ depending on which perspective is adopted. It is notable that whilst
clinicians believe quality of care to be the highest priority, patients sometimes rate
other factors (e.g. convenience of access to the healthcare institution) as more
important 54.
Patient Related Outcome Measures (PROMs) report perceived health outcomes
from the perspective of the patient. A recent report from the US Food and Drugs
28
Administration defines PROMs as: ‘‘a measurement of any aspect of a patient’s
health status that comes directly from the patient (i.e., without the interpretation
of the patient’s responses by a physician or anyone else)” 55,56. Examples of PROMs
include the Short From (36) Health Survey (SF36) 57, a Health-related Quality of
Life Instrument (HRQoL) and the Oxford Hip Score 58. PROMs have been used
particularly in the monitoring of postoperative outcome in conditions where
improvement of symptoms is the aim of surgery (e.g. joint replacement surgery)
59,60. In clinical trials, PROMs may be better discriminators of treatment response
(in comparison with placebo) than physician reported outcomes or biomarkers 61.
However in clinical practice, PROMs (and in particular HRQoLs) may have
substantial 62, or little or no impact on clinical decision making 63, and do not seem
to impact patient health status 62. Concerns have been expressed about combining
different PROMs within meta-analyses because bias maybe introduced due to
heterogeneity of responsiveness 64. PROMs may also be susceptible to
confounding due to variation in patient expectations 50.
1.4.3 A conceptual model for outcome following surgery
A surgical episode can be conceptualised as having a number of inputs to a defined
process that has a defined output (or outcome). The inputs are the patient’s state
prior to surgery and the structural elements of the quality of care model discussed
above. The process comprises what the healthcare providers do to the patient
(preoperative preparation, intraoperative management including choice of
procedure, and postoperative care): the process dimension of the quality of care
model described above. The output is the patient’s state following surgery (the
outcomes), the dimensions of which will be discussed further in Section 1.6.
Iezzoni has proposed the following model 65:
Patient Factors + Effectiveness of Care + Random Variation = Outcome
Effectiveness of care encompasses both structure and process. Risk adjustment
(or case-mix adjustment) allows separation of the effects of patient factors and
effectiveness of care.
29
1.4.4 The importance of risk (case-mix) adjustment
Theoretically risk adjustment compensates for inter-individual differences
(patient factors) in order to remove any confounding in the assessment of
effectiveness of care and thereby maximize the signal to noise ratio, recognizing
that residual noise from random variation will always be present. In practice
residual confounding remains due to the effect of unmeasured and/or
unanticipated but influential patient factors 66.
Adequate risk adjustment allows the separation of patient related factors from the
structure and process elements of effectiveness of care in the perioperative setting,
which in turn permits the identification of variation, and thereby drives
improvement in delivered care. By this means, high quality care will be identified
and promoted whereas lower quality care can be replaced with more effective
approaches.
Risk adjustment scores are commonly developed from cohort studies. A large
group of candidate independent variables believed to be associated with adverse
outcome (e.g. age, comorbidities) and dependent variables (outcome, e.g.
mortality) are collected in an observational cohort study (derivation cohort).
Subsequently regression analysis is used to define the relationship between the
independent and dependent variables in order to derive a model that underpins
the risk adjustment scoring scheme. Scoring may incorporate weighting of
variables, or more complex manipulation of data involving entering derived
variables into regression equations with coefficients derived from the derivation
cohort. Subsequent prospective validation of the developed system in a separate
cohort (validation cohort) should include evaluation of calibration (goodness of fit)
of the observed outcomes when compared to those predicted by the model,
discrimination between patients with and without the condition under test (e.g.
area under receiver operator curve (ROC)) and reliability (see 1.7.3 Reliability)
67. Importantly, risk-adjustment models are only validated for the conditions
under which they are tested: the validation is outcome, timeframe, population and
purpose specific 66. For example, the original Physiological and Operative Severity
Score for the Enumeration of Mortality and Morbidity (POSSUM) equation
developed by Copeland is specific to in-hospital mortality and morbidity (two
30
separate equations) in adults undergoing major surgery in the UK 68.
Extrapolation of validity to other populations may be possible but should never be
assumed; rather it should be formally tested to establish validity in the new
context.
In some systems of risk adjustment, the expected outcome for an observed cohort
is obtained by summing the individual risks of a specific event for all the members
of that cohort. This value is then compared with the observed frequency of the
event under consideration and an observed to expected ratio (OE ratio) calculated
68 in a manner analogous to the calculation of standardized mortality rates (e.g.
Acute Physiology and Chronic Health Evaluation in intensive care patients) 69,70.
An OE ratio of greater than one signifies worse outcomes in the study cohort than
expected, less than one indicates better expected outcomes in the study cohort,
and a ratio of 1 indicates that the study cohort’s results are consistent with our
expectations (based on data from the derivation and validation cohorts). This
approach emphasizes the importance of considering validity relative to the
outcome, timeframe, population and purpose characteristics of the original
derivation and validation cohorts.
1.4.6 Terminology: Perioperative or Surgical Outcomes?
Although the terms “Surgical Outcomes” and “Perioperative Outcomes” are
commonly used interchangeably, strictly they refer to distinct but overlapping
patient groups. Perioperative refers to events occurring in temporal relation to an
operation (procedure). Surgical may be used with the same meaning, but may also
be used to refer to the group of patients who are cared for by surgeons, and/or
have conditions that are potentially amenable to surgical treatment. Clearly the
definition of surgical is both inconsistent and context dependent (e.g. the same
patient might be cared for by physicians or surgeons depending on the
arrangements within a particular institution). The term perioperative is therefore
preferred for reasons of consistency and clarity.
Perioperative encompasses the pre- intra- and post-operative phases. Within this
thesis, preoperative is defined as before surgery (prior to entering the anaesthetic
room), intraoperative is defined as during and around the time of surgery (from
arrival in the anaesthetic room to leaving operating room) and postoperative is
31
defined as everything occurring thereafter. Outcome following Surgery is
therefore synonymous with postoperative outcome. Alternative definitions of
start and end of surgery may alter the attribution of events to the pre- intra- and
post-operative phases. For example, if the criterion for “before surgery” is “knife
to skin”, then events relating to the induction of anaesthesia will be defined as
preoperative, whereas if “entering the anaesthetic room” is the criterion, of such
an event would be classified as intraoperative.
1.5 Risk (case-mix) adjustment of outcomes and surgery
1.5.1 Introduction
A variety of methods have been used to identify patients at increased risk of
adverse outcome (mortality and morbidity) following major surgery and to
quantity the level of this risk. There is a balance between ease of use in the clinical
setting and precision in distinguishing between different levels of risk: simple
systems which are easy to use tend to have fewer variables which are readily
accessible and a simple method of deriving the score (e.g. simple sum). More
complicated systems incorporating multiple variables from a variety of sources,
and utilizing more complicated methods (e.g. regression analysis) to derive the
score achieve greater precision but with the cost that they may be cumbersome to
use in clinical practice. The advent of clinical information systems integrating
multiple inputs and available at the bedside may overcome some of the problems
associated with more complicated scoring systems. This section describes a
variety of approaches to describing risk in relation to major surgery. The scope of
this review is limited to major surgery and scores developed specifically for
cardiac surgery or neurosurgery are not included.
1.5.2 American Society of Anesthesiologists Physical Status
Classification
The simplest and oldest recognised classification of risk in patients undergoing
surgery is the American Society of Anesthesiologists (ASA) physical status
classification (ASA-PS). The classification was originally published in 1941 71 and
revised to close to its current form in 1963 72,73. The current reference description
of the ASA-PS is presented in Table 2 74. The 1963 version of this classification 73,
(probably the most commonly used and referenced version), includes reference to
32
differences in “functional limitation” in the criteria for classes II and II (see
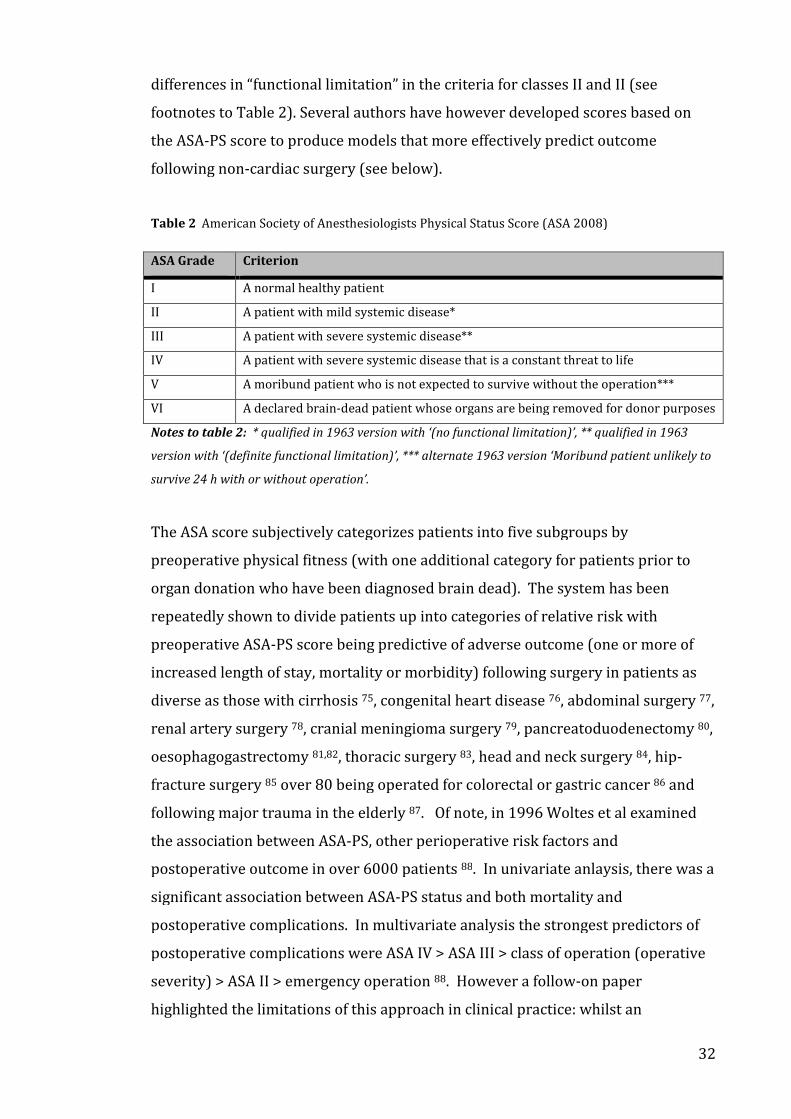
footnotes to Table 2). Several authors have however developed scores based on
the ASA-PS score to produce models that more effectively predict outcome
following non-cardiac surgery (see below).
Table 2 American Society of Anesthesiologists Physical Status Score (ASA 2008)
ASA Grade Criterion
I A normal healthy patient
II A patient with mild systemic disease*
III A patient with severe systemic disease**
IV A patient with severe systemic disease that is a constant threat to life
V A moribund patient who is not expected to survive without the operation***
VI A declared brain-dead patient whose organs are being removed for donor purposes
Notes to table 2: * qualified in 1963 version with ‘(no functional limitation)’, ** qualified in 1963
version with ‘(definite functional limitation)’, *** alternate 1963 version ‘Moribund patient unlikely to
survive 24 h with or without operation’.
The ASA score subjectively categorizes patients into five subgroups by
preoperative physical fitness (with one additional category for patients prior to
organ donation who have been diagnosed brain dead). The system has been
repeatedly shown to divide patients up into categories of relative risk with
preoperative ASA-PS score being predictive of adverse outcome (one or more of
increased length of stay, mortality or morbidity) following surgery in patients as
diverse as those with cirrhosis 75, congenital heart disease 76, abdominal surgery 77,
renal artery surgery 78, cranial meningioma surgery 79, pancreatoduodenectomy 80,
oesophagogastrectomy 81,82, thoracic surgery 83, head and neck surgery 84, hip-
fracture surgery 85 over 80 being operated for colorectal or gastric cancer 86 and
following major trauma in the elderly 87. Of note, in 1996 Woltes et al examined
the association between ASA-PS, other perioperative risk factors and
postoperative outcome in over 6000 patients 88. In univariate anlaysis, there was a
significant association between ASA-PS status and both mortality and
postoperative complications. In multivariate analysis the strongest predictors of
postoperative complications were ASA IV > ASA III > class of operation (operative
severity) > ASA II > emergency operation 88. However a follow-on paper
highlighted the limitations of this approach in clinical practice: whilst an
33
uncomplicated course was correctly predicted with a frequency of 96%,
complications were correctly predicted in only 16% of patients (positive
predictive value = 57%, negative predictive value = 80%). The ASA-PS was
originally envisaged as a descriptor of “anaesthetic” risk for epidemiological
purposes. Even at the time of its introduction it was recognised that the properties
of the ASA-PS (sensitivity, specificity, positive and negative predictive values)
would not be adequate to predict outcome with confidence on an individual
patient basis. The ASA-PS score is not commonly used to derive observed-
expected ratios for postoperative outcomes.
Several authors have however developed scores based on the ASA-PS score to
produce models that more effectively predict outcome following non-cardiac
surgery (see below).
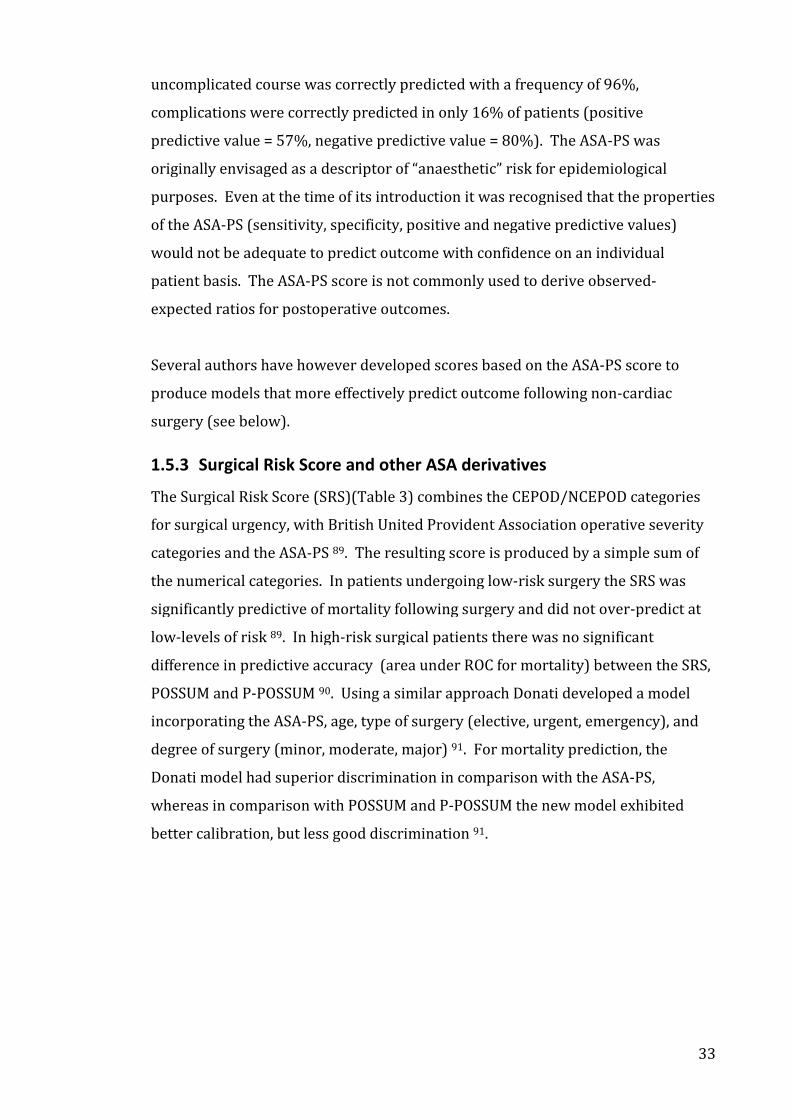
1.5.3 Surgical Risk Score and other ASA derivatives
The Surgical Risk Score (SRS)(Table 3) combines the CEPOD/NCEPOD categories
for surgical urgency, with British United Provident Association operative severity
categories and the ASA-PS 89. The resulting score is produced by a simple sum of
the numerical categories. In patients undergoing low-risk surgery the SRS was
significantly predictive of mortality following surgery and did not over-predict at
low-levels of risk 89. In high-risk surgical patients there was no significant
difference in predictive accuracy (area under ROC for mortality) between the SRS,
POSSUM and P-POSSUM 90. Using a similar approach Donati developed a model
incorporating the ASA-PS, age, type of surgery (elective, urgent, emergency), and
degree of surgery (minor, moderate, major) 91. For mortality prediction, the
Donati model had superior discrimination in comparison with the ASA-PS,
whereas in comparison with POSSUM and P-POSSUM the new model exhibited
better calibration, but less good discrimination 91.
34
Table 3 The Surgical Risk Score (Sutton et al 2002)
Criterion Score
CEPOD
Elective Routine booked non-urgent case, e.g. varicose veins or hernia 1
Scheduled Booked admission, e.g. cancer of the colon or AAA 2
Urgent Cases requiring treatment within 24±48 h of admission,
e.g. obstructed colon
3
Emergency Cases requiring immediate treatment, e.g. ruptured AAA 4
BUPA
Minor Removal of sebaceous cyst, skin lesions, oesophagogastric
duodenoscopy
1
Intermediate Unilateral varicose veins, unilateral hernia repair, colonoscopy 2
Major Appendicectomy, open cholecystectomy 3
Major plus Gastrectomy, any colectomy, laparoscopic cholecystectomy 4
Complex
major
Carotid endarterectomy, AAA repair, limb salvage, anterior
resection, oesophagectomy
5
ASA-PS
I No systemic disease 1
II Mild systemic disease 2
III Systemic disease affecting activity 3
IV Serious disease but not moribund 4
V Moribund, not expected to survive 5
Notes to Table 3: NCPOD = National Confidential Enquiry into Perioperative Deaths, ASA = American
Society of Anesthesiologists – Physical Status Score, BUPA = British United Provident Association
(BUPA) operative severity scores, AAA = Abdominal Aortic Aneurysm.
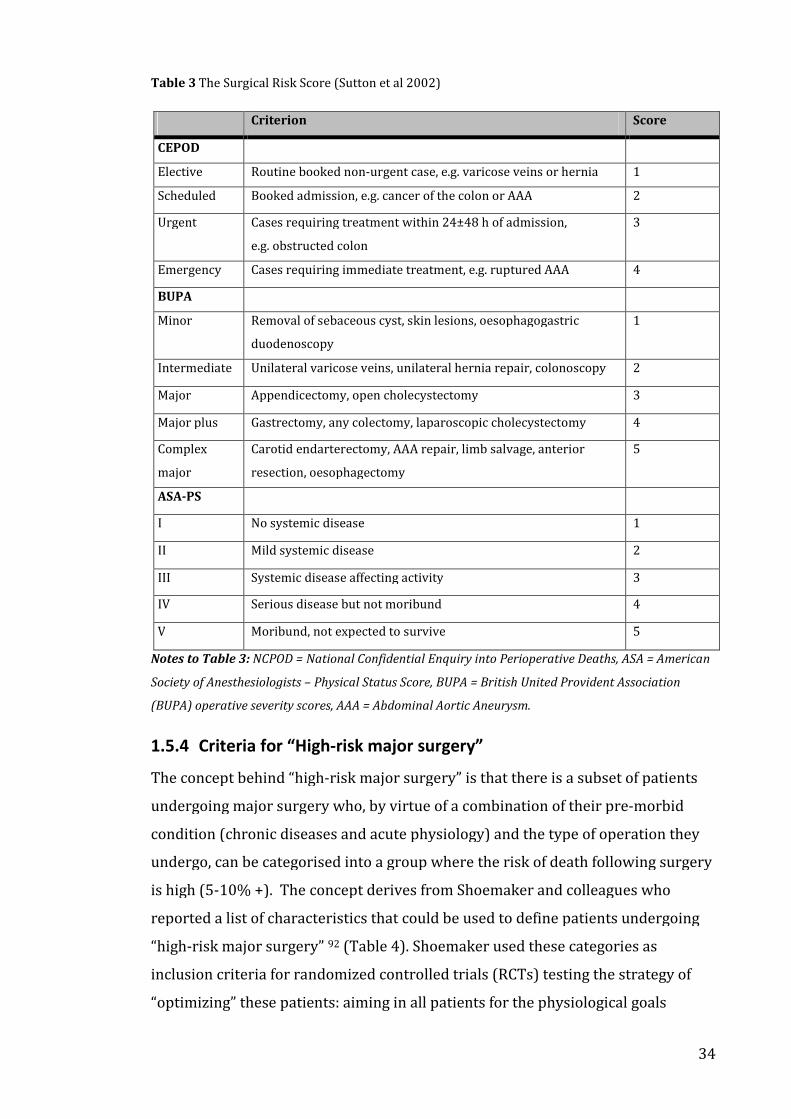
1.5.4 Criteria for “High-risk major surgery”
The concept behind “high-risk major surgery” is that there is a subset of patients
undergoing major surgery who, by virtue of a combination of their pre-morbid
condition (chronic diseases and acute physiology) and the type of operation they
undergo, can be categorised into a group where the risk of death following surgery
is high (5-10% +). The concept derives from Shoemaker and colleagues who
reported a list of characteristics that could be used to define patients undergoing
“high-risk major surgery” 92 (Table 4). Shoemaker used these categories as
inclusion criteria for randomized controlled trials (RCTs) testing the strategy of
“optimizing” these patients: aiming in all patients for the physiological goals
35
(oxygen delivery in particular) exhibited by survivors in order to improve overall
survival.
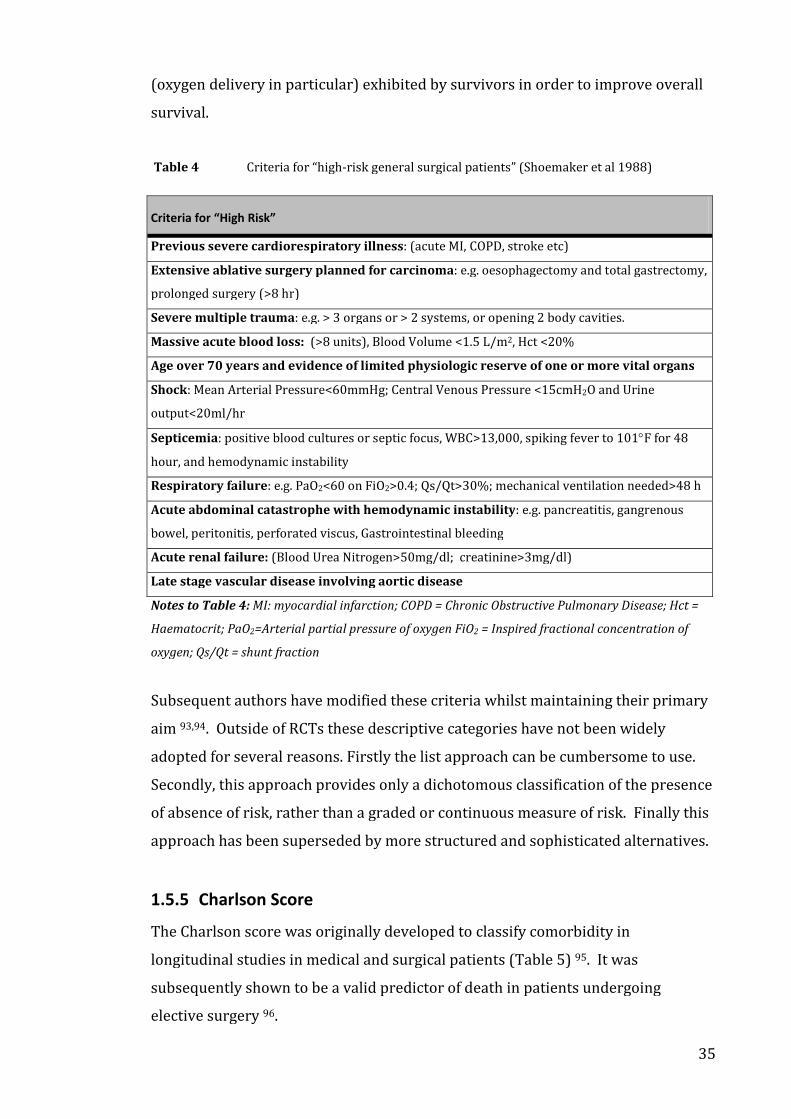
Table 4 Criteria for “high-risk general surgical patients” (Shoemaker et al 1988)
Criteria for “High Risk”
Previous severe cardiorespiratory illness: (acute MI, COPD, stroke etc)
Extensive ablative surgery planned for carcinoma: e.g. oesophagectomy and total gastrectomy,
prolonged surgery (>8 hr)
Severe multiple trauma: e.g. > 3 organs or > 2 systems, or opening 2 body cavities.
Massive acute blood loss: (>8 units), Blood Volume <1.5 L/m2, Hct <20%
Age over 70 years and evidence of limited physiologic reserve of one or more vital organs
Shock: Mean Arterial Pressure<60mmHg; Central Venous Pressure <15cmH2O and Urine
output<20ml/hr
Septicemia: positive blood cultures or septic focus, WBC>13,000, spiking fever to 101F for 48
hour, and hemodynamic instability
Respiratory failure: e.g. PaO2<60 on FiO2>0.4; Qs/Qt>30%; mechanical ventilation needed>48 h
Acute abdominal catastrophe with hemodynamic instability: e.g. pancreatitis, gangrenous
bowel, peritonitis, perforated viscus, Gastrointestinal bleeding
Acute renal failure: (Blood Urea Nitrogen>50mg/dl; creatinine>3mg/dl)
Late stage vascular disease involving aortic disease
Notes to Table 4: MI: myocardial infarction; COPD = Chronic Obstructive Pulmonary Disease; Hct =
Haematocrit; PaO2=Arterial partial pressure of oxygen FiO2 = Inspired fractional concentration of
oxygen; Qs/Qt = shunt fraction
Subsequent authors have modified these criteria whilst maintaining their primary
aim 93,94. Outside of RCTs these descriptive categories have not been widely
adopted for several reasons. Firstly the list approach can be cumbersome to use.
Secondly, this approach provides only a dichotomous classification of the presence
of absence of risk, rather than a graded or continuous measure of risk. Finally this
approach has been superseded by more structured and sophisticated alternatives.
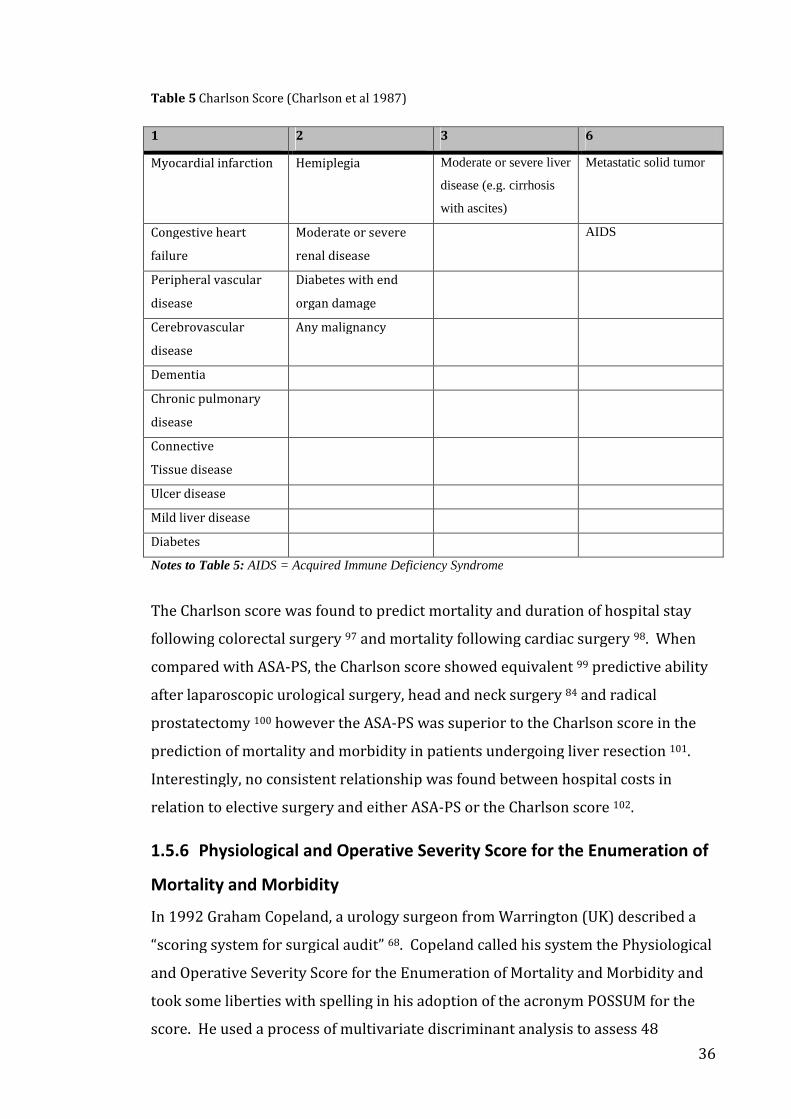
1.5.5 Charlson Score
The Charlson score was originally developed to classify comorbidity in
longitudinal studies in medical and surgical patients (Table 5) 95. It was
subsequently shown to be a valid predictor of death in patients undergoing
elective surgery 96.
36
Table 5 Charlson Score (Charlson et al 1987)
1 2 3 6
Myocardial infarction Hemiplegia Moderate or severe liver
disease (e.g. cirrhosis
with ascites)
Metastatic solid tumor
Congestive heart
failure
Moderate or severe
renal disease
AIDS
Peripheral vascular
disease
Diabetes with end
organ damage
Cerebrovascular
disease
Any malignancy
Dementia
Chronic pulmonary
disease
Connective
Tissue disease
Ulcer disease
Mild liver disease
Diabetes
Notes to Table 5: AIDS = Acquired Immune Deficiency Syndrome
The Charlson score was found to predict mortality and duration of hospital stay
following colorectal surgery 97 and mortality following cardiac surgery 98. When
compared with ASA-PS, the Charlson score showed equivalent 99 predictive ability
after laparoscopic urological surgery, head and neck surgery 84 and radical
prostatectomy 100 however the ASA-PS was superior to the Charlson score in the
prediction of mortality and morbidity in patients undergoing liver resection 101.
Interestingly, no consistent relationship was found between hospital costs in
relation to elective surgery and either ASA-PS or the Charlson score 102.
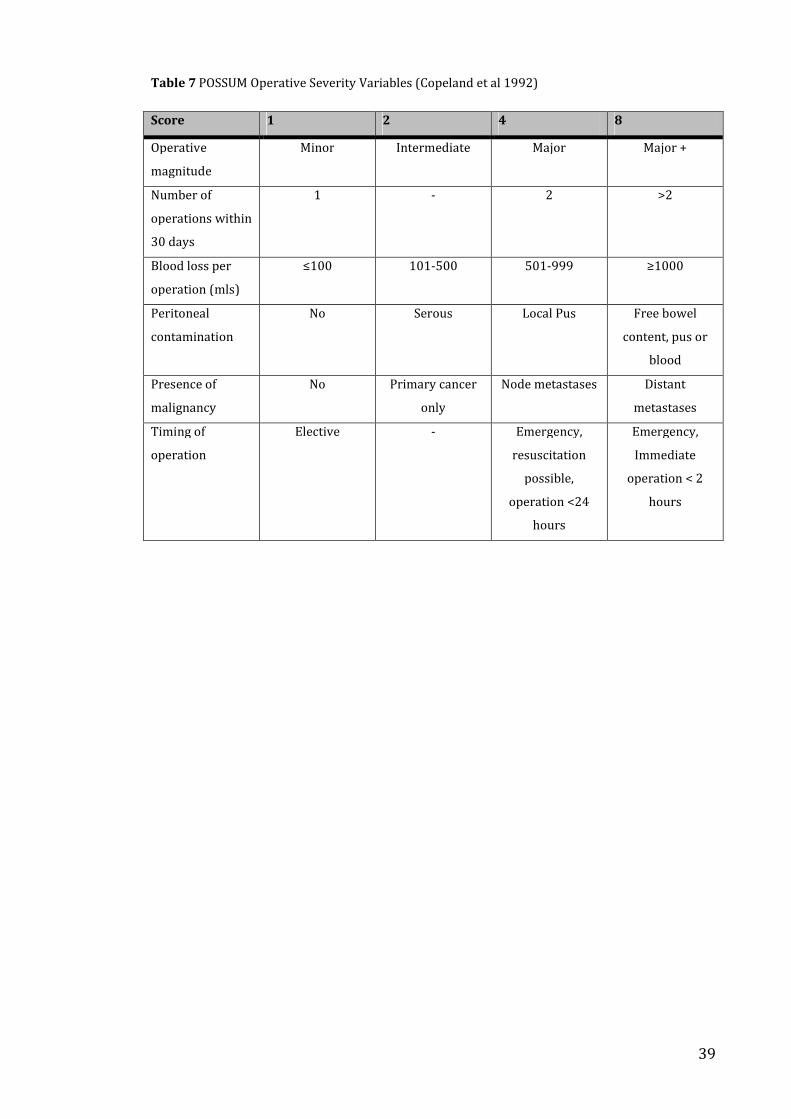
1.5.6 Physiological and Operative Severity Score for the Enumeration of
Mortality and Morbidity
In 1992 Graham Copeland, a urology surgeon from Warrington (UK) described a
“scoring system for surgical audit” 68. Copeland called his system the Physiological
and Operative Severity Score for the Enumeration of Mortality and Morbidity and
took some liberties with spelling in his adoption of the acronym POSSUM for the
score. He used a process of multivariate discriminant analysis to assess 48
37
physiological variables and 12 operative and postoperative variables to develop a
system to predict 30-day mortality and morbidity rates following surgery.
Analysis of the predictive performance of variables in the development cohort was
used to develop the score. Those variables with the highest predictive ability were
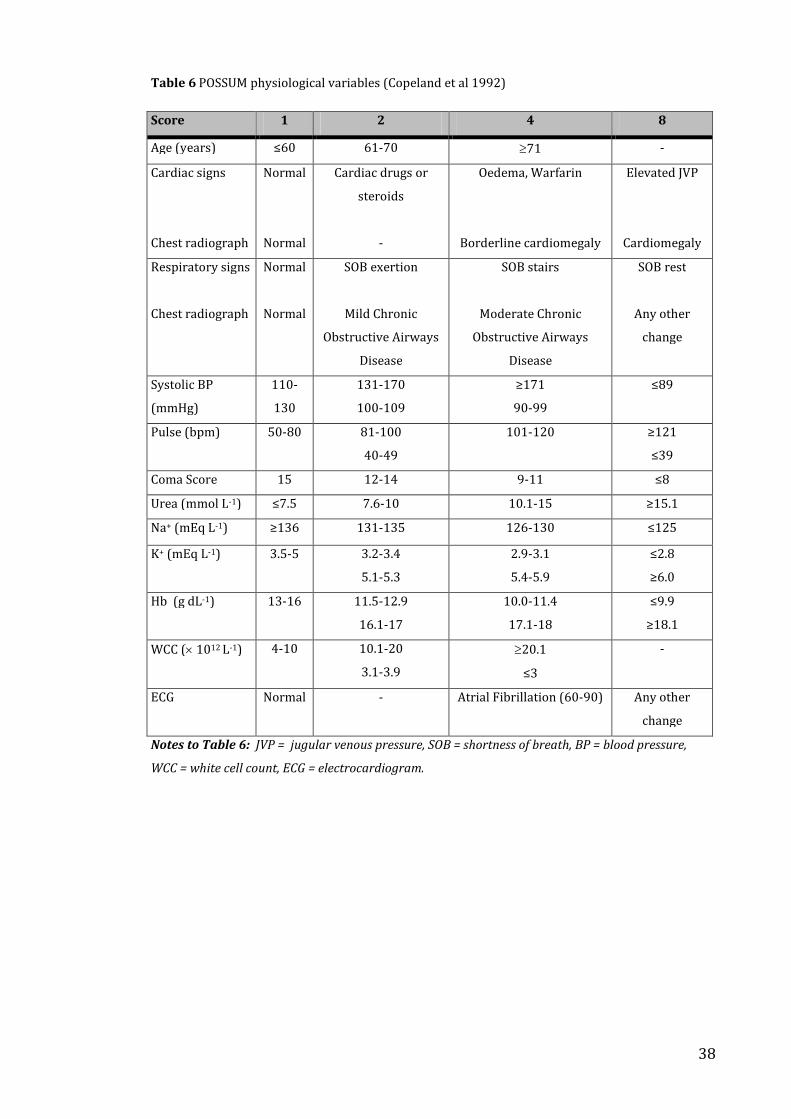
selected to be elements of the score. The resultant 18 component score comprises
12 variables forming the physiological assessment and 6 variables forming the
operative severity assessment 68. The physiological variables are recorded prior to
surgery and include clinical symptoms and signs, results of biochemical and
haematological test and an electrocardiographic assessment (Table 6). The
operative severity variables are recorded following completion of surgery and in
some cases are not available for a considerable time after the operation (e.g.
number of subsequent operations within 30 days, presence of malignancy) (Table
7). The values for the variables are categorised on an exponential scale, summed
to produce the two component scores, and then entered into logistic regression
equations to derive the percentage risk of a defined outcome. Two separate
equations (with different coefficients) are used for calculating the risk for
mortality and morbidity. The logistic regression predictor equations derived from
the development cohort were tested for goodness of fit on a separate validation
cohort. Observed rates of mortality and morbidity are compared with expected
values obtained from the POSSUM predictor equations and observed:expected
ratios calculated. Confidence intervals can be obtained for cohort estimates of
expected risk and OE ratios and their magnitude will be dependant on the size of
the cohort and the frequency of adverse outcomes under consideration.
38
Table 6 POSSUM physiological variables (Copeland et al 1992)
Score 1 2 4 8
Age (years) ≤60 61-70 71 -
Cardiac signs
Chest radiograph
Normal
Normal
Cardiac drugs or
steroids
-
Oedema, Warfarin
Borderline cardiomegaly
Elevated JVP
Cardiomegaly
Respiratory signs
Chest radiograph
Normal
Normal
SOB exertion
Mild Chronic
Obstructive Airways
Disease
SOB stairs
Moderate Chronic
Obstructive Airways
Disease
SOB rest
Any other
change
Systolic BP
(mmHg)
110-
130
131-170
100-109
≥171
90-99
≤89
Pulse (bpm) 50-80 81-100
40-49
101-120 ≥121
≤39
Coma Score 15 12-14 9-11 ≤8
Urea (mmol L-1) ≤7.5 7.6-10 10.1-15 ≥15.1
Na+ (mEq L-1) ≥136 131-135 126-130 ≤125
K+ (mEq L-1) 3.5-5 3.2-3.4
5.1-5.3
2.9-3.1
5.4-5.9
≤2.8
≥6.0
Hb (g dL-1) 13-16 11.5-12.9
16.1-17
10.0-11.4
17.1-18
≤9.9
≥18.1
WCC ( 1012 L-1) 4-10 10.1-20
3.1-3.9
20.1
≤3
-
ECG Normal - Atrial Fibrillation (60-90) Any other
change
Notes to Table 6: JVP = jugular venous pressure, SOB = shortness of breath, BP = blood pressure,
WCC = white cell count, ECG = electrocardiogram.
39
Table 7 POSSUM Operative Severity Variables (Copeland et al 1992)
Score 1 2 4 8
Operative
magnitude
Minor Intermediate Major Major +
Number of
operations within
30 days
1 - 2 >2
Blood loss per
operation (mls)
≤100 101-500 501-999 ≥1000
Peritoneal
contamination
No Serous Local Pus Free bowel
content, pus or
blood
Presence of
malignancy
No Primary cancer
only
Node metastases Distant
metastases
Timing of
operation
Elective - Emergency,
resuscitation
possible,
operation <24
hours
Emergency,
Immediate
operation < 2
hours
40
The original development and validation cohorts were from within Copeland’s
own institution, a district general hospital in the North of England. Both cohorts
included elective and emergency patients and several surgical specialties:
gastrointestinal, vascular, hepatobiliary, urology, and orthopaedic 68. Although
subsequent populations from different hospitals have been shown to produce
similar results, it is intrinsic to the POSSUM system that all current cohort data is
compared with these specific historical cohorts, and knowledge of the nature of
these cohorts is important when interpreting derived OE ratios.
Although POSSUM can be used to predict risk for an individual patient great care
should be used when interpreting such data. Highlighting high-risk cases by this
means may be useful. However suggesting futility, based on these estimates, is
fraught with ethical and statistical risk and this data should be used only as part of
a much broader assessment. Furthermore, as some of the variables are not
available until after surgery is completed, this information cannot be used alone to
decide on the appropriateness of a procedure (if the predicted risk is close to
100%, for example, it could be argued that an operation would be futile).
The POSSUM system has been used in clinical effectiveness studies 94, in
comparisons of outcomes between different countries 19, in comparisons of
individual surgeons 103, and in comparison of types of care (e.g. preoperative
intensive care admission) 104.
The original POSSUM methodology used logistic regression equations to predict
event risk. This has been criticized for theoretical and empirical reasons.
Theoretically the use of logistic models produces some problems: the lowest
possible mortality risk using POSSUM (which occurs when all components of the
score are normal producing a physiological score of 12 and an operative severity
score of 6) is 1.08% 105. Empirical evidence suggests that in some cases POSSUM
over-predicts risk of death by up to six-fold (for those with a predicted risk of
mortality under 10%) 105.
An alternative method using the same variables but alternative risk equations was
suggested by David Prytherch working at Portsmouth Hospital in the UK. He
41
developed a new risk model (Portsmouth POSSUM, P-POSSUM) validated on a
large local dataset. Overall P-POSSUM seems to reflect mortality risk (hospital)
better than POSSUM 106. However this group did not develop a morbidity
prediction model. Interestingly this is because of the Portsmouth’s group lack of
confidence in reliable postoperative morbidity recording 106.
Variants of POSSUM for use in specific surgical populations have been validated on
large cohorts of patients. These include orthopaedic 107, colorectal 108, oesophageal
109, and vascular surgical populations 110. The advantage of speciality –specific
scores is that for individual specialty datasets, improved goodness of fit is obtained
and the model is better calibrated. The disadvantage is that this limits
generalisability and cross-speciality inter-institutional comparisons.
1.5.7 National Surgical Quality Improvement Program: a US approach
The US Department of Veterans Affairs (VA) (NSQIP) is a nationally validated,
outcome based, risk adjusted, peer-controlled program for the measurement and
enhancement of the quality of surgical care in major surgical specialties 30. In 1986
the US Congress passed a law mandating the VA to report it’s surgical outcomes
annually “compared with the national average.” In addition it added the
stipulation that the outcomes should be adjusted for the severity of patient’s
illnesses. Between October 1991 and December 1993 the VA prospectively
collected data on 117000 major surgical procedures in 44 VA medical centres
(Phase 1) as part of the National VA Surgical Risk Study (NVASRS) 111. Predictive
risk adjustment models for 30-days mortality and morbidity for 9 surgical
specialties (including cardiac) were developed from this data. Data from the eight
non-cardiac major surgical specialties are now subjected to annual logistic
regression analysis to create models for all operations and for the eight specialties
112. Risk adjusted outcomes for each assessed population are expressed as OE
ratios (see above) with 90% confidence intervals (CI) and data from all the 133
participating institutions are compared to identify outliers. The pooled data
obtained is fed back to chiefs of surgery annually. Consistent outlier institutions
are informed of concerns about this. The program also provides self-assessment
tools to providers and managers, organizes structured site visits to assess data
quality and performance and assists in the identification and dissemination of best
practice within the program hospitals 112.
42
The NVARS validated the concept that NSQIP hospitals where the lower limit of the
OE ratio 90% CI is greater than one (high outliers) are more likely to have inferior
processes and structures of care 113. Conversely those hospitals where the upper
limit of the OE ration 90% CI is less than one (low outliers) are more likely to have
superior structures and processes 113. NSQIP has now been successfully
implemented at non-veterans academic hospitals 114 and in the private sector 10.
NSQIP is a model for what can be achieved in terms of structured validated
reporting of outcome following surgery. Similar data are not available in the UK.
Of note, from the perspective of recording the short-term harms following surgery
(acute morbidity), the approach uses a traditional classification of defined
complications (e.g. deep venous thrombosis) collected retrospectively (30 days
after surgery) 4. However the levels of morbidity recorded are broadly similar to
those obtained using other systems 4.
1.5.8 Cardiac risk scores for non-cardiac major surgery
A number of scoring systems have been devised to describe the specific risk of
developing cardiac complications in non-cardiac surgery. In 1977 Goldman
described a “Multifactorial index of cardiac risk in non-cardiac surgical
procedures” (Table 8) 115. Patients with a score >25 had a 56% incidence of death
(22% incidence of cardiovascular complications) whereas patients with a score
<26 had a 4% incidence of death (17% incidence of severe cardiovascular
complications) 115. The Goldman index was widely adopted and subsequent
studies showed that it is superior to the ASA_PS for predicting cardiac
complications of non-cardiac surgery 116. The Goldman index has also been shown
to be predictive of all-cause mortality but in this respect is inferior to the ASA-PS
score 117.
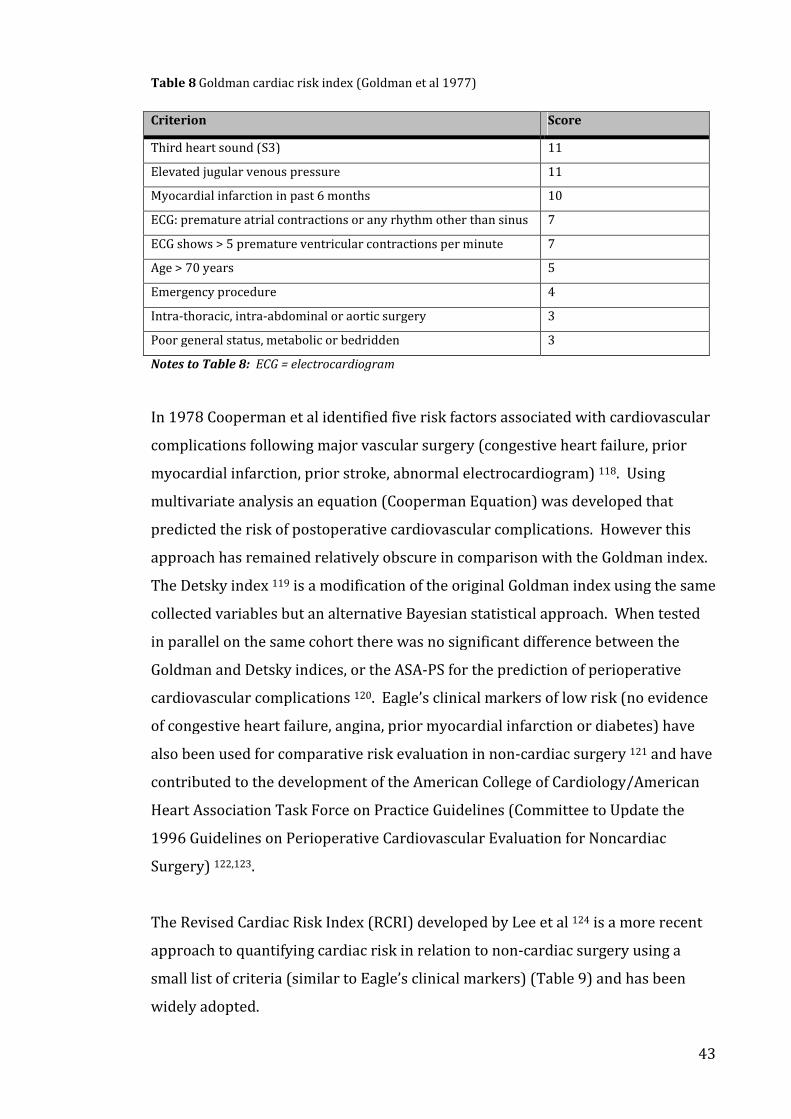
43
Table 8 Goldman cardiac risk index (Goldman et al 1977)
Criterion Score
Third heart sound (S3) 11
Elevated jugular venous pressure 11
Myocardial infarction in past 6 months 10
ECG: premature atrial contractions or any rhythm other than sinus 7
ECG shows > 5 premature ventricular contractions per minute 7
Age > 70 years 5
Emergency procedure 4
Intra-thoracic, intra-abdominal or aortic surgery 3
Poor general status, metabolic or bedridden 3
Notes to Table 8: ECG = electrocardiogram
In 1978 Cooperman et al identified five risk factors associated with cardiovascular
complications following major vascular surgery (congestive heart failure, prior
myocardial infarction, prior stroke, abnormal electrocardiogram) 118. Using
multivariate analysis an equation (Cooperman Equation) was developed that
predicted the risk of postoperative cardiovascular complications. However this
approach has remained relatively obscure in comparison with the Goldman index.
The Detsky index 119 is a modification of the original Goldman index using the same
collected variables but an alternative Bayesian statistical approach. When tested
in parallel on the same cohort there was no significant difference between the
Goldman and Detsky indices, or the ASA-PS for the prediction of perioperative
cardiovascular complications 120. Eagle’s clinical markers of low risk (no evidence
of congestive heart failure, angina, prior myocardial infarction or diabetes) have
also been used for comparative risk evaluation in non-cardiac surgery 121 and have
contributed to the development of the American College of Cardiology/American
Heart Association Task Force on Practice Guidelines (Committee to Update the
1996 Guidelines on Perioperative Cardiovascular Evaluation for Noncardiac
Surgery) 122,123.
The Revised Cardiac Risk Index (RCRI) developed by Lee et al 124 is a more recent
approach to quantifying cardiac risk in relation to non-cardiac surgery using a
small list of criteria (similar to Eagle’s clinical markers) (Table 9) and has been
widely adopted.
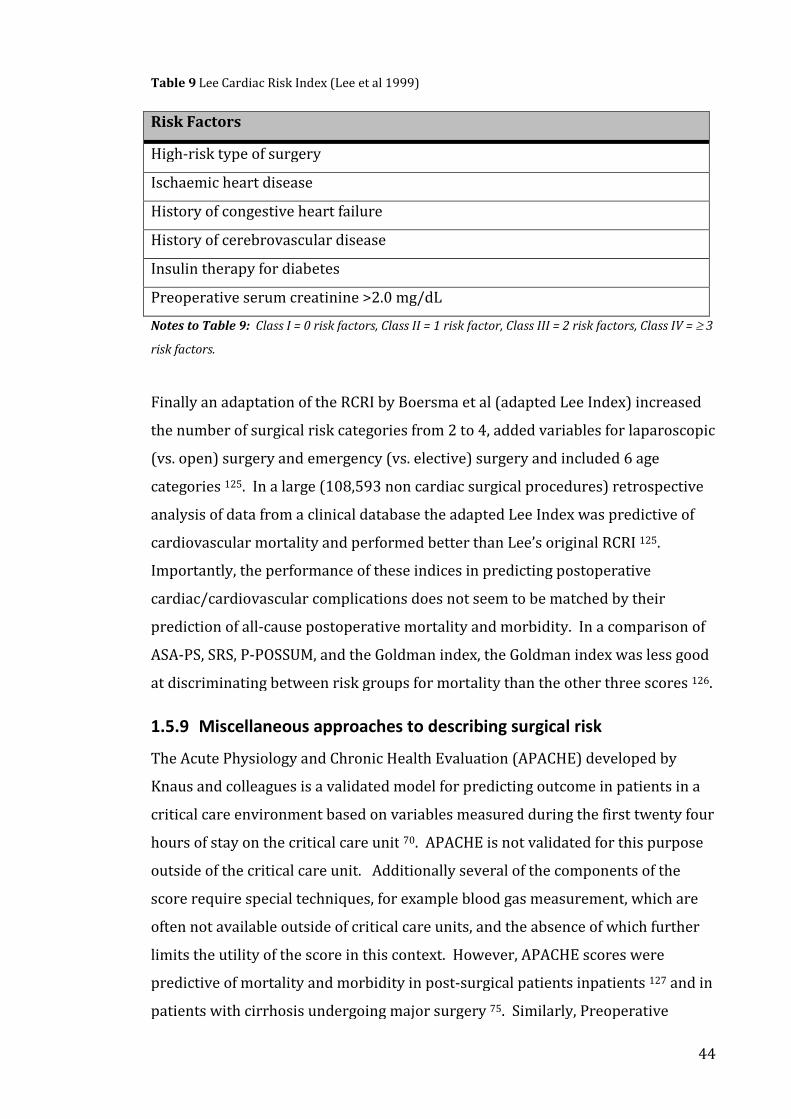
44
Table 9 Lee Cardiac Risk Index (Lee et al 1999)
Risk Factors
High-risk type of surgery
Ischaemic heart disease
History of congestive heart failure
History of cerebrovascular disease
Insulin therapy for diabetes
Preoperative serum creatinine >2.0 mg/dL
Notes to Table 9: Class I = 0 risk factors, Class II = 1 risk factor, Class III = 2 risk factors, Class IV = 3
risk factors.
Finally an adaptation of the RCRI by Boersma et al (adapted Lee Index) increased
the number of surgical risk categories from 2 to 4, added variables for laparoscopic
(vs. open) surgery and emergency (vs. elective) surgery and included 6 age
categories 125. In a large (108,593 non cardiac surgical procedures) retrospective
analysis of data from a clinical database the adapted Lee Index was predictive of
cardiovascular mortality and performed better than Lee’s original RCRI 125.
Importantly, the performance of these indices in predicting postoperative
cardiac/cardiovascular complications does not seem to be matched by their
prediction of all-cause postoperative mortality and morbidity. In a comparison of
ASA-PS, SRS, P-POSSUM, and the Goldman index, the Goldman index was less good
at discriminating between risk groups for mortality than the other three scores 126.
1.5.9 Miscellaneous approaches to describing surgical risk
The Acute Physiology and Chronic Health Evaluation (APACHE) developed by
Knaus and colleagues is a validated model for predicting outcome in patients in a
critical care environment based on variables measured during the first twenty four
hours of stay on the critical care unit 70. APACHE is not validated for this purpose
outside of the critical care unit. Additionally several of the components of the
score require special techniques, for example blood gas measurement, which are
often not available outside of critical care units, and the absence of which further
limits the utility of the score in this context. However, APACHE scores were
predictive of mortality and morbidity in post-surgical patients inpatients 127 and in
patients with cirrhosis undergoing major surgery 75. Similarly, Preoperative
45
APACHE scores were superior to ASA-PS scores in the prediction of postoperative
mortality and morbidity in patients undergoing general surgical procedures 128.
Prytherch has developed a risk-scoring system based on laboratory tests results,
age, gender and British United Provident Association (BUPA) operative severity
scores (the Biochemistry and Haematology Outcomes Model, BHOM) 129 which
demonstrated equivalent discrimination to P-POSSUM and SRS for mortality
following urgent or emergency surgery 126.
A variety of speciality specific scores have been shown to predict mortality
effectively in sporadic studies. For example, a simple score incorporating age,
neurological comorbidity, weight loss and emergency surgery (the AFC score)
showed better goodness of fit than the ASA-PS in a large cohort of patients
undergoing colorectal surgery 99. Intriguingly, a simple clinician visual–analogue
risk measure had equivalent predictive value for complications as POSSUM and the
Charlson Score in a study of patients undergoing hip fracture surgery 130.
1.6 Postoperative Outcome Measures
1.6.1 Introduction and definition of scope
The measures currently available, or proposed, to describe patient outcomes
following surgery include physiological, pathological, psychological and social
descriptors.
Physiological outcomes include level of fitness (peak physical work, maximum
sustainable physical work) and cognitive function. Pathological outcomes include
pain, persistent organ dysfunction and scarring or deformity. Psychological
outcomes include depression and anxiety associated with preceding surgery.
Social outcomes include return to work, income, relationship difficulties or social
engagement (e.g. religious or cultural activities). Quality of life measures may
encompass some or all of these dimensions. For example the Short Form (36)
Health Survey (SF36) comprises an eight scaled score relating to vitality, physical
functioning, bodily pain, general health perception, physical role functioning,
emotional role functioning, social role functioning and mental health 57. The SF36
is used in health economics as a variable unit in the Quality-adjusted life years
46
(QALYs) to determine the overall cost-effectiveness of health treatment 131,132. Of
note, there is evidence that non-pathological outcomes may significantly impact
overall health. For example maintenance of physical fitness is associated with
improved survival, irrespective of whether surgery has taken place 133-136 and
there may be a similar effect in relation to psychological well being 137-139. The
impact of surgery may spread beyond the patient having the operation. There is
evidence that hospitalization can increase the risk of death in patients’ spouses,
although the interaction of this effect with surgery is unclear. There was increased
mortality in spouses of patients admitted with hip fractures but no increased risk
in spouses of patients admitted for colon cancer 140.
Within this thesis I will limit the scope of postoperative outcomes to those that are
“clinically significant”. In doing this I recognize that the concept of clinical
significance is limited as a criterion, being traditionally based on the subjective
view of “expert” clinicians. Furthermore, for patients non-clinically significant
morbidity may have a greater importance (e.g. financial concerns, sexual
dysfunction) in their life. However defining clinical significance as those outcomes
requiring, or benefiting by, medical intervention has the dual benefit of clearly
defining the scope of this thesis and confining it to the realm of clinical medicine.
Although there is a substantial literature on postoperative cognitive dysfunction
141,142, I will further limit the scope of this thesis to the physical manifestations of
pathophysiology following surgery.
Standardising the temporal frame of measurement of postoperative outcome
measures is important. Where the frame of measurement is based on an element
of process (e.g. discharge from hospital in the case of “hospital mortality”)
confounding due to heterogeneity of discharge criteria and systems efficiency is
likely. Timeframe based measurements are more likely to be reliable but are
harder to collect than hospital based measures 112.
Outcomes following surgery may be short term or long-term. There is no accepted
classification for what constitutes medium or long term following surgery. For the
purposes of this MD short-term outcomes are here defined as including the
duration of hospital stay.
47
Hospital based outcome reporting systems will, by definition, only record
outcomes occurring in hospital. One means of overcoming this problem would be
to give patients self-report cards to go home with or to conduct telephone follow-
up a specified period after operation or discharge. Report cards have been used to
monitor outcomes following surgery 68 (Copeland in early POSSUM study) and
characteristics of a model report card following surgery have been proposed in the
USA 143. Report cards may also be used to validate assumptions implicit in
hospital-based measures, that discharged patients are uniformly well. The
occurrence of readmissions due to post-surgical morbidity suggests that this
assumption is not fully valid.
1.6.2 Death
Death following surgery (surgical mortality) has strengths and limitations as an
outcome measure. Death is easy to diagnose, apparently easy to define, commonly
recorded and self-evidently clinically significant. However the length of time over
which data is collected affects the measured rate within a particular population
and the impact of competing causes of death. For example, in a study in cardiac
surgical patients, mortality in the control group at 28 days was 3.0%, at 6 months
was 3.6% and at 1 year was 4.6% (protocol group: 1.0%, 1.5%, 2.0%
respectively)144. Studies of surgical patients commonly report hospital morality
and sometimes report 28-day or 30-day mortality as an alternative (see Chapter
2). The relationship between these variables is, in part, dependent on the range of
lengths of stay observed in the patient group being studied. Although mortality at
a specific time-point (e.g. 28-day, 30-day) has the advantage of more precise
attribution (due to absence of confounding due to variation in length of stay),
hospital data are substantially easier to collect and therefore more commonly
reported. Loss of patients to follow-up after hospital discharge may decrease the
precision of mortality data collected over longer timeframes. Furthermore, when
considering mortality levels over longer periods of time it is important to know the
background rate of attrition for the population under consideration; so-called
competing causes of death such as the ongoing death-rate associated with
comorbidities such as heart disease or cancer may be significant in older
populations and may dilute the effect of studied variables such as different
individual surgeons 9,145. Cause-specific survival rates may be more appropriate
48
for long-term follow-up 145. Recent data suggests that adverse outcome during the
perioperative period may have a significant impact on long-term mortality 9 and
that interventions administered for a short period of time during the perioperative
period may modify the pattern of recovery from surgery and subsequent mortality
over both the short and longer term 144.
Notwithstanding these issues mortality has a significant drawback as a
comparative tool in a number of surgical settings for another reason. The overall
mortality rate associated with a variety of types of surgery has decreased with
time 146,147. This is probably due to a combination of improvements in the
standard of surgical, anaesthetic and general hospital care of surgical patients as
well as overall improvement in the health of the population. The consequence of
this is that for many types of surgery the event rate (for death) has become very
low. This means that to compare institutions or surgeons in a valid manner (to
detect statistically significant differences) the denominator number (the number
of patients from whom information has to be collected in the study populations)
needs to be very large, and therefore timeframe of collection is increased. The
timeframe of comparisons may then start to become meaningless if the purpose is
to attempt to improve quality of care.
For example, with a background mortality rate of 10%, a 50% relative risk
reduction (5% absolute risk reduction) can be detected with two samples of 343
patients; with a background mortality rate of 1%, a 50% relative risk reduction
(0.5% absolute risk reduction) would require two samples of 3681 (power = 0.8, p
≤ 0.05, 1 sided test). For hospitals undertaking 500-1000 surgeries per year the
former is a practical timeframe for comparison, the latter implied comparisons
over multi-year timeframes.
However recording of mortality is important for two reasons. The face and
content validity of outcomes datasets is important, and a dataset not containing
mortality data would be missing a meaningful outcome. Secondly, although
comparisons of small sample-size groups will have limited utility, pooled data
across hospitals or regions may provide useful information.
49
1.6.3 Duration of Hospital (and Critical Care) Stay
Length of hospital stay (HLOS) is a resource utilisation (process) measure often
used as a summary measure of clinical outcome. It has significant practical
advantages in that it is easy to define and measure and routinely recorded in most
hospital systems. However HLOS has significant shortcomings as a marker of
clinical outcome. At least two assumptions are inherent in the use of HLOS as a
surrogate for clinical outcome. First, the assumption that patients are discharged
at a standard level of well-being and therefore discharge from hospital is a marker
of that level of wellbeing (or lack of morbidity). If patients are discharged from
one institution sicker than those in another institution this assumption does not
hold and inter-institutional bias may exist. Second, the assumption that all
patients who have achieved this level of wellness will then be discharged from
hospital: if patients remain in hospital when “well” for non-clinical reasons, for
example waiting for a social services package at home, then this will reduce the
validity of HLOS as an index of patient clinical outcome. This may result in both
intra- and inter-institutional bias. HLOS is a measure of resource utilisation,
although even in this respect it has limitations: different levels of intensity of care
are associated with different costs. Strictly, HLOS tells us about bed utilisation and
any additional inferences are based on often-flawed assumptions and with limited
validity. Comparisons between healthcare systems may be confounded where
discharge arrangements are different (e.g. use of convalescent facilities).
Similar considerations apply when considering length of Critical Care stay as a
marker of acute serious adverse outcome. The threshold for admission to, and
discharge from, critical care environments will vary between institutions
depending on the acuity of patients, the availability of critical care beds, and any
blocks to discharge from critical care facilities. The rate of readmission of patients
to hospital (and critical care) following surgery is also used as a surrogate measure
of outcome 148 and as a process measure is subject to similar confounding by
variation in discharge and admission thresholds.
1.6.4 Postoperative morbidity
The World Health Organisation (WHO) classification of the “consequence of
disease” has been suggested as a framework for the classification of outcomes used
50
to evaluate surgical treatments 149. The WHO classification defines impairments as
restrictions of physiological or anatomic structure or function, disabilities as
restrictions in the ability to perform activities within the range considered normal
and handicaps as those disadvantages that limit the fulfilment of a usual role, such
as going to work. Outcome following surgery may be classified into disease-
specific and generic measures 149. Disease specific measures have in general been
shown to be more responsive but less generalisable when compared to generic
measures 149. Disease specific measures tend to focus on impairments (e.g. unable
to tolerate enteral diet) whereas generic measures tend to focus on handicaps (e.g.
not going to work). Short-term harm or morbidity following surgery is principally
manifest as disease specific impairment measure and would be expected to be
responsive to change (1.7.3 Reliability) but not generalisable to other populations
e.g. medical patients with rheumatoid arthritis or patients with mental health
problems. The “disease” in this case is the context of undergoing major surgery.
Clinically significant short-term postoperative harm may be classified into
morbidity and mortality. Morbidity has traditionally been defined by the presence
or absence of specific postoperative complications, but alternative approaches are
possible. For the purposes of this thesis morbidity will be used as a generic term
for clinically significant, non-fatal, adverse outcome. Surgical complications are
one means of describing morbidity following surgery using traditional medical
diagnoses (e.g. deep venous thrombosis) rather than alternative classification
models.
Traditional classification of morbidity associated with surgery commonly
presented in basic surgical manuals divides complications into local (involving the
operation site) and general (affecting other systems of the body) or specific
(relating to an individual operation) and general (complications of any operation)
150,151. Complications may be further subdivided into categories, based on the
timing of their occurrence in relation to the index operation (e.g. immediate, early,
late and long-term based on arbitrary time thresholds). No consistent system of
definition is extant 150,151.
51
Within these categories, complications have been categorised based on medical
diagnoses (e.g. deep venous thrombosis, wound infection). Whilst many types of
morbidity can be attributed to general (e.g. acute renal failure) or specific
categories (e.g. wound dehiscence), some provide dilemmas of attribution (e.g.
postoperative ileus) suggesting that these groups are not mutually exclusive.
Furthermore, they are closely interlinked. For example a leaking bowel
anastamosis (local and procedure specific) may result in a number of general
(procedure independent) outcomes such as fever, malaise, inability to tolerate
enteral diet, and cardiovascular failure. At present it is unclear whether general
postoperative morbidity has an effect on procedure specific long-term outcome
(e.g. joint function) or quality of life, although an influence on mortality has been
described 9. There is also limited data to support the idea that procedure related
adverse outcomes (e.g. failure of joint replacement) will influence more general
outcome (e.g. quality of life) 152,153.
1.6.4.1 Postoperative morbidity: syndrome, construct or non-entity?
A fundamental question in relation to postoperative morbidity is whether the
cluster of pathophysiological findings that tends to occur together following major
surgery constitutes a true syndrome. In other words, is the aim of investigating
postoperative morbidity simply to be able to describe the prevalence and pattern
of a variety of unrelated but clinically relevant phenomena, or is there an
underpinning common pathology to be measured?
The process of defining an operational definition and a diagnostic syndrome or
disease is an important step in epidemiological description and subsequent
management of the problem with any as-yet-undefined cluster of clinical findings.
The definition of a syndrome is a pathological condition associated with a cluster
of co-occurring symptoms, usually three or more 154. It is often used
provisionally with the expectation that once the nature of the condition is
clarified, a more precise designation will take its place 154. It is also often used
synonymously with “disease” 154.
It can be argued that the cluster of symptoms or clinical findings which occur after
different types of surgery meet this criteria. First, morbid events (morbidity)
following surgery are associated by temporal and contextual factors. It is clear
52
that many clinical findings cluster together in the sickest patients, but not all
patients have all findings. It is suspected, but not verified, that where clinical
findings are not evident, more patients may exhibit sub-clinical organ dysfunction.
Unfortunately, inconsistency of reporting of postoperative morbidity limits the
confidence with which this case can be made.
Importantly, the existence of a common underlying pathological condition is
central to the definition of a syndrome 154. In critically ill patients Multiple Organ
Dysfunction Syndrome (MODS) is an accepted syndrome with over 900 PubMed
entries. Scoring systems to quantify MODS have been developed (e.g. Multiple
Organ Dysfunction Score, MODS) 155 and the importance of a coherent conceptual
framework for MODS and its relationship with other clinical entities such as sepsis
and the Systemic Inflammatory Response Syndrome (SIRS) 156,157 has been
emphasised 158. MODS is considered to be a response to SIRS which is in turn a
massive inflammatory reaction resulting from systemic mediator release
secondary to a variety of precipitating factors 159. Major surgery is recognised to
be one cause of SIRS and MODS 160. A case can be made that Postoperative
Morbidity is a mild version of MODS, consequent on a less massive inflammatory
reaction than occurs in SIRS. Susceptibility in different organ systems in MODS is
recognised to be heterogeneous 161 and the same is likely to be true of organ
dysfunction occurring after surgery that is of insufficient severity to meet the
MODS criteria. Finally there is evidence that surgery leads to the release of
systemic mediators (cytokines) and that this response is related to surgical
outcome. The magnitude of cytokine release is related to survival following major
surgery 162; patients with a lesser inflammatory response have improved short-
term outcomes 163 and interventions which reduce cytokine release are associated
with improved outcomes 164. Furthermore, when levels of tissue trauma differ for
otherwise similar operations, such as laparoscopic procedures in comparison with
open procedures, the inflammatory response is of a lesser magnitude 165.
However, the finding that although convalescence may be shorter following
laparoscopic surgery, other short and long-term outcomes are similar to those
occurring after open procedures is inconsistent with this view 162,166,167.
53
In summary it seems likely, but is not proven, that Postoperative Morbidity
represents a mild variant of MODS, consequent on a mild version of SIRS
precipitated by the tissue trauma and physiological disturbance of surgery,
anaesthesia and other perioperative perturbations. The case for Postoperative
Morbidity to be considered a true syndrome will be strengthened if systematically
collected epidemiological data from the postoperative period demonstrates
reliable clustering of symptoms/clinical findings.
1.6.4.3 Previous approaches to describing short-term postoperative harm
The only systematic review addressing this question highlights the heterogeneity
in recording of postoperative morbidity and emphasizes the requirement for an
objective standardized tool 168. The Health Technology Assessment Report on the
measurement and monitoring of surgical adverse events (2001) concluded: “The
use of standardised, valid and reliable definitions is fundamental to the accurate
measurement and monitoring of surgical adverse events. This review found
inconsistency in the quality of reporting of postoperative adverse events, limiting
accurate comparison of rates over time and between institutions.” 168. The same
review found 41 different definitions and 13 grading scales for surgical wound
infection in 82 studies and 40 definitions of anastamotic leak from 107 studies 168.
The family of studies of the development of perioperative risk prediction scores
and scales is one place to explore the different ways in which morbidity is
reported. Morbidity reporting in these studies has been inconsistent. In-hospital
mortality was the outcome variable used in the studies investigating the
performance of the SRS 89,90. The morbidity reporting (type and criteria) used in
the studies of Donati 91, Woltes 88 and Copeland 68 is inconsistent between studies
and is summarised in Table 10. The developers of P-POSSUM cited the difficulties
of defining postoperative morbidity and the lack of reliability of recording of
complications data as a justification for not developing a morbidity prediction
equation 105.
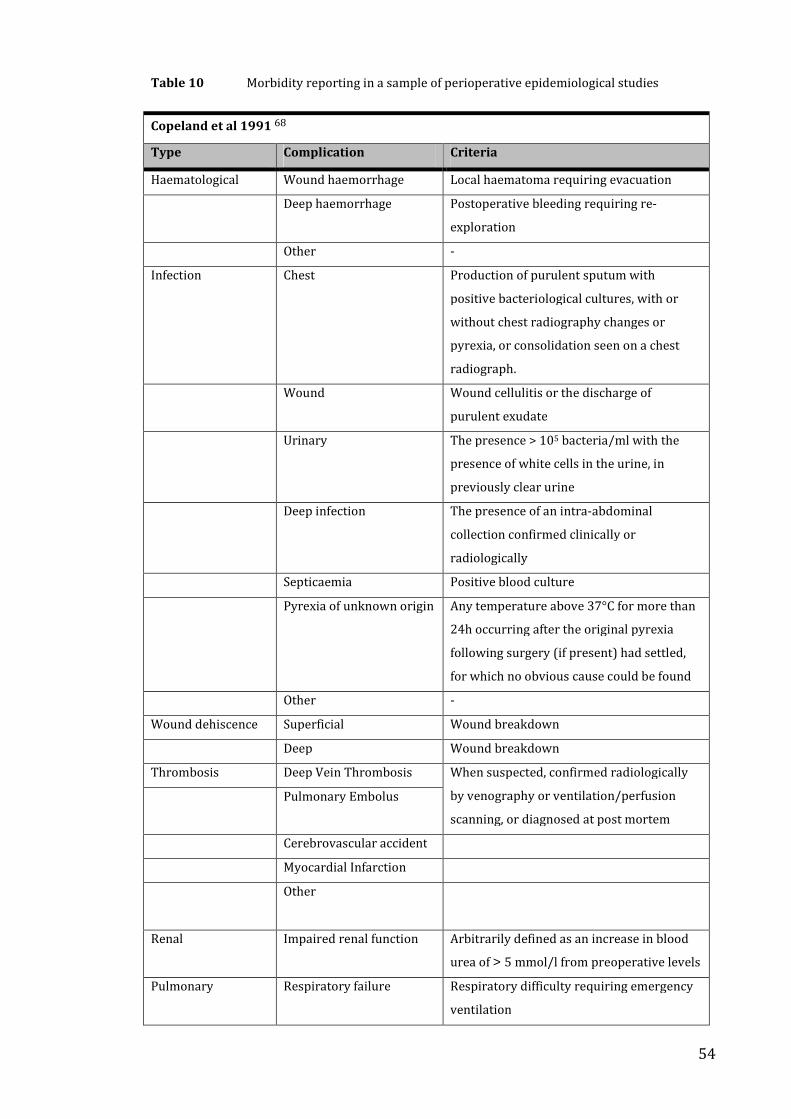
54
Table 10 Morbidity reporting in a sample of perioperative epidemiological studies
Copeland et al 1991 68
Type Complication Criteria
Haematological Wound haemorrhage Local haematoma requiring evacuation
Deep haemorrhage Postoperative bleeding requiring re-
exploration
Other -
Infection Chest Production of purulent sputum with
positive bacteriological cultures, with or
without chest radiography changes or
pyrexia, or consolidation seen on a chest
radiograph.
Wound Wound cellulitis or the discharge of
purulent exudate
Urinary The presence > 105 bacteria/ml with the
presence of white cells in the urine, in
previously clear urine
Deep infection The presence of an intra-abdominal
collection confirmed clinically or
radiologically
Septicaemia Positive blood culture
Pyrexia of unknown origin Any temperature above 37°C for more than
24h occurring after the original pyrexia
following surgery (if present) had settled,
for which no obvious cause could be found
Other -
Wound dehiscence Superficial Wound breakdown
Deep Wound breakdown
Thrombosis Deep Vein Thrombosis
Pulmonary Embolus
When suspected, confirmed radiologically
by venography or ventilation/perfusion
scanning, or diagnosed at post mortem
Cerebrovascular accident
Myocardial Infarction
Other
Renal Impaired renal function Arbitrarily defined as an increase in blood
urea of > 5 mmol/l from preoperative levels
Pulmonary Respiratory failure Respiratory difficulty requiring emergency
ventilation
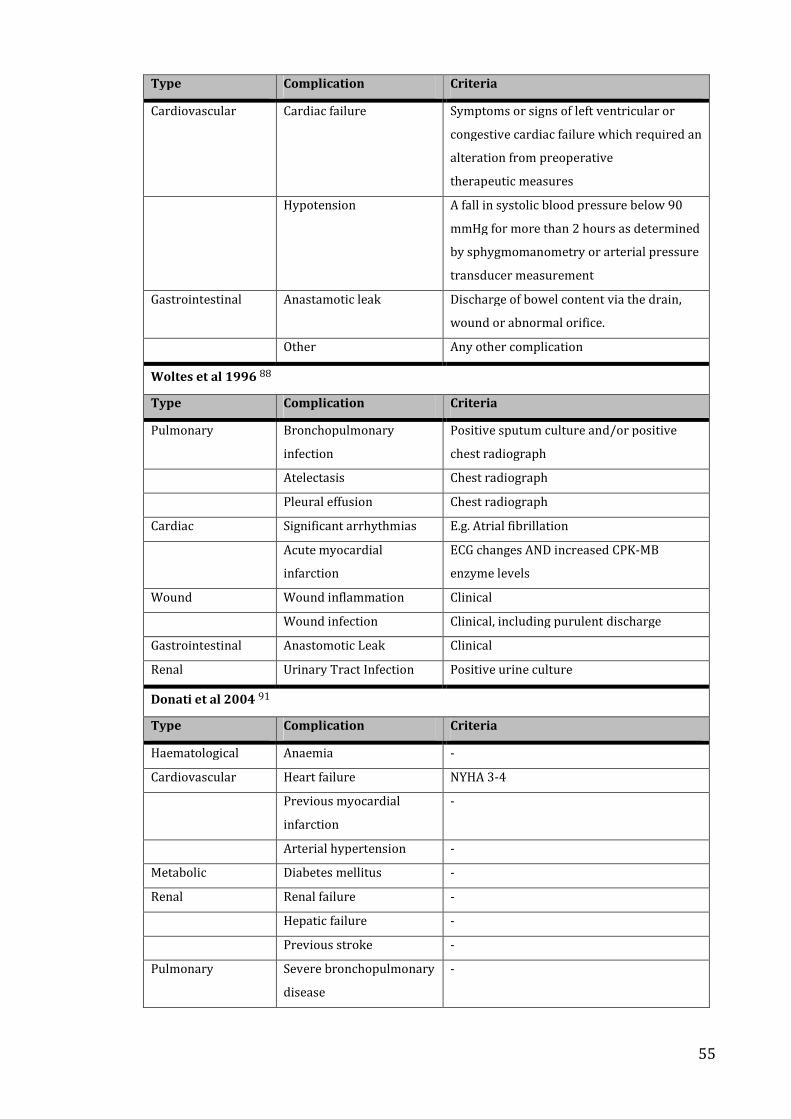
55
Type Complication Criteria
Cardiovascular Cardiac failure Symptoms or signs of left ventricular or
congestive cardiac failure which required an
alteration from preoperative
therapeutic measures
Hypotension A fall in systolic blood pressure below 90
mmHg for more than 2 hours as determined
by sphygmomanometry or arterial pressure
transducer measurement
Gastrointestinal Anastamotic leak Discharge of bowel content via the drain,
wound or abnormal orifice.
Other Any other complication
Woltes et al 1996 88
Type Complication Criteria
Pulmonary Bronchopulmonary
infection
Positive sputum culture and/or positive
chest radiograph
Atelectasis Chest radiograph
Pleural effusion Chest radiograph
Cardiac Significant arrhythmias E.g. Atrial fibrillation
Acute myocardial
infarction
ECG changes AND increased CPK-MB
enzyme levels
Wound Wound inflammation Clinical
Wound infection Clinical, including purulent discharge
Gastrointestinal Anastomotic Leak Clinical
Renal Urinary Tract Infection Positive urine culture
Donati et al 2004 91
Type Complication Criteria
Haematological Anaemia -
Cardiovascular Heart failure NYHA 3-4
Previous myocardial
infarction
-
Arterial hypertension -
Metabolic Diabetes mellitus -
Renal Renal failure -
Hepatic failure -
Previous stroke -
Pulmonary Severe bronchopulmonary
disease
-
56
Notes to Table 10: ECG = electrocardiogram, CPK-MB = Creatine phosphokinase – myocardial band,
NYHA = New York Heart Association.
Similarly, morbidity reporting was inconsistent in studies using the “High-risk
major surgery” criteria suggested by Shoemaker et al 92. This is discussed in more
detail in Chapter 2. The NSQIP morbidity definitions are not publicly available 4.
Recent attempts to formalise the classification of complications following surgery
have taken diverse approaches. The Association of Surgery of the Netherlands
(ASN) uses a classification system based on the nature, localization specification
and any additional description of the complication 169. The Trauma Registry of the
American College of Surgeons (TRACS) uses traditional diagnoses (e.g. deep
venous thrombosis) classified using 4 digit codes 169. An alternative classification
of surgical complications is based on three categories (complications, failure to
cure, sequelae) qualified by the subsequent result (treatment or outcome), ranging
from simple symptomatic treatment to death, in 8 sub-categories 170. A different
approach was adopted by Myles who developed a patient-rated nine-point quality
of recovery index score (QoR Score) derived from a 61-item questionnaire with
questions ranging from “able to breathe easily?” to “interest in work?” (Table 11)
171. The QoR score has been shown to be valid and reliable and suggested a useful
measure of recovery for anaesthesia and surgery.
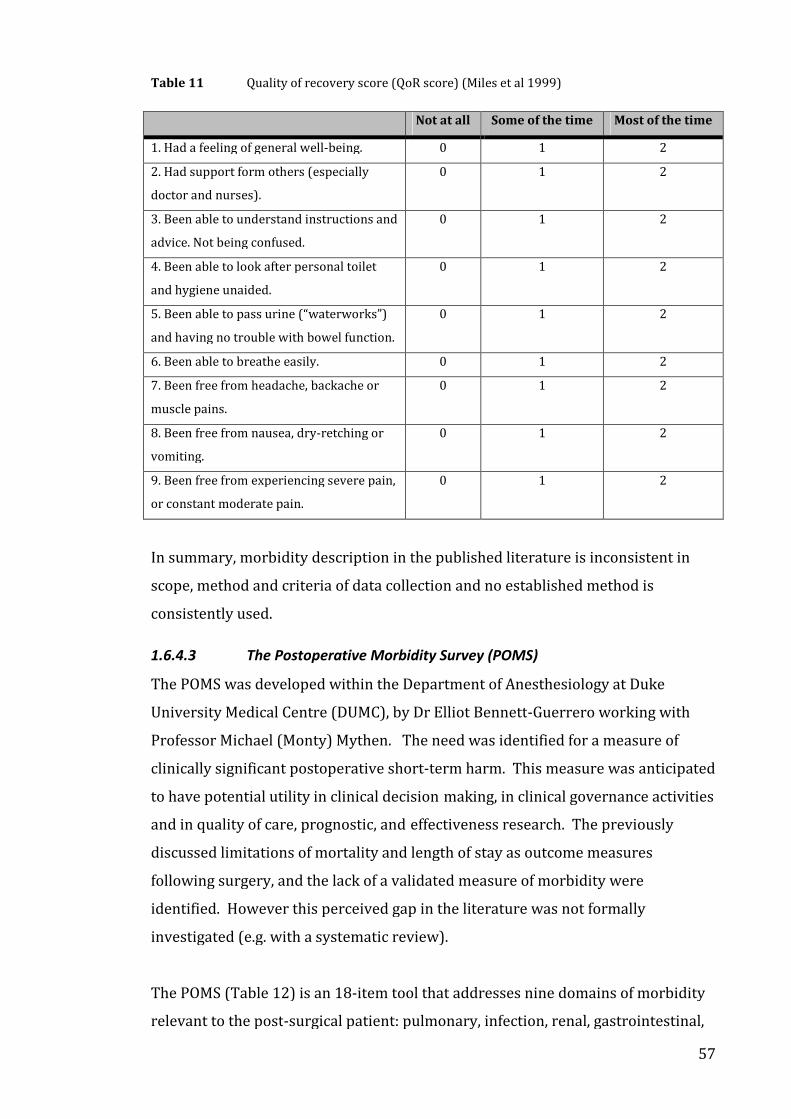
57
Table 11 Quality of recovery score (QoR score) (Miles et al 1999)
Not at all Some of the time Most of the time
1. Had a feeling of general well-being. 0 1 2
2. Had support form others (especially
doctor and nurses).
0 1 2
3. Been able to understand instructions and
advice. Not being confused.
0 1 2
4. Been able to look after personal toilet
and hygiene unaided.
0 1 2
5. Been able to pass urine (“waterworks”)
and having no trouble with bowel function.
0 1 2
6. Been able to breathe easily. 0 1 2
7. Been free from headache, backache or
muscle pains.
0 1 2
8. Been free from nausea, dry-retching or
vomiting.
0 1 2
9. Been free from experiencing severe pain,
or constant moderate pain.
0 1 2
In summary, morbidity description in the published literature is inconsistent in
scope, method and criteria of data collection and no established method is
consistently used.
1.6.4.3 The Postoperative Morbidity Survey (POMS)
The POMS was developed within the Department of Anesthesiology at Duke
University Medical Centre (DUMC), by Dr Elliot Bennett-Guerrero working with
Professor Michael (Monty) Mythen. The need was identified for a measure of
clinically significant postoperative short-term harm. This measure was anticipated
to have potential utility in clinical decision making, in clinical governance activities
and in quality of care, prognostic, and effectiveness research. The previously
discussed limitations of mortality and length of stay as outcome measures
following surgery, and the lack of a validated measure of morbidity were
identified. However this perceived gap in the literature was not formally
investigated (e.g. with a systematic review).
The POMS (Table 12) is an 18-item tool that addresses nine domains of morbidity
relevant to the post-surgical patient: pulmonary, infection, renal, gastrointestinal,
58
cardiovascular, neurological, wound complications, haematological and pain. For
each domain either presence or absence of morbidity is recorded on the basis of
precisely defined clinical criteria 172. The original publication describing the POMS
was an epidemiological description of 438 patients undergoing elective major
surgery at Duke University Medical Centre 172.
The POMS was designed with two guiding principles. First, it should only identify
morbidity of a type and severity that could delay discharge from hospital. Second,
the data collection process should be as simple as possible so that large numbers
of patients can be routinely screened. Following on from these principles, a
measure was produced that focused on easily collectable indicators of clinically
important dysfunction in key organ systems. The indicators are obtainable from
routinely available sources and do not require special investigations. These
sources include observation charts, medication charts, patient notes, routine blood
test results, and direct questioning and observation of the patient. Crucially, the
indicators define morbidity in terms of clinically important consequences, rather
than traditional diagnostic categories 172. For example, a patient with a clinically
significant chest infection would register POMS defined morbidity in the
pulmonary (requirement for supplemental oxygen or other respiratory support)
and infection (currently on antibiotics or temperature >38C in the last 24 hours)
domains, rather than meeting specific diagnostic criteria for a chest infection. The
relative dependence of some of the domain definitions on administered care is
discussed further in chapter 4 (Validation of the POMS).
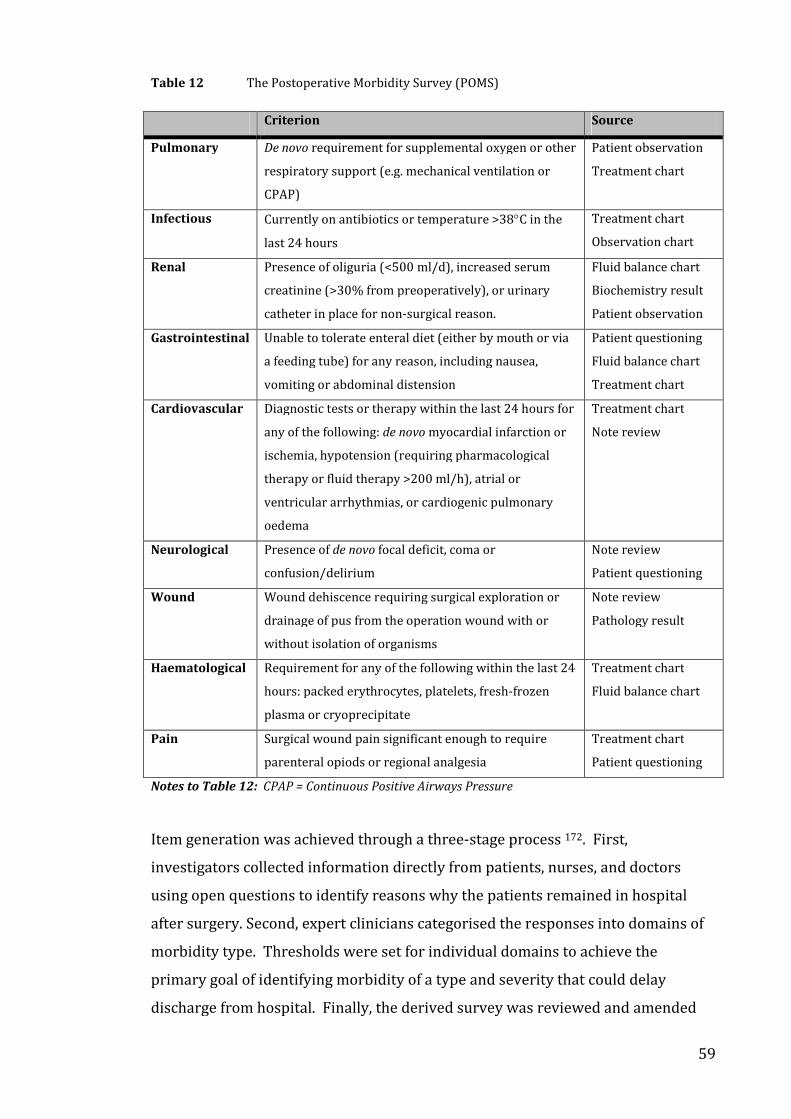
59
Table 12 The Postoperative Morbidity Survey (POMS)
Criterion Source
Pulmonary De novo requirement for supplemental oxygen or other
respiratory support (e.g. mechanical ventilation or
CPAP)
Patient observation
Treatment chart
Infectious Currently on antibiotics or temperature >38C in the
last 24 hours
Treatment chart
Observation chart
Renal Presence of oliguria (<500 ml/d), increased serum
creatinine (>30% from preoperatively), or urinary
catheter in place for non-surgical reason.
Fluid balance chart
Biochemistry result
Patient observation
Gastrointestinal Unable to tolerate enteral diet (either by mouth or via
a feeding tube) for any reason, including nausea,
vomiting or abdominal distension
Patient questioning
Fluid balance chart
Treatment chart
Cardiovascular Diagnostic tests or therapy within the last 24 hours for
any of the following: de novo myocardial infarction or
ischemia, hypotension (requiring pharmacological
therapy or fluid therapy >200 ml/h), atrial or
ventricular arrhythmias, or cardiogenic pulmonary
oedema
Treatment chart
Note review
Neurological Presence of de novo focal deficit, coma or
confusion/delirium
Note review
Patient questioning
Wound Wound dehiscence requiring surgical exploration or
drainage of pus from the operation wound with or
without isolation of organisms
Note review
Pathology result
Haematological Requirement for any of the following within the last 24
hours: packed erythrocytes, platelets, fresh-frozen
plasma or cryoprecipitate
Treatment chart
Fluid balance chart
Pain Surgical wound pain significant enough to require
parenteral opiods or regional analgesia
Treatment chart
Patient questioning
Notes to Table 12: CPAP = Continuous Positive Airways Pressure
Item generation was achieved through a three-stage process 172. First,
investigators collected information directly from patients, nurses, and doctors
using open questions to identify reasons why the patients remained in hospital
after surgery. Second, expert clinicians categorised the responses into domains of
morbidity type. Thresholds were set for individual domains to achieve the
primary goal of identifying morbidity of a type and severity that could delay
discharge from hospital. Finally, the derived survey was reviewed and amended
60
by a consensus panel of anesthesiologists and surgeons. The POMS (Table 1)
contains 18 items that address nine domains of postoperative morbidity. For each
domain, either presence or absence of morbidity is recorded on the basis of
objective criteria. The POMS is starting to be used in outcomes research 173 and in
effectiveness research 174.
A secondary objective of the original publication was to test the hypothesis that
intraoperative indices of tissue hypoperfusion were good predictors of
postoperative morbidity. Intraoperative variables believed to be associated with
tissue hypoperfusion (gastric pHi measured using gastric tonometry and arterial
base excess) were the strongest predictors of postoperative morbidity 172. These
findings are supportive of the model of postoperative organ dysfunction as a mild
variant of MOF. Abnormal tissue perfusion in general 175, and abnormal splanchnic
perfusion (pHi) in particular 176, are believed to be an aetiological factor in the
development of SIRS.
1.7 Clinical Measurement Scales
1.7.1 Introduction
Clinical phenomena may be directly observable, indirectly observable or
unobservable. For example, height and weight are observable phenomena that can
be directly measured using physical tools, and cardiac output can be indirectly
observed and measured in the intact human. However, intelligence and anxiety
cannot be directly observed, but may only be inferred by observing manifestations
of the latent (underlying) construct. Clinical measurement of unobservable
phenomena presents different challenges than those that occur with directly or
indirectly observable phenomena.
1.7.1.1 Levels of measurement
An important concept, which dictates which statistical tests are appropriate for
particular data, is the level of measurement. Four levels of variable can be
described within a hierarchical system of increasing order of mathematical
structure: nominal, ordinal, interval and ratio 177. Nominal (categorical, discrete)
data are unordered (e.g. apples, oranges). Ordinal (ordered categorical) data can
be ranked or ordered, but cannot be manipulated arithmetically (e.g. small,

61
medium, large). Interval measurement can be added or subtracted because the
differences between arbitrary pairs of adjacent measurements are identical;
therefore equal differences between measurements represent equal intervals (e.g.
temperature in degrees Celsius). Ratio measurements have the same qualities as
interval data, and in addition may be multiplied or divided because a ratio between
measurements is meaningful as the data includes a non-arbitrary zero value (e.g.
temperature in degrees Kelvin) 177. Interval and ratio data may be grouped
together as continuous data.
1.7.1.2 Observable and unobservable phenomena
Many observable phenomena in clinical measurement may be described using
ratio data (e.g. height, weight). Although some unobservable phenomena (e.g. IQ)
have been described using continuous (interval) data, in most cases psychometric
measurement is presented as nominal or ordinal data, which may on occasions be
treated as interval data where this is empirically justified. This is a logical
consequence of the imprecision inherent in measurements where observed
manifestations of unobservable phenomena are used to quantify a latent construct.
Important methodological differences exist between clinical measures where
continuous variables (e.g. haemoglobin, cardiac output) describe observable
phenomena and ordinal clinical measurement scales of unobservable phenomena.
Laboratory measurement and clinical monitoring involve predominantly technical
challenges relating to device performance and choice of an appropriate “gold
standard”. In this context, validity of continuous variables is tested in relation to
an accepted (albeit often flawed) gold standard (E.g. Dye dilution cardiac output
measurement using the Fick principle): so-called “criterion validity” 178.
Reproducibility (consistency, agreement) is intrinsic to this comparison and
consequently reliability becomes subsumed within validity. The concepts of
calibration, drift, precision, bias and accuracy are used to describe the output of
this testing. Statistical treatments such as those proposed by Bland Altmann (bias,
precision, limits of agreement) are favoured 179.
In the case of clinical measurement scales for unobservable phenomena where
measurements reflect manifestations of the latent construct, it is rare for a “gold
standard” to exist. As a consequence, criterion validity cannot be determined for
62
such concepts as health status 180. Where a criterion standard does exist, the
requirement for the development of a new measure should be questioned -
improved speed or ease of use might be legitimate justifications. Alternative
methods of validation, such as hypothesis testing to establish construct validity,
are therefore usually required (see below, 1.7.5 Validity).
1.7.1.3 Composite Outcome Measures
Composite outcomes such as the POMS have more diverse content than simpler
tools and are believed to have a better chance of detecting unexpected adverse
outcomes as well as improving the power of studies 181. Composite outcomes,
which combine several different but clinically relevant endpoints, can reduce the
sample size necessary to have an adequately powered study: the higher the event
rate, the smaller the number of patients required to detect any given treatment
effect. Furthermore, composite endpoints that provide comprehensive coverage
across organ systems have the additional advantage that they are more likely to
detect unexpected adverse effects than more narrowly focused outcome measures
181. Composite outcome measures are consistent with the clinimetric approach to
measurement but sit less comfortably within the psychometric tradition (see
below, 1.7.3 Clinimetrics and Psychometrics).
1.7.1.4 Development of Clinical Measurement Scales
The development of clinical measurement scales is divided into two stages. The
first relates to the items within the scale and the second relates to the performance
of the integrated scale. Initial development involves developing the items,
selection of items and exploration of scaling properties. Subsequent development
involves testing the scale for reliability and validity.
1.7.3 Clinimetrics and Psychometrics
Two contrasting but related approaches to test development and validation exist:
Psychometrics and Clinimetrics. Psychometrics is the field of study concerned
with the theory and technique of measurement in education and psychology.
During the late 1800s, Francis Galton developed tests (e.g. questionnaires and
surveys) and statistical approaches (including correlation and regression) for the
study of biological differences, effectively inventing the field of biometrics, and
contributed, with others, to the origins of psychometrics. Central to the
psychometric approach is the measurement of unobservable phenomena such as
63
intelligence or depression. Whilst manifestations of the trait or state can be
observed, the underlying or latent construct can only be inferred from these
manifestations and cannot be measured directly. One consequence of this, is that
the construct is assumed, if valid, to be one-dimensional 182. Measurement
requires identification of items that are manifestations of the latent construct (e.g.
anhedonia in depression) 182. These items should therefore be homogeneous in
performance in order to reflect the uni-dimensional nature of the latent construct.
This pattern of item performance in turn mandates an approach where allocating
different weights to different items is neither required nor appropriate 183. Finally
this approach points to a hidden conceptual model within psychometrics: that the
number and not the intensity of symptoms determine severity of illness 183.
The term “Clinimetrics” was coined by Dr Alvan R Feinstein in 1982 184 to describe
the “domain (area of study) concerned with indexes, rating scales and other
expressions that are used to describe or measure physical symptoms, physical
signs and other distinctly clinical phenomena in clinical medicine.” He
subsequently used it as the title of a book published in 1987 185. Feinstein is also
notable as the individual who coined the term “comorbidity,” which refers to the
condition of having a disease unrelated to the one of primary interest (in the
surgical context a disease other than the condition for which the operation is being
carried out), and as the “father” of clinical epidemiology 186. However, Virginia
Apgar working some 20 years earlier in 1953 is considered by some the spiritual
parent of clinimetrics 187. In 1953 she implicitly introduced the concept that an
intangible clinical phenomenon (a newborn child’s overall condition) could be
converted into a formally specified measurement (the APGAR score) 188. Other
examples of clinimetric indices with similar implicit conceptual models include the
Jones Criteria for Rheumatic Fever 184, New York Heart Association functional
classification 189, Glasgow Coma Sale 190 and the American Society of
Anesthesiologists physical status scale 74.
Feinstein described six core principles of the clinimetric approach 185:
1. Selection of items based on clinical expertise rather than statistical technique
2. Weighting of items based on clinicians or patients experience or preferences
(not unit weights)
64
3. Heterogeneity of items, so as to capture all symptoms or processes that
contribute to the construct (rather than homogeneity)
4. Ease of use (pen and paper or mental arithmetic not computer analysis),
5. Face validity based on inclusion of all relevant clinical phenomena (rather than
exclusion of items that correlate poorly with others)
6. Using the patient’s report of what is troublesome or bothersome as the source
of information for subjective data.
Fayers et al 191 contrasted effect indicators with causal indicators: psychometrics
being interested in effect indicators of the latent trait (e.g. IQ) whereas causal
indicators create the construct of interest (e.g. quality of life). They use the
example of quality of life (QoL) metrics where a physical symptom of a disease
may have a causal association with low QoL whereas anxiety may be considered to
have an effect relationship, being a consequence of the low QoL 191. Some factors
may fall into both categories: for example depression may be both cause and
consequence of low QoL 191. Clearly, causal indicators fit more comfortably within
a clinimetric perspective of measurement.
Whilst many of the approaches of psychometrics are central to clinimetrics (e.g.
reliability and validity testing), there are key conceptual elements that are
different. Homogeneity of component items reflecting a latent construct is central
to psychometrics. However the level of correlation inherent in homogeneity tends
to reduce the responsiveness of a measure: redundancy increases item correlation
but decreases sensitivity. Psychometric instruments do not usually utilize
weighting of variables. This is in part because weights will not contribute
significantly to the total variance of the scale if items are homogeneous.
Conversely, if item correlation is close to zero or even negative, which is possible
in a clinimetric scale including an item with clinical face validity and weighting, it
can have a significant effect on overall variance. Use of the available evidence
reflecting salience or patient significance to allot weights to items is acceptable
within the clinimetric approach. The issue of scaling properties complicates the
discussion of item heterogeneity. Heterogeneous items suggest that devising a
scale based on a sum of item scores is unlikely to be valid. Different combinations
of items may sum to the same score whilst at the same time having inconsistent
65
clinical and prognostic implications. In practice scaling properties may be tested
empirically. Some controversy exists in the literature as to whether the distinction
between psychometrics and clinimetrics is valid 192193. However the clinimetric
literature thrives with calls for research to distinguish the relative advantages of
each approach 194. A study comparing the two approaches in the parallel
development of a single measure (of upper extremity disability) concluded that the
two approaches were complimentary 195.
With respect to this dichotomy of measurement approaches, the POMS
(multidimensional nominal data) is clearly within the clinimetric tradition. POMS
items include effect indicators (e.g. temperature) and causal indicators (e.g. wound
infection) as well as indicators that are dependent on administered care
(prescription of antibiotics): a pragmatic approach is taken in item selection.
However, there is reason to believe that postoperative morbidity reflects a latent
(underlying) construct (see 1.6.4.1). Heterogeneity of domain responses may
reflect heterogeneity of individual susceptibility to different categories of
morbidity in the context of an underlying postoperative inflammatory state.
1.7.3 Reliability
Reliability testing is based on the concept that error is inherent in all
measurements, that this error can be separated into random and systematic
components, and that each component can be quantified.
The literature on reliability is complicated by the inconsistent use of a variety of
synonyms including objectivity, reproducibility, stability, agreement, association,
sensitivity, precision 182. The relationship between these terms and their specific
use in this thesis will be explained below.
1.7.3.1 Reproducibility: correlation, association, consistency and agreement
The concept of reproducibility of a measurement has several facets: agreement,
consistency, and reliability are all aspects of reproducibility. Reproducibility
concerns the degree to which repeated measurements of the same quantity
provide similar results.
66
Consistency is the tendency to record the same measurement given the same unit
of observation 196. Consistency is necessary but not sufficient for agreement. For
example, one observer may record black every time another observer records
white: agreement would be zero but consistency would be 100%.
Agreement describes how close the scores of repeated measures (under the same
conditions) are to each other 197. Consistency is necessary for agreement.
Reliability and agreement have a more complex relationship. Measures of
agreement include: mean +/- standard deviation, standard error of the mean,
percentages of agreement (limitation does not account for chance agreement),
intra-class correlation coefficient, and limits of agreement (Bland and Altmann) 197.
Consistency does not imply absence of bias: consistency may occur with a fixed
bias (offset or multiple) that can be corrected for to achieve agreement.
Reliability is often viewed as a facet of reproducibility but additionally takes into
account the object of measurement. However, this relationship is probably more
complicated. Whilst, in general, reproducibility (agreement) is a requirement for
reliability, under certain conditions (counter intuitively) reliability can be
inversely related to reproducibility. For example all raters agree on the value of a
particular characteristic (100% consistency, agreement, reproducibility and
correlation), but all the values are equal. There is therefore no discrimination
possible between levels of the measured variables, and therefore no reliability 182.
Reliability therefore describes the degree to which subjects (or patients) can be
distinguished from each other. This is dependent on the relationship between the
measurement error and the variability between subjects 197. Formal calculation of
a reliability coefficient (separating out the different components of error) uses
variations of the intra-class correlation coefficient 197 discussion of which is
beyond the scope of this thesis.
1.7.3.2 Stability: inter-rater, intra-rater and test-retest reliability
These terms describe how a measure performs under different conditions,
commonly of time and person. Measures of stability include inter-rater reliability
(inter-scorer/inter-observer reliability), intra-rater reliability (intra-scorer/intra-
observer) and test-retest reliability 198. Their differences can be summarised:
67
Inter-rater reliability different observer, same sample, same/similar time
Intra-rater reliability same observer, same sample, same/similar time
Test-retest reliability same observer, same sample, different time: for self
administered tests
Statistically all three of these measures are usually approached similarly. For
categorical variables Cohen’s Kappa (two raters) 199 or Fleise’s Kappa (> two
raters) 200 are used to assess reliability and for continuous variables product
moment correlation (interclass, Pearson, Spearman) is used 198. Some authorities
argue that for inter-rater reliability and intra-rater reliability, it is more
appropriate to use intra-class correlation (which takes account of systematic
error) whereas for test-retest reliability, product moment correlation may be more
appropriate 198.
1.7.3 Reliability and internal consistency
In psychometric tests, where the measurement of a uni-dimensional underlying
trait is the aim of test development, the internal consistency of the test is also
considered an element of reliability. The implicit assumption being that any test
item reflecting the underlying trait should correlate with other tests items. If this
holds true, then any test item, or group of items, should also correlate with clusters
of other test elements. Consequently, if this assumption is held to be true then the
internal consistency of items within a measure is an element of reliability. This can
be tested by examining the relationships of individual items with the pooled other
items (item-rest correlation), by dividing the test and comparing the different
halves (split-half reliability) or by comparing with alternate forms of the same test
(e.g. historical version of the same test or an alternative second version of the test
derived from similar items) 182. Item-rest correlation is used in the calculation of
Cronbach’s alpha 201 (internal consistency for polychotomous variables) and Kuder
Richarson 20 202 (internal consistency for dichotomous variables).
In summary, reliability incorporates a relationship with the underlying data
(context sensitive) because the ability to distinguish between individuals reliably
depends on the characteristics of the population being studied. Measurement
error is related to the overall expected variation of the population being measured.
Thus reliability can be stated as the ratio of variance between patients to the total
68
variance (patient variability plus measurement error). A zero therefore indicates a
wholly unreliable measure whilst one indicates perfect reliability.
1.7.4 Deriving a score from multiple items
Surveys and scores (multi-item measures) are usually composed of multiple
categorical (dichotomous or polychotomous variables) items. Categorical items
may be derived by categorising continuous data. An ordinal score may be
attributed to appropriate polychotomous items. The summary results from these
types of measures may be expressed in a variety of formats. A single numerical
(ordinal) result may be obtained from the sum, or weighted sum, of the item
scores: a score or index. For example the Apgar score used in the assessment of
neonatal well-being 188. Alternatively a threshold value can be specified to define a
single dichotomous result (e.g. presence or absence of morbidity in the POMS).
An additional approach is to report individual results from more than one domain
to provide a composite descriptive outcome (for example the TNM staging system
for malignancy) 203.
Reporting of simple or composite dichotomous or polychotomous variables does
not require additional arithmetic to obtain the outcome metric. Data used to
derive scores from sums, or weighted sums, of constituent variables should meet
certain criteria in order to be treated in this way. Demonstration of scaling
properties is essential if a score is to be derived from a test. Scaling properties
require that the arithmetic relationship between score results is consistently
reflected in the underlying variable 182. For example a morbidity score of 4 should
be twice as bad as a morbidity score of two. Although this can be individually
validated against independent criteria, or using hypothesis testing, a sine qua non
of this relationship should be that there is correlation between items within a test
182. With tests that include a heterogeneous set of items it is important to assess
whether there is conceptual validity in trying to develop a single score irrespective
of the statistical picture. Where statistical correlation is problematic, items in a
score can be differentially weighted to improve performance of a score. However,
whilst weighting items is consistent with the clinimetric approach to test
development it is counter to the psychometric approach, where all items are
believed to reflect underlying construct and the number of items is related to the
degree of the trait.
69
1.7.5 Validity
Validity refers to the degree to which a test is measuring what it is intended to
measure. Essential elements of validity are face and content validity, reliability
and empirical validity. Terminology can be confused in this area and the
definitions below are based on the approach of Steiner and Norman in “Health
Measurement Scales” 182.
Face validity is the extent to which the measure “on the face of it” appears to be
measuring the desired qualities. Content validity is a closely related concept and
describes whether the items of the measure sample all the relevant domains that
reflect the desired quality being measured. The assessment of face and content
validity relies on subjective evaluation of appropriateness or “believability” by
experts. In the case of clinical measurement tool development, believability
assessment is normally undertaken by a panel of “clinical experts”. In the case of
PROMs it can be argued that face validity should also be apparent to the users of
the measurement tools: the patients. Face and content validity have been termed
“Validation by assumption” 182. In some cases a score may be both reliable and
valid (based on criterion or construct validity) but lack face validity due to the
obscurity of the items. This can be an advantage in the measurement of qualities
that may have stigma attached (e.g. a survey to identify alcoholism).
Empirical validity encompasses criterion validity and construct validity
Criterion validity (convergent validity, concurrent validity) describes the
comparison of a new test, scale or index with a recognised criterion or “gold
standard”. For example, the comparison of data obtained from a novel method of
cardiac output measurement with criterion results obtained using bolus
thermodilution using a pulmonary artery flotation catheter (the accepted “gold
standard”). In the context of test development, the existence of an established gold
standard should lead to critical appraisal of the need for a new test. The new test
may be justified in terms of minimising cost, duration of administration or patient
disturbance. However the field of test development is littered with areas where
multiple tests measure the same or similar phenomena with no obvious relative
benefit e.g. clinical scores of depressive illness. The methodology for establishing
70
criterion validity between a new test and the gold standard is well described 182
and may include assessment of sensitivity and specificity and the methods of Bland
and Altman 179. Criterion validity may be divided into concurrent and predictive
validity. Concurrent validity explores correlation of the new measure with the
criterion measure. Predictive validity explores correlation of the new measure
against information that will be available (e.g. correlation between intelligence
tests and subsequent exam scores). However where no criterion test exists,
alternative methods of assessment must be used.
Construct Validity: In the absence of a comparator criterion test an alternative
approach is adopted. Classical hypothesis testing is utilised to explore the
behaviour of the test in a variety of contexts. Ideally, these hypotheses should be
consistent with an explicitly defined underling construct. For example with
intelligence testing it might be hypothesized that individuals with high intelligence
tests would achieve greater academic success or earn more money during their
lifetime. These hypotheses can then be tested empirically and if supported by the
results of the test then construct validity is supported. Construct validity is
therefore limited or absent if these hypotheses are poorly supported empirically.
The hypothesis testing approach asks the question: “Do the results of this study
allow us to draw the inferences which we wish to?” The burden of proof arises
not from a single powerful experiment but from a series of converging
experiments 182.
Testing of construct validity in relation to postoperative morbidity might involve
exploring hypotheses such as:
Patients exhibiting more morbidity would be expected to stay in hospital for a
longer period of time.
Patients at higher risk of adverse outcome (based on preoperative risk
adjustment scores) would be expected to have a higher prevalence of
morbidity.
The population and environment in which the validation of a new measurement
tool was performed define the validity of the tool. Thus, reliability and validity are
not absolutes qualities, rather they are relative to the context of development and
71
testing: in other contexts validity may be limited or absent, and cannot be
assumed. Therefore, when considering the development of a metric to describe
postoperative morbidity, the type of surgery (orthopaedic, cardiac,
gastrointestinal) and the type of patients (children, adults) in the validation cohort
will dictate the spectrum of validity 182.
1.8 Summary
1. Outcome following surgery is a significant public health issue.
2. Quality of surgical care can be defined in a variety of ways. The distinction
between structure, process and outcome is important, as is the perspective of the
measurer. In the UK quality has been subdivided into safety, experience and
effectiveness.
3. Risk adjustment of outcome data is essential to minimise confounding by
patient and surgical characteristics if effectiveness of care is to be evaluated.
4. Clinically important short-term outcomes following surgery include
mortality and morbidity. Duration of hospital stay is commonly used as a
surrogate measure of outcome.
5. Description and measurement of morbidity following surgery are
inconsistent limiting comparisons of effectiveness of care.
6. Measurement of unobservable phenomena, such as postoperative
morbidity, is dependent on measurement of hypothesised manifestation of the
phenomena.
7. Reliability and validity are essential requirements in a clinical measure and
are critically dependent on the context of testing. In the case of an unobservable
phenomenon such as postoperative morbidity, a criterion measure may not be
available and testing of construct validity is required.
72
Chapter 2: “Perioperative increase in global
blood flow to explicit defined goals and outcomes
following surgery”: a systematic review
2.1 Introduction
This chapter presents a systematic review of studies assessing the efficacy of a
style of haemodynamic management (perioperative administration of fluids
and/or vasoactive drugs targeted to increase global blood flow to explicit defined
goals) in patients undergoing major surgery. The chapter describes the effect of
this complex intervention on mortality, morbidity and resource utilization as well
as using stratified meta-analysis to explore the impact of components of the
intervention on pooled outcomes. Heterogeneity of outcomes reporting between
studies is highlighted as a limitation of this systematic review.
2.1.1 Context
The association between limited physiological reserve and risk of death following
surgery has long been recognized 204,205. Post hoc analysis of patients undergoing
major surgery revealed that survivors had a higher cardiac index and lower
systemic vascular resistance than non-survivors 206,207. Conversely, commonly
monitored vital signs (heart rate, arterial blood pressure, central venous pressure,
temperature, haemoglobin concentration) were found to be poor predictors of
mortality when compared with variables reflecting blood flow or oxygen flux
(cardiac output, total body oxygen delivery (DO2)) 208,209. In particular survivors of
major surgical procedures were found to have higher values for cardiac output or
DO2 compared with non-survivors. More recent studies undertaken to assess the
relationship between oxygen transport variables and postoperative morbidity and
mortality have shown mixed results 210-212.
New therapeutic options and monitoring techniques that became available in the
1970s, particularly the introduction of the pulmonary artery flow directed catheter
(PAC) 213,214, opened up the possibility of measuring, and then manipulating, an
individual's cardiovascular system. It was hypothesized that targeting goals for
73
cardiac output and DO2 in all patients to the values manifested by the survivors of
surgery would improve outcome 215. An important principle of this manipulation
was that augmentation of cardiac output and DO2 would result in improved tissue
perfusion and oxygenation.
Since the 1970s, a number of randomised trials have been undertaken in patients
in the perioperative period that have investigated the efficacy of this approach.
However, these trials differ in the case mix of the patients recruited (different
operation severity and comorbidities and, therefore, expected mortality), the
techniques used to measure cardiac output (PAC - thermodilution, Doppler
velocimetry, arterial waveform analysis), the specific goals targeted (cardiac
output, DO2, maximum stroke volume), the techniques used to achieve the goals
(fluids, fluids plus vasoactive drugs) and the management of the control arm. In
addition some of the studies were not blinded and many had small sample sizes
leading to limited statistical power. Despite this a number of non-systematic
reviews have attempted to group together identified studies in order to draw
general conclusions from them 216-220. However, these reviews have identified
varying numbers of trials and have not been undertaken systematically, using
scientifically rigorous techniques for literature searching, or for abstraction and
analysis of data. Three previous systematic reviews have addressed this question
221-223 and reported improved outcomes, but do not include recently published
studies and did not focus exclusively on perioperative data.
The intervention being evaluated in this review is a complex intervention 224. The
MRC(UK) defined complex interventions as interventions built up from a number
of components, which may act both independently and inter-dependently 224. The
components usually include behaviours, parameters of behaviours (e.g. frequency,
timing), and methods of organising and delivering those behaviours (e.g. type(s) of
practitioner, setting and location). Stratified meta-analysis may be used to
investigate which components of a complex intervention contribute to the
observed response 225.
74
2.1.2 Aims
The aim of this systematic review of the literature was to address the question:
does perioperative administration of fluids and/or vasoactive drugs targeted to
increase global blood flow, in adults undergoing surgery, reduce mortality and
morbidity and resource utilisation?
A secondary aim of this review was to investigate the influence of timing of
intervention, type of intervention, type of goals, mode (urgency) of surgery and
type of surgery on outcome, in order to identify possible determinants of response
to the intervention.
2.2 Methods
2.2.1 Summary
A systematic review of manuscripts published in peer-reviewed journals was
conducted using the Cochrane Collaboration methodology. All analyses were pre-
specified in a published protocol 226 that was peer-reviewed and approved (via the
Cochrane Collaboration) prior to commencement of the literature searches.
Protocol development was guided by the “Optimisation Systematic Review
Steering Group” (Appendix 1).
2.2.2 Search Strategy
MEDLINE, EMBASE, and the Cochrane Controlled Trials Register (CCTR) databases
were searched between 1966 and end-October 2006 using a filter for RCTs
(Appendix 2 and Appendix 3) and 54 selected key words (Appendix 4). The
original filter (Appendix 2) was used to search the databases up to end December
2000. The modified filter (Appendix 3) was used to search from January 2000 to
October 2006.
Reference lists of potentially eligible studies and previously published systematic
reviews were also searched. Personal reference databases of the authors and
Steering Group were searched. Experts in the field and relevant pharmaceutical
companies were contacted and asked for published and unpublished reports.
75
RCTs with or without blinding were considered for inclusion. “Perioperative” was
defined as initiated within 24 hours pre-surgery and up to 6 hours post-surgery.
“Targeted to increase global blood flow” was defined as interventions aimed to
achieve explicit measured goals, specifically: CO, cardiac index (CI), DO2, oxygen
delivery index, oxygen consumption (VO2), oxygen consumption index, stroke
volume (SV), stroke volume index, mixed venous oxygen saturation (SVO2) and
lactate. “Adult” was defined as aged 16 years or older. “Undergoing surgery” was
defined as patients having a procedure in an operating room. “Outcome” was
defined as mortality (for longest reported period), morbidity (rate of overall
complications, rates of renal impairment, arrythmia, respiratory failure/ARDS
(Acute Respiratory Distress Syndrome), infection, myocardial infarction,
congestive heart failure/pulmonary oedema and venous thrombosis), resource use
(hospital stay post-surgery, intensive care stay post-surgery) health status (six
month functional health status, quality of life scores), and cost. All definitions were
agreed a priori. No language restrictions were applied.
2.2.3 Data extraction
All definitions were agreed a priori. Two independent reviewers (the author [MG],
Dr Mark Hamilton [MH]) screened the titles and abstracts of studies identified by
the searches to identify potentially eligible studies. Full texts of potentially eligible
studies were obtained. Study characteristics of included studies were abstracted
including: study design; patient population; interventions; and outcomes. At least
three attempts were made to contact authors of eligible studies to obtain any
required data not available in the published report. Methodological quality of
included studies was assessed using the criteria described in the component
checklist of Gardner et al (Appendix 5) 227. In addition allocation concealment and
blinding were separately assessed. Differences were resolved by consensus
between the author (MG) and a co-investigator (MH) after consultation with a
third investigator (Dr Kathy Rowan [KR]). Abstracted data were entered and
checked by MG and MH. Study authors were contacted for additional data where
necessary.
76
2.2.4 Analysis plan
Abstracted data describing the eligible studies were tabulated. Inter-rater
reliability for methodological assessment was assessed using Kappa statistics.
Analyses of outcomes were based on intention-to-treat. A weighted treatment
effect was calculated across all RCTs using Review Manager (RevMan)(Review
Manager [Computer program]. Version 5.0. Copenhagen: The Nordic Cochrane
Centre, The Cochrane Collaboration, 2008).
Results are expressed as Peto odds ratios (OR) for dichotomous outcomes and
mean differences (MD) for continuous outcomes. The robustness of these
estimates was explored by comparing both fixed- and random-effects models and
by including larger (n>=100) and higher-quality (allocation concealment grade A)
studies only. An analysis of risk differences was used to estimate the number
needed to treat.
Stratified meta-analyses, using mortality data only, were undertaken to investigate
the influence of timing of intervention, type of intervention, type of goals, mode
(urgency) of surgery and type of surgery. Subgroups were defined, a priori: (a)
timing of commencement of the intervention - preoperative (before arrival in
anaesthetic room/operating room), intraoperative (arrival in anaesthetic
room/operating room to leaving theatre), postoperative (after leaving operating
room); (b) type of intervention - fluids alone and fluids with vasoactive drugs; (c)
type of goals - cardiac output and oxygen transport goals (direct flow
measurement), mixed venous oxygen saturations or lactate (surrogate flow
measurement) stroke volume (flow component measurement); (d) urgency of
surgery - elective, emergency; (e) type of surgery - cardiac, vascular, general.
2.3 Results
2.3.1 Description of studies
We identified 124,728 potential studies in the initial electronic search. No
additional studies were identified by contacting experts in the field or relevant
pharmaceutical companies or by searching personal reference databases of the
authors or Steering Group. No additional studies were identified following
77
screening of reference lists of potentially eligible studies and previously published
systematic reviews (snowballing).
Fifty potentially eligible studies were identified following screening of abstracts of
potential studies (MG, HM). Twenty-eight potentially eligible studies that did not
meet the study inclusion criteria are summarized in Table 13. Reasons for
exclusion included: outside timing criteria (9 studies, established critical illness,
severe sepsis, septic shock), not all patients underwent surgery (9 studies,
trauma), ineligible flow goals (3 studies, pHi guided, intra-thoracic blood volume
guided), same flow goal in both groups (4 studies), unclear flow goals (2 studies)
and design (2 studies, not RCTs).
Twenty-two fully published studies (including 4546 patients) met the study
inclusion criteria. Characteristics of included studies are summarized in Table 14.
Outcome reporting in these included studies was inconsistent (e.g. different
criteria for classifying mortality) and many studies did not report outcomes sought
by this review. Mortality, resource utilization and cost outcomes are reported in
Table 15. Morbidity outcomes are reported in Table 16.
2.3.2 Risk of bias in included studies
Allocation concealment was adequate (Grade A) in 10/22 studies but inadequate
or unclear in the remainder (Table 17). Thirteen of twenty-two studies were
classified as large (>=100 patients)(Table 17). There was considerable variation in
methodological quality between studies (Table 18). The degree of concordance
between reviewers (MG, MH) was >90%.
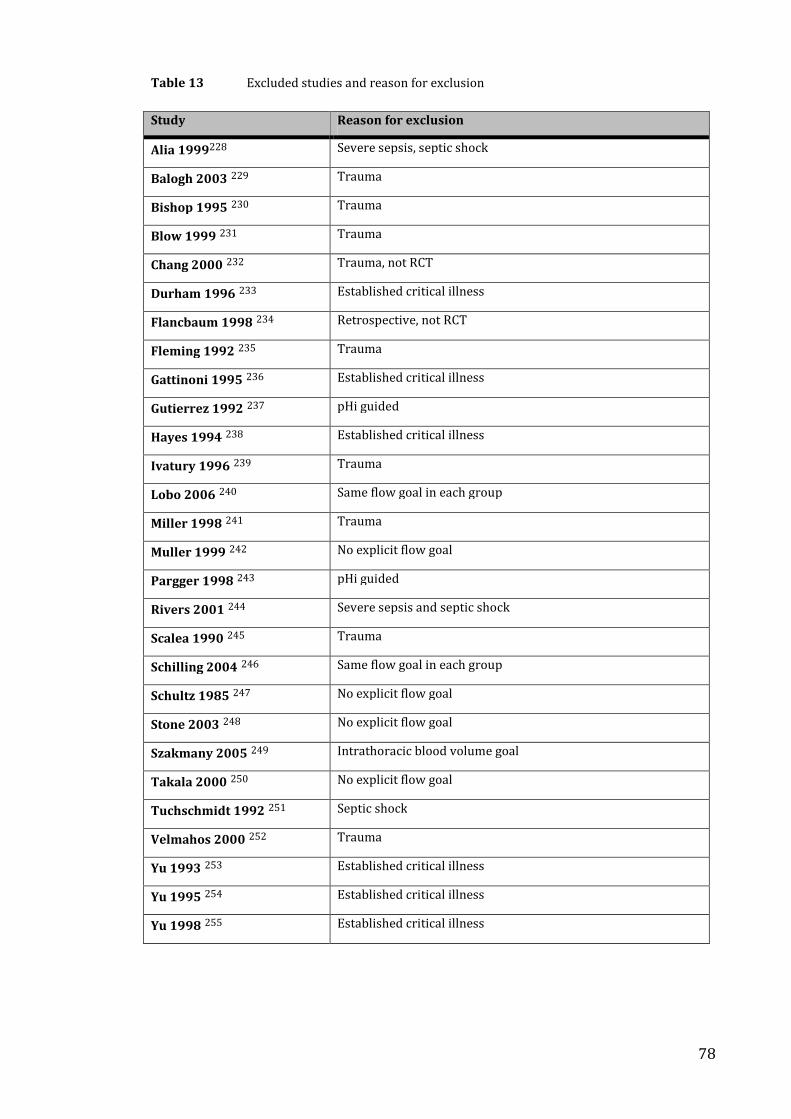
78
Table 13 Excluded studies and reason for exclusion
Study Reason for exclusion
Alia 1999228 Severe sepsis, septic shock
Balogh 2003 229 Trauma
Bishop 1995 230 Trauma
Blow 1999 231 Trauma
Chang 2000 232 Trauma, not RCT
Durham 1996 233 Established critical illness
Flancbaum 1998 234 Retrospective, not RCT
Fleming 1992 235 Trauma
Gattinoni 1995 236 Established critical illness
Gutierrez 1992 237 pHi guided
Hayes 1994 238 Established critical illness
Ivatury 1996 239 Trauma
Lobo 2006 240 Same flow goal in each group
Miller 1998 241 Trauma
Muller 1999 242 No explicit flow goal
Pargger 1998 243 pHi guided
Rivers 2001 244 Severe sepsis and septic shock
Scalea 1990 245 Trauma
Schilling 2004 246 Same flow goal in each group
Schultz 1985 247 No explicit flow goal
Stone 2003 248 No explicit flow goal
Szakmany 2005 249 Intrathoracic blood volume goal
Takala 2000 250 No explicit flow goal
Tuchschmidt 1992 251 Septic shock
Velmahos 2000 252 Trauma
Yu 1993 253 Established critical illness
Yu 1995 254 Established critical illness
Yu 1998 255 Established critical illness
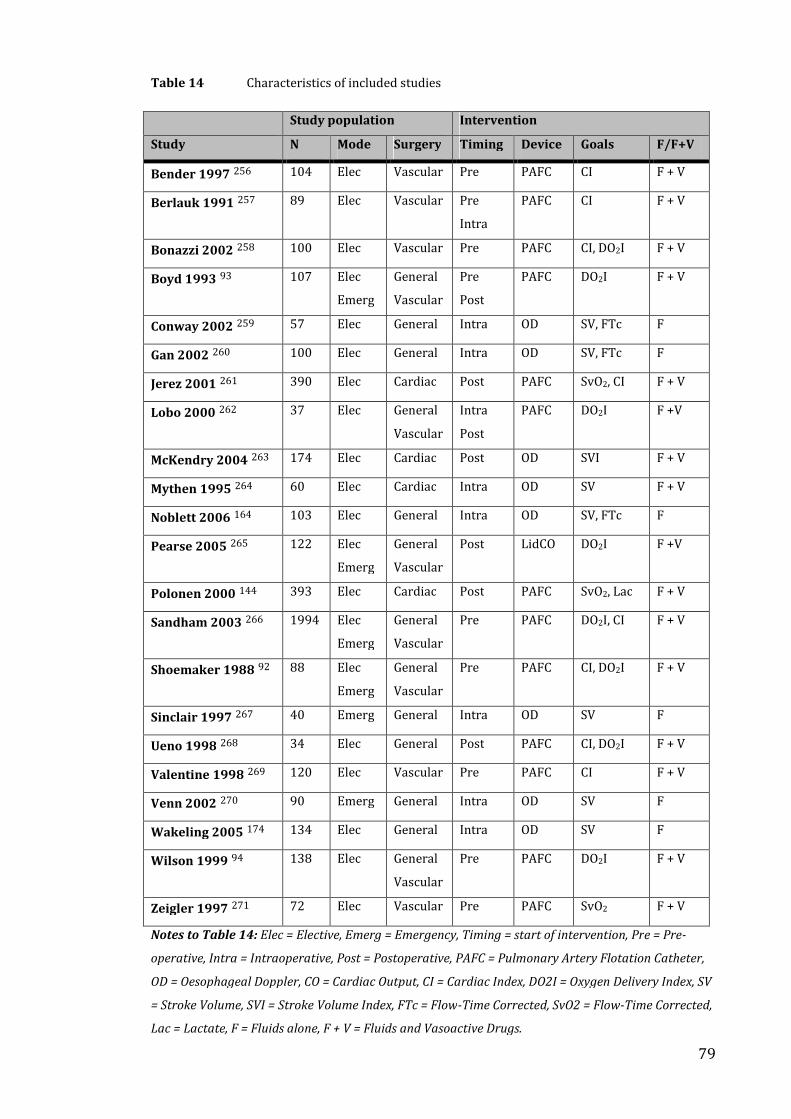
79
Table 14 Characteristics of included studies
Study population Intervention
Study N Mode Surgery Timing Device Goals F/F+V
Bender 1997 256 104 Elec Vascular Pre PAFC CI F + V
Berlauk 1991 257 89 Elec Vascular Pre
Intra
PAFC CI F + V
Bonazzi 2002 258 100 Elec Vascular Pre PAFC CI, DO2I F + V
Boyd 1993 93 107 Elec
Emerg
General
Vascular
Pre
Post
PAFC DO2I F + V
Conway 2002 259 57 Elec General Intra OD SV, FTc F
Gan 2002 260 100 Elec General Intra OD SV, FTc F
Jerez 2001 261 390 Elec Cardiac Post PAFC SvO2, CI F + V
Lobo 2000 262 37 Elec General
Vascular
Intra
Post
PAFC DO2I F +V
McKendry 2004 263 174 Elec Cardiac Post OD SVI F + V
Mythen 1995 264 60 Elec Cardiac Intra OD SV F + V
Noblett 2006 164 103 Elec General Intra OD SV, FTc F
Pearse 2005 265 122 Elec
Emerg
General
Vascular
Post LidCO DO2I F +V
Polonen 2000 144 393 Elec Cardiac Post PAFC SvO2, Lac F + V
Sandham 2003 266 1994 Elec
Emerg
General
Vascular
Pre PAFC DO2I, CI F + V
Shoemaker 1988 92 88 Elec
Emerg
General
Vascular
Pre PAFC CI, DO2I F + V
Sinclair 1997 267 40 Emerg General Intra OD SV F
Ueno 1998 268 34 Elec General Post PAFC CI, DO2I F + V
Valentine 1998 269 120 Elec Vascular Pre PAFC CI F + V
Venn 2002 270 90 Emerg General Intra OD SV F
Wakeling 2005 174 134 Elec General Intra OD SV F
Wilson 1999 94 138 Elec General
Vascular
Pre PAFC DO2I F + V
Zeigler 1997 271 72 Elec Vascular Pre PAFC SvO2 F + V
Notes to Table 14: Elec = Elective, Emerg = Emergency, Timing = start of intervention, Pre = Pre-
operative, Intra = Intraoperative, Post = Postoperative, PAFC = Pulmonary Artery Flotation Catheter,
OD = Oesophageal Doppler, CO = Cardiac Output, CI = Cardiac Index, DO2I = Oxygen Delivery Index, SV
= Stroke Volume, SVI = Stroke Volume Index, FTc = Flow-Time Corrected, SvO2 = Flow-Time Corrected,
Lac = Lactate, F = Fluids alone, F + V = Fluids and Vasoactive Drugs.
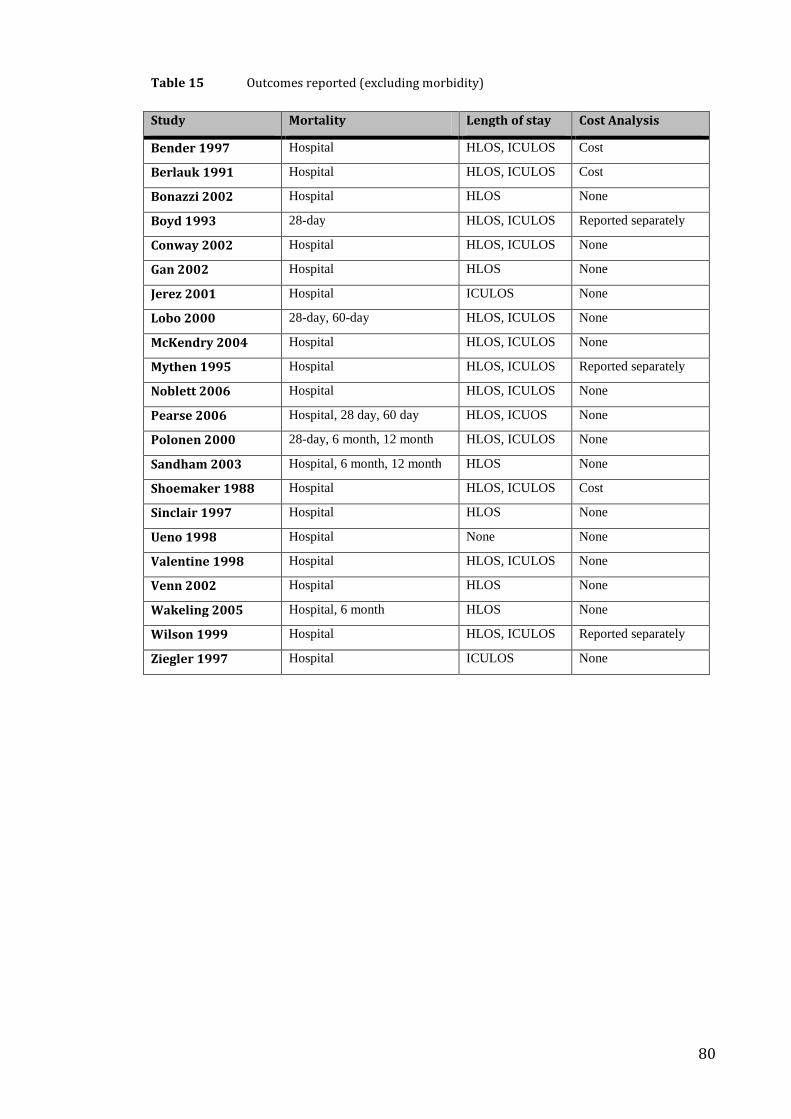
80
Table 15 Outcomes reported (excluding morbidity)
Study Mortality Length of stay Cost Analysis
Bender 1997 Hospital HLOS, ICULOS Cost
Berlauk 1991 Hospital HLOS, ICULOS Cost
Bonazzi 2002 Hospital HLOS None
Boyd 1993 28-day HLOS, ICULOS Reported separately
Conway 2002 Hospital HLOS, ICULOS None
Gan 2002 Hospital HLOS None
Jerez 2001 Hospital ICULOS None
Lobo 2000 28-day, 60-day HLOS, ICULOS None
McKendry 2004 Hospital HLOS, ICULOS None
Mythen 1995 Hospital HLOS, ICULOS Reported separately
Noblett 2006 Hospital HLOS, ICULOS None
Pearse 2006 Hospital, 28 day, 60 day HLOS, ICUOS None
Polonen 2000 28-day, 6 month, 12 month HLOS, ICULOS None
Sandham 2003 Hospital, 6 month, 12 month HLOS None
Shoemaker 1988 Hospital HLOS, ICULOS Cost
Sinclair 1997 Hospital HLOS None
Ueno 1998 Hospital None None
Valentine 1998 Hospital HLOS, ICULOS None
Venn 2002 Hospital HLOS None
Wakeling 2005 Hospital, 6 month HLOS None
Wilson 1999 Hospital HLOS, ICULOS Reported separately
Ziegler 1997 Hospital ICULOS None
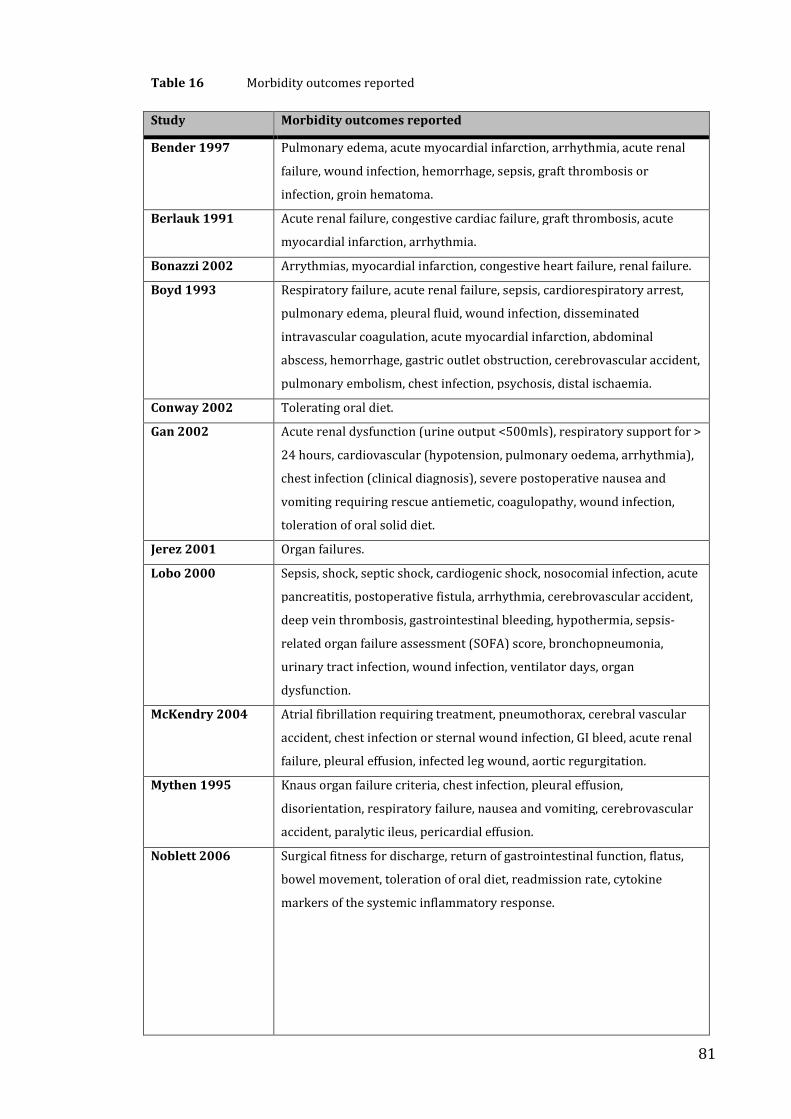
81
Table 16 Morbidity outcomes reported
Study Morbidity outcomes reported
Bender 1997 Pulmonary edema, acute myocardial infarction, arrhythmia, acute renal
failure, wound infection, hemorrhage, sepsis, graft thrombosis or
infection, groin hematoma.
Berlauk 1991 Acute renal failure, congestive cardiac failure, graft thrombosis, acute
myocardial infarction, arrhythmia.
Bonazzi 2002 Arrythmias, myocardial infarction, congestive heart failure, renal failure.
Boyd 1993 Respiratory failure, acute renal failure, sepsis, cardiorespiratory arrest,
pulmonary edema, pleural fluid, wound infection, disseminated
intravascular coagulation, acute myocardial infarction, abdominal
abscess, hemorrhage, gastric outlet obstruction, cerebrovascular accident,
pulmonary embolism, chest infection, psychosis, distal ischaemia.
Conway 2002 Tolerating oral diet.
Gan 2002 Acute renal dysfunction (urine output <500mls), respiratory support for >
24 hours, cardiovascular (hypotension, pulmonary oedema, arrhythmia),
chest infection (clinical diagnosis), severe postoperative nausea and
vomiting requiring rescue antiemetic, coagulopathy, wound infection,
toleration of oral solid diet.
Jerez 2001 Organ failures.
Lobo 2000 Sepsis, shock, septic shock, cardiogenic shock, nosocomial infection, acute
pancreatitis, postoperative fistula, arrhythmia, cerebrovascular accident,
deep vein thrombosis, gastrointestinal bleeding, hypothermia, sepsis-
related organ failure assessment (SOFA) score, bronchopneumonia,
urinary tract infection, wound infection, ventilator days, organ
dysfunction.
McKendry 2004 Atrial fibrillation requiring treatment, pneumothorax, cerebral vascular
accident, chest infection or sternal wound infection, GI bleed, acute renal
failure, pleural effusion, infected leg wound, aortic regurgitation.
Mythen 1995 Knaus organ failure criteria, chest infection, pleural effusion,
disorientation, respiratory failure, nausea and vomiting, cerebrovascular
accident, paralytic ileus, pericardial effusion.
Noblett 2006 Surgical fitness for discharge, return of gastrointestinal function, flatus,
bowel movement, toleration of oral diet, readmission rate, cytokine
markers of the systemic inflammatory response.
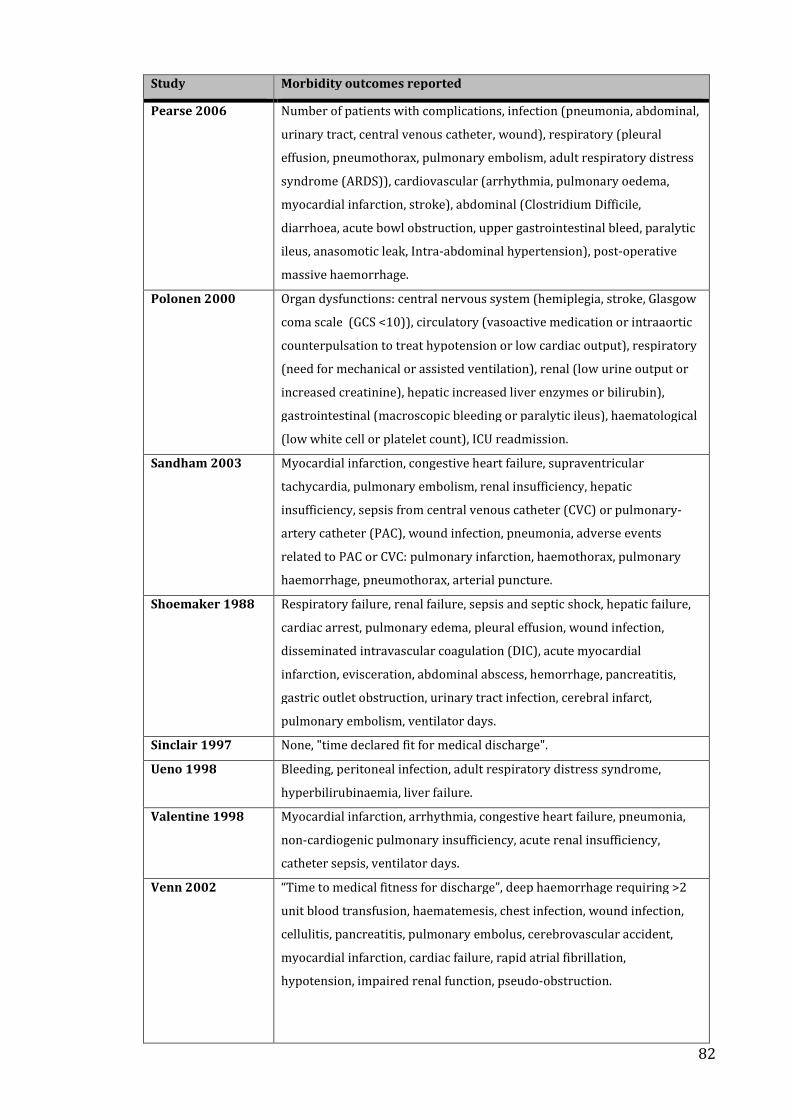
82
Study Morbidity outcomes reported
Pearse 2006 Number of patients with complications, infection (pneumonia, abdominal,
urinary tract, central venous catheter, wound), respiratory (pleural
effusion, pneumothorax, pulmonary embolism, adult respiratory distress
syndrome (ARDS)), cardiovascular (arrhythmia, pulmonary oedema,
myocardial infarction, stroke), abdominal (Clostridium Difficile,
diarrhoea, acute bowl obstruction, upper gastrointestinal bleed, paralytic
ileus, anasomotic leak, Intra-abdominal hypertension), post-operative
massive haemorrhage.
Polonen 2000 Organ dysfunctions: central nervous system (hemiplegia, stroke, Glasgow
coma scale (GCS <10)), circulatory (vasoactive medication or intraaortic
counterpulsation to treat hypotension or low cardiac output), respiratory
(need for mechanical or assisted ventilation), renal (low urine output or
increased creatinine), hepatic increased liver enzymes or bilirubin),
gastrointestinal (macroscopic bleeding or paralytic ileus), haematological
(low white cell or platelet count), ICU readmission.
Sandham 2003 Myocardial infarction, congestive heart failure, supraventricular
tachycardia, pulmonary embolism, renal insufficiency, hepatic
insufficiency, sepsis from central venous catheter (CVC) or pulmonary-
artery catheter (PAC), wound infection, pneumonia, adverse events
related to PAC or CVC: pulmonary infarction, haemothorax, pulmonary
haemorrhage, pneumothorax, arterial puncture.
Shoemaker 1988 Respiratory failure, renal failure, sepsis and septic shock, hepatic failure,
cardiac arrest, pulmonary edema, pleural effusion, wound infection,
disseminated intravascular coagulation (DIC), acute myocardial
infarction, evisceration, abdominal abscess, hemorrhage, pancreatitis,
gastric outlet obstruction, urinary tract infection, cerebral infarct,
pulmonary embolism, ventilator days.
Sinclair 1997 None, "time declared fit for medical discharge".
Ueno 1998 Bleeding, peritoneal infection, adult respiratory distress syndrome,
hyperbilirubinaemia, liver failure.
Valentine 1998 Myocardial infarction, arrhythmia, congestive heart failure, pneumonia,
non-cardiogenic pulmonary insufficiency, acute renal insufficiency,
catheter sepsis, ventilator days.
Venn 2002 “Time to medical fitness for discharge”, deep haemorrhage requiring >2
unit blood transfusion, haematemesis, chest infection, wound infection,
cellulitis, pancreatitis, pulmonary embolus, cerebrovascular accident,
myocardial infarction, cardiac failure, rapid atrial fibrillation,
hypotension, impaired renal function, pseudo-obstruction.
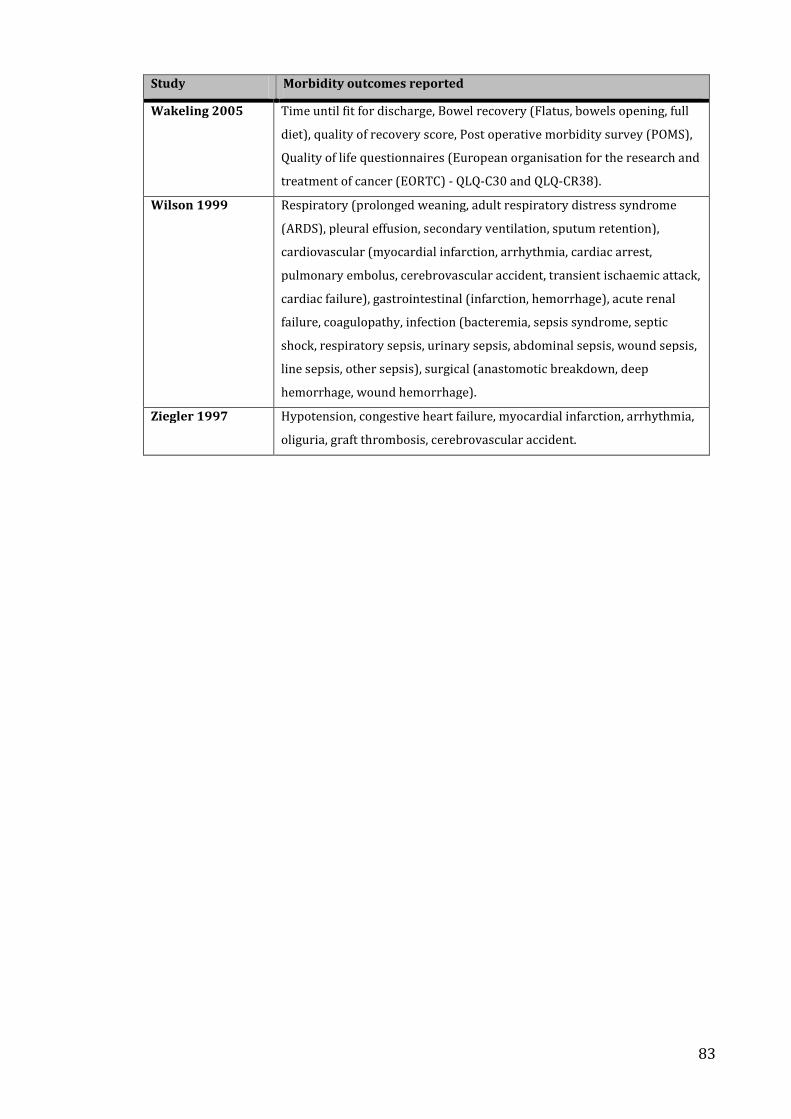
83
Study Morbidity outcomes reported
Wakeling 2005 Time until fit for discharge, Bowel recovery (Flatus, bowels opening, full
diet), quality of recovery score, Post operative morbidity survey (POMS),
Quality of life questionnaires (European organisation for the research and
treatment of cancer (EORTC) - QLQ-C30 and QLQ-CR38).
Wilson 1999 Respiratory (prolonged weaning, adult respiratory distress syndrome
(ARDS), pleural effusion, secondary ventilation, sputum retention),
cardiovascular (myocardial infarction, arrhythmia, cardiac arrest,
pulmonary embolus, cerebrovascular accident, transient ischaemic attack,
cardiac failure), gastrointestinal (infarction, hemorrhage), acute renal
failure, coagulopathy, infection (bacteremia, sepsis syndrome, septic
shock, respiratory sepsis, urinary sepsis, abdominal sepsis, wound sepsis,
line sepsis, other sepsis), surgical (anastomotic breakdown, deep
hemorrhage, wound hemorrhage).
Ziegler 1997 Hypotension, congestive heart failure, myocardial infarction, arrhythmia,
oliguria, graft thrombosis, cerebrovascular accident.
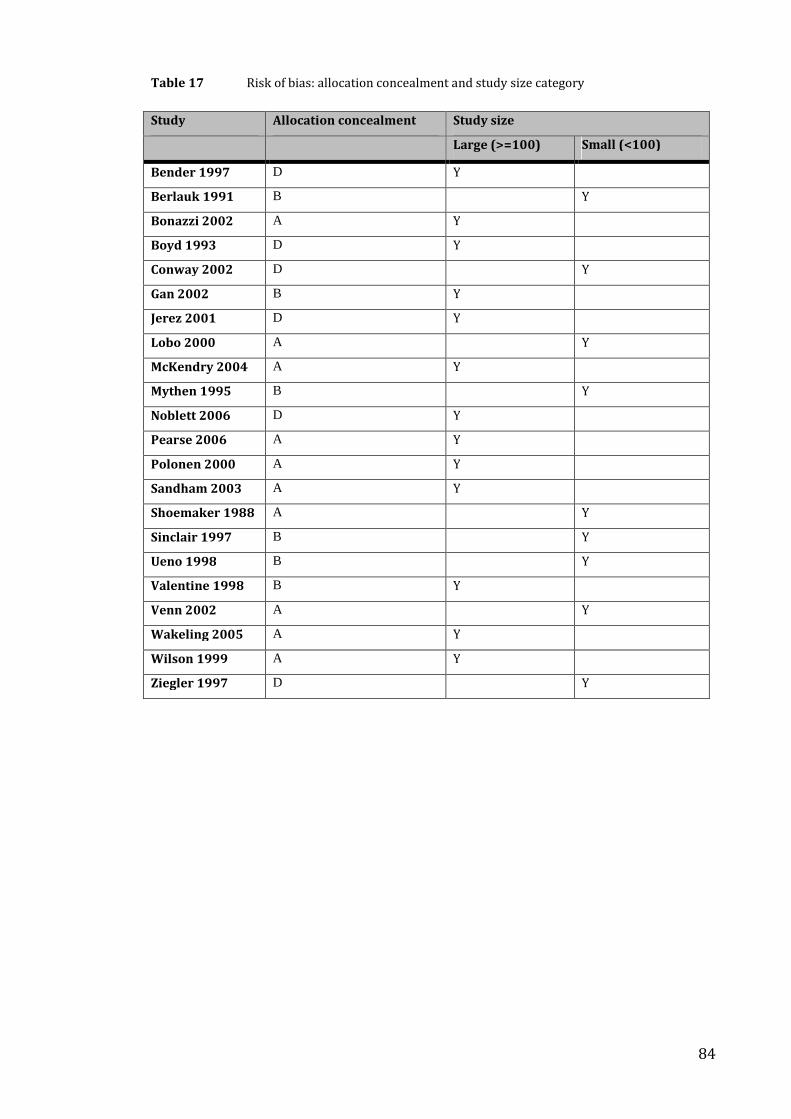
84
Table 17 Risk of bias: allocation concealment and study size category
Study Allocation concealment Study size
Large (>=100) Small (<100)
Bender 1997 D Y
Berlauk 1991 B Y
Bonazzi 2002 A Y
Boyd 1993 D Y
Conway 2002 D Y
Gan 2002 B Y
Jerez 2001 D Y
Lobo 2000 A Y
McKendry 2004 A Y
Mythen 1995 B Y
Noblett 2006 D Y
Pearse 2006 A Y
Polonen 2000 A Y
Sandham 2003 A Y
Shoemaker 1988 A Y
Sinclair 1997 B Y
Ueno 1998 B Y
Valentine 1998 B Y
Venn 2002 A Y
Wakeling 2005 A Y
Wilson 1999 A Y
Ziegler 1997 D Y
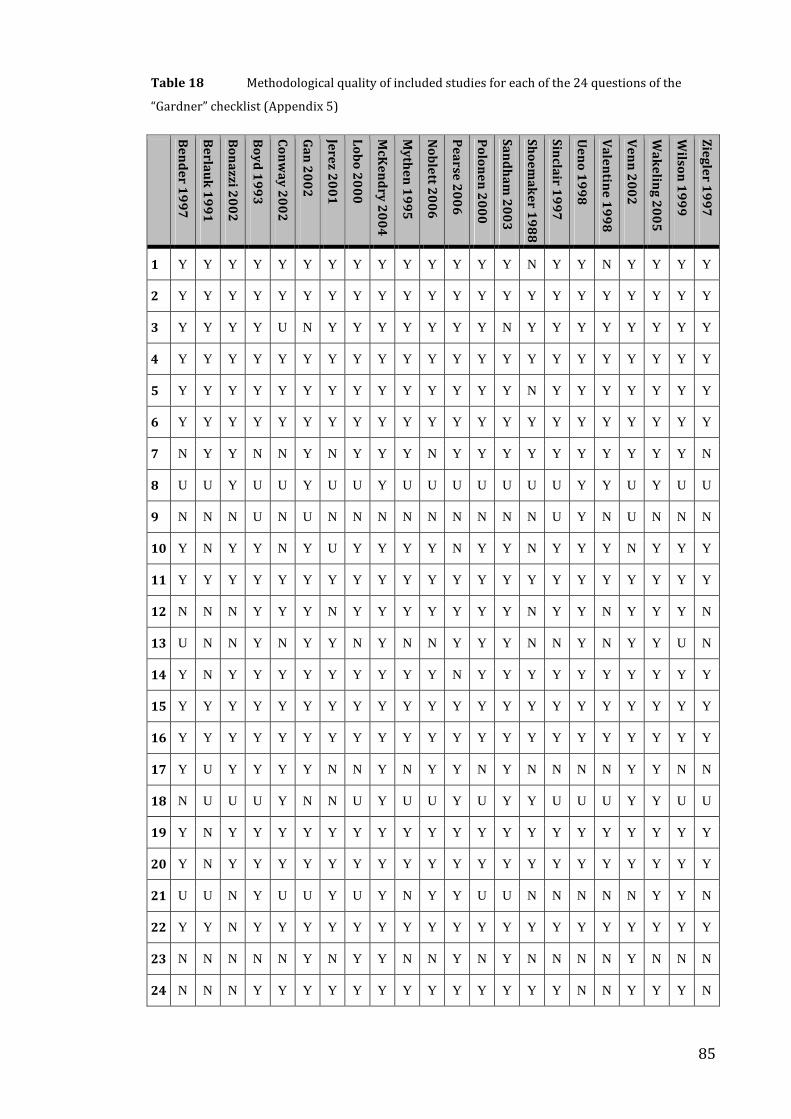
85
Table 18 Methodological quality of included studies for each of the 24 questions of the
“Gardner” checklist (Appendix 5)
Be
nd
er
19
97
Be
rlau
k1
99
1
Bo
na
zzi2
00
2
Bo
yd
19
93
Co
nw
ay
20
02
Ga
n2
00
2
Jere
z2
00
1
Lo
bo
20
00
McK
en
dry
20
04
My
the
n1
99
5
No
ble
tt2
00
6
Pe
arse
20
06
Po
lon
en
20
00
Sa
nd
ha
m2
00
3
Sh
oe
ma
ke
r1
98
8
Sin
clair
19
97
Ue
no
19
98
Va
len
tine
19
98
Ve
nn
20
02
Wa
ke
ling
20
05
Wilso
n1
99
9
Zie
gle
r1
99
7
1 Y Y Y Y Y Y Y Y Y Y Y Y Y Y N Y Y N Y Y Y Y
2 Y Y Y Y Y Y Y Y Y Y Y Y Y Y Y Y Y Y Y Y Y Y
3 Y Y Y Y U N Y Y Y Y Y Y Y N Y Y Y Y Y Y Y Y
4 Y Y Y Y Y Y Y Y Y Y Y Y Y Y Y Y Y Y Y Y Y Y
5 Y Y Y Y Y Y Y Y Y Y Y Y Y Y N Y Y Y Y Y Y Y
6 Y Y Y Y Y Y Y Y Y Y Y Y Y Y Y Y Y Y Y Y Y Y
7 N Y Y N N Y N Y Y Y N Y Y Y Y Y Y Y Y Y Y N
8 U U Y U U Y U U Y U U U U U U U Y Y U Y U U
9 N N N U N U N N N N N N N N N U Y N U N N N
10 Y N Y Y N Y U Y Y Y Y N Y Y N Y Y Y N Y Y Y
11 Y Y Y Y Y Y Y Y Y Y Y Y Y Y Y Y Y Y Y Y Y Y
12 N N N Y Y Y N Y Y Y Y Y Y Y N Y Y N Y Y Y N
13 U N N Y N Y Y N Y N N Y Y Y N N Y N Y Y U N
14 Y N Y Y Y Y Y Y Y Y Y N Y Y Y Y Y Y Y Y Y Y
15 Y Y Y Y Y Y Y Y Y Y Y Y Y Y Y Y Y Y Y Y Y Y
16 Y Y Y Y Y Y Y Y Y Y Y Y Y Y Y Y Y Y Y Y Y Y
17 Y U Y Y Y Y N N Y N Y Y N Y N N N N Y Y N N
18 N U U U Y N N U Y U U Y U Y Y U U U Y Y U U
19 Y N Y Y Y Y Y Y Y Y Y Y Y Y Y Y Y Y Y Y Y Y
20 Y N Y Y Y Y Y Y Y Y Y Y Y Y Y Y Y Y Y Y Y Y
21 U U N Y U U Y U Y N Y Y U U N N N N N Y Y N
22 Y Y N Y Y Y Y Y Y Y Y Y Y Y Y Y Y Y Y Y Y Y
23 N N N N N Y N Y Y N N Y N Y N N N N Y N N N
24 N N N Y Y Y Y Y Y Y Y Y Y Y Y Y N N Y Y Y N
86
2.3.4 Data Synthesis
2.3.4.1 Mortality
All studies reported mortality data. A number of different mortality definitions
were used: hospital mortality (19/22), 28 day (4/22), 60 day (2/22), 6 month
(3/22), 12 month (2/22) (Table 15). Five studies reported more than one
definition.
Using data from the longest reported follow-up, the overall mortality was
265/2275 (11.6%) in the control group and 216/2271 (9.5%) in the treatment
group (Peto OR 0.82, 95% CI 0.67-0.99, p = 0.04, NNT 47) (Figure 1).
Post-hoc analysis of pooled hospital and 28-day data mortality was 178/2275
(7.8%) in the control group and 128/2271 (5.6%) in the treatment group (Peto
OR, 0.74, 95% CI 0.58,0.93, p = 0.04, NNT 46) (Figure 2).
Sensitivity analyses for the primary outcome variable are reported in Table 19.
The primary outcome was consistent when analysed using random-effects models
(Mantel-Haensel and Inverse Variance) but this outcome difference was not
statistically significant when fixed-effects models were used (Mantel-Haensel and
Inverse Variance). Excluding smaller studies (n>100 versus n<100) or studies of
lower quality (allocation concealment A versus B to D) resulted in loss of statistical
significance for the primary outcome (mortality longest reported follow-up, Peto
OR).
2.3.4.2 Morbidity
The seven categories of morbidity reported were analysed using the definitions
used by the investigators in the primary studies. No two papers used the same list
of morbidities/complications following surgery (Table 16). In many cases no
specific criteria were listed for definition of named morbidities. Only five studies
reported using systematic criteria for classifying postoperative morbidity. One
study reported sepsis-related organ failure assessment (SOFA) scores 272, one
study reported Knaus organ failure criteria 273, and one study reported using a
validated quality of recovery score 171 along with the POMS 172 and quality of life
questionnaires (European organisation for the research and treatment of cancer
87
(EORTC) - QLQ-C30 and QLQ-CR38) 274-276. One other study used a modified
version of the POMS using different diagnostic criteria for each domain.
When studies reported specific diagnoses (e.g. myocardial infarction, respiratory
failure), diagnostic criteria were infrequently reported. Where criteria were
reported they were seldom consistent between studies. For example, diagnostic
criteria for renal failure/impairment are reported in Table 20 (SOFA renal failure
criteria are reported in Table 21). Twelve out of twenty-two studies used specific
criteria, five of which were referenced. However one of the studies that provided a
reference used a single criterion modified from the criteria described in the
reference. Therefore no two studies used the same criteria for renal
failure/impairment.
Data on renal impairment (sixteen studies, 3800 patients), arrhythmia (ten
studies, 3728 patients), respiratory failure/ARDS (adult respiratory distress
syndrome)(eight studies, 759 patients), infections (thirteen studies, 3628 patients)
myocardial infarction (10 studies, 2936 patients), congestive heart
failure/pulmonary oedema (11 studies, 2989 patients), and venous thrombosis (5
studies, 2385 patients) were available either in the published reports or after
contacting authors.
For those studies where data were available, there was a reduction, in the
treatment group, in the incidence of renal impairment (Peto OR 0.65, 95% CI 0.49-
0.85, P=0.002, NNT 37)(Figure 3) respiratory failure/ARDS (Peto OR 0.39, 95% CI
0.22-0.72, P=0.002, NNT 15)(Figure 4), and infection (Peto OR 0.66, 95% CI 0.54-
0.78, P<0.0001, NNT 21)(Figure 5). Arrhythmia, myocardial infarction, congestive
heart failure/pulmonary oedema and venous thrombosis rates were similar for the
two groups.
Pooling of morbidities was not consistent between studies and some studies
summarized morbidity/complications using more than one method: number of
patients with complications (14 studies, 1360 patients), number of complications
per patient (3 studies, 497 patients) and total number of complications (19 studies,
2122 patients) were reported. For those studies where data were available, the
88
number of patients with complications was reduced in the treatment group (Peto
OR 0.59, 95% CI 0.45-0.76, P<0.0001, NNT 12)(Figure 6). There was no difference
in the number of complications per patient between groups. Data for total
complications could not be pooled.
2.3.4.3 Health Status
Only one study reported health status 174. This study used quality of life
questionnaires EORTC QLQ-C30 and QLQ-CR38 completed 4–6 weeks after
surgery and showed no differences between groups.
2.3.4.4 Resource use
Length of hospital stay post-surgery was significantly reduced in the treatment
group (WMD -1.79 days, 95%CI -2.51 to -01.07, P<0.00001, 16 studies,
n=1916)(Figure 7), but there was no difference in length of critical care stay (WMD
-0.22 days, 95%CI -0.03 to 0.20, P=0.30, 8 studies, n=1382)(Figure 8). Three
studies reported cost data (US dollars) in the original report. Two of these showed
a non-significant increase on cost in the treatment group and one showed a
reduction in cost in the treatment group but did not conduct a statistical analysis
of this result. Three other studies (two reported UK pounds, one reported Euros)
reported cost data in separate publications from the original report. Two of these
reported significant reductions in cost in the treatment groups. The third reported
cost data only on a subgroup of patients included in the trial and these data were
not analysed by treatment groups. Only one study reported means and standard
deviations for cost data. In view of the variety of currencies and statistical
descriptors no attempt was made to pool this data.
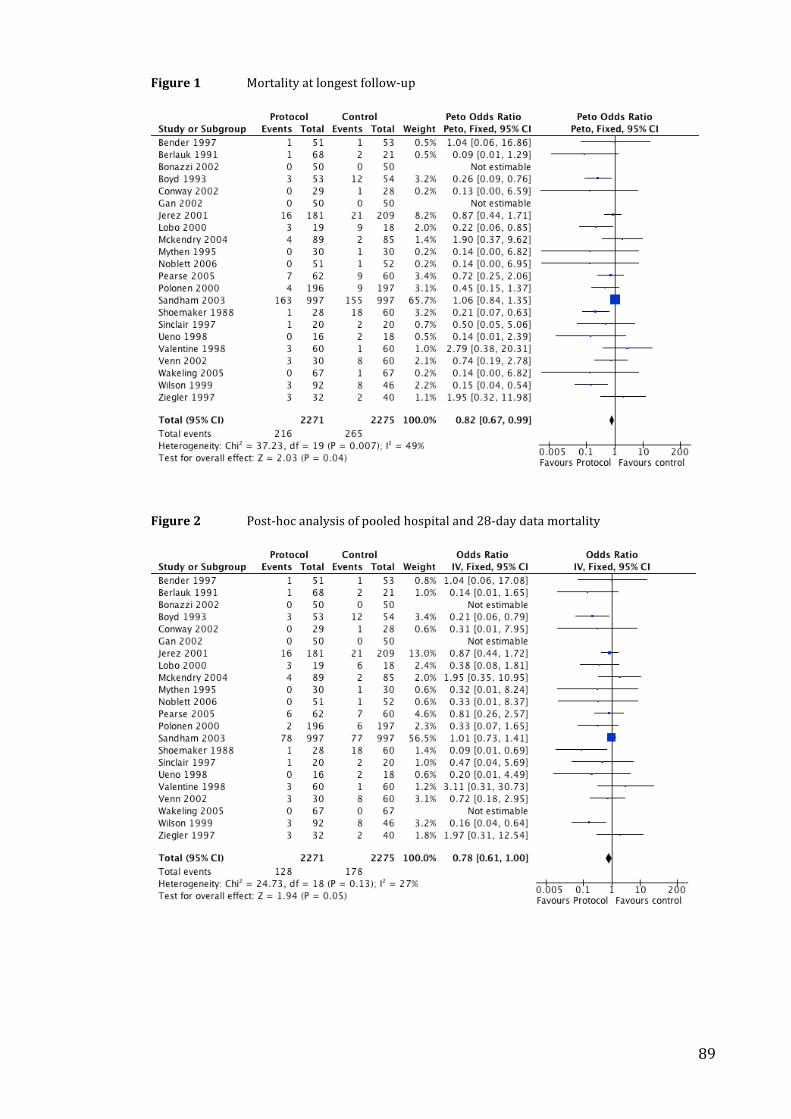
89
Figure 1 Mortality at longest follow-up
Figure 2 Post-hoc analysis of pooled hospital and 28-day data mortality
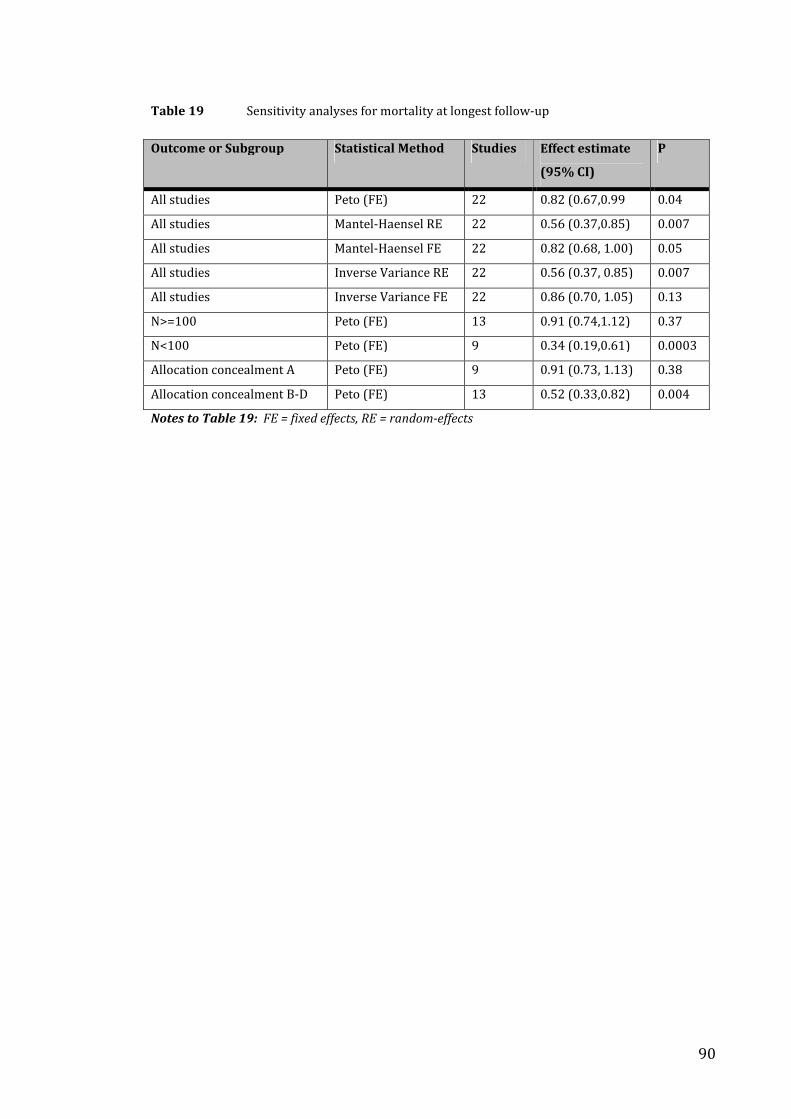
90
Table 19 Sensitivity analyses for mortality at longest follow-up
Outcome or Subgroup Statistical Method Studies Effect estimate
(95% CI)
P
All studies Peto (FE) 22 0.82 (0.67,0.99 0.04
All studies Mantel-Haensel RE 22 0.56 (0.37,0.85) 0.007
All studies Mantel-Haensel FE 22 0.82 (0.68, 1.00) 0.05
All studies Inverse Variance RE 22 0.56 (0.37, 0.85) 0.007
All studies Inverse Variance FE 22 0.86 (0.70, 1.05) 0.13
N>=100 Peto (FE) 13 0.91 (0.74,1.12) 0.37
N<100 Peto (FE) 9 0.34 (0.19,0.61) 0.0003
Allocation concealment A Peto (FE) 9 0.91 (0.73, 1.13) 0.38
Allocation concealment B-D Peto (FE) 13 0.52 (0.33,0.82) 0.004
Notes to Table 19: FE = fixed effects, RE = random-effects
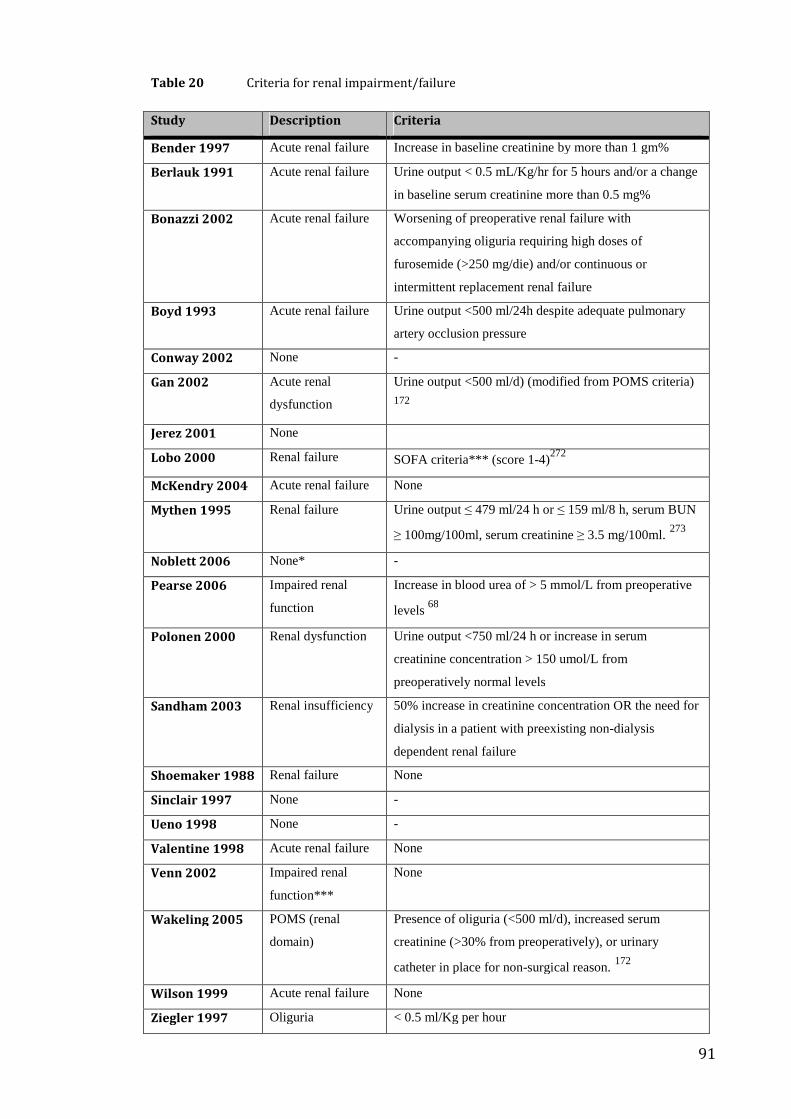
91
Table 20 Criteria for renal impairment/failure
Study Description Criteria
Bender 1997 Acute renal failure Increase in baseline creatinine by more than 1 gm%
Berlauk 1991 Acute renal failure Urine output < 0.5 mL/Kg/hr for 5 hours and/or a change
in baseline serum creatinine more than 0.5 mg%
Bonazzi 2002 Acute renal failure Worsening of preoperative renal failure with
accompanying oliguria requiring high doses of
furosemide (>250 mg/die) and/or continuous or
intermittent replacement renal failure
Boyd 1993 Acute renal failure Urine output <500 ml/24h despite adequate pulmonary
artery occlusion pressure
Conway 2002 None -
Gan 2002 Acute renal
dysfunction
Urine output <500 ml/d) (modified from POMS criteria)
172
Jerez 2001 None
Lobo 2000 Renal failure SOFA criteria*** (score 1-4)272
McKendry 2004 Acute renal failure None
Mythen 1995 Renal failure Urine output ≤ 479 ml/24 h or ≤ 159 ml/8 h, serum BUN
≥ 100mg/100ml, serum creatinine ≥ 3.5 mg/100ml.273
Noblett 2006 None* -
Pearse 2006 Impaired renal
function
Increase in blood urea of > 5 mmol/L from preoperative
levels68
Polonen 2000 Renal dysfunction Urine output <750 ml/24 h or increase in serum
creatinine concentration > 150 umol/L from
preoperatively normal levels
Sandham 2003 Renal insufficiency 50% increase in creatinine concentration OR the need for
dialysis in a patient with preexisting non-dialysis
dependent renal failure
Shoemaker 1988 Renal failure None
Sinclair 1997 None -
Ueno 1998 None -
Valentine 1998 Acute renal failure None
Venn 2002 Impaired renal
function***
None
Wakeling 2005 POMS (renal
domain)
Presence of oliguria (<500 ml/d), increased serum
creatinine (>30% from preoperatively), or urinary
catheter in place for non-surgical reason.172
Wilson 1999 Acute renal failure None
Ziegler 1997 Oliguria < 0.5 ml/Kg per hour
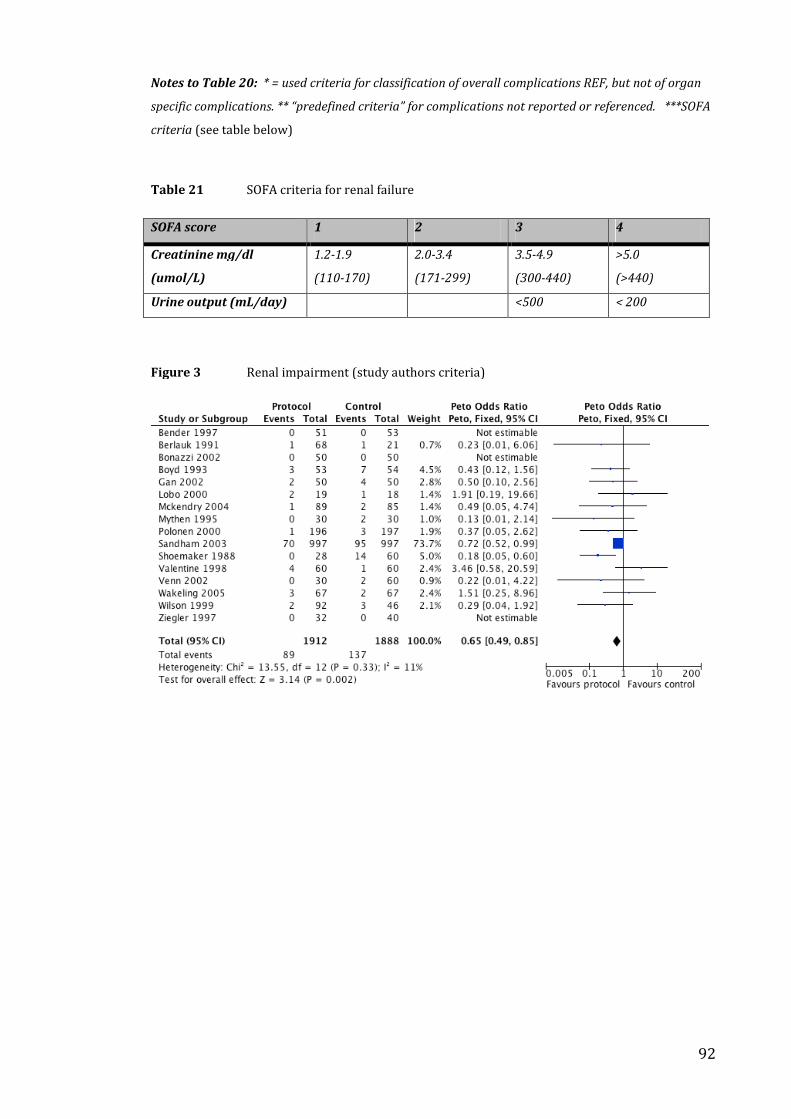
92
Notes to Table 20: * = used criteria for classification of overall complications REF, but not of organ
specific complications. ** “predefined criteria” for complications not reported or referenced. ***SOFA
criteria (see table below)
Table 21 SOFA criteria for renal failure
SOFA score 1 2 3 4
Creatinine mg/dl
(umol/L)
1.2-1.9
(110-170)
2.0-3.4
(171-299)
3.5-4.9
(300-440)
>5.0
(>440)
Urine output (mL/day) <500 < 200
Figure 3 Renal impairment (study authors criteria)
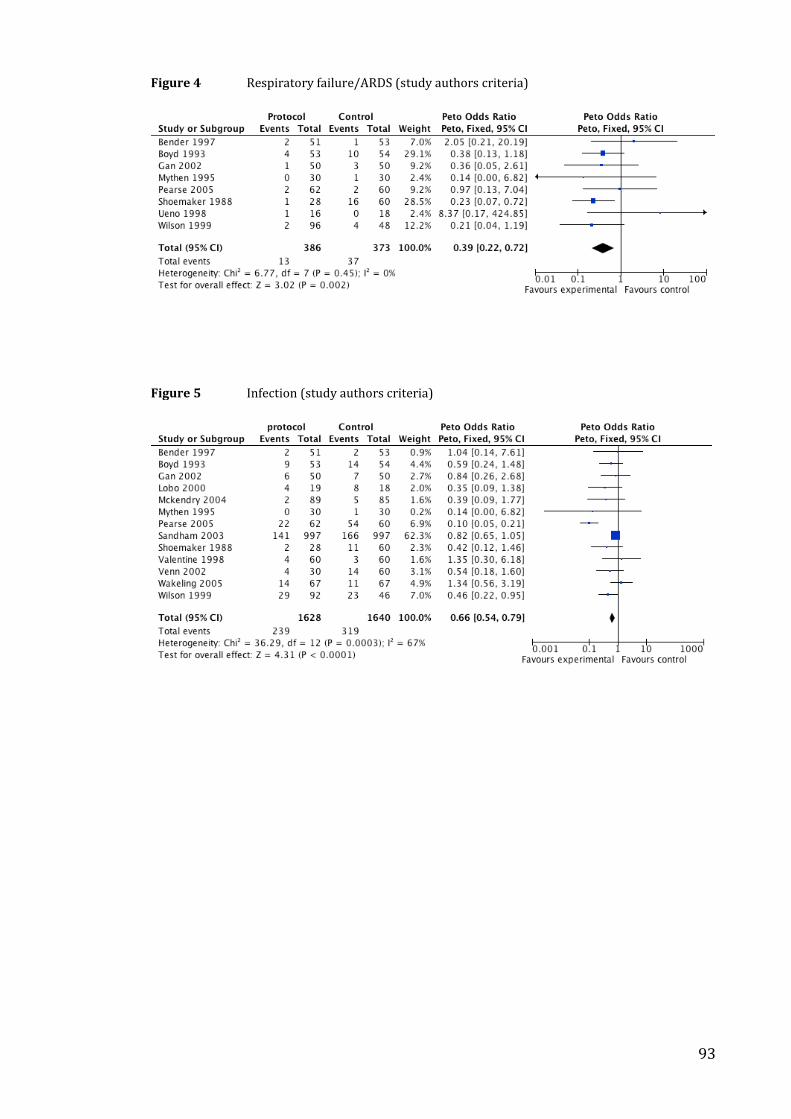
93
Figure 4 Respiratory failure/ARDS (study authors criteria)
Figure 5 Infection (study authors criteria)
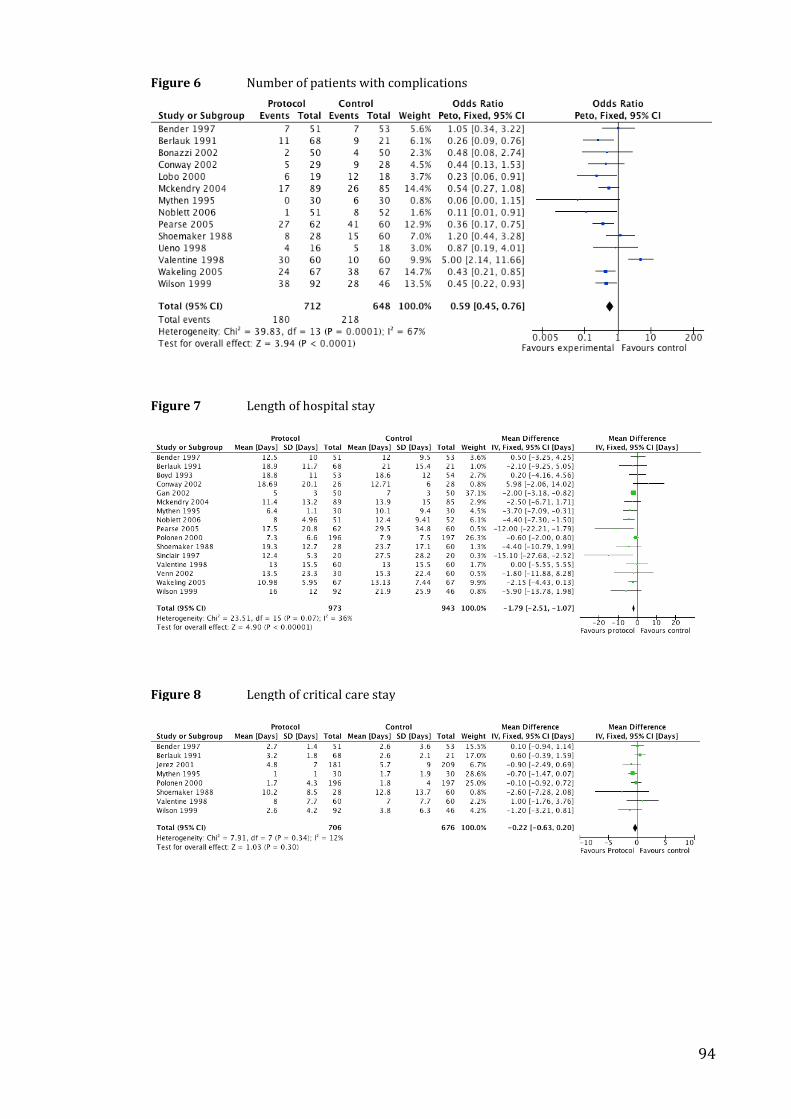
94
Figure 6 Number of patients with complications
Figure 7 Length of hospital stay
Figure 8 Length of critical care stay
95
2.3.4.5 Stratified meta-analysis
The intervention was commenced in the preoperative period in nine studies, in the
intraoperative period in nine studies and in the postoperative period in six studies.
In one study 257 patients were randomized to two intervention groups (a
preoperative and an intraoperative group) with a shared control group. In another
study 93 the intervention was initiated either preoperatively or postoperatively
depending on when the patients came to the attention of the investigators and
were randomized. There was no evidence that this had any effect on the chances
of being recruited into the study and therefore we did not consider that this had
potential to confound the randomization process.
Mortality was reduced in the intraoperative group (Peto OR 0.32, 95%CI 0.15 to
0.69, P=0.004, 9 studies, n=665). Mortality was not reduced in the preoperative
(Peto OR 0.97, 95%CI 0.72 to 1.13, P=0.37, 9 studies, n=2763) or postoperative
(Peto OR 0.71, 95%CI 0.45 to 1.14, P=0.16, 6 studies, n=1139)(Figure 9) groups.
The intervention involved fluids alone in seven studies and fluids in combination
with vasoactive drugs in 15 studies. Mortality was not reduced for fluids alone
(Peto OR 0.44, 95%CI 0.16 to 1.19, P=0.11, 7 studies, n=584) or fluids in
combination with vasoactive drugs (Peto OR 0.84, 95%CI 0.69 to 1.02, p=0.08, 15
studies, n=3962)(Figure 10).
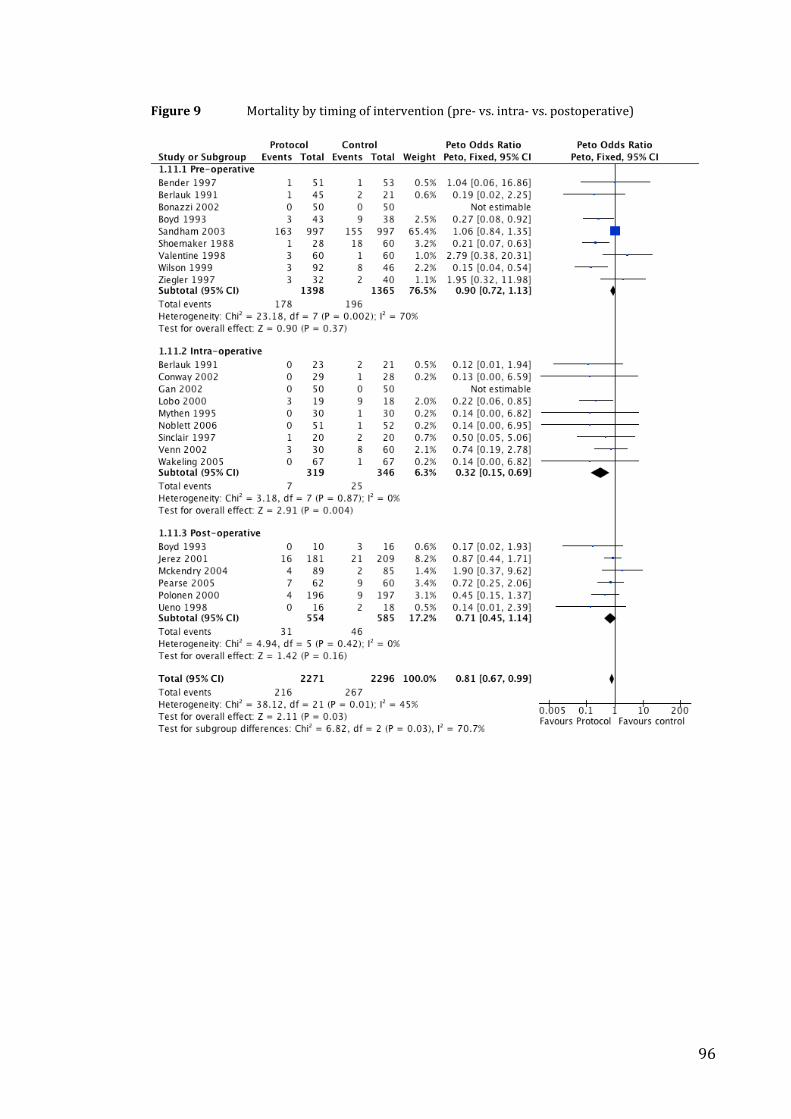
96
Figure 9 Mortality by timing of intervention (pre- vs. intra- vs. postoperative)
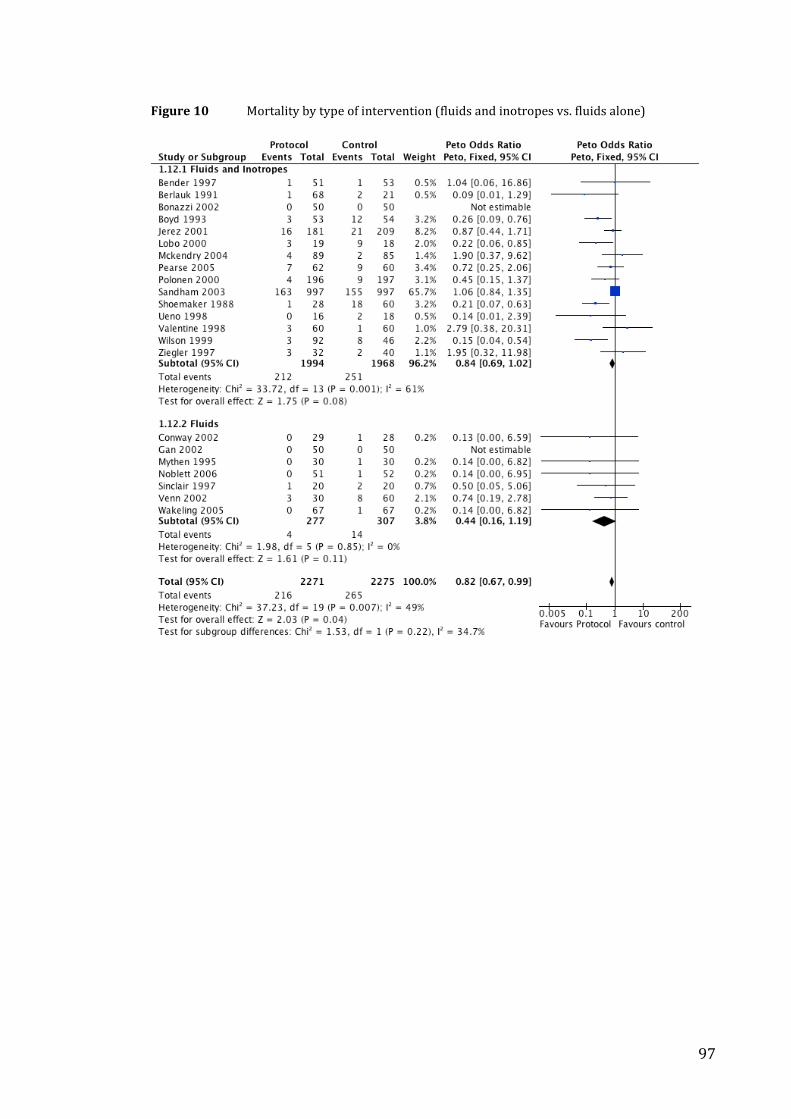
97
Figure 10 Mortality by type of intervention (fluids and inotropes vs. fluids alone)
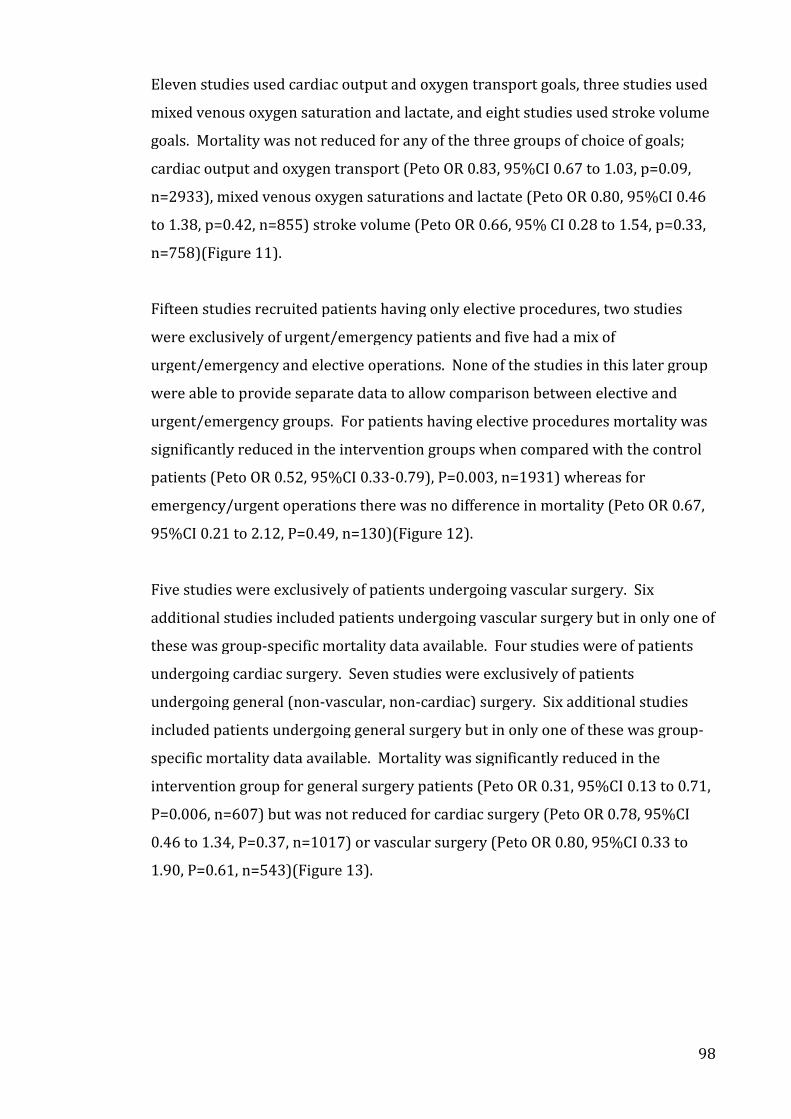
98
Eleven studies used cardiac output and oxygen transport goals, three studies used
mixed venous oxygen saturation and lactate, and eight studies used stroke volume
goals. Mortality was not reduced for any of the three groups of choice of goals;
cardiac output and oxygen transport (Peto OR 0.83, 95%CI 0.67 to 1.03, p=0.09,
n=2933), mixed venous oxygen saturations and lactate (Peto OR 0.80, 95%CI 0.46
to 1.38, p=0.42, n=855) stroke volume (Peto OR 0.66, 95% CI 0.28 to 1.54, p=0.33,
n=758)(Figure 11).
Fifteen studies recruited patients having only elective procedures, two studies
were exclusively of urgent/emergency patients and five had a mix of
urgent/emergency and elective operations. None of the studies in this later group
were able to provide separate data to allow comparison between elective and
urgent/emergency groups. For patients having elective procedures mortality was
significantly reduced in the intervention groups when compared with the control
patients (Peto OR 0.52, 95%CI 0.33-0.79), P=0.003, n=1931) whereas for
emergency/urgent operations there was no difference in mortality (Peto OR 0.67,
95%CI 0.21 to 2.12, P=0.49, n=130)(Figure 12).
Five studies were exclusively of patients undergoing vascular surgery. Six
additional studies included patients undergoing vascular surgery but in only one of
these was group-specific mortality data available. Four studies were of patients
undergoing cardiac surgery. Seven studies were exclusively of patients
undergoing general (non-vascular, non-cardiac) surgery. Six additional studies
included patients undergoing general surgery but in only one of these was group-
specific mortality data available. Mortality was significantly reduced in the
intervention group for general surgery patients (Peto OR 0.31, 95%CI 0.13 to 0.71,
P=0.006, n=607) but was not reduced for cardiac surgery (Peto OR 0.78, 95%CI
0.46 to 1.34, P=0.37, n=1017) or vascular surgery (Peto OR 0.80, 95%CI 0.33 to
1.90, P=0.61, n=543)(Figure 13).
99
Figure 11 Mortality by goals of intervention (CO, DO2 vs. Lactate, SvO2 vs. SV)
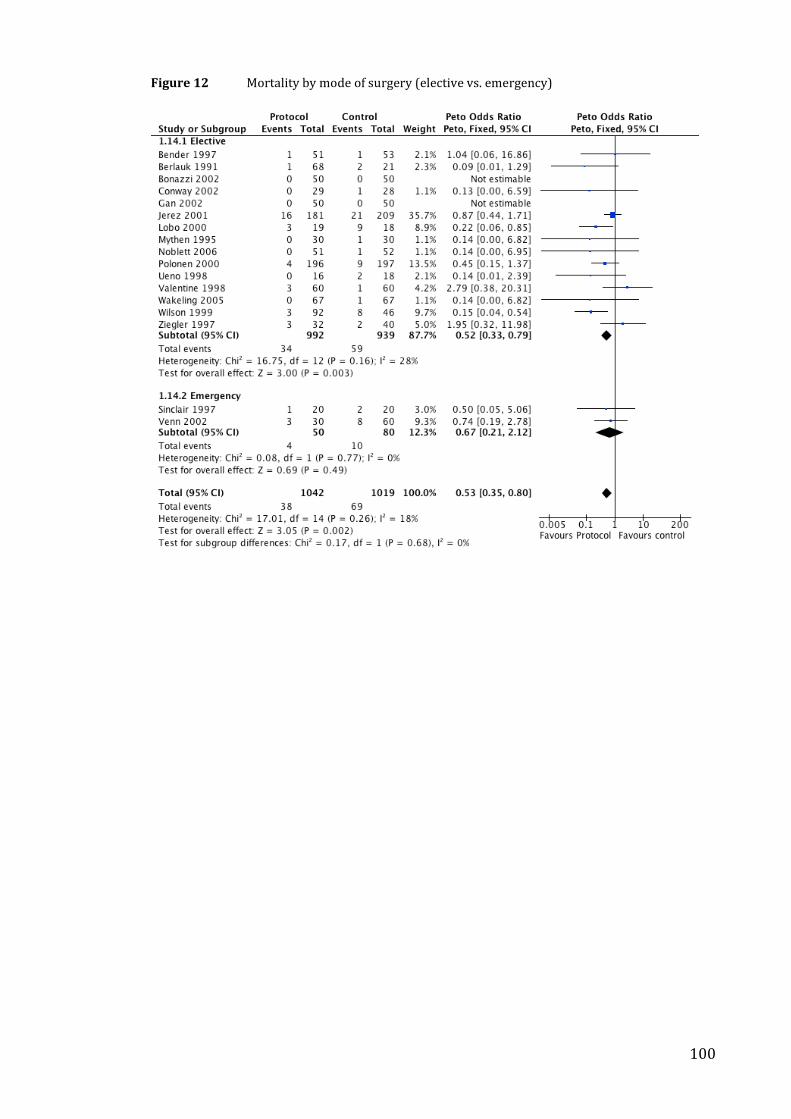
100
Figure 12 Mortality by mode of surgery (elective vs. emergency)
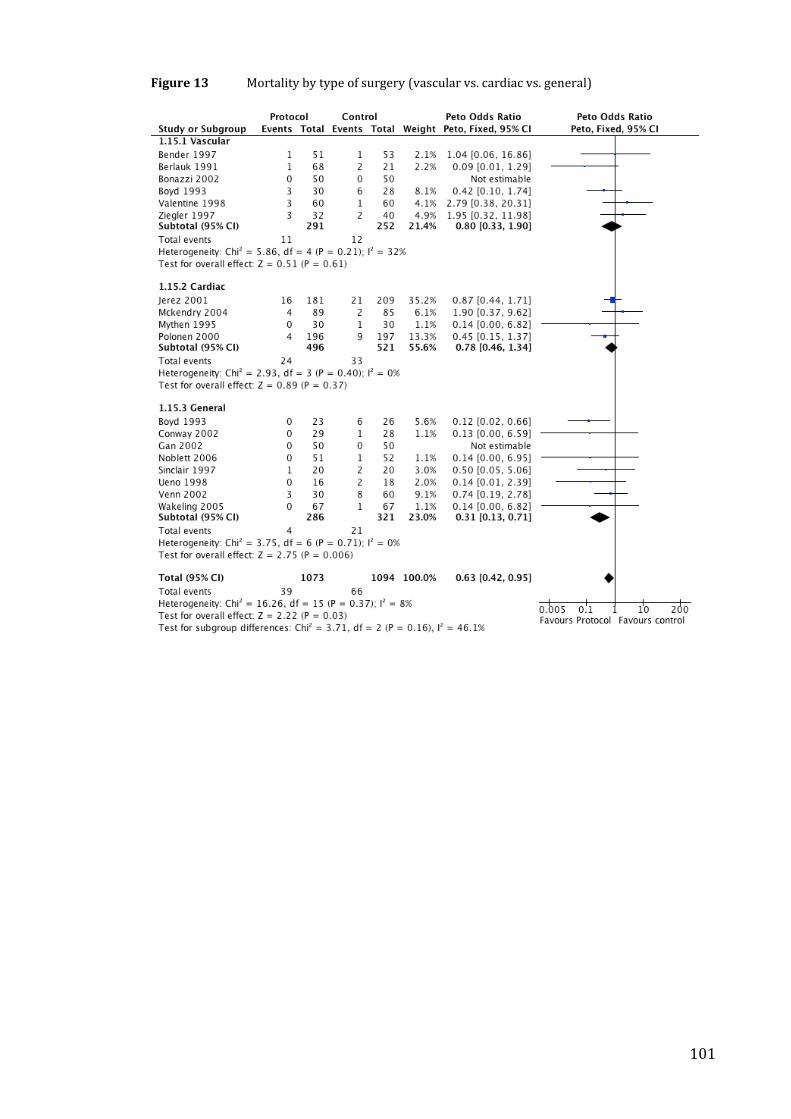
101
Figure 13 Mortality by type of surgery (vascular vs. cardiac vs. general)
102
2.4 Discussion
2.4.1 Summary of findings
The key finding of this study is that perioperative administration of fluids and/or
vasoactive drugs targeted to increase global blood flow defined by explicit
measured goals significantly reduces surgical mortality (using mortality data from
longest available follow-up, Peto OR). This result is sensitive to withdrawal of
smaller studies or studies of poorer methodological quality, where significance is
lost. When this result was tested for robustness using alternative analyses, the
result was statistically significant when random-effects models (Mantel-Haensel
and Inverse Variance) were used but not when fixed-effect models (Mantel-
Haensel and Inverse Variance) were used. Analyses using hospital and/or 28-day
mortality (fixed- and random- effects models - post-hoc analyses) showed a
statistically significant reduction in mortality.
Morbidity recording was highly variable but the limited available data showed a
reduction in the number of patients with complications as well as a reduction in
renal impairment, respiratory failure and infective complications, with no effect on
other types of morbidity.
The available data showed a significant reduction in hospital length of stay but no
difference in critical care stay in the intervention group. There was insufficient
data to conduct a meta-analysis of quality of life or cost.
A stratified meta-analysis to address secondary hypotheses, determined a priori,
suggested that mortality was reduced in the intervention group when the
intervention was commenced intra-operatively, for elective patients and for
patients undergoing general (major abdominal, urology, gynaecology, orthopaedic)
surgery.
2.4.2 Strengths and weaknesses of this study
This study pools data from 22 studies (4546 patients) identified following a
detailed systematic search of the literature. Study inclusion criteria were tightly
defined and the meta-analysis was rigorously conducted according to a predefined
analysis plan addressing specific hypotheses. The meta-analysis combined data
103
from a group of predominantly underpowered single center studies. However the
included studies reflect international practice (North America n=7, Europe n=13,
Japan n=1, South America n=1) although the majority of included studies are from
major teaching centers. The pooled studies include adult (>16 years) patients
from several specialties including abdominal, urology, gynaecology and
orthopaedic, cardiac, thoracic and vascular surgery.
The predefined analysis plan, using mortality from the longest available follow-up,
increased the weight attributed to the two largest studies that both reported one-
year follow-up. Only one other study reported follow-up beyond 60 days. In this
group of studies a proportion of the operations were for cancer resection,
therefore introducing a possible competing cause of mortality.
Reporting of outcome data in the included studies was variable. Mortality was
reported over a variety of timeframes (see below) and non-mortality outcomes
were either limited, or inconsistent between studies, precluding meaningful
analyses in many cases. Diverse criteria and description of reporting morbidity,
along with infrequent use of validated metrics, limit the precision of treatment
effect estimates and the confidence that can be attached to them. Furthermore,
pooling of different types of morbidity was not consistent between studies limiting
assessment of the overall “morbidity load”.
These studies tested the effect of a complex package of care (e.g. fluids, inotropes,
monitor, goals, critical care environment) rather than of a single clearly defined
intervention. Heterogeneity in the components of such a complex intervention
may contribute to study heterogeneity within a systematic review. Study
heterogeneity may reduce the precision of treatment effect estimates and reduce
the generalisability of results of meta-analyses 225. By definition, it is not easy
precisely to define the “active ingredients” of a complex intervention 224.
However, hypothesis generating stratified meta-analysis of the included studies
permits exploration of the contribution of the components of a complex
intervention and consequent identification of possible determinants of response to
the intervention 225. The results of the stratified meta-analysis indicated that there
were insufficient data to distinguish statistically between many of the pre-
104
specified subgroups, and highlighted the limited quantity of data in some areas e.g.
emergency surgery.
Several possible sources of bias arise in this meta-analysis. Statistical significance
of the primary analysis is sensitive to withdrawal of lower quality (inadequate
allocation concealment) and smaller studies, although in all cases the point
estimate of effect is ≤ 0.91. Studies with adequate allocation concealment 277 and
larger studies are less likely to be affected by bias 278 and inclusion of lower
quality studies can alter the interpretation of the benefit of interventions in meta-
analysis 279. The primary analysis is also sensitive to method of analysis: the result
is statistically significant when the Peto odds ratio is used (a priori analysis) and
with random effects models, but not with the two non-Peto fixed effects models.
Statistical heterogeneity is indicated by formal testing (Chi squared, p = 0.007),
and by the sensitivity of the result to different methods of analysis, suggesting that
a random effects analysis, which assumes statistical heterogeneity, is more
appropriate that one using fixed effects. In all cases the point estimate of effect is ≤
0.86.
The possibility of publication bias cannot be excluded. No evidence of this was
found in relation to contacts with experts and industry but some of the published
abstracts identified have yet to be published as full peer-reviewed papers.
Language bias is also a possibility due to the electronic databases and conferences
searched but there were no language exclusions in the searches. Flaws in the
original study designs are a significant potential source of bias. The meta-analysis
includes 4546 patients but the unit of analysis is the study (or study subgroup) and
the sample size (22 studies) is relatively small. Although defined a priori, the
stratified analysis (sub-group analysis) should be seen as hypothesis generating
only.
This review represents the best up-to-date summary of the literature. A tightly
defined question was framed and explicit inclusion criteria for studies and a pre-
defined analysis plan were used. The primary result agrees with previous reviews
in this area 217,219,221-223 which have been uniformly supportive of this intervention.
The results of this systematic review do not however, agree with the results of the
105
largest study in this area 266.
The studies included in this review are typical of studies in critical care research in
general in that the vast majority of studies are underpowered and single centre 280.
Future studies in this area should test an explicitly framed hypothesis, be
adequately powered, methodologically rigorously and blinded (where possible).
Reporting of outcomes should be standardized (to allow comparison between
studies and to facilitate the conduct of future meta-analyses) and inclusive
(morbidity, health status, resource usage). In particular, cost/economic analysis is
fundamental.
The sensitivity of the results to method of analysis indicates that the results of this
study are far from clear-cut. Further research in this area both to address the
overall objective of this review and to focus on specific questions is essential.
Sandham et al have shown that large multicentre studies can be conducted in this
area. Future research will hopefully contribute to disentangling the complex
package of care that forms the intervention (e.g. fluids, inotropes, monitor, goals,
critical care environment) in order to identify effective components.
2.5 Summary
1. Perioperative administration of fluids and/or vasoactive drugs targeted to
increase global blood flow defined by explicit measured goals reduces mortality
following surgery.
2. This intervention also reduces hospital length of stay following surgery but
does not alter critical care length of stay.
3. The intervention also reduces the total number of patients with
complications and the incidence of renal impairment/failure, respiratory
failure/ARDS and infection.
4. Heterogeneity in the criteria, description, and pooling of reporting
morbidity, along with infrequent use of validated metrics, limit the precision of
treatment effect estimates and the confidence that can be attached to them.
5 Stratified meta-analysis generated hypotheses about which components of
this complex intervention might be determinants of response, as highlighting areas

106
where additional research is required (e.g. inadequate data in relation emergency
surgery).

107
Appendix 1: “Optimization Systematic Review Steering Group”
Dr Richard Beale, Professor David Bennett, Dr Owen Boyd, Mr Mark Emberton,
Ms Caroline Goldfrad, Dr Michael Grocott, Dr Mark Hamilton, Ms Julia Langham,
Professor Monty Mythen, Professor Ian Roberts, Dr Kathy Rowan, Dr Jonathan
Thompson.
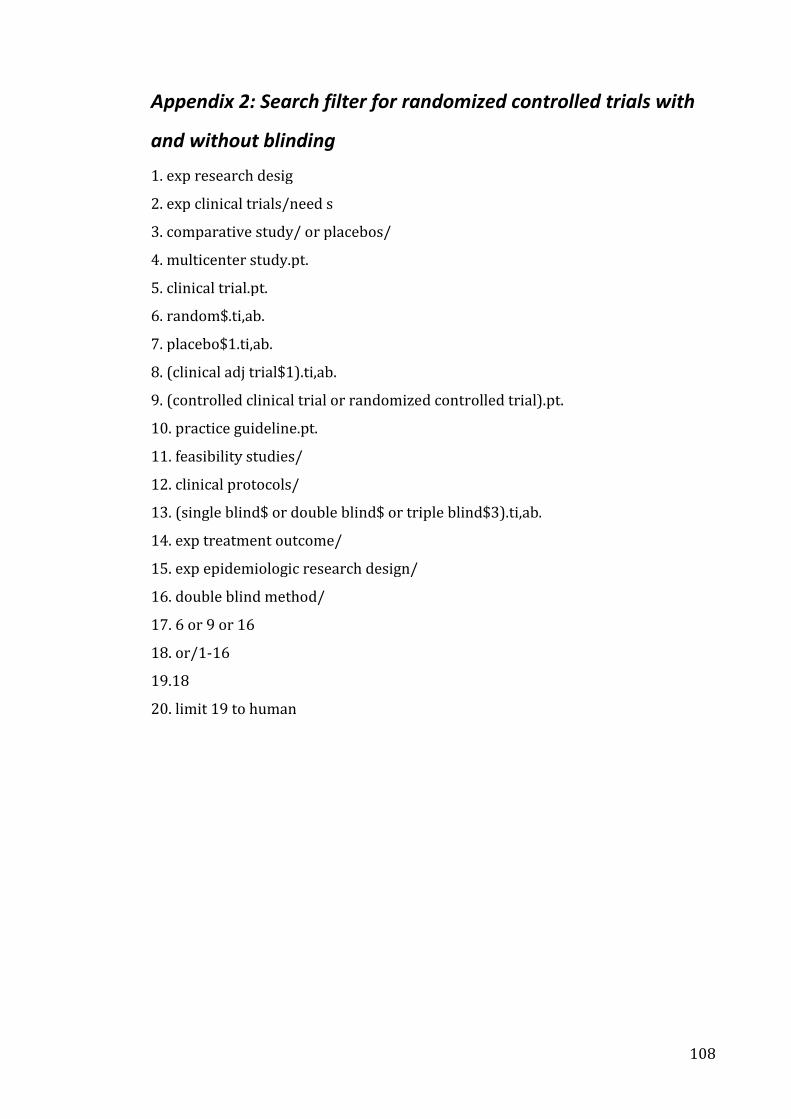
108
Appendix 2: Search filter for randomized controlled trials with
and without blinding
1. exp research desig
2. exp clinical trials/need s
3. comparative study/ or placebos/
4. multicenter study.pt.
5. clinical trial.pt.
6. random$.ti,ab.
7. placebo$1.ti,ab.
8. (clinical adj trial$1).ti,ab.
9. (controlled clinical trial or randomized controlled trial).pt.
10. practice guideline.pt.
11. feasibility studies/
12. clinical protocols/
13. (single blind$ or double blind$ or triple blind$3).ti,ab.
14. exp treatment outcome/
15. exp epidemiologic research design/
16. double blind method/
17. 6 or 9 or 16
18. or/1-16
19.18
20. limit 19 to human
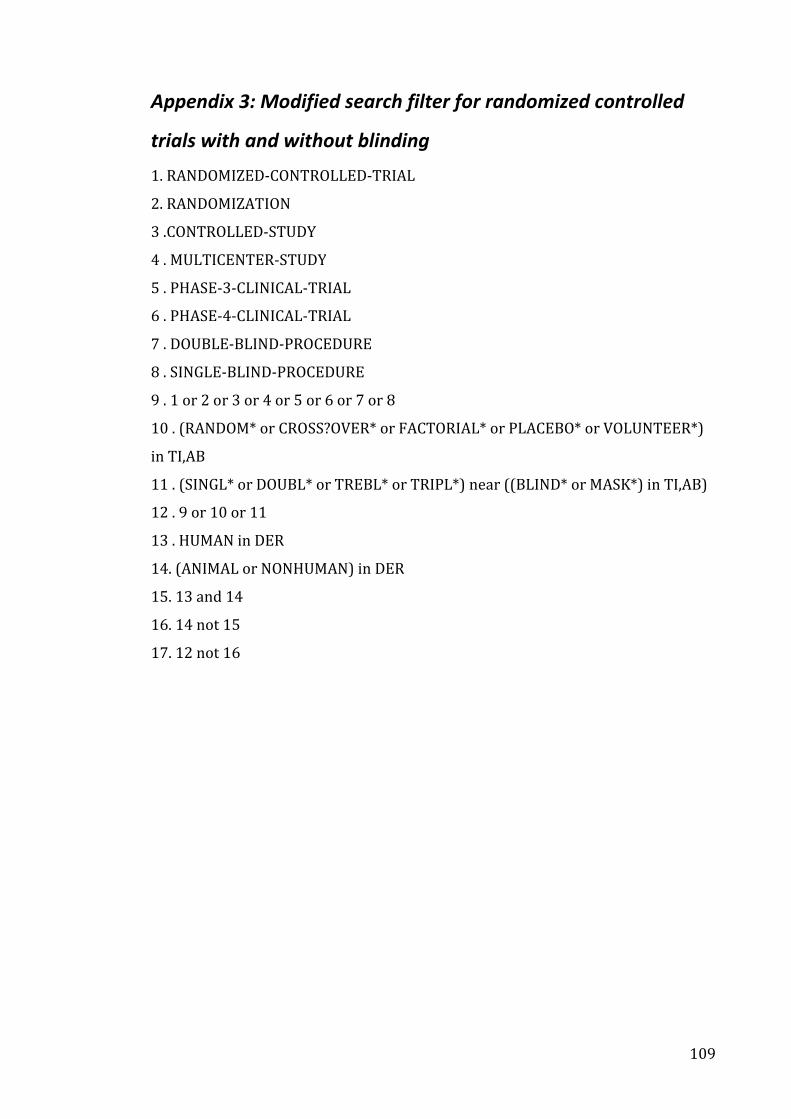
109
Appendix 3: Modified search filter for randomized controlled
trials with and without blinding
1. RANDOMIZED-CONTROLLED-TRIAL
2. RANDOMIZATION
3 .CONTROLLED-STUDY
4 . MULTICENTER-STUDY
5 . PHASE-3-CLINICAL-TRIAL
6 . PHASE-4-CLINICAL-TRIAL
7 . DOUBLE-BLIND-PROCEDURE
8 . SINGLE-BLIND-PROCEDURE
9 . 1 or 2 or 3 or 4 or 5 or 6 or 7 or 8
10 . (RANDOM* or CROSS?OVER* or FACTORIAL* or PLACEBO* or VOLUNTEER*)
in TI,AB
11 . (SINGL* or DOUBL* or TREBL* or TRIPL*) near ((BLIND* or MASK*) in TI,AB)
12 . 9 or 10 or 11
13 . HUMAN in DER
14. (ANIMAL or NONHUMAN) in DER
15. 13 and 14
16. 14 not 15
17. 12 not 16
110
Appendix 4: List of Key Words used in electronic searches
high-risk surgery, peri-operative, pre-operative, post-operative, intra-operative,
optimisation, optimization, goal-directed, supra-normal, fluids, oxygen delivery,
starch, gelatin, blood product, crystalloid, colloid, splanchnic, renal perfusion,
tissue perfusion, blood flow, lactate, acid base, oxygen consumption, base excess,
base deficit, blood volume, fluid loading, fluid administration, central venous
pressure, CVP, aneurysm, vascular surgery, cardiac surgery, cancer surgery,
trauma surgery, emergency surgery, orthopaedic surgery, cardiac output, cardiac
index, pulmonary artery flotation catheter, PAFC, right-heart catheter, Swan Ganz,
Doppler, pHi, tonometry, PCO2 gap, echocardiography, fluid therapy, stroke
volume, SvO2, mixed venous oxygen saturation.
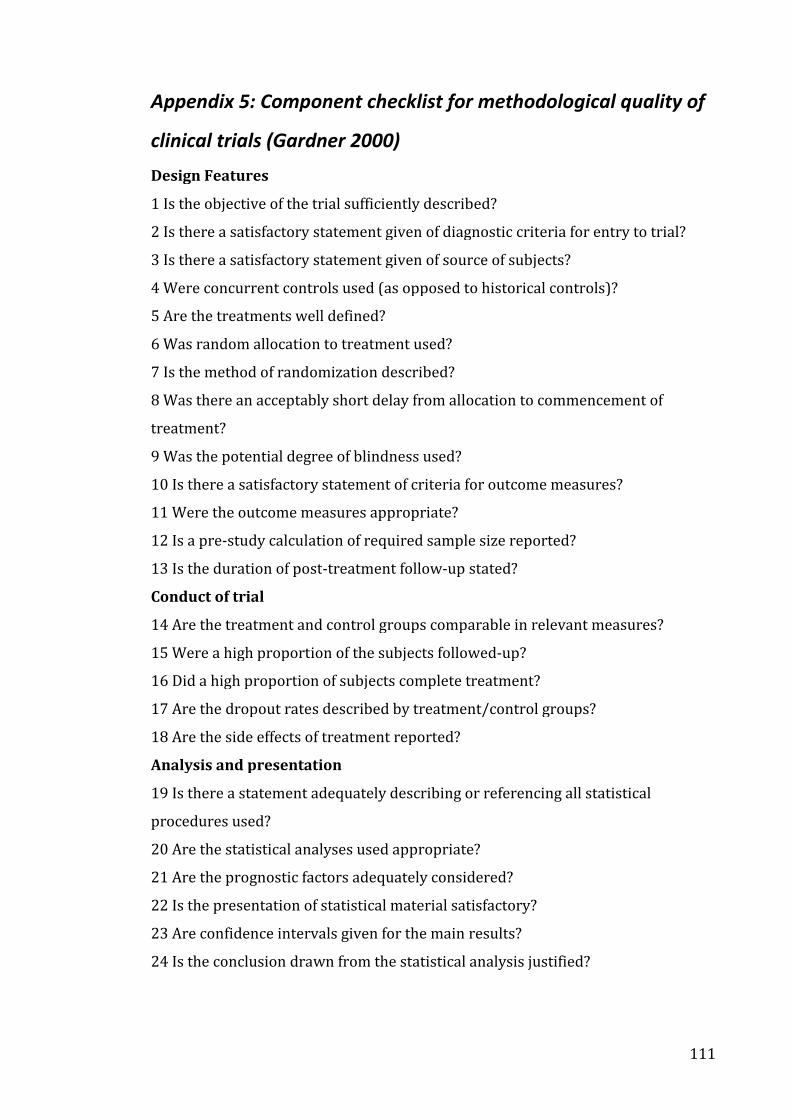
111
Appendix 5: Component checklist for methodological quality of
clinical trials (Gardner 2000)
Design Features
1 Is the objective of the trial sufficiently described?
2 Is there a satisfactory statement given of diagnostic criteria for entry to trial?
3 Is there a satisfactory statement given of source of subjects?
4 Were concurrent controls used (as opposed to historical controls)?
5 Are the treatments well defined?
6 Was random allocation to treatment used?
7 Is the method of randomization described?
8 Was there an acceptably short delay from allocation to commencement of
treatment?
9 Was the potential degree of blindness used?
10 Is there a satisfactory statement of criteria for outcome measures?
11 Were the outcome measures appropriate?
12 Is a pre-study calculation of required sample size reported?
13 Is the duration of post-treatment follow-up stated?
Conduct of trial
14 Are the treatment and control groups comparable in relevant measures?
15 Were a high proportion of the subjects followed-up?
16 Did a high proportion of subjects complete treatment?
17 Are the dropout rates described by treatment/control groups?
18 Are the side effects of treatment reported?
Analysis and presentation
19 Is there a statement adequately describing or referencing all statistical
procedures used?
20 Are the statistical analyses used appropriate?
21 Are the prognostic factors adequately considered?
22 Is the presentation of statistical material satisfactory?
23 Are confidence intervals given for the main results?
24 Is the conclusion drawn from the statistical analysis justified?
112
Chapter 3 Morbidity reporting in surgical RCTs
3.1 Introduction
In this chapter I explore further the reporting of morbidity in clinical trials by
describing the standard of outcomes reporting from a sample of RCTs (of surgical
interventions) published in high-impact surgical journals.
In the previous chapter marked inconsistency of morbidity reporting was
observed in a homogeneous population of studies of similar interventions. In
order to establish whether this observation can be generalised to other studies, a
separate sample of perioperative RCTs were selected and morbidity reporting
assessed. Quality of reporting of trial methodology was also evaluated.
The criteria against which these RCTs are judged are based on the CONSORT
(Consolidated Standards of Reporting Trials) statement 281. The CONSORT
statement provides a standardised framework to guide reporting of RCTs. It was
developed by an international group of clinicians, statisticians and biomedical
editors in the mid-1990s with the aim of remedying persistent deficiencies in
reporting of trial methodology 281. The revised CONSORT statement 282 (2001) is
supported by a growing number of biomedical journals and health care groups
282,283. However, despite evidence suggesting that adherence to CONSORT
guidelines improves the quality of trial reporting, enforcement remains low
amongst surgical journals 284.
To derive objective criteria for evaluating the reporting of postoperative morbidity
in surgical RCTs, I used the recent extension to the CONSORT statement relating to
reporting of adverse events in RCTs 285. The data obtained in this study are
consistent with previous studies of standards of reporting of methodology in RCTs
in surgery 284,286 and provide the first systematic description of reporting of harms
(morbidity) in this category of study.
113
3.2 Methods
3.2.1 Summary
A retrospective systematic review of RCTs published in four high-impact surgical
journals over a single calendar year was conducted. Quality of reporting of
adverse events and trial methodology were assessed using the criteria derived
from the extended CONSORT statement.
3.2.1 Selection of journals and identification of RCTs
The four highest-ranking “surgery” journals (as defined by impact factor) were
identified using the ISI Web of Knowledge’s Journal Citation Report (2004) 156. For
each journal, a MEDLINE search was conducted using the terms “random” and
“trial” and limited to the 2005 calendar year (January to December 2005 inclusive).
The electronic search was complemented by a hand search of each journal to
ensure that all eligible studies were captured. Studies were only included if they
were true randomised trials involving human subjects. The “instructions to
authors” section of all four journals was accessed to determine whether the
journals endorsed the CONSORT statement.
3.2.2 Data extraction
For each included study, the following characteristics were recorded: number of
authors, number of centres involved, page length, involvement of a
statistician/epidemiologist, source of funding (if declared), and country of study.
For each included study, two investigators independently extracted data items
relating to eight methodological criteria and five aspects of harms reporting, as
well as calculating Jadad scores to summarise study quality 287. The following data
items relating to harms reporting were extracted: provision of standardized or
validated definitions of harms, identification of outcomes assessors, mode of data
collection (active or passive), timing of data collection (prospective or
retrospective) and time frame of surveillance for harms. Adequacy of reporting of
items was reported as clear or unclear, or by category (e.g. prospective vs.
retrospective). The following data items relating to methodology were extracted:
mode of random sequence generation, allocation concealment, implementation of
randomization, blinding status of outcomes assessors and data analysts,
justification of sample size, intention-to-treat analysis and participant flow-
114
diagram. A third investigator adjudicated any disagreements until consensus was
reached.
3.2.3 Data analysis
Item frequencies were reported as number (%). The К statistic was used to
measure chance-adjusted inter-rater reliability. Study quality was categorised as
low quality (Jadad score <3) and high quality (Jadad score ≥3). Fisher’s exact tests
were used to compare categories of studies. All p values are 2-sided and p values
lower than 0.05 were considered statistically significant. Stata/IC software
(Release 10.0) [StataCorp, College Station, TX, USA] was used for all calculations.
3.3 Results
The top 4 surgical journals, as defined by 2004 impact factor, were Annals of
Surgery, American Journal of Transplantation, American Journal of Surgical
Pathology and Annals of Surgical Oncology. MEDLINE searching of these journals
(calendar year 2005) yielded 93 articles of which 42 were eligible for inclusion in
this study. Hand searching did not identify any further studies for inclusion.
Reasons for study exclusion included: cohort studies (15), retrospective analysis
(8), editorial/special article (6), non-randomised prospective comparisons (5),
studies nested within a previously reported RCT (4), analysis of subgroup in an
RCT (3), systematic review/meta-analysis (3), questionnaire (2), case-control
study (1), cost-benefit analysis (1), long-term follow-up of previously reported
RCT (1), letter to the editor (1) and animal study (1). The 42 included studies
included 8673 subjects.
The included journals, endorsement of CONSORT statement in “instructions to
authors”, number of included RCTs, median RCT page length, consensus median
Jadad scores and Jadad sub-group scores (<3 or > 3) are reported in Table 22.
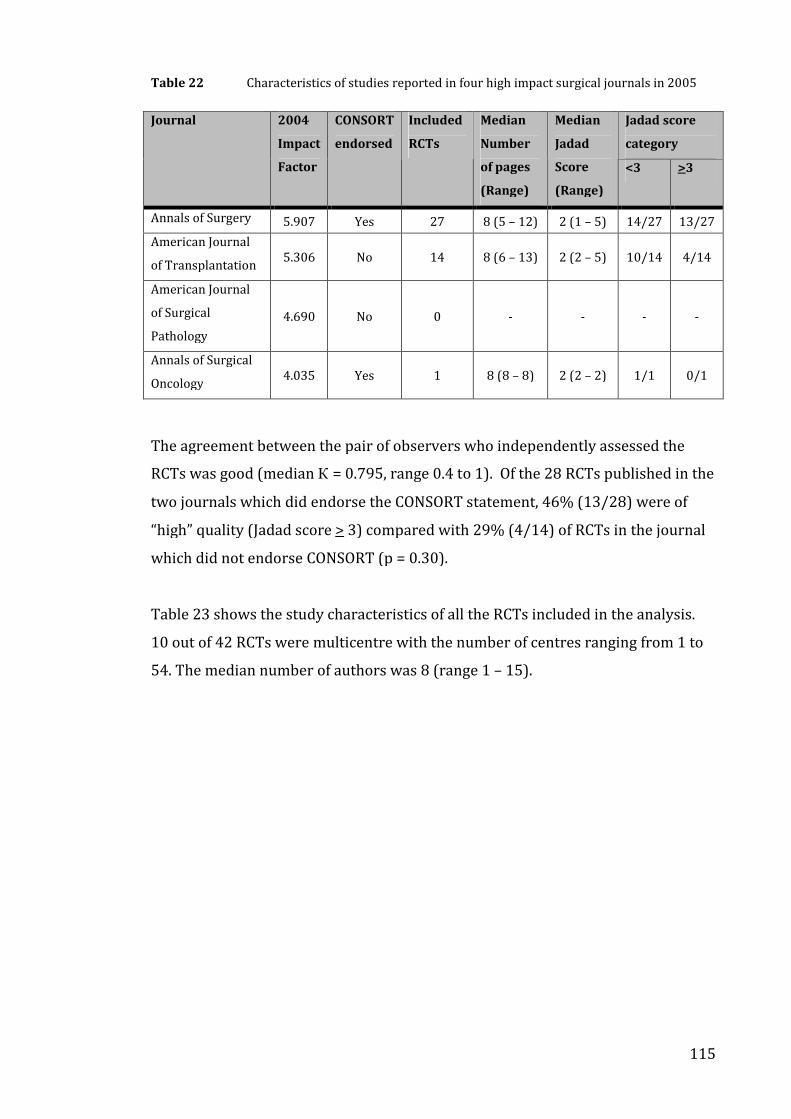
115
Table 22 Characteristics of studies reported in four high impact surgical journals in 2005
Jadad score
category
Journal 2004
Impact
Factor
CONSORT
endorsed
Included
RCTs
Median
Number
of pages
(Range)
Median
Jadad
Score
(Range)
<3 >3
Annals of Surgery 5.907 Yes 27 8 (5 – 12) 2 (1 – 5) 14/27 13/27
American Journal
of Transplantation5.306 No 14 8 (6 – 13) 2 (2 – 5) 10/14 4/14
American Journal
of Surgical
Pathology
4.690 No 0 - - - -
Annals of Surgical
Oncology4.035 Yes 1 8 (8 – 8) 2 (2 – 2) 1/1 0/1
The agreement between the pair of observers who independently assessed the
RCTs was good (median К = 0.795, range 0.4 to 1). Of the 28 RCTs published in the
two journals which did endorse the CONSORT statement, 46% (13/28) were of
“high” quality (Jadad score > 3) compared with 29% (4/14) of RCTs in the journal
which did not endorse CONSORT (p = 0.30).
Table 23 shows the study characteristics of all the RCTs included in the analysis.
10 out of 42 RCTs were multicentre with the number of centres ranging from 1 to
54. The median number of authors was 8 (range 1 – 15).
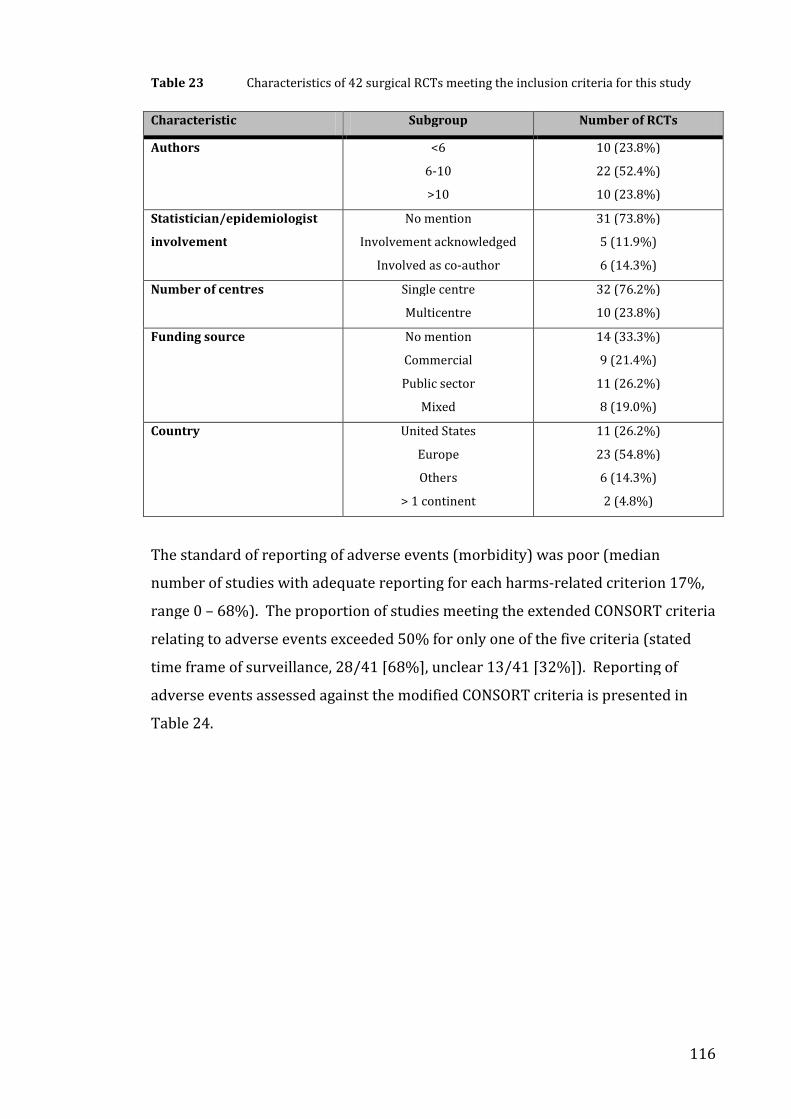
116
Table 23 Characteristics of 42 surgical RCTs meeting the inclusion criteria for this study
Characteristic Subgroup Number of RCTs
Authors <6
6-10
>10
10 (23.8%)
22 (52.4%)
10 (23.8%)
Statistician/epidemiologist
involvement
No mention
Involvement acknowledged
Involved as co-author
31 (73.8%)
5 (11.9%)
6 (14.3%)
Number of centres Single centre
Multicentre
32 (76.2%)
10 (23.8%)
Funding source No mention
Commercial
Public sector
Mixed
14 (33.3%)
9 (21.4%)
11 (26.2%)
8 (19.0%)
Country United States
Europe
Others
> 1 continent
11 (26.2%)
23 (54.8%)
6 (14.3%)
2 (4.8%)
The standard of reporting of adverse events (morbidity) was poor (median
number of studies with adequate reporting for each harms-related criterion 17%,
range 0 – 68%). The proportion of studies meeting the extended CONSORT criteria
relating to adverse events exceeded 50% for only one of the five criteria (stated
time frame of surveillance, 28/41 [68%], unclear 13/41 [32%]). Reporting of
adverse events assessed against the modified CONSORT criteria is presented in
Table 24.
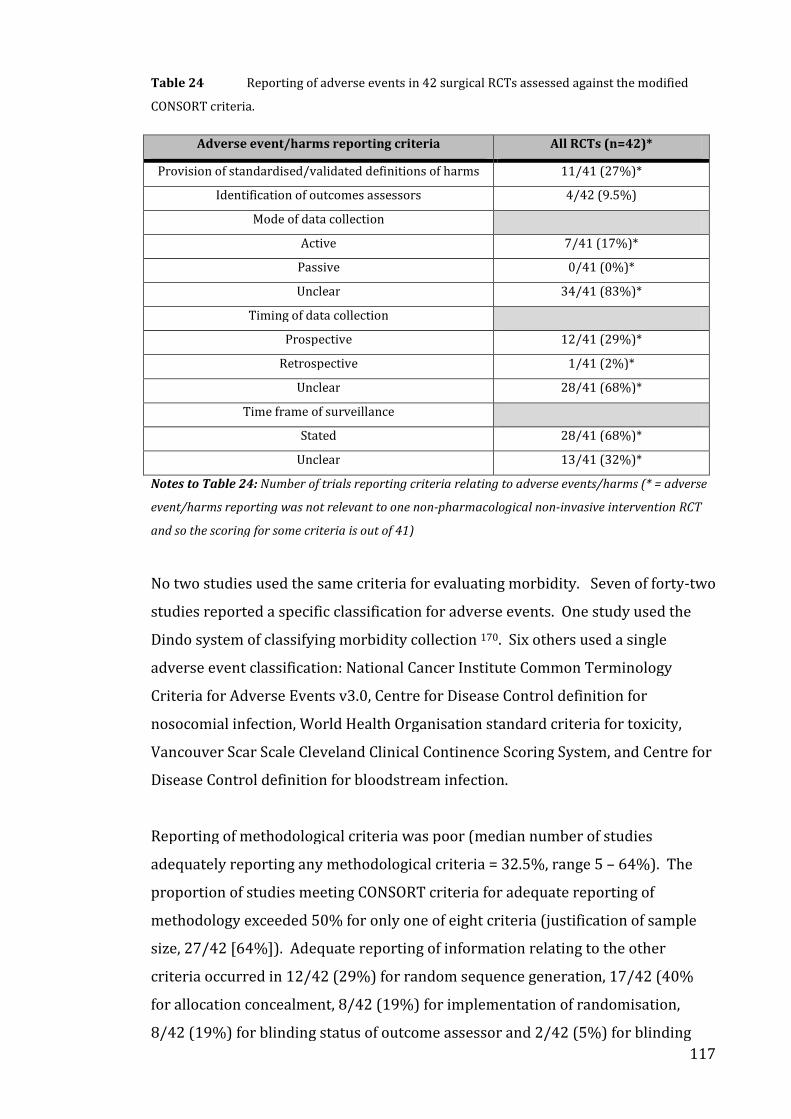
117
Table 24 Reporting of adverse events in 42 surgical RCTs assessed against the modified
CONSORT criteria.
Adverse event/harms reporting criteria All RCTs (n=42)*
Provision of standardised/validated definitions of harms 11/41 (27%)*
Identification of outcomes assessors 4/42 (9.5%)
Mode of data collection
Active 7/41 (17%)*
Passive 0/41 (0%)*
Unclear 34/41 (83%)*
Timing of data collection
Prospective 12/41 (29%)*
Retrospective 1/41 (2%)*
Unclear 28/41 (68%)*
Time frame of surveillance
Stated 28/41 (68%)*
Unclear 13/41 (32%)*
Notes to Table 24: Number of trials reporting criteria relating to adverse events/harms (* = adverse
event/harms reporting was not relevant to one non-pharmacological non-invasive intervention RCT
and so the scoring for some criteria is out of 41)
No two studies used the same criteria for evaluating morbidity. Seven of forty-two
studies reported a specific classification for adverse events. One study used the
Dindo system of classifying morbidity collection 170. Six others used a single
adverse event classification: National Cancer Institute Common Terminology
Criteria for Adverse Events v3.0, Centre for Disease Control definition for
nosocomial infection, World Health Organisation standard criteria for toxicity,
Vancouver Scar Scale Cleveland Clinical Continence Scoring System, and Centre for
Disease Control definition for bloodstream infection.
Reporting of methodological criteria was poor (median number of studies
adequately reporting any methodological criteria = 32.5%, range 5 – 64%). The
proportion of studies meeting CONSORT criteria for adequate reporting of
methodology exceeded 50% for only one of eight criteria (justification of sample
size, 27/42 [64%]). Adequate reporting of information relating to the other
criteria occurred in 12/42 (29%) for random sequence generation, 17/42 (40%
for allocation concealment, 8/42 (19%) for implementation of randomisation,
8/42 (19%) for blinding status of outcome assessor and 2/42 (5%) for blinding
118
status of data analysts. Intention to treat analysis was reported in 18/42 (43%) of
studies and a participant flow diagram was provided in 15/42 (36%) of studies.
Jadad score category was low (<3) in 24/42 (57%) of studies and high (≥3) in
18/42 (43%) of studies. We found that page length of the manuscript (p = 0.45),
author number (p = 0.50), number of centres (p = 0.47), declaration of funding
source (p = 0.30) and involvement of a statistician (p = 0.087) were not associated
with better reporting quality as measured by the Jadad score.
3.4 Discussion
3.4.1 Summary
The reporting of methodological factors recommended in the CONSORT statement
was poor for RCTs published in high quality surgical journals. This study is unique
in systematically describing adverse event reporting in surgical RCTs, as
recommended by the extended CONSORT statement. Adverse event reporting in
surgical RCTs was poor, with researchers frequently failing to provide definitions
of adverse events, to identify those assessing outcomes and to provide information
relating to the mode, timing and duration of adverse event data collection.
3.4.2 Reporting of morbidity in surgical RCTs
The inconsistency and poor quality of morbidity reporting is consistent with the
findings of a systematic review of perioperative haemodynamic management
presented in Chapter 2 of this thesis. Using a different method of assessment on a
distinct sample of studies, I have identified comparable inconsistency of reporting
and infrequent use of defined measures of morbidity. Adequate definition of
adverse events is essential not only for critical appraisal and interpretation of trial
results but also to facilitate comparison between RCTs, systematic review and
meta-analysis 285. None of the RCTs in this study used the same methodology for
reporting adverse events (morbidity) and no study used a systematic approach,
incorporating a validated metric, for describing postoperative morbidity. The
identity of outcomes assessors may be related to the attribution of adverse events
(the process of deciding whether an adverse event is due to an intervention):
blinded independent outcomes assessors are less likely to be biased by knowledge
or expectation of study group allocation. It is not possible to exclude the
possibility of bias in the reporting process in studies that do not identify outcome
119
assessors. Active surveillance (where participants are either asked about the
occurrence of events in structured questionnaires or interviews, or pre-defined
diagnostic tests are performed at pre-specified time intervals) for adverse events
has a greater yield than passive disclosure (where participants spontaneously
report on their own initiative) and prospective collection of data is less susceptible
to bias and confounding than retrospectively collected data 285,288. Furthermore
the duration of surveillance for adverse events should be specified (and justified)
as important events with long latency periods may otherwise be missed 285.
Failure to adequately report such information limits assessment of both internal
and external validity. Of note, none of these studies used a systematic or validated
system or metric (such as the POMS) for collecting morbidity data. Although this
study was not designed as a systematic review to identify metrics for the
description of postoperative morbidity, this finding (in a year of studies from the 4
top surgical journals by impact factor) suggests that no metric is currently in
common use. This observation is supported by the description of morbidity
reporting described in Chapter 2, where the POMS was the only systematic method
designed specifically to record postoperative morbidity that was identified. Use of
the POMS by an identified outcomes assessor would meet all of the criteria used to
assess adverse event recording in this group of studies.
3.4.3 Reporting of methodological characteristics of surgical RCTs
The findings of this study in relation to reporting of methodological criteria are
consistent with previous reports surveying surgical RCTs 284. However, the
majority of studies on quality of surgical trial reporting were published before
release of the CONSORT extension 284,286,289. The methodological criterion that was
most frequently reported was justification of pre-study sample size and this was
the only criterion to be reported in more than 50% of studies. In recognition of the
difficulties associated with blinding patients and surgeons in surgical RCTs we
limited our assessment of blinding status to outcome assessors and data analysts
but nonetheless found that blinding status is inadequately reported in the majority
of trials. The finding of deficient reporting of randomisation is in keeping with
published studies or RCTs published in surgical and medical journals 284,290.
Adequate reporting of randomization requires description of sequence generation,
allocation concealment (how randomization was concealed from those enrolling
participants) and implementation (identification of the personnel who generated
120
the randomization sequence and who enrolled and assigned participants) 291,292.
Deficiencies in reporting of randomization procedures limit detection of selection
bias and may be associated with exaggeration of treatment effect. Adequate
description of “intention-to-treat” analysis (defined as analysis according to
randomization) was present in only 18 of 42 RCTs (43%). Although it is known
that reporting of “intention-to-treat” is associated with other aspects of good study
design, this finding may be a reflection of the debate amongst the scientific
community about the validity of including all randomized cases (even those not
receiving treatment) in data analysis 293. Use of participant flow diagrams was
poor: not only were absolute numbers low (15/42 studies [36%] used flow
diagrams), but also the proportion of diagrams that met the standard
recommended by CONSORT was lower still. The purpose of the flow diagram is to
explicitly report the numbers of participants being randomised, receiving
treatment, completing the study and being analysed 282. Of the 15 RCTs using flow
diagrams, only 7 reached this standard, suggesting a lack of understanding of the
importance of this feature.
3.4.4 “Quality” of surgical RCTs
The Jadad score is a validated scale for evaluating trial quality and comprises 3
questions relating to randomization, blinding and the reporting of withdrawals
and dropouts 287. A “high” score (>3) is achievable even in non-blinded studies
provided the other factors are adequately reported. We found that 46% (13/28) of
RCTs from CONSORT-endorsing journals were of “high” quality (Jadad score >3)
compared with 29% (4/14) of RCTs from the journal which did not endorse
CONSORT but this did not reach statistical significance (p=0.3). Other researchers
have also found that journals that endorse CONSORT do not enforce reporting
issues 294. As only three journals were included in this analysis, our sample may
not be representative of the whole population of surgical journals. It has been
reported that lack of available print space may be a contributing factor in sub-
standard reporting and one study (of medical journals) found a weak association
between RCT page length and reporting quality 290. Our study found no association
between page length and quality of reporting as measured by Jadad score.
Similarly, in contrast to a previous report, we found no association between study
quality and author number, number of study centres or declaration of funding
source 284. That none of these comparisons identified significant differences may
121
be due to lack of statistical power, due to the small sample of RCTs in this study, or
maybe because no real difference exists.
3.4.5 Limitations of this study
Strengths of this study include good internal validity due to use of pre-defined
methodology, systematic data collection from studies published within a defined
time frame and double data extraction by independent reviewers. In addition this
study provides new information on the reporting of harms from surgical RCTs.
Limitations of this study include the sole use of impact factor to determine the
study cohort and the lack of a comparator cohort. The use of an objective criterion
(impact factor) to select eligible journals removed subjective bias from this
process but limited the number of RCTs eligible for inclusion because the American
Journal of Surgical Pathology (primarily a histopathology journal) did not provide
any eligible studies and Annals of Surgical Oncology provided only one. In
retrospect it may have been more appropriate to consider the scope of the journal
in addition to impact factor and to give preference to journals publishing a
substantial number of clinical studies. In comparison with previous studies of a
similar type, this study lacks a direct comparator cohort (such as a group of RCTs
from high quality medical journals or an older cohort of RCTs from the same
surgical journals) and this reduces the applicability of our findings. Our study is
also limited by the recognised difficulty in assessing trial methodology indirectly
through the standard of reporting 284. Although failure to report a criterion does
not prove lack of implementation, adequate reporting is central to the credibility of
an RCT’s findings 284. Notably, for many of the listed methodological and harms
related criteria on which data are reported in this study, the largest category was
unclear, rather than clearly not meeting the criterion. Reporting of surgical RCTs
may not do credit to the quality of conducted studies: credibility might be
improved significantly simply by better quality reporting. A larger study would
have had greater statistical power to compare high and low quality studies and to
distinguish between sub-groups RCTs (e.g. low and high quality).
RCTs provide high quality evidence on efficacy of health care interventions only if
they are well designed and appropriately executed 292. Interpretation of the
strengths and limitations of an RCT relies on clear reporting of trial methodology
282. Inadequate reporting can mask deficient methodology and lend false credence
122
to biased results. Increased attention to the quality of reporting of RCTs by
investigators, reviewers and journal editors is required if studies are to meet
published criteria.
3.5 Summary
1. This chapter highlights the poor quality of reporting of RCTs in the surgical
literature and is consistent with previous studies of reporting quality in the
surgical literature. There does not appear to have been any improvement in
reporting quality in this more recent cohort.
2. This study has additionally, uniquely, demonstrated deficiencies in adverse
event reporting. Postoperative harms (morbidity) are inconsistently reported and
this reporting does not meet criteria based on the extended CONSORT statement
recommendations for the reporting of adverse events in relation to RCTs.
3. This finding is consistent with the results of Chapter 2 in this thesis
(inconsistent and poorly defined reporting of morbidity outcomes) and
emphasizes the importance of consistent reporting of postoperative morbidity
using a reliable and valid metric. No evidence that such a metric exists (with the
exception of POMS) was identified in this study.
123
CHAPTER 4: The POMS in a UK teaching hospital
4.1 Introduction
This chapter reports a prospective observational cohort study describing
morbidity following major elective surgery in a single UK teaching hospital
(Middlesex Hospital, London). The data collection described in this chapter also
provides the data that is used for the POMS validation analysis presented in
Chapter 5.
Within this chapter I will first present the characteristics of the study population
along with the prevalence and pattern of postoperative morbidity (as defined by
the POMS) within this cohort. Next, I will present the reasons for non-discharge
from hospital in patients with no POMS defined morbidity with an estimate of the
total subsequent morbidity-free bed days. I will then compare the POMS data from
this cohort with published summary POMS data from a similar cohort in a US
institution (Duke University Medical Centre, NC) 172 (see above, 1.6.4.3). Finally
the relationship between morbidity and length of hospital stay in the UK and US
cohorts will be compared.
4.2 Methods
4.2.1 General
A longitudinal cohort study of adults undergoing major surgery was conducted
using the POMS to describe the incidence and pattern of postoperative morbidity.
Data were collected with the aim of describing quantitatively preoperative risk and
intraoperative course as well as postoperative outcome, in order to evaluate the
validity of the POMS as a measure of postoperative morbidity (see Chapter 5).
Ethical approval was obtained from the Joint UCLH/UCL Committee on the Ethics
of Human Research (reference number 01/0116). The collected data obtained
were compared with published data from a similar sized cohort from a comparable
US institution.
124
4.2.2 Setting
At the time of this study the Middlesex Hospital was one of the University College
London Hospitals, London, UK. The data presented in this chapter were collected
between July 1st 2001 and September 30th 2003. The Middlesex Hospital closed in
December 2005.
4.2.3 Patients
All adult patients (aged 18 years or above) undergoing major elective surgery
were eligible for inclusion in this prospective cohort study. Eligible in-patients
were asked to provide informed consent to participate in the study. Consenting
patients were recruited into the study.
Major elective surgery was defined as procedures expected to last more than two
hours or with an anticipated blood loss greater than 500 milliliters. For the
purposes of this study the following procedures were accepted as meeting the
criteria within this definition: orthopaedic surgery (revision hip arthroplasty, total
hip replacement, total knee replacement, fusion/instrumentation of multiple
lumbar or thoracic vertebrae), general surgery (laparotomy including partial
hepatectomy, pancreatic surgery, re-operative colon surgery, abdominoperineal
resections, anterior resections, panproctocolectomies, hepatobiliary bypass
procedures), urological surgery (radical prostatectomy, radical cystectomy, radical
nephrectomy).
4.2.4 Sample size calculation
Statistical significance was set at alpha=0.05. Given an estimated prevalence of
25% for the most frequent morbidity domains from pilot data, obtained from the
original single-centre descriptive study 172 conducted at Duke University Medical
Centre University Medical Centre (North Caroline, USA)(Duke Cohort), a sample
size of at least 400 patients was estimated to generate enough events (100) to
allow for relatively narrow (approximately 10%) 95% CIs for the most common
morbidity domains. In addition, a sample size of 440 patients allowed direct
comparison of morbidity levels with the Duke Cohort.
125
4.2.5 Data collection
Data collection was by one of two study nurses. Consecutive patients were
approached for recruitment into the study, except where recruitment was
interrupted during periods of study nurse annual leave. Study data were collected
onto paper forms at the bedside and then later entered into a Microsoft Access
database (Microsoft Corp., Redmond, WA, USA) in the Surgical Outcomes Research
Centre within the Middlesex Hospital.
Patient age, sex, surgical procedure, measures of preoperative risk (ASA-PS Score,
POSSUM variables), length of postoperative stay, mortality and admission to
Intensive Care Unit (ICU) were recorded.
The POMS was administered on postoperative days (POD) three, five, eight, and
fifteen. POMS criteria were evaluated through direct patient questioning and
examination, review of clinical notes and charts, retrieval of data from the hospital
clinical information system and/or consulting with the patient's caregivers.
Patients were cared for by the normal attending clinicians who were blinded to the
survey results.
Where patients remained in hospital without identifiable morbidity (as defined by
the POMS), we recorded reasons for delay in hospital discharge including non-
medical reasons as a free text entry (last 200 recruited patients only). Reasons for
delayed discharge were ascertained by detailed review of the patients’ charts
(medication, observation and fluid balance) and clinical note review. Where no
clear answer was identified from these sources direct questioning of patients,
nurses and doctors was undertaken to define the reason for remaining in hospital.
4.2.6 Analysis plan
4.2.6.1 Description of patient characteristics and prevalence and pattern of POMS
defined morbidity
Continuous variables were expressed as mean, standard deviation (SD) and range.
For continuous variables with a known skewed distribution, medians were also
reported. The relationship between operative risk and mortality was expressed as
a proportion of patients in each category for ASA-PS score and using the calculated
126
OE ratio for POSSUM mortality risk. The relationship between operative risk and
postoperative length of stay was explored using univariate linear regression
analysis for POSSUM morbidity risk and ordered logistic regression analysis for
ASA-PS score.
4.2.6.2 Relationship between postoperative morbidity and stay in hospital
Proportions of categorical variables were compared using Chi squared tests. An
estimate of the total number of bed days on which patients remained in hospital
without POMS defined morbidity was calculated by summing the product of the
number of patients remaining in hospital without morbidity and the mean
subsequent length of hospital stay for each POD. Patients who were identified to
have morbidity, that had previously been morbidity free, were counted by cross-
tabulation.
4.2.6.3 Comparison with published POMS data from a USA institution
Data collected from patients in this study (Middlesex Cohort) were compared with
published summary data from the Duke Cohort 172. Proportions of categorical
variables were compared using Chi-squared tests. Continuous variables were
compared using t-tests. Association of morbidity (POMS defined) with ASA-PS
score was tested using univariate logistic regression analysis.
4.2.7 Statistical approach
All p values are 2-sided and p values lower than 0.05 were considered statistically
significant. Stata/IC software (Release 10.0) [StataCorp, College Station, TX, USA]
was used for all calculations.
4.3 Results
4.3.1 Characteristics of study population
Four hundred and fifty (63.7%) of the 706 patients who were candidates for
inclusion were enrolled into the study. The main reasons for non-enrolment were
lack of preoperative consent (139 patients), communication problems (47
patients) and enrolment in other studies (37 patients). One of the enrolled patients
withdrew following provision of consent, one was found to be participating in an
interventional study, one was withdrawn by the attending consultant, and eight
did not have surgery.
127
Patient and perioperative characteristics of the 439 evaluated patients are
summarised in Table 25. Mean age was 62.9 years (range 19 to 90 years) and 260
patients were female (59.2%). In the 434 patients where ASA score was recorded
79 (18.2%) were rated grade I, 253 (58.3%) were grade II, 100 (23.0%) were
grade III, and two (0.5%) were grade IV. The range of postoperative event risk
predicted by POSSUM was high for both morbidity (mean risk 31.9%, SD 21.3%;
range 7.6% to 98.0%) and mortality (mean risk 7.9%, SD10.3%, range 1.4% to
75.6%). Six patients (1.4%) died during their hospital stay. No deaths occurred in
patients with ASA-PS scores ≤II. Five of 100 patients with ASA-PS score III and one
of two patients with ASA-PS score IV died. The POSSUM OR ratio for mortality was
0.17.
The median post-operative length of hospital stay for all patients was 10 days
(mean 13.4 days, SD 12.8, range 1-136 days). Patients in ASA grades I or II had a
shorter post-operative length of stay (mean 12.6 days, median 10 days) than those
in grades III or IV (mean 16.4 days, median 12 days). Similarly, patients with ≥
50% risk of post-operative morbidity as defined by POSSUM had a longer post-
operative length of stay (mean 21.0 days, median 18 days) than those with a lower
risk (mean 11.8 days, median 9 days). Seventy patients (16.0%) were directly
admitted to ICU following surgery and a further 35 (8.0%) required admission to
ICU following a period of ward care. In univariate analyses, POSSUM morbidity
risk was linearly associated with postoperative length of stay (p <0.001, r2
0.10)(Figure 14), and ASA-PS score was associated with postoperative length of
stay (p = 0.004)(Figure 15) by ordered logistic regression. Duration of surgery
was associated with postoperative length of stay (P <0.001, r2 = 0.1488)() using
univariate linear regression analysis, but there was no significant association with
estimated intraoperative blood loss.
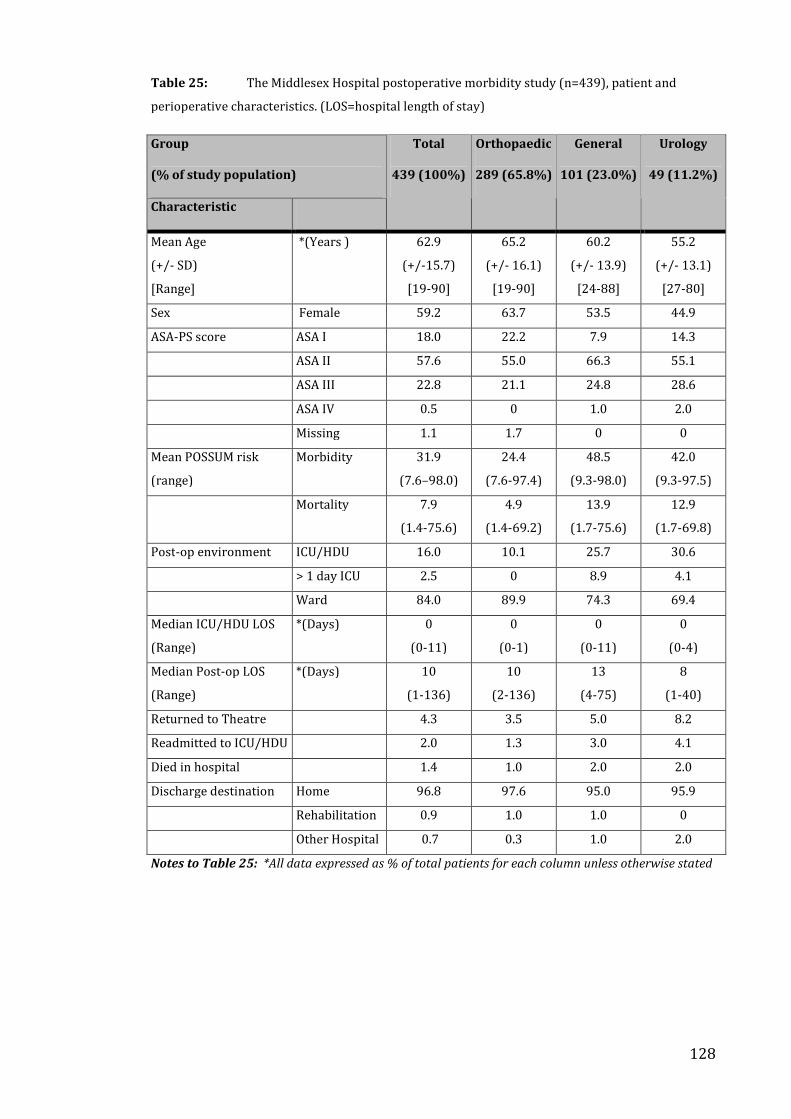
128
Table 25: The Middlesex Hospital postoperative morbidity study (n=439), patient and
perioperative characteristics. (LOS=hospital length of stay)
Group
(% of study population)
Characteristic
Total
439 (100%)
Orthopaedic
289 (65.8%)
General
101 (23.0%)
Urology
49 (11.2%)
Mean Age
(+/- SD)
[Range]
*(Years ) 62.9
(+/-15.7)
[19-90]
65.2
(+/- 16.1)
[19-90]
60.2
(+/- 13.9)
[24-88]
55.2
(+/- 13.1)
[27-80]
Sex Female 59.2 63.7 53.5 44.9
ASA-PS score ASA I 18.0 22.2 7.9 14.3
ASA II 57.6 55.0 66.3 55.1
ASA III 22.8 21.1 24.8 28.6
ASA IV 0.5 0 1.0 2.0
Missing 1.1 1.7 0 0
Mean POSSUM risk
(range)
Morbidity 31.9
(7.6–98.0)
24.4
(7.6-97.4)
48.5
(9.3-98.0)
42.0
(9.3-97.5)
Mortality 7.9
(1.4-75.6)
4.9
(1.4-69.2)
13.9
(1.7-75.6)
12.9
(1.7-69.8)
Post-op environment ICU/HDU 16.0 10.1 25.7 30.6
> 1 day ICU 2.5 0 8.9 4.1
Ward 84.0 89.9 74.3 69.4
Median ICU/HDU LOS
(Range)
*(Days) 0
(0-11)
0
(0-1)
0
(0-11)
0
(0-4)
Median Post-op LOS
(Range)
*(Days) 10
(1-136)
10
(2-136)
13
(4-75)
8
(1-40)
Returned to Theatre 4.3 3.5 5.0 8.2
Readmitted to ICU/HDU 2.0 1.3 3.0 4.1
Died in hospital 1.4 1.0 2.0 2.0
Discharge destination Home 96.8 97.6 95.0 95.9
Rehabilitation 0.9 1.0 1.0 0
Other Hospital 0.7 0.3 1.0 2.0
Notes to Table 25: *All data expressed as % of total patients for each column unless otherwise stated
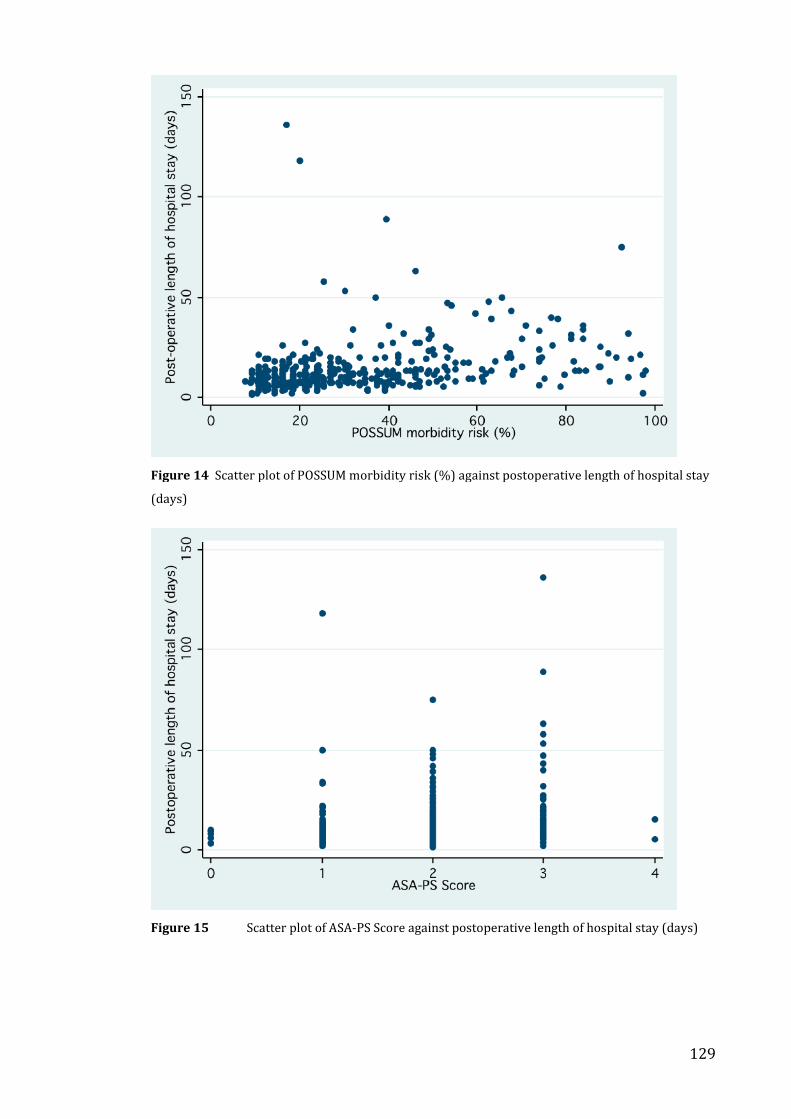
129
Figure 14 Scatter plot of POSSUM morbidity risk (%) against postoperative length of hospital stay
(days)
Figure 15 Scatter plot of ASA-PS Score against postoperative length of hospital stay (days)
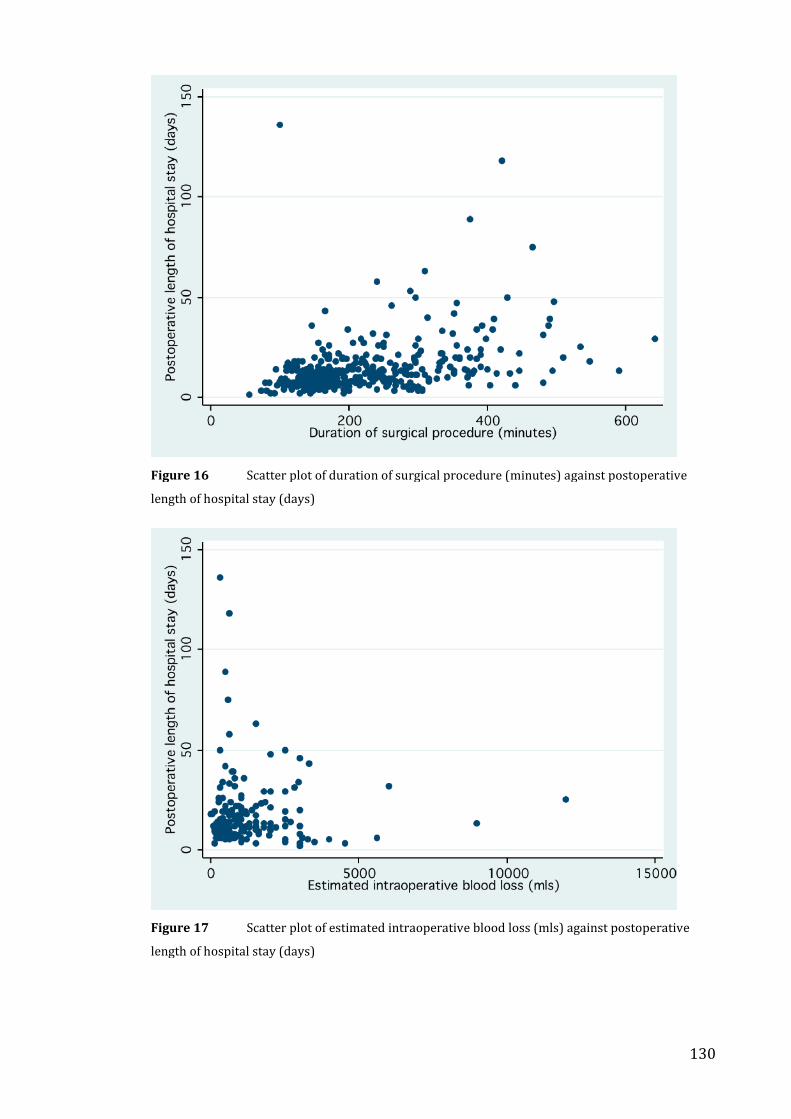
130
Figure 16 Scatter plot of duration of surgical procedure (minutes) against postoperative
length of hospital stay (days)
Figure 17 Scatter plot of estimated intraoperative blood loss (mls) against postoperative
length of hospital stay (days)
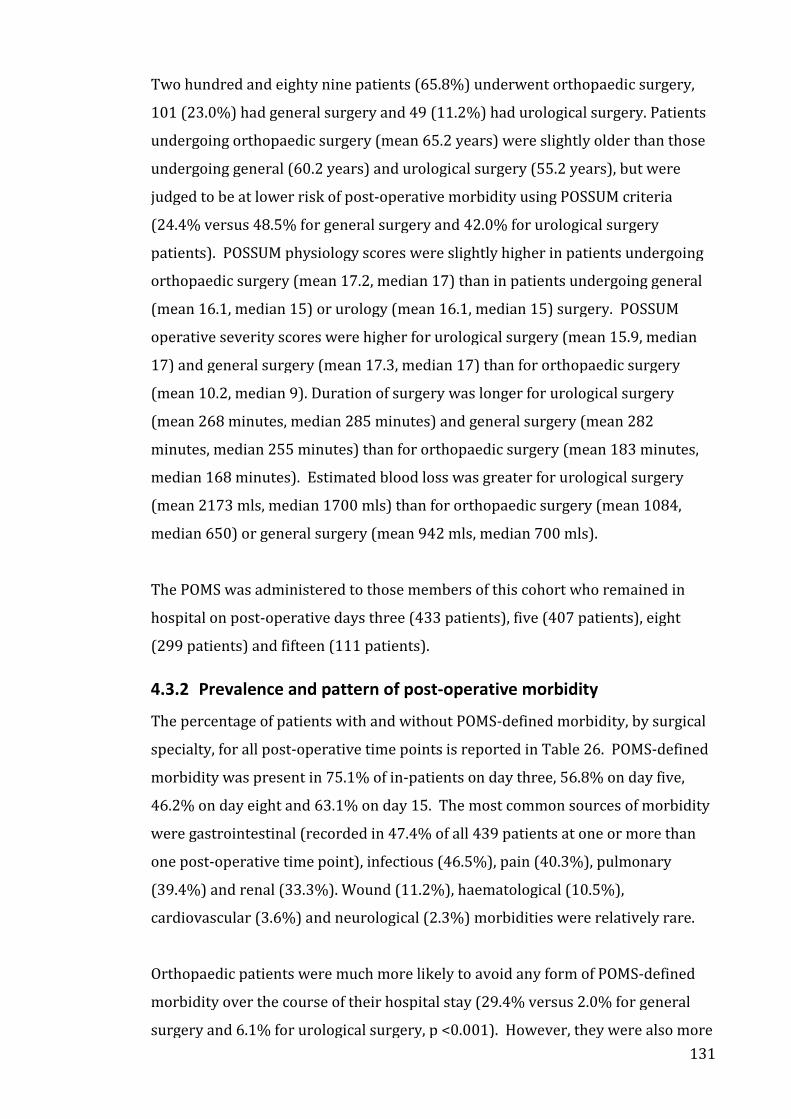
131
Two hundred and eighty nine patients (65.8%) underwent orthopaedic surgery,
101 (23.0%) had general surgery and 49 (11.2%) had urological surgery. Patients
undergoing orthopaedic surgery (mean 65.2 years) were slightly older than those
undergoing general (60.2 years) and urological surgery (55.2 years), but were
judged to be at lower risk of post-operative morbidity using POSSUM criteria
(24.4% versus 48.5% for general surgery and 42.0% for urological surgery
patients). POSSUM physiology scores were slightly higher in patients undergoing
orthopaedic surgery (mean 17.2, median 17) than in patients undergoing general
(mean 16.1, median 15) or urology (mean 16.1, median 15) surgery. POSSUM
operative severity scores were higher for urological surgery (mean 15.9, median
17) and general surgery (mean 17.3, median 17) than for orthopaedic surgery
(mean 10.2, median 9). Duration of surgery was longer for urological surgery
(mean 268 minutes, median 285 minutes) and general surgery (mean 282
minutes, median 255 minutes) than for orthopaedic surgery (mean 183 minutes,
median 168 minutes). Estimated blood loss was greater for urological surgery
(mean 2173 mls, median 1700 mls) than for orthopaedic surgery (mean 1084,
median 650) or general surgery (mean 942 mls, median 700 mls).
The POMS was administered to those members of this cohort who remained in
hospital on post-operative days three (433 patients), five (407 patients), eight
(299 patients) and fifteen (111 patients).
4.3.2 Prevalence and pattern of post-operative morbidity
The percentage of patients with and without POMS-defined morbidity, by surgical
specialty, for all post-operative time points is reported in Table 26. POMS-defined
morbidity was present in 75.1% of in-patients on day three, 56.8% on day five,
46.2% on day eight and 63.1% on day 15. The most common sources of morbidity
were gastrointestinal (recorded in 47.4% of all 439 patients at one or more than
one post-operative time point), infectious (46.5%), pain (40.3%), pulmonary
(39.4%) and renal (33.3%). Wound (11.2%), haematological (10.5%),
cardiovascular (3.6%) and neurological (2.3%) morbidities were relatively rare.
Orthopaedic patients were much more likely to avoid any form of POMS-defined
morbidity over the course of their hospital stay (29.4% versus 2.0% for general
surgery and 6.1% for urological surgery, p <0.001). However, they were also more
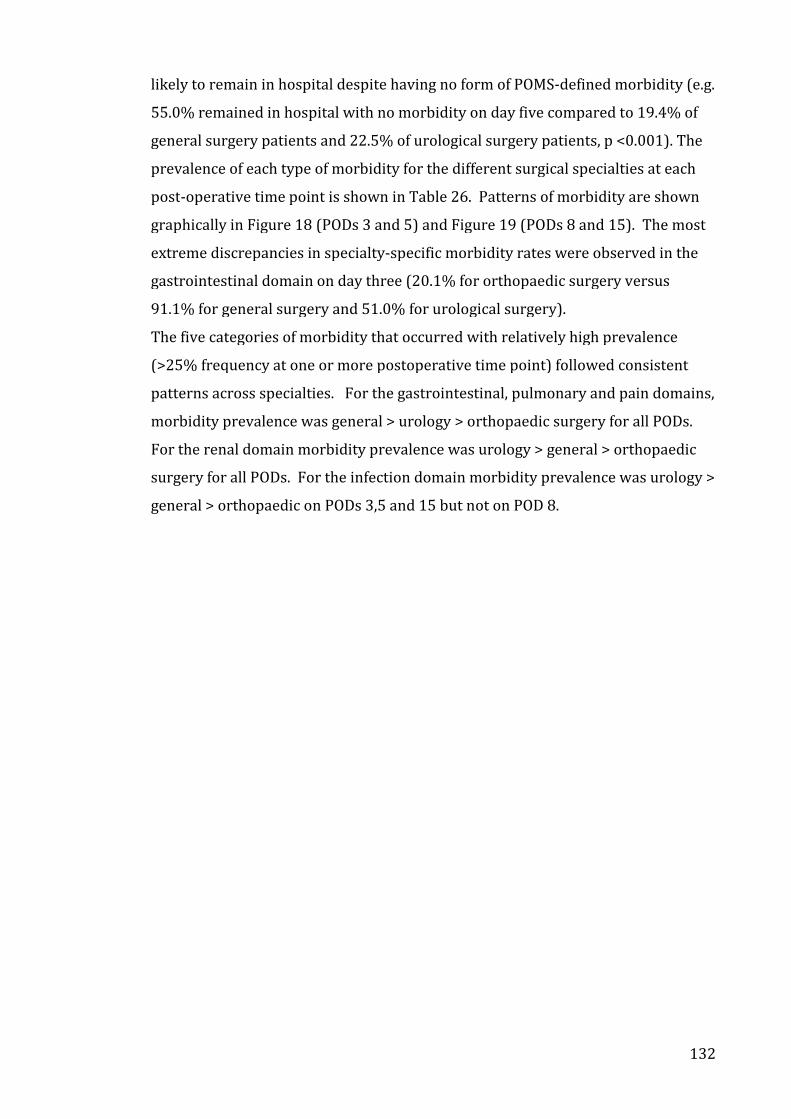
132
likely to remain in hospital despite having no form of POMS-defined morbidity (e.g.
55.0% remained in hospital with no morbidity on day five compared to 19.4% of
general surgery patients and 22.5% of urological surgery patients, p <0.001). The
prevalence of each type of morbidity for the different surgical specialties at each
post-operative time point is shown in Table 26. Patterns of morbidity are shown
graphically in Figure 18 (PODs 3 and 5) and Figure 19 (PODs 8 and 15). The most
extreme discrepancies in specialty-specific morbidity rates were observed in the
gastrointestinal domain on day three (20.1% for orthopaedic surgery versus
91.1% for general surgery and 51.0% for urological surgery).
The five categories of morbidity that occurred with relatively high prevalence
(>25% frequency at one or more postoperative time point) followed consistent
patterns across specialties. For the gastrointestinal, pulmonary and pain domains,
morbidity prevalence was general > urology > orthopaedic surgery for all PODs.
For the renal domain morbidity prevalence was urology > general > orthopaedic
surgery for all PODs. For the infection domain morbidity prevalence was urology >
general > orthopaedic on PODs 3,5 and 15 but not on POD 8.
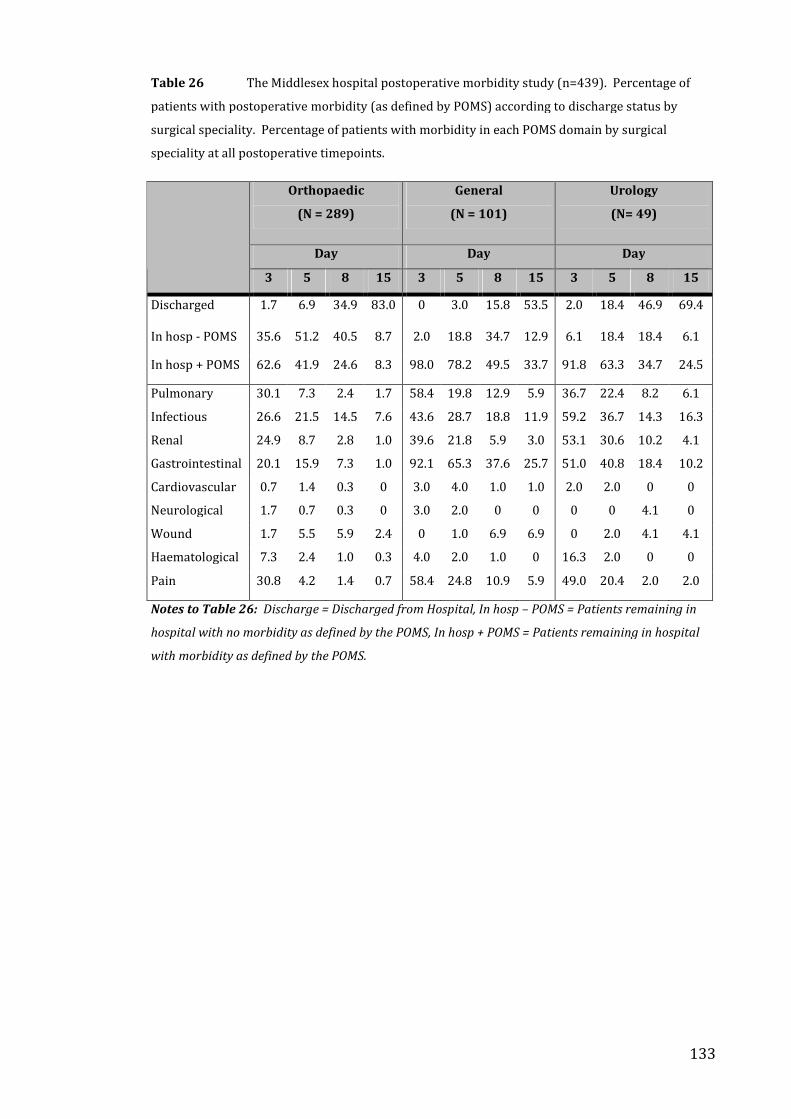
133
Table 26 The Middlesex hospital postoperative morbidity study (n=439). Percentage of
patients with postoperative morbidity (as defined by POMS) according to discharge status by
surgical speciality. Percentage of patients with morbidity in each POMS domain by surgical
speciality at all postoperative timepoints.
Orthopaedic
(N = 289)
General
(N = 101)
Urology
(N= 49)
Day Day Day
3 5 8 15 3 5 8 15 3 5 8 15
Discharged 1.7 6.9 34.9 83.0 0 3.0 15.8 53.5 2.0 18.4 46.9 69.4
In hosp - POMS 35.6 51.2 40.5 8.7 2.0 18.8 34.7 12.9 6.1 18.4 18.4 6.1
In hosp + POMS 62.6 41.9 24.6 8.3 98.0 78.2 49.5 33.7 91.8 63.3 34.7 24.5
Pulmonary 30.1 7.3 2.4 1.7 58.4 19.8 12.9 5.9 36.7 22.4 8.2 6.1
Infectious 26.6 21.5 14.5 7.6 43.6 28.7 18.8 11.9 59.2 36.7 14.3 16.3
Renal 24.9 8.7 2.8 1.0 39.6 21.8 5.9 3.0 53.1 30.6 10.2 4.1
Gastrointestinal 20.1 15.9 7.3 1.0 92.1 65.3 37.6 25.7 51.0 40.8 18.4 10.2
Cardiovascular 0.7 1.4 0.3 0 3.0 4.0 1.0 1.0 2.0 2.0 0 0
Neurological 1.7 0.7 0.3 0 3.0 2.0 0 0 0 0 4.1 0
Wound 1.7 5.5 5.9 2.4 0 1.0 6.9 6.9 0 2.0 4.1 4.1
Haematological 7.3 2.4 1.0 0.3 4.0 2.0 1.0 0 16.3 2.0 0 0
Pain 30.8 4.2 1.4 0.7 58.4 24.8 10.9 5.9 49.0 20.4 2.0 2.0
Notes to Table 26: Discharge = Discharged from Hospital, In hosp – POMS = Patients remaining in
hospital with no morbidity as defined by the POMS, In hosp + POMS = Patients remaining in hospital
with morbidity as defined by the POMS.
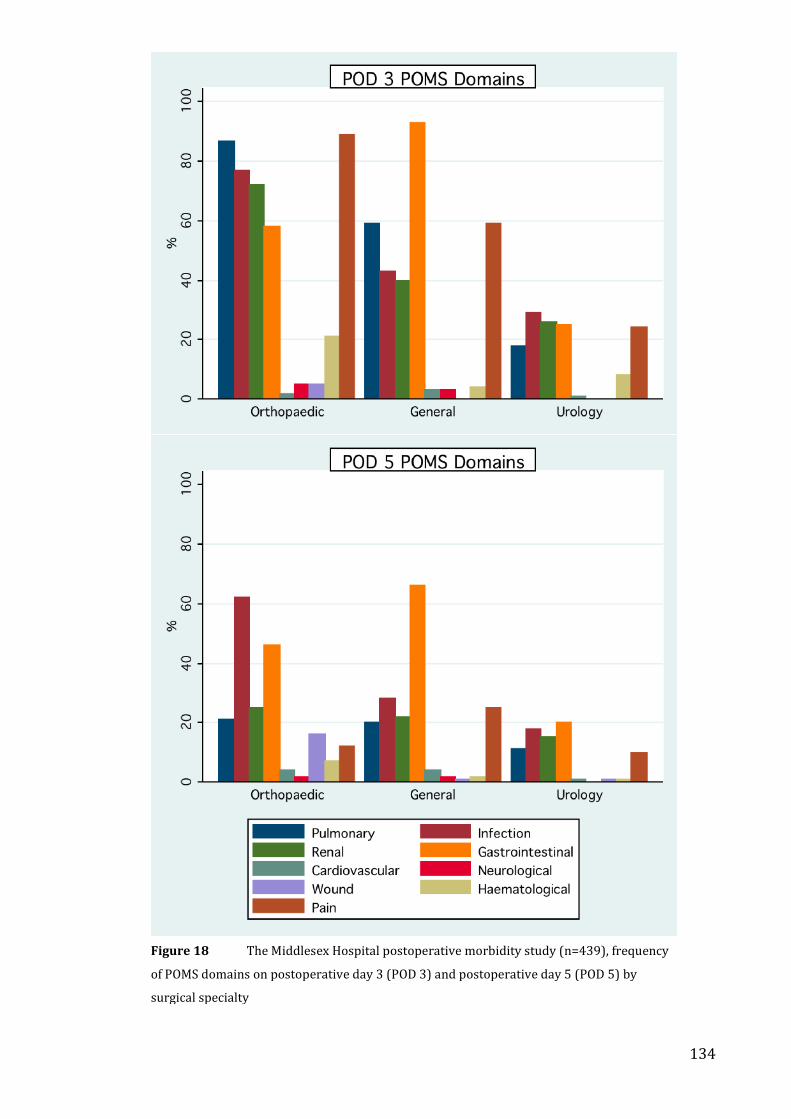
134
Figure 18 The Middlesex Hospital postoperative morbidity study (n=439), frequency
of POMS domains on postoperative day 3 (POD 3) and postoperative day 5 (POD 5) by
surgical specialty
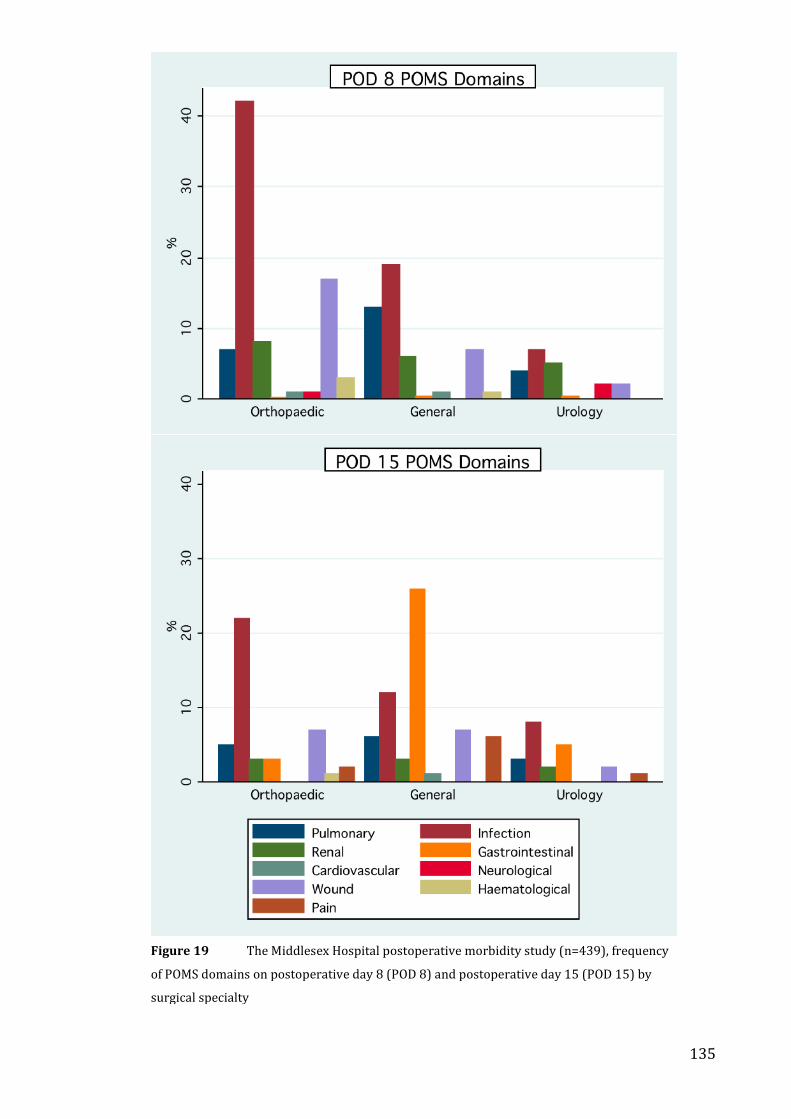
135
Figure 19 The Middlesex Hospital postoperative morbidity study (n=439), frequency
of POMS domains on postoperative day 8 (POD 8) and postoperative day 15 (POD 15) by
surgical specialty
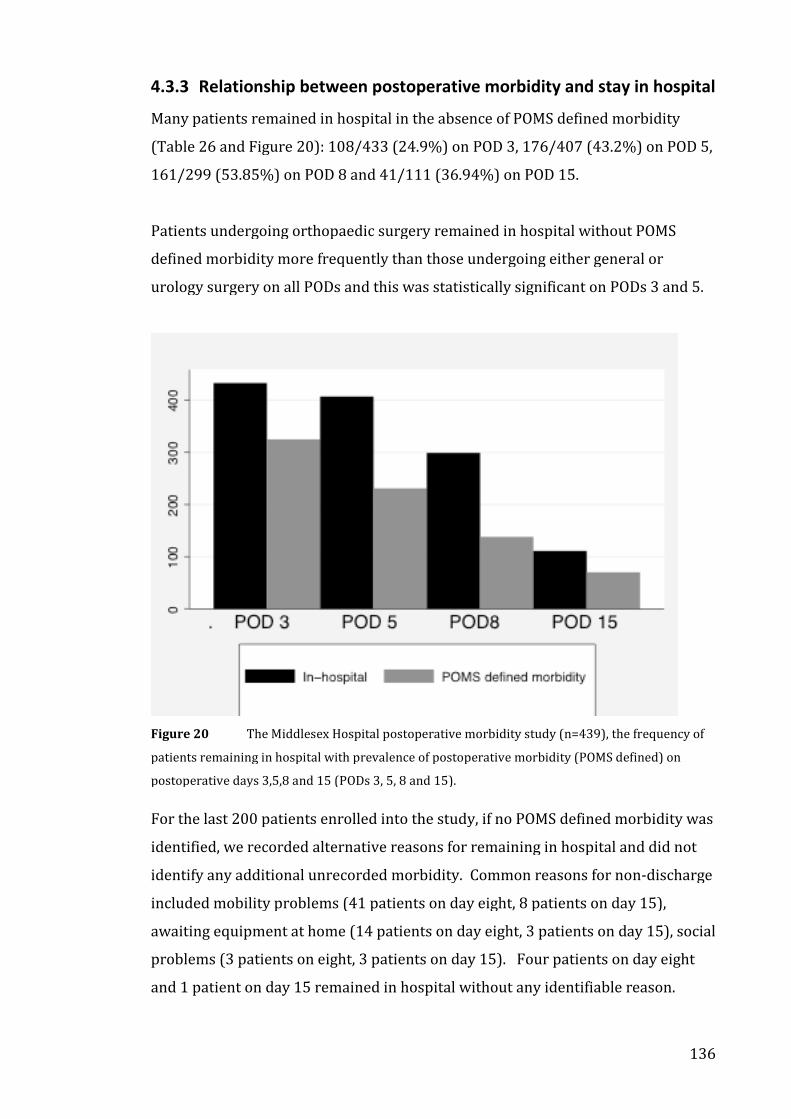
136
4.3.3 Relationship between postoperative morbidity and stay in hospital
Many patients remained in hospital in the absence of POMS defined morbidity
(Table 26 and Figure 20): 108/433 (24.9%) on POD 3, 176/407 (43.2%) on POD 5,
161/299 (53.85%) on POD 8 and 41/111 (36.94%) on POD 15.
Patients undergoing orthopaedic surgery remained in hospital without POMS
defined morbidity more frequently than those undergoing either general or
urology surgery on all PODs and this was statistically significant on PODs 3 and 5.
Figure 20 The Middlesex Hospital postoperative morbidity study (n=439), the frequency of
patients remaining in hospital with prevalence of postoperative morbidity (POMS defined) on
postoperative days 3,5,8 and 15 (PODs 3, 5, 8 and 15).
For the last 200 patients enrolled into the study, if no POMS defined morbidity was
identified, we recorded alternative reasons for remaining in hospital and did not
identify any additional unrecorded morbidity. Common reasons for non-discharge
included mobility problems (41 patients on day eight, 8 patients on day 15),
awaiting equipment at home (14 patients on day eight, 3 patients on day 15), social
problems (3 patients on eight, 3 patients on day 15). Four patients on day eight
and 1 patient on day 15 remained in hospital without any identifiable reason.
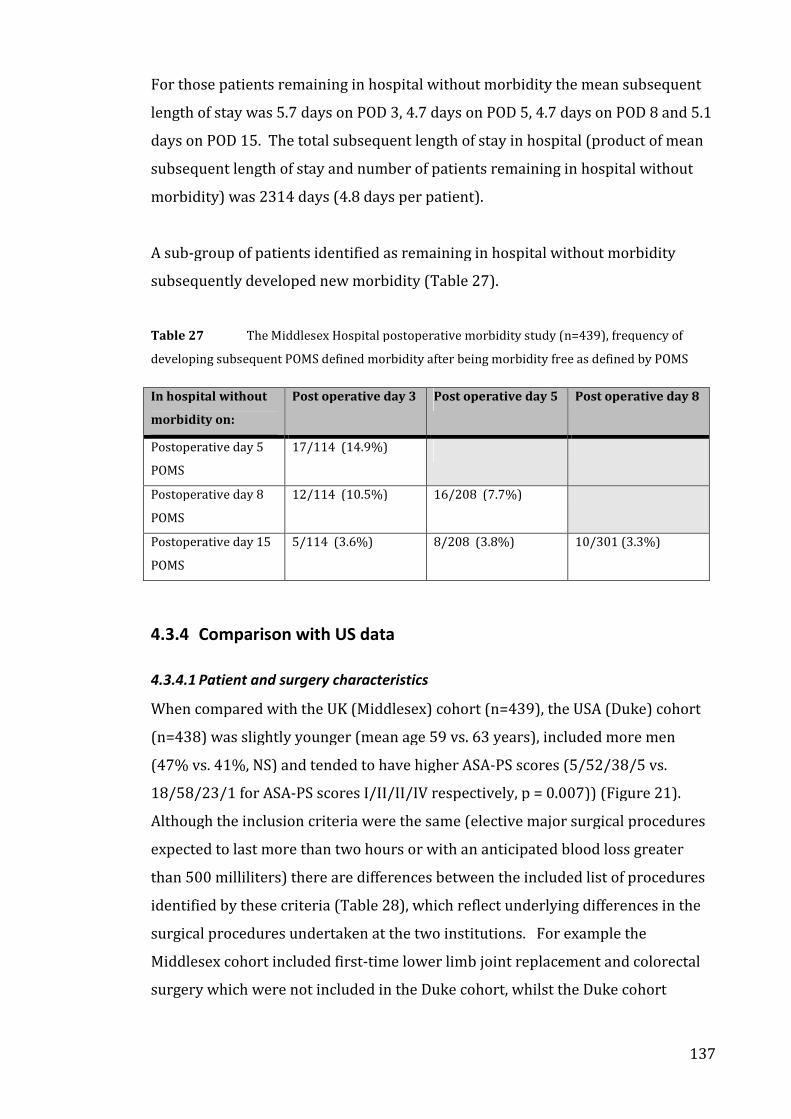
137
For those patients remaining in hospital without morbidity the mean subsequent
length of stay was 5.7 days on POD 3, 4.7 days on POD 5, 4.7 days on POD 8 and 5.1
days on POD 15. The total subsequent length of stay in hospital (product of mean
subsequent length of stay and number of patients remaining in hospital without
morbidity) was 2314 days (4.8 days per patient).
A sub-group of patients identified as remaining in hospital without morbidity
subsequently developed new morbidity (Table 27).
Table 27 The Middlesex Hospital postoperative morbidity study (n=439), frequency of
developing subsequent POMS defined morbidity after being morbidity free as defined by POMS
In hospital without
morbidity on:
Post operative day 3 Post operative day 5 Post operative day 8
Postoperative day 5
POMS
17/114 (14.9%)
Postoperative day 8
POMS
12/114 (10.5%) 16/208 (7.7%)
Postoperative day 15
POMS
5/114 (3.6%) 8/208 (3.8%) 10/301 (3.3%)
4.3.4 Comparison with US data
4.3.4.1 Patient and surgery characteristics
When compared with the UK (Middlesex) cohort (n=439), the USA (Duke) cohort
(n=438) was slightly younger (mean age 59 vs. 63 years), included more men
(47% vs. 41%, NS) and tended to have higher ASA-PS scores (5/52/38/5 vs.
18/58/23/1 for ASA-PS scores I/II/II/IV respectively, p = 0.007)) (Figure 21).
Although the inclusion criteria were the same (elective major surgical procedures
expected to last more than two hours or with an anticipated blood loss greater
than 500 milliliters) there are differences between the included list of procedures
identified by these criteria (Table 28), which reflect underlying differences in the
surgical procedures undertaken at the two institutions. For example the
Middlesex cohort included first-time lower limb joint replacement and colorectal
surgery which were not included in the Duke cohort, whilst the Duke cohort
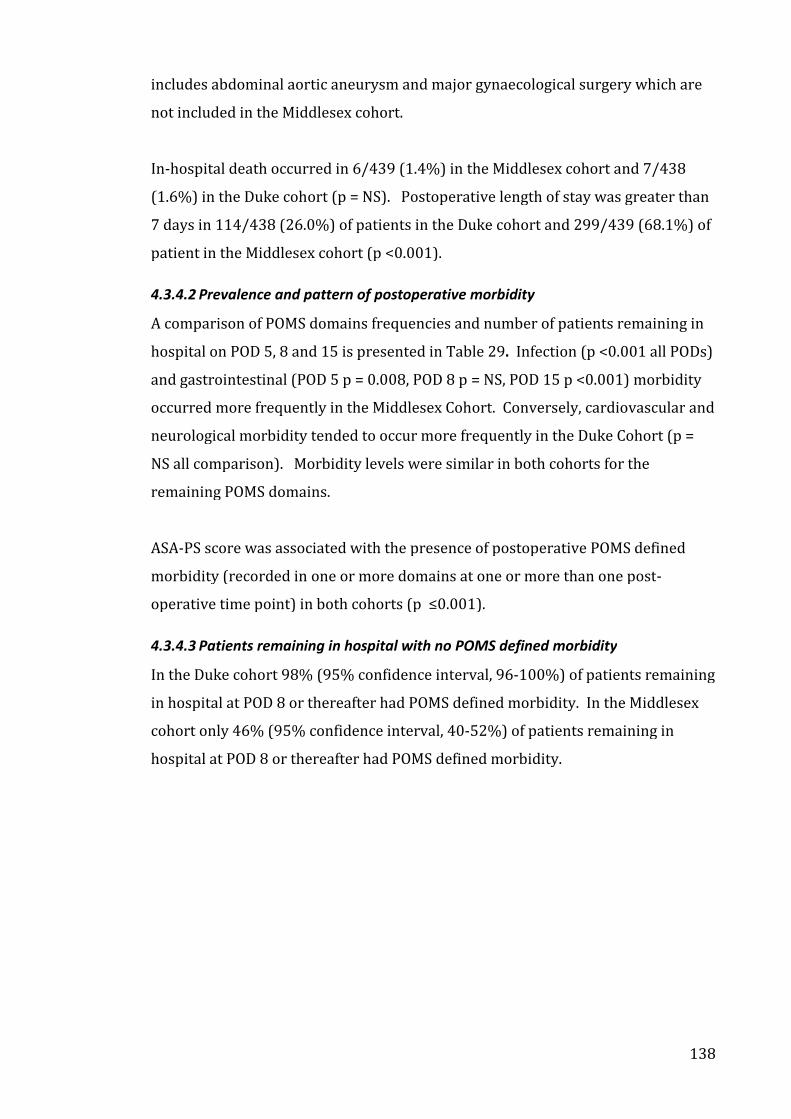
138
includes abdominal aortic aneurysm and major gynaecological surgery which are
not included in the Middlesex cohort.
In-hospital death occurred in 6/439 (1.4%) in the Middlesex cohort and 7/438
(1.6%) in the Duke cohort (p = NS). Postoperative length of stay was greater than
7 days in 114/438 (26.0%) of patients in the Duke cohort and 299/439 (68.1%) of
patient in the Middlesex cohort (p <0.001).
4.3.4.2 Prevalence and pattern of postoperative morbidity
A comparison of POMS domains frequencies and number of patients remaining in
hospital on POD 5, 8 and 15 is presented in Table 29. Infection (p <0.001 all PODs)
and gastrointestinal (POD 5 p = 0.008, POD 8 p = NS, POD 15 p <0.001) morbidity
occurred more frequently in the Middlesex Cohort. Conversely, cardiovascular and
neurological morbidity tended to occur more frequently in the Duke Cohort (p =
NS all comparison). Morbidity levels were similar in both cohorts for the
remaining POMS domains.
ASA-PS score was associated with the presence of postoperative POMS defined
morbidity (recorded in one or more domains at one or more than one post-
operative time point) in both cohorts (p ≤0.001).
4.3.4.3 Patients remaining in hospital with no POMS defined morbidity
In the Duke cohort 98% (95% confidence interval, 96-100%) of patients remaining
in hospital at POD 8 or thereafter had POMS defined morbidity. In the Middlesex
cohort only 46% (95% confidence interval, 40-52%) of patients remaining in
hospital at POD 8 or thereafter had POMS defined morbidity.
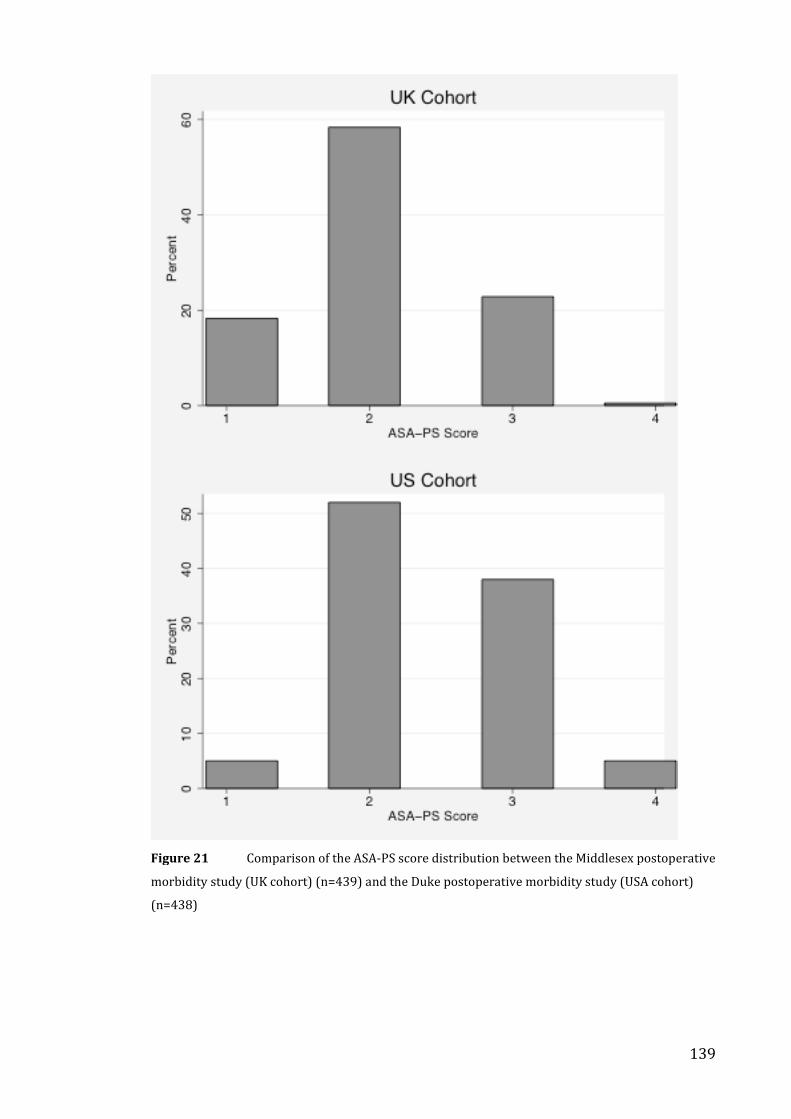
139
Figure 21 Comparison of the ASA-PS score distribution between the Middlesex postoperative
morbidity study (UK cohort) (n=439) and the Duke postoperative morbidity study (USA cohort)
(n=438)
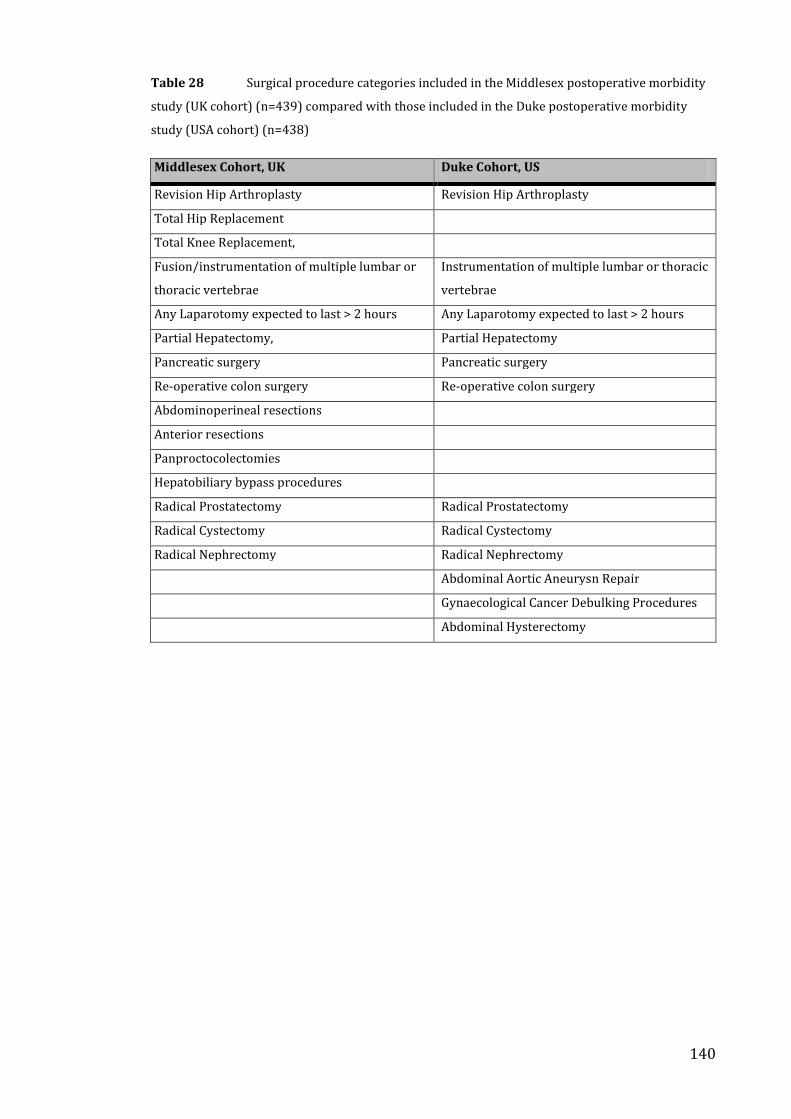
140
Table 28 Surgical procedure categories included in the Middlesex postoperative morbidity
study (UK cohort) (n=439) compared with those included in the Duke postoperative morbidity
study (USA cohort) (n=438)
Middlesex Cohort, UK Duke Cohort, US
Revision Hip Arthroplasty Revision Hip Arthroplasty
Total Hip Replacement
Total Knee Replacement,
Fusion/instrumentation of multiple lumbar or
thoracic vertebrae
Instrumentation of multiple lumbar or thoracic
vertebrae
Any Laparotomy expected to last > 2 hours Any Laparotomy expected to last > 2 hours
Partial Hepatectomy, Partial Hepatectomy
Pancreatic surgery Pancreatic surgery
Re-operative colon surgery Re-operative colon surgery
Abdominoperineal resections
Anterior resections
Panproctocolectomies
Hepatobiliary bypass procedures
Radical Prostatectomy Radical Prostatectomy
Radical Cystectomy Radical Cystectomy
Radical Nephrectomy Radical Nephrectomy
Abdominal Aortic Aneurysn Repair
Gynaecological Cancer Debulking Procedures
Abdominal Hysterectomy
141
Table 29 Comparison of POMS domain frequencies and the number of patients remaining in
hospital on postoperative days 5, 8 and 15 between the Middlesex postoperative morbidity study
(UK cohort) (n=439) and the Duke postoperative morbidity study (USA cohort) (n=438)
Postoperative Day 5 Postoperative Day 8 Postoperative Day 15
UK US P UK US P UK US P
In Hospital 407 176 <0.001 299 114 <0.001 111 21 <0.001
Pulmonary 52 30 0.011 24 29 0.473 14 6 0.071
Infectious 109 20 <0.001 68 15 <0.001 42 9 <0.001
Renal 62 46 0.103 19 24 0.430 8 4 0.246
Gastrointestinal 132 97 0.008 68 58 0.343 34 11 <0.001
Cardiovascular 9 16 0.154 2 10 0.020 1 3 NA
Neurological 4 25 <0.001 3 11 0.031 0 1 NA
Wound 18 5 0.006 26 14 0.053 16 5 0.015
Haematological 10 14 0.405 4 18 0.002 1 3 NA
Pain 47 40 0.436 16 25 0.148 9 2 0.034
Only two patients in the Duke Cohort remained in hospital without morbidity on
POD 8 or POD 15; one was awaiting commencement of chemotherapy and one was
awaiting a diagnostic test. This contrasts with 181 patients in the Middlesex
Cohort who remained in hospital without morbidity on POD8 or POD15 (or both);
reasons for remaining in hospital are reported in Section 4.3.3 (above). No patient
in the Duke Cohort had morbidity on POD 15 that had been morbidity free on POD
8. Readmissions were not reported in either study.
4.4 Discussion
4.4.1 Summary of findings
In this first use of the POMS in a UK setting, gastrointestinal, infectious, pain-
related, pulmonary and renal problems were the most common sources of
morbidity following major surgery. Many patients remained in hospital despite
having no morbidity, but no patient free of morbidity as defined by the POMS was
found to have a morbidity-related reason for remaining in hospital: the POMS
captured all relevant morbidity in in-patients. A variety of non-medical reasons
were identified as being responsible for prolonged hospital stay. Morbidity levels
were lowest in patients undergoing orthopaedic surgery but these patients were
also more likely to remain in hospital without any form of morbidity.
142
4.4.2 Epidemiology of POMS defined morbidity
The epidemiology of postoperative morbidity observed in this study reflects the
health of the study population, the nature and severity of the surgery undertaken
and the definitions of morbidity used.
Although patients undergoing orthopaedic surgery were marginally older and less
fit than patients undergoing urological or general surgery this was not reflected in
the overall prevalence of morbidity for the three surgical groups. The differences
in overall morbidity levels between surgical groups seem predominantly to reflect
severity of surgery as indicated by differences in the Operative Severity Score of
the POSSUM and differences in the duration of surgery. POSSUM operative
severity score, and therefore POSSUM predicted morbidity level, and duration of
surgery were all greatest in patients undergoing general surgery, less in patients
undergoing urological surgery and substantially lower in patients undergoing
orthopaedic surgery. Interestingly, estimated intraoperative blood loss, which has
previously been used as an index of severity of surgery, was similar for
orthopaedic and general surgery but greater for urological surgery.
Whilst severity of surgery is reflected in the overall prevalence of morbidity, the
nature of surgery is reflected in the pattern of morbidity. For example
gastrointestinal morbidity was observed most frequently following general
surgery (operation directly involving gastrointestinal tract) and least frequently
following orthopaedic surgery (operation site remote from the gastrointestinal
tract) whereas renal morbidity occurred most commonly following urological
surgery. The interaction between severity of surgery and type of surgery follows a
predictable pattern: within each specialty the pattern of morbidity is consistent
but the prevalence of each type of morbidity increases in proportion to operative
severity.
4.4.3 Comparison with other postoperative morbidity estimates in the
literature
Estimates of morbidity prevalence are always contingent on the population under
study and the definitions used. Previous reports have classified postoperative
morbidity using alternative approaches to that taken by the POMS. They have
143
commonly focused on defined diagnoses (e.g. Deep Venous Thrombosis) 68 rather
than looking to capture all morbidity relevant to patients. They have often not
recorded morbidity that did not fit into this type of diagnostic categorization (e.g.
failure to tolerate enteral feed). As an example, comparison with other studies
assessing pain is difficult because I used an operational definition for presence or
absence of pain at predefined times whereas most pain studies use objective
testing methods (e.g. visual analog scores) 295-297 and/or cumulative recording (e.g.
total morphine usage) 295,298-299 yielding continuous variables rather than a point
prevalence. Additionally most previous studies which have recorded
postoperative morbidity have not collected data such as POSSUM scores that
would permit risk adjustment and meaningful comparison with this study.
Recognizing these limitations, it seems that relationships between different
categories of morbidity and length of stay observed in my study are broadly
consistent with previous reports. Pain and gastrointestinal dysfunction were
common and associated with prolonged duration of stay in hospital. In a day
surgery setting prolonged length of stay was associated with postoperative nausea
and vomiting, dizziness, drowsiness, pain and cardiovascular events 300. Other
studies of outcome following surgery have shown that delayed enteral feeding is
not uncommon following gastrointestinal 174,260 or non-gastrointestinal surgery 301.
A study of outcome following gastroenterological surgery in patients having lower
risk operations than were included in my study found 13.9% (70/503) of patients
had delayed oral intake (still receiving iv fluids > 1 week after surgery owing to
postoperative ileus) 302. This is comparable to the day 8 GI morbidity of 37.3%
(inability to tolerate enteral diet) reported in my study. However it is notable that
in our study gastrointestinal morbidity, which is by definition distressing to the
patient (unable to tolerate enteral diet), is not uncommon (> 15% on POD3 and
POD5) even following orthopaedic surgery. This suggests that much of this type of
morbidity is not simply related to direct disturbance of the gastrointestinal tract
but may be associated with the overall physiological disturbance consequent upon
major surgery of any type: it is likely to be a marker of the whole body response to
injury rather than a specific local effect. Previous attempts at recording
perioperative outcome have often not recorded this dimension of patient
144
morbidity or have recorded “postoperative ileus” 303, a much less clearly defined
outcome 304.
In my study the wound domain was not strongly associated with increased length
of stay and occurred less frequently amongst those with a greater preoperative
risk as defined by ASA grade of POSSUM. This finding was consistent across
surgical sub-groups. This is in contrast to previous epidemiological 305 and case-
matching 306,307,308 studies which have reported clinically significant “attributable”
increases in length of stay associated with surgical site infection (SSI). The lack of
association in my study is striking because the POMS definition of wound
morbidity has a stricter criterion than many other reports with the result that the
POMS should only identify the most serious or severe wound morbidity. However
this is not universally reported: a case series of patients following colorectal
surgery did not demonstrate an association between SSI and length of hospital stay
using multiple regression analysis 309.
Both cardiac and neurological domains occur infrequently (<5%) in all types of
surgery. Although cardiac risks are commonly perceived to be greater my results
are consistent with large-scale surveys of the risk of major cardiac complications
in non-cardiac surgery 124,310-312 but lower than levels identified if intensive
monitoring techniques (e.g. continuous ECG monitoring for ST depression) 313 or
biochemical tests 314 (e.g. Troponin T) are used.
4.4.4 POMS and stay in hospital (bed occupancy)
The observation that patients remain in hospital in the absence of a clinical
indication is not new 315-322. A recent UK report of post-operative bed occupancy
reported that 31% of patients were occupying beds inappropriately 323. Although
the POMS was not designed as a bed utilisation review tool the striking difference
in prevalence of “morbidity-free” days between the Middlesex and Duke cohorts
discussed below suggests contrasting levels of “appropriate” bed use and
emphasizes the potential for improvements in discharge efficiency in the UK
hospital. Shorter hospital stay as a result of improved discharge efficiency will
reduce cost per patient and increase patient throughput. Screening for
postoperative morbidity using the POMS may be useful to identify patients
145
remaining in acute hospital beds unnecessarily. The POMS may have utility as a
tool for recording bed occupancy and for modelling bed utilisation.
4.4.5 Comparison between the Middlesex (UK) and Duke (US) Cohorts
Our study also provides an opportunity for direct comparison of outcome
following major surgery between a UK and a US institution 172. The pattern and
prevalence of morbidity was very similar but the relationship between morbidity
and bed occupancy was not: nearly all (> 98%) patients remaining in hospital in
the US hospital had identifiable morbidity 172 whereas many patients (54% on day
8) in the UK hospital did not.
The comparison between the Middlesex and Duke cohorts may provide interesting
insights into differences between two contrasting systems of care. The Middlesex
cohort tended to have higher levels of morbidity than the Duke cohort despite a
lower level of risk according to the ASA-PS scores. The general pattern of
morbidity was similar for the two cohorts. Overall, gastrointestinal, pulmonary,
renal and pain tended to more common whereas cardiovascular, neurological,
haematology and wound morbidity tended to be less common (never > 6% of total
patients). Comparing the two cohorts, wound morbidity tended to more common
in the Middlesex Cohort whilst neurological, cardiovascular and haematology
morbidity tended to be more common in the Duke cohort. The most striking
findings were that patients in the Middlesex cohort were more likely to remain in
hospital (> 2 fold difference, p <0.001, all PODs), more likely to remain in hospital
in the absence of POMS defined morbidity (>20 fold difference, p <0.001, PODs 8
and 15) and had a higher prevalence of infection morbidity (> 4 fold difference, p
<0.001, all PODs) when compared with the Duke cohort.
Whilst inter-cohort variation in distribution of surgical specialty, operation types
and risk (ASA-PS score) may contribute to these observed differences, it is unlikely
that they provide a full explanation, given the broad similarity in overall morbidity
and mortality levels. The difference in infection morbidity may reflect a true
difference in rates of infection or might result from differences in prescribing
practice. The POMS criteria for infection morbidity are either “Currently on
antibiotics..” or “..temperature >38C in the last 24 hours.” If clinicians attending
the Middlesex cohort had a lower threshold for prescription of antibiotics they
146
might elevate the measured level of infection morbidity in the absence of a true
difference. However the higher prevalence of wound morbidity (p <0.05 on POD 5
and 15, p = 0.053 on POD 8) is suggestive that at least some of the observed
difference in infection prevalence may represent a true infection morbidity signal.
The striking differences between length of hospital stay and the much greater
number of patients in the Middlesex cohort who remain in hospital without POMS
defined morbidity are strongly suggestive of differences in the way that care is
delivered. In the cost driven healthcare environment of a “private” (non-state) US
hospital discharge policies seem to be substantially more efficient than in the NHS
institution. However identifying these differences as solely due to efficiency
differences, depends on the assumption that once patients become morbidity free
they are fit for discharge home and will not subsequently develop “new” morbidity.
The reoccurrence of morbidity in some patients in the Middlesex cohort who
remained in hospital whilst free of morbidity challenges this assumption.
Unfortunately hospital readmission rates are not available from either study. It is
therefore uncertain whether patients who had been discharged home
subsequently developed morbidity meeting POMS criteria, thereby suggesting that
their discharge may have been premature. Comparisons between UK and US
institutions are not common in the literature. A comparison between UK (Queen
Alexander Hospital and St Mary’s Hospital, Portsmouth Hospitals NHS Trust,
Portsmouth, UK) and US (Mount Sinai Hospital, New York, NY, USA) institutions
suggested a four-fold difference in POSSUM risk adjusted mortality following
major surgery in large (>1000 patient) cohorts 19. Consistent with this (but with a
smaller effect magnitude), a risk-adjusted comparison of outcome following liver
transplant surgery between UK (> 5000 patients) and US (>40000 patients)
cohorts showed increased early (<90 days) mortality in the UK cohort (hazard
ratio 1.17; 95% CI 1.07 to 1.29) 324. Interestingly however, there was no mortality
difference between 90 days and 1 year, and a trend towards reduced mortality in
the UK cohort after > 1 year 324. In the Middlesex POMS study, mortality was
similar to that observed in the Duke cohorts, although ASA-PS scores were
significantly higher in the Duke cohort. Further studies utilizing direct prospective
comparisons across several centres within each system may illuminate differences
in patterns of outcome and delivery of care of potential benefit to both systems.
147
Such data could be obtained simply, by harmonizing perioperative datasets for
institutions in different environments.
4.4.6 Limitations of POMS and this study
A potential weakness of this study is uncertain generalisability. We focused on
adult orthopaedic, general and urological surgery and our study was limited to one
UK teaching hospital. However, a similar prevalence study (using identical
recruitment criteria for the same types of surgery) in a US teaching hospital found
a similar pattern and levels of morbidity 172. We have not demonstrated that the
POMS is a valid index of morbidity for other types of surgery (e.g. vascular surgery,
cardiac surgery and paediatric surgery). We would expect to see distinct patterns
of morbidity in these groups reflecting different patterns of surgical injury and
underlying disease. In some cases specific comorbidities are associated with
underlying risk factors for the problem requiring surgery (e.g. increased level of
ischaemic cardiac disease in patients undergoing surgery for peripheral vascular
disease). Separate work is underway on the development of alternative versions
of the POMS that are specific to cardiac and paediatric surgery. Strengths and
limitations of the POMS that relate to the criteria for individual POMS domains and
the validity of the POMS as a measure of postoperative morbidity are discussed in
Chapter 5.
4.5 Summary
1. The POMS identified gastrointestinal, infectious, pain-related, pulmonary
and renal problems as the most common sources of morbidity following major
surgery in a UK setting. The type and severity of surgery was reflected in the
frequency and pattern of POMS defined postoperative morbidity.
2. Many patients remained in hospital despite absence of post-operative
morbidity as defined by the POMS. Screening for post-operative morbidity using
the POMS may be useful to identify patients remaining in acute hospital beds
unnecessarily. The POMS may have utility as a tool for recording bed occupancy
and for modelling bed utilisation.
3. Comparison between similar UK and US cohorts highlights striking
differences in delivery of care and outcome that merit further investigation.
148
CHAPTER 5: Validation of the POMS in adults
5.1 Introduction
This chapter describes the validation of the POMS as a descriptor of Postoperative
Morbidity using a clinimetric approach. First inter-observer reliability of the
POMS was explored: reliability of a measure is a pre-requisite for validity. Second,
the extent to which the nine domains of the POMS represent a single underlying
construct was tested to establish whether further development of a score (based
on a sum, or weighted sum, of POMS domains) was appropriate. Third, in the
absence of a criterion “gold standard”, construct validity of the POMS was explored
for individuals POMS domains, and the presence or absence of POMS defined
morbidity. Testing for construct validity involves the testing of hypotheses
relating to the definition of the measure under consideration e.g. patients in
groups known to be at greater risk of postoperative complications would have a
higher frequency of POMS defined morbidity; patients with POMS defined
morbidity would be expected to stay in hospital longer than those without. Finally
the results of this validation analysis are discussed along with the implications of
these findings.
5.2 Methods
5.2.1 Overview
Recruitment of the validation cohort and data collection methods are described in
detail in Chapter 4 along with patient characteristics and a quantitative description
of the patterns of morbidity. In this chapter I report the acceptability to patients
of the data collection process, reliability of the collected data, and the validity of
the Postoperative Morbidity Survey as a descriptor of morbidity following major
surgery.
5.2.2 Acceptability
No formal approach to assessing acceptability to patients was undertaken. Both
research nurses noted acceptability of the POMS to patients separately.
149
5.2.3 Reliability
Thirty-four patients were administered the POMS by both research nurses to
assess inter-rater reliability. Inter-rater reliability was analysed using the Kappa
coefficient of agreement 325.
5.2.4 Scaling properties
In order to establish whether or not it was acceptable to evaluate a Post-Operative
Morbidity Score derived from the POMS (by summing the POMS domains) the
internal consistency of the POMS domains was explored using the Kuder-
Richardson formula 20 (KR20) 202. This test examines the extent to which the nine
POMS domains measure a single unidimensional underlying construct (internal
consistency) by covariance. Internal consistency was evaluated on POD 3, 5, 8 and
15. A criterion of 0.7 was accepted as indicating adequate internal consistency for
further development of a score 325.
5.2.5 Validity: Construct validity
The predictive validity of POMS was explored first on a univariate basis using t-
tests to compare the mean subsequent length of stay of patients with and without
POMS-defined morbidity. A multivariate linear regression analysis was then
performed to determine the independent predictive strength of each POMS
domain: the raw differences in length of stay, between patients with and without
morbidity on each POMS domain, were adjusted to take account of morbidity in
other domains.
To test ‘known-groups’ construct validity the extent to which POMS domain
frequencies were higher in patients with a greater risk of post-operative morbidity
was examined: patients with preoperative ASA-PS score I and II were compared
with patients with ASA-PS scores III and IV using chi-squared tests. Chi-square
tests were also used to compare POMS domain frequencies in patients with < 50%
risk of post-operative morbidity (as defined by the POSSUM assessment) with
those with ≥ 50% risk.
150
5.2.6 Statistical Approach
All p values are 2-sided and p values lower than 0.05 were considered statistically
significant. Stata/IC software (Release 10.0) [StataCorp, TX, USA] was used for all
calculations.
5.3 Results
5.3.1 Summary of findings
Within the limits of the available data the POMS was found to be acceptable to
patients and reliable. The scaling properties of the POMS (internal consistency)
precluded further development of a “POMS score”. The POMS was found to be a
valid measure of postoperative morbidity based on hypothesis testing of “known-
groups” differences and the association of POMS defined morbidity with
subsequent length of hospital stay (predictive validity). All results are presented
for POD5 followed by a comparison with PODs 3, 8 and 15. At POD5 recorded
morbidity was considered likely to be “real” rather than due to “routine” care
(which may occur at earlier measurement points). However, on POD 5 a majority
of patients remain in hospital with morbidity (in the validation cohort) resulting in
optimal statistical power to discriminate between “known groups”.
5.3.2 Acceptability
Acceptability to patients was subjectively reported by the research nurses to be
good. Specifically they commented that that there was little or no dissatisfaction
among patients during POMS administration and that the patients appreciated
their visits and used them as an opportunity to talk about problems and concerns.
5.3.3 Reliability
Inter-rater agreement for 11 items was perfect (Kappa = 1.0), with Kappa = 0.94
for six further items. Agreement was slightly lower on one item (assessment of
nausea, vomiting or abdominal distension; Kappa = 0.71) and a more precise
definition, which included the prescription of anti-emetics as a criterion, was
subsequently adopted.
5.3.4 Scaling properties – internal consistency
The internal consistency values of the nine POMS domains (KR20) for PODs 3, 5, 8
and 15 are presented in Tables 30-33. KR20 coefficients for POD 3, 5, 8, and 15
151
were 0.60, 0.56, 0.49, and 0.54 respectively. Accepted minimum standards for
internal consistency (0.7) 325 were not met on any of these PODs. This indicates an
insufficient level of homogeneity among the nine POMS domains to regard the
survey as a scale addressing a unified underlying construct. Given this lack of
unidimensionality, the nine POMS domains were treated separately in subsequent
statistical analyses. In addition the dichotomous variable of “POMS defined
morbidity” was defined by the criterion that morbidity occurring in at least one
POMS domain, and analysed separately from the POMS domains.
5.3.5 Validity
5.3.5.1 Construct validity
Across all nine POMS domains, patients with morbidity on POD5 had a longer
subsequent mean length of stay than those without morbidity (Table 35). In four
domains (pulmonary, infection, gastrointestinal and pain) these differences were
statistically significant. The largest domain-specific difference was between
patients with and without pain-related morbidity (21.1 versus 7.6 days) and the
smallest was for wound-related morbidity (10.3 versus 9.2 days). When taking
account of morbidity in other domains using multivariate linear regression the
only statistically significant independent predictors of length of stay were
gastrointestinal and pain-related morbidity. On POD 5, patients with renal
morbidity tended to have a shorter adjusted subsequent length of stay than those
without.
Consistent with POD5, on PODs 3 (Table 34), 8 (Table 36), and 15 (Table 37),
patients with morbidity had a longer subsequent mean length of stay than those
without morbidity, except for two domains (wound, haematological) at POD8 and
one domain (haematological) at POD15. These differences were statistically
significant for four domains (pulmonary, infection, gastrointestinal, pain) on all
PODs, and for one additional domain (renal) on only PODs 8 and 15. The largest
domain specific differences were for neurological morbidity (18.4 versus 10.4
days) on POD3, and pain-related morbidity on POD8 (28.2 versus 7.9 days) and
POD15 (44.7 versus 9.8 days). However, in the multivariate analysis the following
domains tended to have a shorter adjusted subsequent length of stay when
morbidity was present (haematological and renal on POD 3, haematological and
152
wound on POD 8, and renal, cardiovascular, haematological and wound on POD
15).
Comparing patients with and without POMS defined morbidity (all domains),
patients with morbidity had a longer subsequent mean length of stay on POD3
(12.2 vs. 5.7 days), POD5 (12.6 vs. 4.7 days), POD8 (14.0 vs. 4.7 days and POD15
(17.1 vs. 5.1 days) (p<0.001 in all cases).
Patients in higher preoperative risk categories (ASA-PS scores III/IV and those
with ≥ 50% risk of post-operative morbidity as defined by POSSUM) tended to
have greater POMS-defined morbidity on POD 5 (Table 39) for all domains except
‘wound’. The POMS tended to discriminate more clearly between patients in lower
and higher POSSUM risk categories, than between those in lower and higher ASA-
PS score category.
On POD 3 a similar pattern was observed, the exception being that ‘haematological’
morbidity occurred less frequently in the high-risk (ASA defined) category when
compared with the low-risk (Table 38). However, several domains had a lower
level of morbidity in the high-risk compared with low-risk (POSSUM defined)
category on POD 8 (infection, cardiovascular, haematological, wound)(Table 40)
and POD 15 (pulmonary, infection, renal, heamatological, wound, pain)(Table 41).
Similarly several domains had a lower level of morbidity in the high-risk compared
with low-risk (ASA defined) category on POD 8 (haematological wound, pain) and
POD 15 (infection, gastrointestinal, cardiovascular).
Only one comparison reached statistical significance when the differences between
POMS-defined morbidity levels of patients with low and high-risk ASA-PS scores
on POD 5 were compared: patients with ASA-PS scores I or II had a lower risk of
infection morbidity than patients with ASA-PS scores III or IV. In contrast, the
same comparisons for patients with low versus high-risk of POSSUM-defined post-
operative morbidity showed significantly higher levels of POMS-defined morbidity
in the high-risk group for all but the neurological and wound domains.
153
On POD 3 pulmonary, infection and pain-related morbidity were significantly more
common in high-risk (ASA defined) than low-risk patients whilst pulmonary,
infection, renal, gastrointestinal and pain–related morbidity were significantly
more common when POSSUM morbidity risk was the criterion used to define risk
category. On PODs 8 and 15 there were no significant differences between low-
risk and high-risk patients (ASA defined) whereas when risk was defined by
POSSUM morbidity risk category, gastrointestinal and renal morbidity occurred
significantly more frequently in high-risk patients on POD 8 and gastrointestinal
morbidity was significantly more common on POD 15.
POMS defined morbidity (all domains) occurred significantly more frequently in
high-risk (POSSUM defined) compared with low-risk patients on POD 3 (96.1%
versus 69.4%), POD 5 (82.9% versus 46.3%), POD 8 (55.3% versus 26.5%) and
POD15 (43.3% versus 10.2%)(p <0.001 in all cases). However patients in the high-
risk category (ASA defined) had a significantly greater frequency of POMS defined
morbidity (all domains) than low-risk patients only on POD 3 (87.3% versus
69.9%, p = 0.002) and POD 5 (62.8% versus 50.0%, p = 0.027). On POD 8 (38.2%
versus 29.5%) and POD 15 (20.6% versus 14.8%) this difference did not reach
statistical significance.
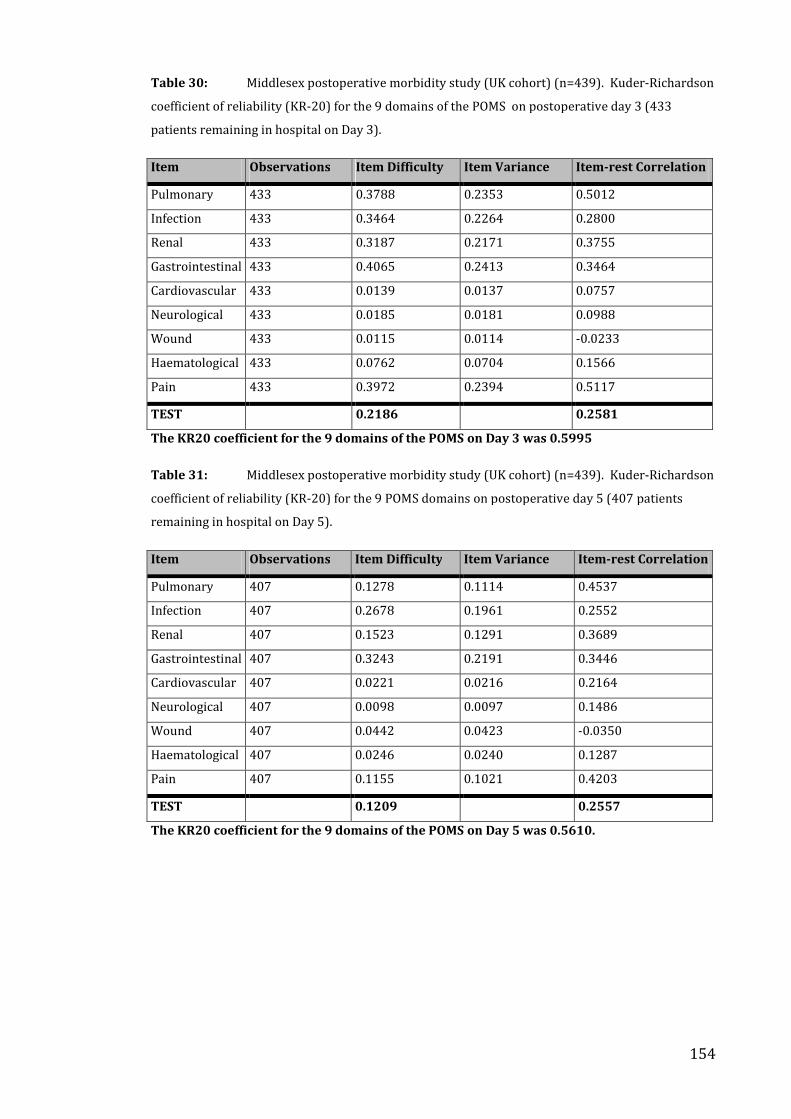
154
Table 30: Middlesex postoperative morbidity study (UK cohort) (n=439). Kuder-Richardson
coefficient of reliability (KR-20) for the 9 domains of the POMS on postoperative day 3 (433
patients remaining in hospital on Day 3).
Item Observations Item Difficulty Item Variance Item-rest Correlation
Pulmonary 433 0.3788 0.2353 0.5012
Infection 433 0.3464 0.2264 0.2800
Renal 433 0.3187 0.2171 0.3755
Gastrointestinal 433 0.4065 0.2413 0.3464
Cardiovascular 433 0.0139 0.0137 0.0757
Neurological 433 0.0185 0.0181 0.0988
Wound 433 0.0115 0.0114 -0.0233
Haematological 433 0.0762 0.0704 0.1566
Pain 433 0.3972 0.2394 0.5117
TEST 0.2186 0.2581
The KR20 coefficient for the 9 domains of the POMS on Day 3 was 0.5995
Table 31: Middlesex postoperative morbidity study (UK cohort) (n=439). Kuder-Richardson
coefficient of reliability (KR-20) for the 9 POMS domains on postoperative day 5 (407 patients
remaining in hospital on Day 5).
Item Observations Item Difficulty Item Variance Item-rest Correlation
Pulmonary 407 0.1278 0.1114 0.4537
Infection 407 0.2678 0.1961 0.2552
Renal 407 0.1523 0.1291 0.3689
Gastrointestinal 407 0.3243 0.2191 0.3446
Cardiovascular 407 0.0221 0.0216 0.2164
Neurological 407 0.0098 0.0097 0.1486
Wound 407 0.0442 0.0423 -0.0350
Haematological 407 0.0246 0.0240 0.1287
Pain 407 0.1155 0.1021 0.4203
TEST 0.1209 0.2557
The KR20 coefficient for the 9 domains of the POMS on Day 5 was 0.5610.
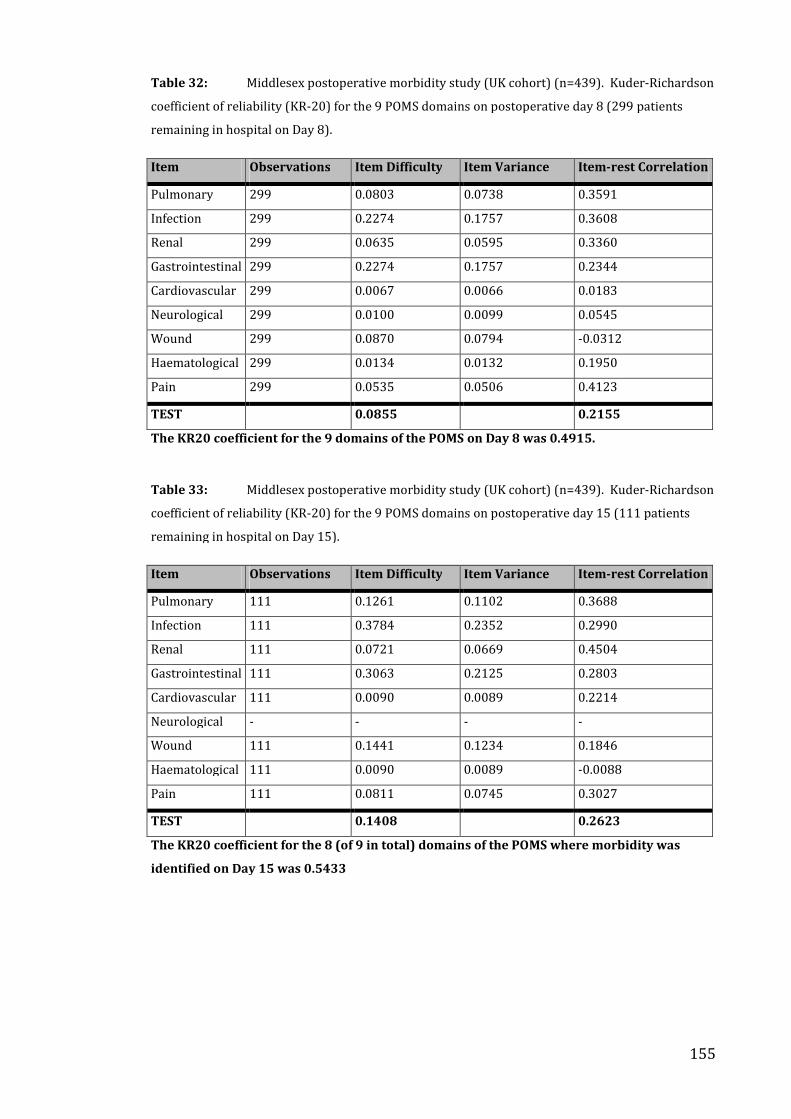
155
Table 32: Middlesex postoperative morbidity study (UK cohort) (n=439). Kuder-Richardson
coefficient of reliability (KR-20) for the 9 POMS domains on postoperative day 8 (299 patients
remaining in hospital on Day 8).
Item Observations Item Difficulty Item Variance Item-rest Correlation
Pulmonary 299 0.0803 0.0738 0.3591
Infection 299 0.2274 0.1757 0.3608
Renal 299 0.0635 0.0595 0.3360
Gastrointestinal 299 0.2274 0.1757 0.2344
Cardiovascular 299 0.0067 0.0066 0.0183
Neurological 299 0.0100 0.0099 0.0545
Wound 299 0.0870 0.0794 -0.0312
Haematological 299 0.0134 0.0132 0.1950
Pain 299 0.0535 0.0506 0.4123
TEST 0.0855 0.2155
The KR20 coefficient for the 9 domains of the POMS on Day 8 was 0.4915.
Table 33: Middlesex postoperative morbidity study (UK cohort) (n=439). Kuder-Richardson
coefficient of reliability (KR-20) for the 9 POMS domains on postoperative day 15 (111 patients
remaining in hospital on Day 15).
Item Observations Item Difficulty Item Variance Item-rest Correlation
Pulmonary 111 0.1261 0.1102 0.3688
Infection 111 0.3784 0.2352 0.2990
Renal 111 0.0721 0.0669 0.4504
Gastrointestinal 111 0.3063 0.2125 0.2803
Cardiovascular 111 0.0090 0.0089 0.2214
Neurological - - - -
Wound 111 0.1441 0.1234 0.1846
Haematological 111 0.0090 0.0089 -0.0088
Pain 111 0.0811 0.0745 0.3027
TEST 0.1408 0.2623
The KR20 coefficient for the 8 (of 9 in total) domains of the POMS where morbidity was
identified on Day 15 was 0.5433
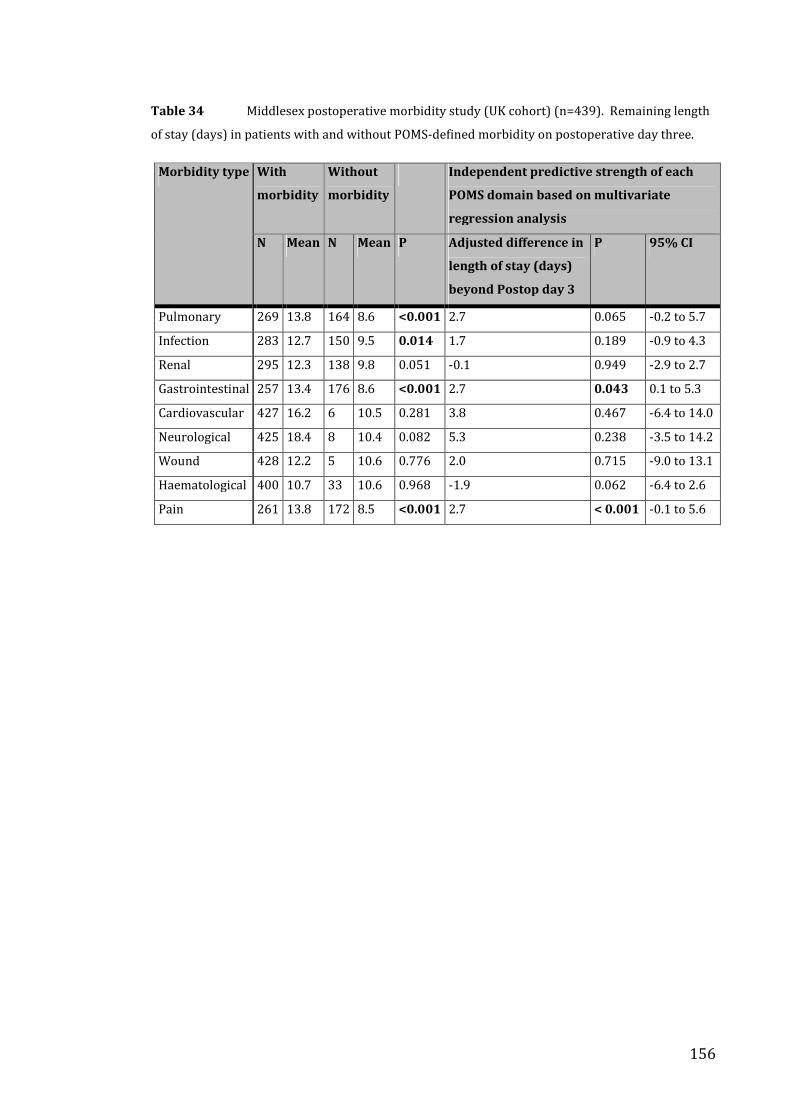
156
Table 34 Middlesex postoperative morbidity study (UK cohort) (n=439). Remaining length
of stay (days) in patients with and without POMS-defined morbidity on postoperative day three.
With
morbidity
Without
morbidity
Independent predictive strength of each
POMS domain based on multivariate
regression analysis
Morbidity type
N Mean N Mean P Adjusted difference in
length of stay (days)
beyond Postop day 3
P 95% CI
Pulmonary 269 13.8 164 8.6 <0.001 2.7 0.065 -0.2 to 5.7
Infection 283 12.7 150 9.5 0.014 1.7 0.189 -0.9 to 4.3
Renal 295 12.3 138 9.8 0.051 -0.1 0.949 -2.9 to 2.7
Gastrointestinal 257 13.4 176 8.6 <0.001 2.7 0.043 0.1 to 5.3
Cardiovascular 427 16.2 6 10.5 0.281 3.8 0.467 -6.4 to 14.0
Neurological 425 18.4 8 10.4 0.082 5.3 0.238 -3.5 to 14.2
Wound 428 12.2 5 10.6 0.776 2.0 0.715 -9.0 to 13.1
Haematological 400 10.7 33 10.6 0.968 -1.9 0.062 -6.4 to 2.6
Pain 261 13.8 172 8.5 <0.001 2.7 < 0.001 -0.1 to 5.6
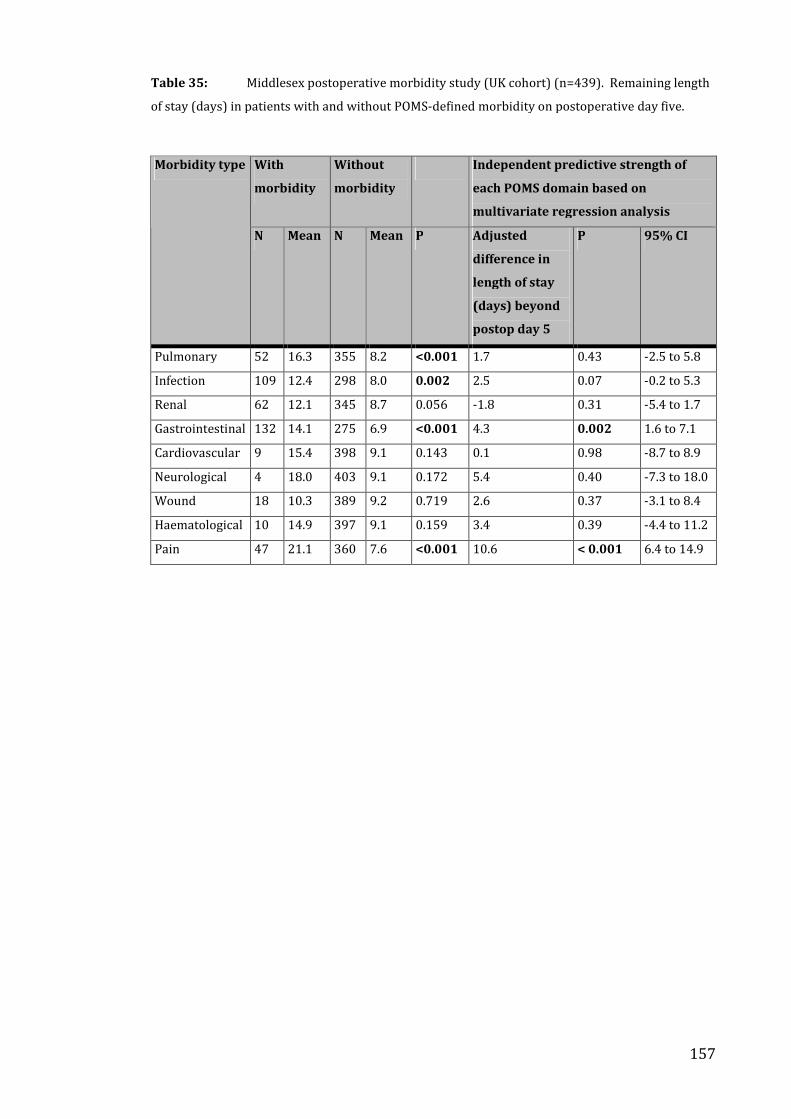
157
Table 35: Middlesex postoperative morbidity study (UK cohort) (n=439). Remaining length
of stay (days) in patients with and without POMS-defined morbidity on postoperative day five.
With
morbidity
Without
morbidity
Independent predictive strength of
each POMS domain based on
multivariate regression analysis
Morbidity type
N Mean N Mean P Adjusted
difference in
length of stay
(days) beyond
postop day 5
P 95% CI
Pulmonary 52 16.3 355 8.2 <0.001 1.7 0.43 -2.5 to 5.8
Infection 109 12.4 298 8.0 0.002 2.5 0.07 -0.2 to 5.3
Renal 62 12.1 345 8.7 0.056 -1.8 0.31 -5.4 to 1.7
Gastrointestinal 132 14.1 275 6.9 <0.001 4.3 0.002 1.6 to 7.1
Cardiovascular 9 15.4 398 9.1 0.143 0.1 0.98 -8.7 to 8.9
Neurological 4 18.0 403 9.1 0.172 5.4 0.40 -7.3 to 18.0
Wound 18 10.3 389 9.2 0.719 2.6 0.37 -3.1 to 8.4
Haematological 10 14.9 397 9.1 0.159 3.4 0.39 -4.4 to 11.2
Pain 47 21.1 360 7.6 <0.001 10.6 < 0.001 6.4 to 14.9

158
Table 36: Middlesex postoperative morbidity study (UK cohort) (n=439). Remaining length
of stay (days) in patients with and without POMS-defined morbidity on postoperative day eight.
With
morbidity
Without
morbidity
Independent predictive strength of each
POMS domain based on multivariate
regression analysis
Morbidity type
N Mean N Mean P Adjusted
difference in
length of stay
(days) beyond
Postop day 8
P 95% CI
Pulmonary 275 17.8 24 8.2 0.001 2.3 0.478 -4.0 to 8.6
Infection 231 14.0 68 7.6 <0.001 3.9 0.044 0.1 to 7.8
Renal 280 16.9 19 8.5 0.011 0.1 0.978 -6.5 to 6.7
Gastrointestinal 231 17.7 68 6.5 <0.001 7.8 <0.001 4.1 to 11.6
Cardiovascular 297 15.0 2 9.0 0.547 6.3 0.494 -11.9 to 24.5
Neurological 296 17.7 3 8.9 0.285 8.7 0.251 -6.2 to 23.5
Wound 273 7.0 26 9.2 0.455 -1.6 0.562 -6.9 to 3.8
Haematological 295 6.6 4 9.0 0.747 -12.6 0.067 -26.1 to 0.9
Pain 283 28.2 16 7.9 <0.001 14.3 <0.001 6.7 to 22.0
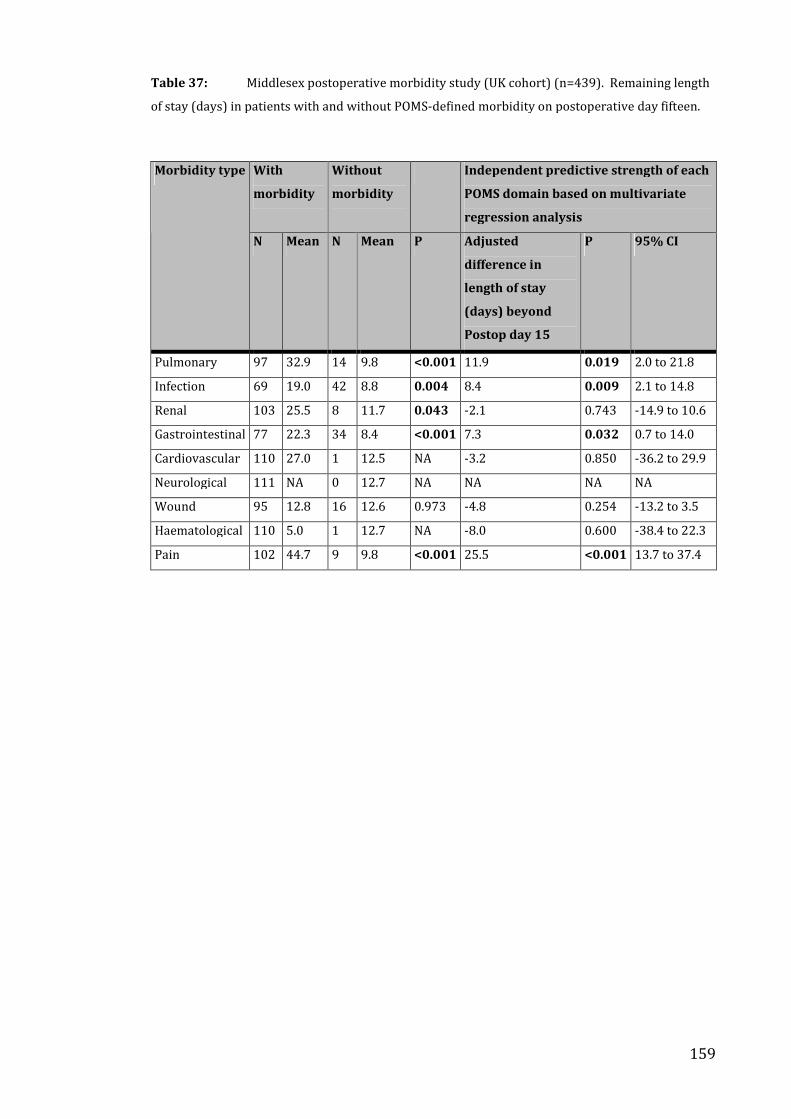
159
Table 37: Middlesex postoperative morbidity study (UK cohort) (n=439). Remaining length
of stay (days) in patients with and without POMS-defined morbidity on postoperative day fifteen.
With
morbidity
Without
morbidity
Independent predictive strength of each
POMS domain based on multivariate
regression analysis
Morbidity type
N Mean N Mean P Adjusted
difference in
length of stay
(days) beyond
Postop day 15
P 95% CI
Pulmonary 97 32.9 14 9.8 <0.001 11.9 0.019 2.0 to 21.8
Infection 69 19.0 42 8.8 0.004 8.4 0.009 2.1 to 14.8
Renal 103 25.5 8 11.7 0.043 -2.1 0.743 -14.9 to 10.6
Gastrointestinal 77 22.3 34 8.4 <0.001 7.3 0.032 0.7 to 14.0
Cardiovascular 110 27.0 1 12.5 NA -3.2 0.850 -36.2 to 29.9
Neurological 111 NA 0 12.7 NA NA NA NA
Wound 95 12.8 16 12.6 0.973 -4.8 0.254 -13.2 to 3.5
Haematological 110 5.0 1 12.7 NA -8.0 0.600 -38.4 to 22.3
Pain 102 44.7 9 9.8 <0.001 25.5 <0.001 13.7 to 37.4
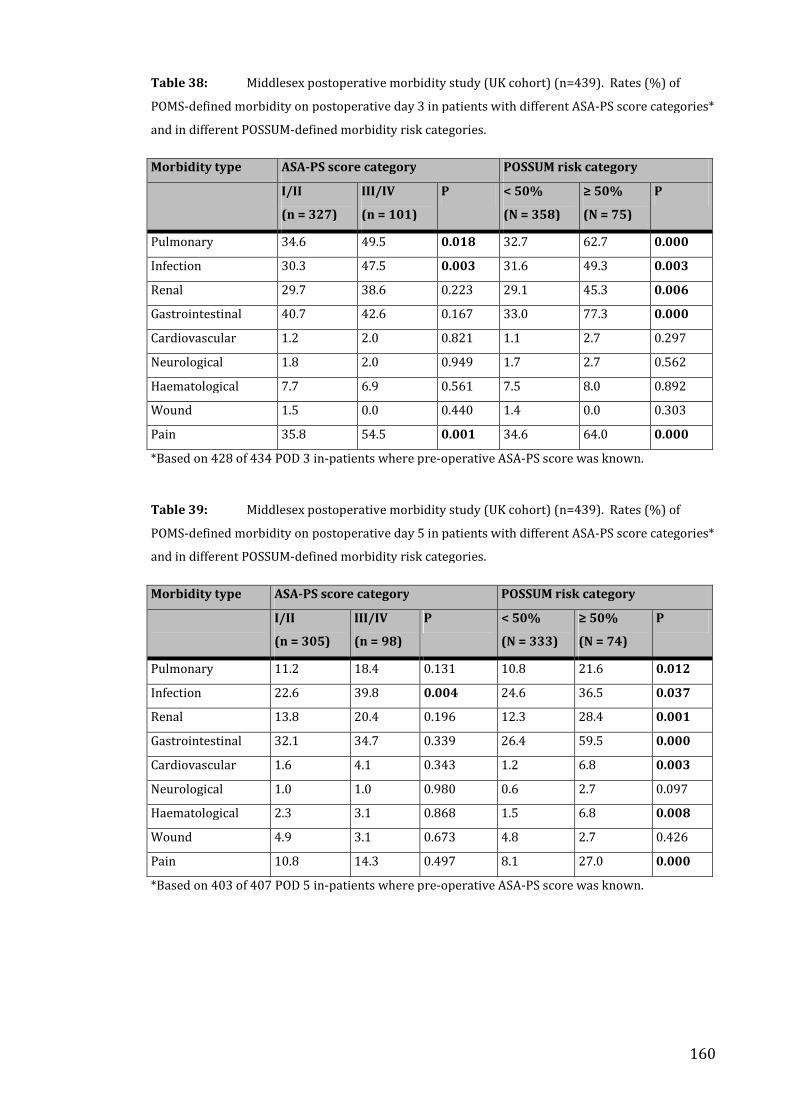
160
Table 38: Middlesex postoperative morbidity study (UK cohort) (n=439). Rates (%) of
POMS-defined morbidity on postoperative day 3 in patients with different ASA-PS score categories*
and in different POSSUM-defined morbidity risk categories.
Morbidity type ASA-PS score category POSSUM risk category
I/II
(n = 327)
III/IV
(n = 101)
P < 50%
(N = 358)
≥ 50%
(N = 75)
P
Pulmonary 34.6 49.5 0.018 32.7 62.7 0.000
Infection 30.3 47.5 0.003 31.6 49.3 0.003
Renal 29.7 38.6 0.223 29.1 45.3 0.006
Gastrointestinal 40.7 42.6 0.167 33.0 77.3 0.000
Cardiovascular 1.2 2.0 0.821 1.1 2.7 0.297
Neurological 1.8 2.0 0.949 1.7 2.7 0.562
Haematological 7.7 6.9 0.561 7.5 8.0 0.892
Wound 1.5 0.0 0.440 1.4 0.0 0.303
Pain 35.8 54.5 0.001 34.6 64.0 0.000
*Based on 428 of 434 POD 3 in-patients where pre-operative ASA-PS score was known.
Table 39: Middlesex postoperative morbidity study (UK cohort) (n=439). Rates (%) of
POMS-defined morbidity on postoperative day 5 in patients with different ASA-PS score categories*
and in different POSSUM-defined morbidity risk categories.
Morbidity type ASA-PS score category POSSUM risk category
I/II
(n = 305)
III/IV
(n = 98)
P < 50%
(N = 333)
≥ 50%
(N = 74)
P
Pulmonary 11.2 18.4 0.131 10.8 21.6 0.012
Infection 22.6 39.8 0.004 24.6 36.5 0.037
Renal 13.8 20.4 0.196 12.3 28.4 0.001
Gastrointestinal 32.1 34.7 0.339 26.4 59.5 0.000
Cardiovascular 1.6 4.1 0.343 1.2 6.8 0.003
Neurological 1.0 1.0 0.980 0.6 2.7 0.097
Haematological 2.3 3.1 0.868 1.5 6.8 0.008
Wound 4.9 3.1 0.673 4.8 2.7 0.426
Pain 10.8 14.3 0.497 8.1 27.0 0.000
*Based on 403 of 407 POD 5 in-patients where pre-operative ASA-PS score was known.
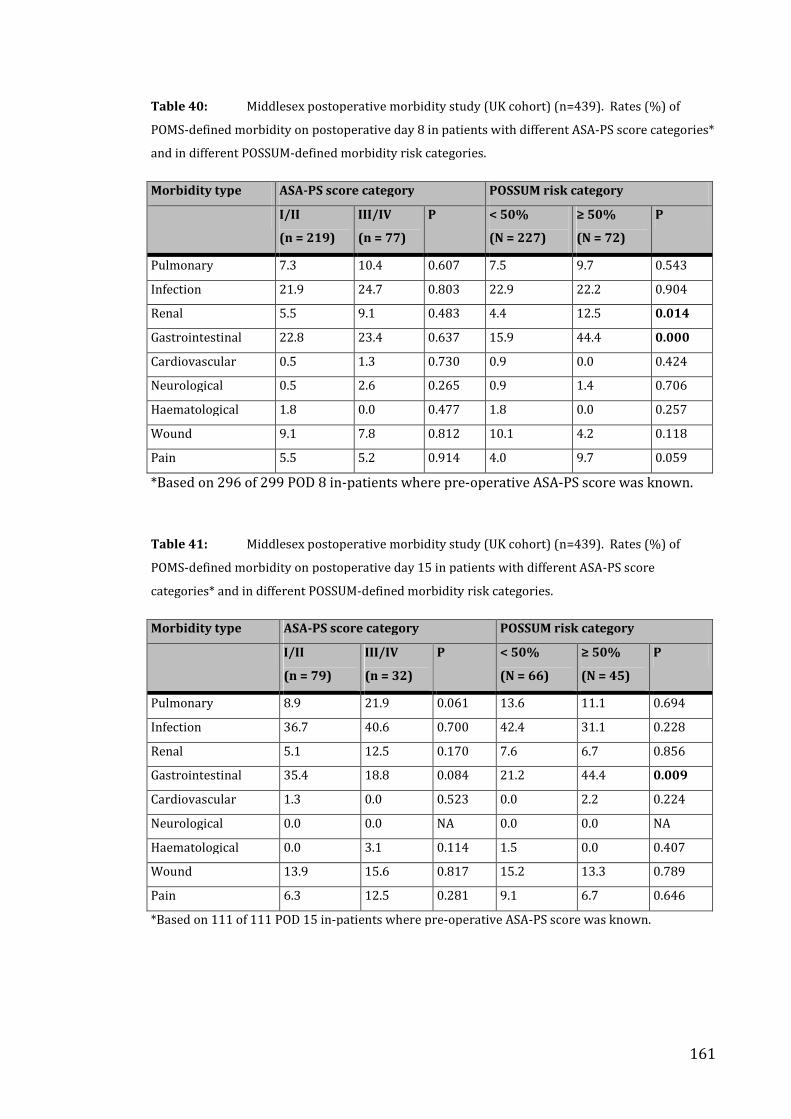
161
Table 40: Middlesex postoperative morbidity study (UK cohort) (n=439). Rates (%) of
POMS-defined morbidity on postoperative day 8 in patients with different ASA-PS score categories*
and in different POSSUM-defined morbidity risk categories.
Morbidity type ASA-PS score category POSSUM risk category
I/II
(n = 219)
III/IV
(n = 77)
P < 50%
(N = 227)
≥ 50%
(N = 72)
P
Pulmonary 7.3 10.4 0.607 7.5 9.7 0.543
Infection 21.9 24.7 0.803 22.9 22.2 0.904
Renal 5.5 9.1 0.483 4.4 12.5 0.014
Gastrointestinal 22.8 23.4 0.637 15.9 44.4 0.000
Cardiovascular 0.5 1.3 0.730 0.9 0.0 0.424
Neurological 0.5 2.6 0.265 0.9 1.4 0.706
Haematological 1.8 0.0 0.477 1.8 0.0 0.257
Wound 9.1 7.8 0.812 10.1 4.2 0.118
Pain 5.5 5.2 0.914 4.0 9.7 0.059
*Based on 296 of 299 POD 8 in-patients where pre-operative ASA-PS score was known.
Table 41: Middlesex postoperative morbidity study (UK cohort) (n=439). Rates (%) of
POMS-defined morbidity on postoperative day 15 in patients with different ASA-PS score
categories* and in different POSSUM-defined morbidity risk categories.
Morbidity type ASA-PS score category POSSUM risk category
I/II
(n = 79)
III/IV
(n = 32)
P < 50%
(N = 66)
≥ 50%
(N = 45)
P
Pulmonary 8.9 21.9 0.061 13.6 11.1 0.694
Infection 36.7 40.6 0.700 42.4 31.1 0.228
Renal 5.1 12.5 0.170 7.6 6.7 0.856
Gastrointestinal 35.4 18.8 0.084 21.2 44.4 0.009
Cardiovascular 1.3 0.0 0.523 0.0 2.2 0.224
Neurological 0.0 0.0 NA 0.0 0.0 NA
Haematological 0.0 3.1 0.114 1.5 0.0 0.407
Wound 13.9 15.6 0.817 15.2 13.3 0.789
Pain 6.3 12.5 0.281 9.1 6.7 0.646
*Based on 111 of 111 POD 15 in-patients where pre-operative ASA-PS score was known.
162
5.4 Discussion
5.4.1 Acceptability
In this study the POMS had good acceptability to patients. However this aspect of
POMS performance was not formally assessed, but based on the subjective views
of the research nurses involved in data collection. Consequently the potential for
observer bias limits the significance that can be attached to this result, and further
investigation in a separate study may be appropriate.
5.4.2 Reliability
The POMS had good inter-rater reliability. According to the subjectively derived
classification of Landis and Koch 326 all domains except gastrointestinal achieved
perfect or “almost perfect agreement”. The gastrointestinal domain achieved
“substantial agreement” before the adoption of a more precise definition that
included an additional criterion (prescription of anti-emetics as an inclusion
criterion for nausea) after which agreement was perfect (1.0). This data is from
senior research nurses with long experience (> 5 years) of handling study data and
more than a year’s experience of collecting POMS data (and working together as
part of a team). The reliability of the POMS when recorded by less experienced
data collectors in different settings may not reach the levels measured in this
sample. The use of standard operating procedures describing the procedure and
criteria for collecting POMS along with periodic testing of reliability on sample
subpopulations is likely to result in higher quality data.
5.4.3 Internal consistency
The low level of internal consistency amongst the POMS domains argues against
the concept that there is a single underlying construct that is being measured by
the POMS. In addition this lack of homogeneity indicates that the POMS does not
have the scaling properties necessary to generate a total score that could be used
as an index of overall morbidity and therefore does not support the development
of a scale derived by summing different domains, as if they were all measuring
elements of the same underlying construct. Consequently, subsequent validation
focuses on the validity of the individual domains and of the overall presence or
163
absence of morbidity (defined as present if morbidity is present in one or more
domain) as measures of postoperative morbidity.
5.4.4 Validity
5.4.4.1 Criterion validity
There is no criterion “gold standard” with which to compare the POMS as a tool for
identifying postoperative morbidity therefore testing of criterion validity is not
possible. The absence of a “gold standard” along with the lack of evidence of a
measurable underlying construct defined by the POMS raises two questions. Does
morbidity exist as a concept that can be defined and measured? Is there any value
in measuring an indefinable variable? These questions will be revisited in the
final Chapter 6.
5.4.4.2 Face validity
Face validity (the instrument appears “on the face of it” to be measuring the
attributes it claims to be measuring 327) of the POMS as a composite measurement
tool for postoperative morbidity rests on demonstration of its ability to identify
clinically relevant postoperative morbidity. There was evidence that POMS
captured all clinically relevant morbidity: patients remaining in hospital who did
not meet criteria for POMS did not complain of morbidity that had not been
captured by the POMS. The reasons given for remaining in hospital were
predominantly process related e.g. awaiting equipment at home (see Chapter 4).
The exception to this was patients who had problems with mobility. On the basis
that these mobility problems were new postoperative occurrences, a case could be
made for including mobility as an additional domain within the POMS. Implicit in
the use of the POMS is the assumption that patients who have been discharged
from hospital do not have morbidity of a severity sufficient to meet POMS criteria.
Given the magnitude of morbidity required to meet the domain criteria this seems
likely to be true, however this has not been formally explored.
Face validity of the domains is dependent on the credibility of the domain criteria
as representative of significant magnitude of morbidity (e.g. parenteral opioids or
regional analgesia represent a non-trivial level of pain relief). Face validity of the
domains is also supported by the fact that for each domain the criteria are
objective and simple to assess.
164
5.4.4.3 Construct Validity
A priori hypotheses that the POMS would discriminate between patients with
different known levels of morbidity risk, and predict length of stay were generally
supported through observation of data trends.
Subsequent length of stay tended to be greater in patients with morbidity than
those without for all but 3 out of 32 comparisons of POMS domains. These
differences were statistically significant for the pulmonary, infection,
gastrointestinal, pain domains and for the overall POMS defined morbidity on all
PODs. The adjusted subsequent lengths of stay, derived from a multivariate
analysis, tended to be shorter in patients with morbidity for 8 of 24 analyses.
Patients with gastrointestinal and pain morbidity had significantly longer
subsequent length of stay on all PODs. These findings are consistent with the
hypothesis that patients with POMS defined morbidity would be expected to stay
in hospital longer than those without, and this ‘predictive validity’ supports
construct validity of the POMS.
For ‘known groups’ comparisons where patients were categorised to be at higher
and lower risk of postoperative complications (morbidity) by ASA-PS scores or by
POSSUM morbidity risk prediction the results were less consistent. On PODs 3
and 5, patients categorised at higher risk where more likely to have morbidity in
almost all cases and this association was stronger (statistically significant for more
domains) with POSSUM than with ASA-PS score. However on PODs 8 and 15
several domains had a lower frequency of morbidity in the higher risk category
whichever criterion was used to define risk. The only significant differences were
an increased frequency in the high POSSUM morbidity risk category of renal and
gastrointestinal morbidity on POD 8 and of gastrointestinal morbidity on POD 15.
These findings are broadly supportive of the hypothesis that patients in groups
known to be at greater risk of postoperative complications would have a higher
frequency of POMS defined morbidity. However, the results on POD 8 and 15 are
inconsistent and in some cases contradictory of this hypothesis and these data
merit explanation if construct validity is claimed.
165
Three factors that may be responsible for these data are the heterogeneity of
surgical type in this cohort, the known limitation of the ASA-PS score with respect
to discrimination between moderate levels of risk, and the high number of patients
remaining in hospital with no POMS defined morbidity.
Three distinct types of surgery were represented in the validation cohort
(orthopaedic, general, urological). Patterns of postoperative morbidity vary
between these types of operation (see Chapter 4) reflecting both the underlying
disease process and surgical insult. Distributions of risk descriptors also vary
between these different types of surgery (See Figure 22). Differences in POSSUM
defined risk are mainly due to variation in Operative Severity Score rather than the
Physiological Score (see Figure 23). This variation is a potential confounder in the
relationship between morbidity domain frequencies (in a heterogeneous cohort)
and risk category or subsequent length of stay. Furthermore, the frequency of the
less common categories of morbidity (e.g. wound, cardiovascular, neurological,
haematological) at PODs 8 and 15 are very low and non-significant differences
should be interpreted with caution. For this reason I did not explore surgical
specialty subgroups further in this cohort. In a larger cohort with large
homogeneous subgroups more valid results might be obtained.
The ASA-PS score divides risk into a limited number of categories whereas the
POSSUM regression analysis provides a continuous spectrum of expected
morbidity. In this cohort only 2 of 439 patients were classified ASA-PS score 4,
with the result that the ASA-PS score distribution effectively had only three
categories. The threshold between low and high risk for ASA-PS score category in
this study was between 2 and 3. It is well documented that attribution to ASA-PS
scores between these two categories is unreliable 328,329. Consequently the known
limitations of the ASA-PS score (low precision discriminator of risk with lack of
reliable attribution between ASA-PS scores II and III) are likely to be contributing
to the weaker association between ASA-PS scores and POMS domains frequencies
than those that occur with POSSUM predicted morbidity risk, which is not thought
to exhibit these weaknesses. Whilst the reliability of POSSUM has not been
formally tested, the objective nature of many of the criteria (e.g. laboratory
measured values) suggests that reliability may be superior to the ASA-PS.
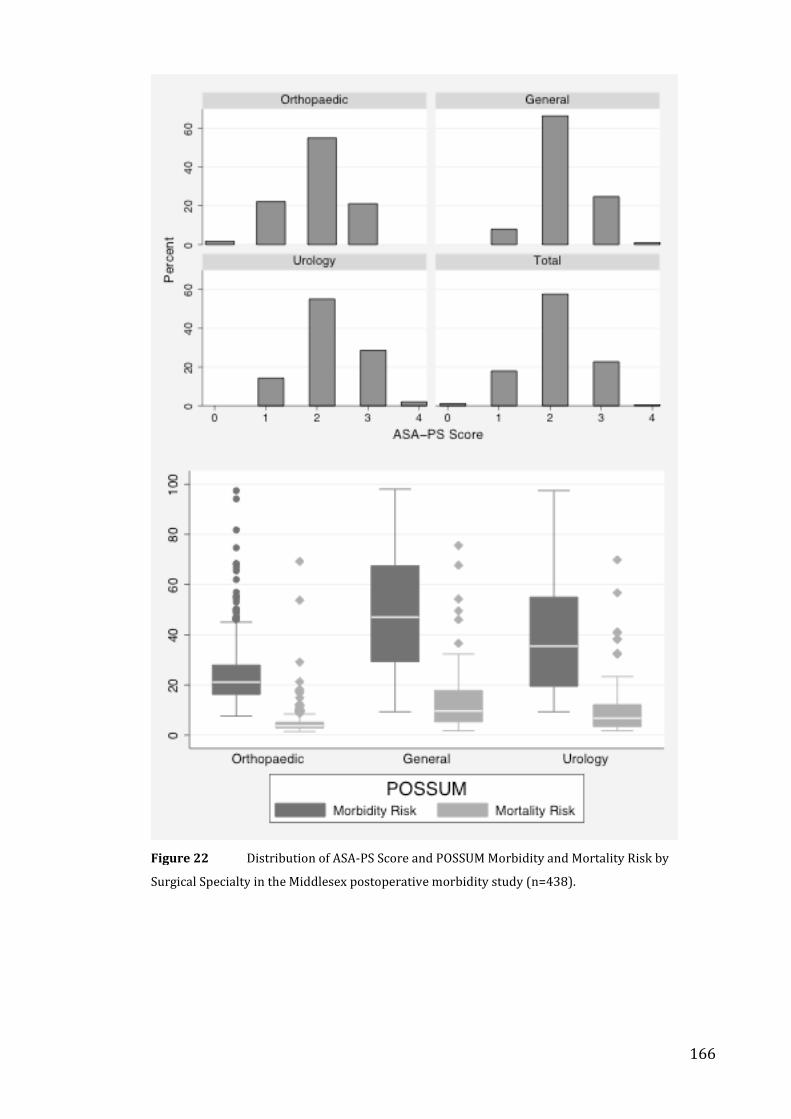
166
Figure 22 Distribution of ASA-PS Score and POSSUM Morbidity and Mortality Risk by
Surgical Specialty in the Middlesex postoperative morbidity study (n=438).
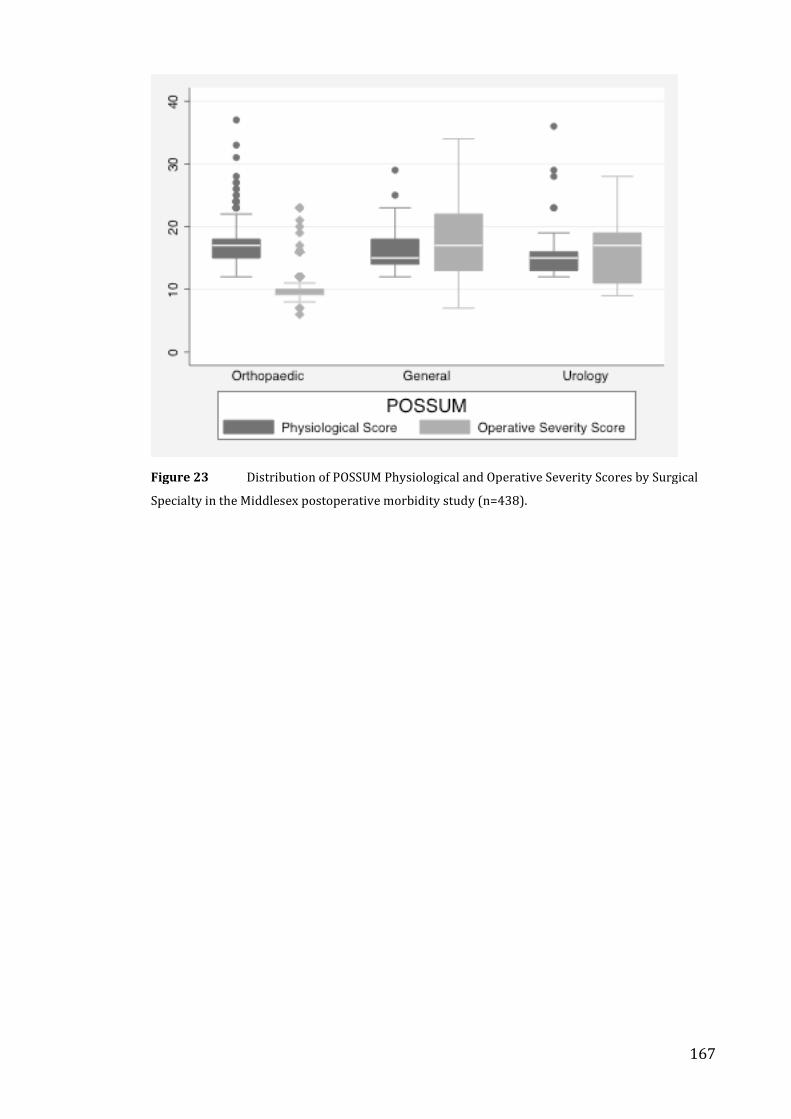
167
Figure 23 Distribution of POSSUM Physiological and Operative Severity Scores by Surgical
Specialty in the Middlesex postoperative morbidity study (n=438).
168
5.4.5 POMS domain criteria
The definitions of morbidity used for each domain of the POMS will influence
measured prevalence of morbidity types. For example if the definition of pain
were altered to include taking oral analgesics the measured frequency of pain
would be much higher. Additionally for some domains there may be threshold
effects whereby morbidity significant to a patient is not recorded (e.g. blood loss
resulting in anaemia and fatigue, but not meeting transfusion triggers). However
the finding that patients in hospital without morbidity as defined by the POMS
were not there because of unrecorded morbidity supports the notion that the
POMS records morbidity significant to patients and clinicians. A tool more
sensitive for lower levels of morbidity (e.g. mild headache or mild exercise
limitation) would be a poor discriminator of postoperative outcome following
major surgery.
The definitions within individual domains record phenomena which may be
pathophysiologically related. There is therefore the potential for redundancy
between domains. For example an acute myocardial infarction might be recorded
under pain (parenteral opiate prescription), cardiovascular (tests for ischaemia),
pulmonary (supplemental oxygen) and infection domains (fever) domains.
Pathophysiological interactions might also result in interactions between domains.
For example the pain and gastrointestinal domains might be associated due to the
effects of parenteral opiates on gastrointestinal function leading to inability to
tolerate enteral diet.
Limitations of the domain criteria are that in some cases they are dependent on
administered treatment, that they are composed of variety of different types of
data and that the binary nature of the domains (presence or absence of morbidity)
might result in threshold effects whereby significant morbidity would go
unrecorded. These limitations are discussed below.
The definitions used in POMS may be criticized as being too dependent on
administered treatment: routine prophylactic interventions might be confused
with ‘true’ morbidity. This is particularly true in the first three days after certain
types of elective surgery, where, for example, there may be routine use of pain
169
medication, urinary catheter, antibiotics, and respiratory support and in some
cases withholding of oral nutrition. However, the routine use of these treatments
should be rare beyond the first three post-operative days and morbidity identified
subsequently should be 'true' morbidity. The recent development of “fast-track” or
“enhanced recovery” care packages following major surgery, particularly for
patients undergoing colorectal surgery 330, will tend to reduce the duration of time
following surgery when any of the interventions used as criteria for POMS domains
might be considered routine. This in turn may increase the validity and value of
POMS recorded earlier in the postoperative phase (e.g. POD 3). Such changes
highlight the fact that variation in clinician practice relating to the context of use of
the POMS may confound measurement of “true” morbidity. They also emphasize
the importance of using POMS in an environment where “routine” postoperative
care is clearly defined in order that morbidity may be operationally defined by
deviations from the “routine” (see below).
A distinct but related issue arises because of the use of administered treatment
within some of the POMS domain criteria. The effectiveness of the POMS in
measuring “postoperative morbidity” rests on the assumption that the institutional
settings in which it is used will be competent to recognize and treat morbidity as it
arises. Where this assumption is violated, the POMS may produce the paradoxical
result that hospitals with lower standards of care record the lowest level of
morbidity. For example, a hospital with inappropriately low parenteral opiod
prescription could fail to record POMS-defined pain morbidity. It is therefore
important that POMS data is always interpreted in the context of an understanding
of local post-operative treatment protocols and guidelines.
Many of the POMS definitions include more than one type of data. For example the
POMS definition of renal morbidity includes a laboratory finding (increased serum
creatinine (>30% from pre operative level)) a treatment (urinary catheter in situ)
and a physiological observation (oliguria < 500ml/24hours). However, this is
consistent with the clinimetric approach to index development 331 183. Strengths
of this approach are that face validity is improved and that the POMS has good
sensitivity and specificity for significant morbidity requiring hospital care when
applied in an environment with a tightly defined discharge policy 172. Using
170
observable treatment to define morbidity leads to high inter-rater reliability in
combination with acceptable levels of sensitivity and specificity for clinically
significant morbidity. Additionally this approach eliminates much of the variation
arising from subjective assessment of conditions such as wound infection, pain and
respiratory distress.
5.5 Summary
1. The POMS is a reliable and acceptable to patients.
2. The POMS should not be treated in statistical analyses as though it is a
unidimensional scale: a POMS score derived by summing POMS domains would not
be valid in this context.
3. The POMS is a valid descriptor of short-term post-operative morbidity in
major surgical patients. Limitations of the performance of the POMS in this
analysis are likely to be related to heterogeneity of type of surgery and the
limitations of the measures against which the POMS is being validated.
171
Chapter 6: Conclusions and further work
6.1 Summary of contents of thesis
Outcome following surgery is a significant public health issue. Quality of surgical
care can be defined in a variety of ways. The distinction between structure,
process and outcome is important, as is the perspective of the measurer. In the UK
quality has been subdivided into safety, experience and effectiveness.
Risk adjustment of outcome data is essential to minimise confounding by patient
and surgical characteristics if effectiveness of care is to be evaluated. Clinically
important short-term outcomes following surgery include mortality and
morbidity. Duration of hospital stay is commonly used as a surrogate measure of
outcome. Description and measurement of morbidity following surgery are
inconsistent limiting comparisons of effectiveness of care.
Measurement of an unobservable phenomenom, such as postoperative morbidity,
is dependent on measurement of hypothesised manifestations of the
phenomenom. Reliability and validity are essential requirements in a clinical
measure and are critically dependent on the context of testing. In the case of an
unobservable phenomenon such as postoperative morbidity, a criterion measure
may not be available in which case testing of construct validity is required.
A systematic review of the efficacy of a specific perioperative haemodynamic
management strategy was performed to explore the balance between therapeutic
benefit and adverse effects. Whilst mortality and length of hospital stay were
reduced in the intervention group, pooling of morbidity data for between-group
comparisons was limited by the heterogeneity of morbidity reporting between
different studies. Classification, criteria and summation of morbidity outcome
variables were inconsistent between studies, precluding analyses of pooled data
for most types of morbidity. A similar pattern was observed in a second
systematic review of randomised controlled trials of perioperative interventions
published in high impact surgical journals.
172
The Post-operative Morbidity Survey (POMS), a previously published method of
describing short-term postoperative morbidity, lacked validation. The POMS was
prospectively collected in 439 patients undergoing elective major surgery in a UK
teaching hospital. The prevalence and pattern of morbidity was described and
compared with data from a similar study using the POMS in a US institution.
The type and severity of surgery was reflected in the frequency and pattern of
POMS defined postoperative morbidity. The POMS identified gastrointestinal,
infection, pain-related, pulmonary and renal problems as the most common
sources of morbidity following major surgery in a UK setting. Many patients
remained in hospital despite absence of post-operative morbidity as defined by the
POMS. Screening for post-operative morbidity using the POMS may be useful to
identify patients remaining in acute hospital beds unnecessarily. The POMS may
have utility as a tool for recording bed occupancy and for modelling bed utilisation.
Comparison between the similar UK and US cohorts highlighted striking
differences in delivery of care and outcome that merit further investigation. In this
comparison, patients in the US cohort were less likely to remain in hospital in the
absence of POMS defined morbidity and had a lower prevalence of infection
morbidity.
The POMS was found to be reliable and acceptable to patients. The POMS should
not be treated in statistical analyses as though it is a unidimensional scale: a POMS
score derived by summing POMS domains would not be valid in this context.
Limitations of the performance of the POMS in this analysis are likely to be related
to heterogeneity of type of surgery and the limitations of the measures against
which the POMS is being validated. Inter-rater reliability was adequate and a
priori hypotheses that the POMS would discriminate between patients with known
measures of morbidity risk, and predict length of stay were generally supported
through observation of data trends, providing good evidence of construct validity.
The POMS was a valid descriptor of short-term post-operative morbidity in major
surgical patients.
173
6.2 Outstanding questions
6.2.1 Current literature
Systematic reviews of preoperative risk metrics and of postoperative outcome
measures would be valuable.
6.2.2 POMS internal validity
Internal validity of the POMS might be improved if POMS domain criteria could be
simplified (e.g. cardiovascular) without loss of POMS performance. A simplified
version of the POMS might have utility for monitoring morbidity on days when the
full POMS is not currently collected. For example, only collecting the most
prevalent domains (gastrointestinal, infectious, pain-related, pulmonary) might
provide much information at the cost of minimal resource. The possibility of
replacing some of the domains with biomarkers (e.g. Brain Natriuritic Peptide as a
marker of cardiac injury) may merit exploration.
The assumption that patients discharged from hospital do not have (or develop)
clinically significant morbidity merits further investigation. This might be
achieved using post-discharge telephone surveys or patient completed scorecards.
Investigation of readmission rates and post-discharge medical contact (e.g. general
practitioners) may also provide useful information in this area.
Where an “index” measure of morbidity is required, which postoperative day best
quantifies “true” morbidity (the optimal balance between patients remaining in
hospital and “contamination by routine care”) merits investigation in different
populations. Changing patterns of care (e.g. introduction of “fast-track” care
packages) may cause this to evolve over time.
6.2.3 POMS external validity
An important element of future work will be to validate the POMS in other
populations (e.g. vascular surgery, cardiac surgery, neurosurgery and paediatric
surgery). The distinct patterns of morbidity in some of these settings (e.g.
neurosurgery, cardiac surgery) might be expected to require the development of a
modified tool specific to this type of surgery. In the paediatric surgical population
one might hypothesize that both the pattern of morbidity and the expression of
174
“unwellness” (e.g. different reasons for not tolerating enteral feeding) might be
different to the adult population, necessitating a modified POMS tool.
6.2.4 Does perioperative morbidity constitute a syndrome?
Two modes of investigation may contribute to answering this question. First,
statistical analysis of extant POMS databases using techniques such as factor
analysis may illuminate relationships (e.g. clustering of POMS domains) within the
data. Second, measurement of cytokines, both pro-inflammatory (e.g. interleukin-
6) and tissue injury markers (e.g. BNP), may contribute to the data supporting the
concept of postoperative morbidity being a “mild” variant of MODS resulting from
“mild” SIRS.
6.2.5 POMS applications
Further exploration of the partial dependence of the POMS on administered care
may have value. A study to test the hypothesis that use of the POMS in an
environment with more tightly defined and audited management pathways (in
particular for the interventions included within the POMS morbidity definitions)
might be expected to further improve validity and utility.
6.2.4.1 Quality of care studies
The POMS may have utility as a tool to explore improvements in bed management
efficiency and to evaluate the success of these changes when implemented.
Furthermore the POMS may be used to explore determinants of prolonged bed
occupancy (e.g. socioeconomic status).
Models incorporating preoperative risk profiles, surgery characteristics and
postoperative morbidity assessment could be developed which would predict
surgical bed occupancy and be responsive to the level and pattern of morbidity in
current in-patients.
6.2.4.2 Prognostic studies
Further exploration of the relationships between morbidity (POMS) and more
acute and more chronic outcomes following surgery may have value. The value of
early warning scores in the immediate postoperative period merits further
investigation. Similarly, the relationship between POMS and long-term outcome
(e.g. function in a replaced joint, mortality) should be explored.
175
6.2.4.3 Efficacy and Effectiveness studies
The POMS has potential utility as an outcome measure in RCTs and studies of
implementation of novel clinical interventions.
6.3 Conlusions
In clinical practice, the POMS can be envisaged as a component of an integrated
system of practice evaluation incorporating tightly defined care pathways and
recording of case-mix (risk) adjusters, post-operative morbidity and mortality,
resource utilisation (length of hospital stay, cost) and quality of life data. In this
context, the POMS may be a useful tool to inform clinical decision-making, resource
utilisation, in clinical governance activities and in effectiveness research.
The POMS has great potential as a standard outcome measure in quality of care,
prognostic and effectiveness research. As the only validated measure of
postoperative morbidity this would permit comparison of both the level and
pattern of post-operative morbidity and allows comparison between different
studies and different environments (e.g. institutions, countries). Comparing
outcomes that occur more frequently (e.g. morbidity rather than mortality) allows
smaller studies whilst retaining statistical power to detect significant differences
between groups. In addition the POMS permits the relative separation of process
and outcome assessment in prognostic and effectiveness research thereby
reducing confounding by process related factors.
176
REFERENCES
1. Weiser, T. G. et al. An estimation of the global volume of surgery: a modelling
strategy based on available data. Lancet 372, 139-144 (2008).
2. Anderson, G. F., Reinhardt, U. E., Hussey, P. S. & Petrosyan, V. It's the prices,
stupid: why the United States is so different from other countries. Health Aff
(Millwood) 22, 89-105 (2003).
3. Khuri, S. F. et al. Risk adjustment of the postoperative mortality rate for the
comparative assessment of the quality of surgical care: results of the National
Veterans Affairs Surgical Risk Study. J Am Coll Surg 185, 315-327 (1997).
4. Daley, J. et al. Risk adjustment of the postoperative morbidity rate for the
comparative assessment of the quality of surgical care: results of the National
Veterans Affairs Surgical Risk Study. J Am Coll Surg 185, 328-340 (1997).
5. Birkmeyer, J. D. et al. Hospital volume and surgical mortality in the United States.
N Engl J Med 346, 1128-1137 (2002).
6. Englesbe, M. J. et al. Seasonal variation in surgical outcomes as measured by the
American College of Surgeons-National Surgical Quality Improvement Program
(ACS-NSQIP). Ann Surg 246, 456-62; discussion 463-5 (2007).
7. Pearse, R. M. et al. Identification and characterisation of the high-risk surgical
population in the United Kingdom. Crit Care 10, R81 (2006).
8. Head, J. et al. Diagnosis-specific sickness absence as a predictor of mortality: the
Whitehall II prospective cohort study. BMJ 337, a1469 (2008).
9. Khuri, S. F. et al. Determinants of long-term survival after major surgery and the
adverse effect of postoperative complications. Ann Surg 242, 326-41; discussion
341-3 (2005).
10. Khuri, S. F. et al. Successful implementation of the Department of Veterans
Affairs' National Surgical Quality Improvement Program in the private sector: the
Patient Safety in Surgery study. Ann Surg 248, 329-336 (2008).
11. Schattner, A., Bronstein, A. & Jellin, N. Information and shared decision-making
are top patients' priorities. BMC Health Serv Res 6, 21 (2006).
177
12. Weinstein, J. N., Clay, K. & Morgan, T. S. Informed patient choice: patient-
centered valuing of surgical risks and benefits. Health Aff (Millwood) 26, 726-730
(2007).
13. Magee, H., Davis, L. J. & Coulter, A. Public views on healthcare performance
indicators and patient choice. J R Soc Med 96, 338-342 (2003).
14. Schneider, E. C. & Epstein, A. M. Use of public performance reports: a survey of
patients undergoing cardiac surgery. JAMA 279, 1638-1642 (1998).
15. Fanjiang, G., von Glahn, T., Chang, H., Rogers, W. H. & Safran, D. G. Providing
patients web-based data to inform physician choice: if you build it, will they
come? J Gen Intern Med 22, 1463-1466 (2007).
16. Noblett, S. E. & Horgan, A. F. A prospective case-matched comparison of clinical
and financial outcomes of open versus laparoscopic colorectal resection. Surg
Endosc 21, 404-408 (2007).
17. Brock, K. A., Vale, S. J. & Cotton, S. M. The effect of the introduction of a case-
mix-based funding model of rehabilitation for severe stroke: an Australian
experience. Arch Phys Med Rehabil 88, 827-832 (2007).
18. Rowell, K. S., Turrentine, F. E., Hutter, M. M., Khuri, S. F. & Henderson, W. G.
Use of national surgical quality improvement program data as a catalyst for
quality improvement. J Am Coll Surg 204, 1293-1300 (2007).
19. Bennett-Guerrero, E. et al. Comparison of P-POSSUM risk-adjusted mortality
rates after surgery between patients in the USA and the UK. Br J Surg 90, 1593-
1598 (2003).
20. Mohammed, M. A., Cheng, K. K., Rouse, A. & Marshall, T. Bristol, Shipman, and
clinical governance: Shewhart's forgotten lessons. Lancet 357, 463-467 (2001).
21. Vass, A. Performance of individual surgeons to be published. BMJ 324, 189
(2002).
22. Department of Health. Reforming NHS financial flows: introducing payment by
results (Department of Health, London, 2002).
23. Klein, R. The new model NHS: performance, perceptions and expectations. Br
Med Bull 81-82, 39-50 (2007).
24. Department of Health. High quality care for all: NHS next stage review final
report (The Stationary Office, London, 2008).
25. Hartz, A. J. et al. Hospital characteristics and mortality rates. N Engl J Med 321,
1720-1725 (1989).
178
26. Sorrentino, E. A. Hospital mission and cost differences. Hosp Top 67, 22-25
(1989).
27. Feachem, R. G., Sekhri, N. K. & White, K. L. Getting more for their dollar: a
comparison of the NHS with California's Kaiser Permanente. BMJ 324, 135-141
(2002).
28. Joesch, J. M., Wickizer, T. M. & Feldstein, P. J. Does competition by health
maintenance organizations affect the adoption of cost-containment measures by
fee-for-service plans? Am J Manag Care 4, 832-838 (1998).
29. Dziuban, S. W. J., McIlduff, J. B., Miller, S. J. & Dal Col, R. H. How a New York
cardiac surgery program uses outcomes data. Ann Thorac Surg 58, 1871-1876
(1994).
30. Khuri, S. F. et al. The Department of Veterans Affairs' NSQIP: the first national,
validated, outcome-based, risk-adjusted, and peer-controlled program for the
measurement and enhancement of the quality of surgical care. National VA
Surgical Quality Improvement Program. Ann Surg 228, 491-507 (1998).
31. Khuri, S. F. The NSQIP: a new frontier in surgery. Surgery 138, 837-843 (2005).
32. Lindenauer, P. K. et al. Public reporting and pay for performance in hospital
quality improvement. N Engl J Med 356, 486-496 (2007).
33. Peters, T. J. & Waterman, R. H. In search of excellence: lessons from America's
best-run companies (Harper & Row, New York, 1982).
34. Kaplan, R. S. & Norton, D. P. The balanced scorecard--measures that drive
performance. Harv Bus Rev 70, 71-79 (1992).
35. Chow, C. W., Ganulin, D., Teknika, O., Haddad, K. & Williamson, J. The
balanced scorecard: a potent tool for energizing and focusing healthcare
organization management. J Healthc Manag 43, 263-280 (1998).
36. Sahney, V. K. Balanced scorecard as a framework for driving performance in
managed care organizations. Manag Care Q 6, 1-8 (1998).
37. Daniel, D. R. Management Information Crisis. Harvard Business Review 39, 111-
121 (1961).
38. Tan, J. K. The critical success factor approach to strategic alignment: seeking a
trail from a health organization's goals to its management information
infrastructure. Health Serv Manage Res 12, 246-257 (1999).
39. van Herten, L. M. & Gunning-Schepers, L. J. Targets as a tool in health policy.
Part I: Lessons learned. Health Policy 53, 1-11 (2000).
179
40. Kollef, M. SMART approaches for reducing nosocomial infections in the ICU.
Chest 134, 447-456 (2008).
41. The University College London Hospitals Mission Statement.
www.uclh.nhs.uk/About+UCLH/Mission+and+objectives/ (accessed 30th
November 2008).
42. The Oxford English Dictionary (Clarendon Press, 1989).
43. Lilford, R. J., Brown, C. A. & Nicholl, J. Use of process measures to monitor the
quality of clinical practice. BMJ 335, 648-650 (2007).
44. Donabedian, A. in Quality assessment and monitoring Vol 1. (Health Admin.
Press, Ann Arbor, MI, 1980).
45. Birkmeyer, J. D. et al. Surgeon volume and operative mortality in the United
States. N Engl J Med 349, 2117-2127 (2003).
46. Pitches, D. W., Mohammed, M. A. & Lilford, R. J. What is the empirical evidence
that hospitals with higher-risk adjusted mortality rates provide poorer quality
care? A systematic review of the literature. BMC Health Serv Res 7, 91 (2007).
47. Brown, C. & Lilford, R. Cross sectional study of performance indicators for
English Primary Care Trusts: testing construct validity and identifying explanatory
variables. BMC Health Serv Res 6, 81 (2006).
48. Werner, R. M. & Bradlow, E. T. Relationship between Medicare's hospital
compare performance measures and mortality rates. JAMA 296, 2694-2702
(2006).
49. Deeks, J. J. et al. Evaluating non-randomised intervention studies. Health Technol
Assess 7, iii-x, 1-173 (2003).
50. Crow, R. et al. The measurement of satisfaction with healthcare: implications for
practice from a systematic review of the literature. Health Technol Assess 6, 1-244
(2002).
51. Hawkes, N. Patients admitted to hopsital simply to hit targets. Times Online
(2007).
52. Royal Statistical Society working party on performance monitoring in public
services. Performance indicators: good, bad, and ugly (Royal Statistical Society,
London, 2004).
53. Burack, J. H., Impellizzeri, P., Homel, P. & Cunningham, J. N. J. Public reporting
of surgical mortality: a survey of New York State cardiothoracic surgeons. Ann
Thorac Surg 68, 1195-200; discussion 1201-2 (1999).
180
54. Skinner, T. J., Price, B. S., Scott, D. W. & Gorry, G. A. Factors affecting the
choice of hospital-based ambulatory care by the urban poor. Am J Public Health
67, 439-445 (1977).
55. FDA. Draft guidance for industry on patient-reported outcome measures: use in
medicinal product development to support labelling claims. Federal Register 71,
5862-5863 (2006).
56. Guidance for industry: patient-reported outcome measures: use in medical product
development to support labeling claims: draft guidance. Health Qual Life
Outcomes 4, 79 (2006).
57. Ware, J. E. J. & Sherbourne, C. D. The MOS 36-item short-form health survey
(SF-36). I. Conceptual framework and item selection. Med Care 30, 473-483
(1992).
58. Kershaw, C. J., Atkins, R. M., Dodd, C. A. & Bulstrode, C. J. Revision total hip
arthroplasty for aseptic failure. A review of 276 cases. J Bone Joint Surg Br 73,
564-568 (1991).
59. Ostendorf, M. et al. Patient-reported outcome in total hip replacement. A
comparison of five instruments of health status. J Bone Joint Surg Br 86, 801-808
(2004).
60. Ashby, E., Grocott, M. P. & Haddad, F. S. Outcome measures for orthopaedic
interventions on the hip. J Bone Joint Surg Br 90, 545-549 (2008).
61. Strand, V., Cohen, S., Crawford, B., Smolen, J. S. & Scott, D. L. Patient-reported
outcomes better discriminate active treatment from placebo in randomized
controlled trials in rheumatoid arthritis. Rheumatology (Oxford) 43, 640-647
(2004).
62. Marshall, S., Haywood, K. & Fitzpatrick, R. Impact of patient-reported outcome
measures on routine practice: a structured review. J Eval Clin Pract 12, 559-568
(2006).
63. Greenhalgh, J., Long, A. F. & Flynn, R. The use of patient reported outcome
measures in routine clinical practice: lack of impact or lack of theory? Soc Sci
Med 60, 833-843 (2005).
64. Puhan, M. A., Soesilo, I., Guyatt, G. H. & Schunemann, H. J. Combining scores
from different patient reported outcome measures in meta-analyses: when is it
justified? Health Qual Life Outcomes 4, 94 (2006).
65. Iezzoni, L. I. An introduction to risk adjustment. Am J Med Qual 11, S8-11
(1996).
181
66. Iezzoni, L. I. Risk adjustment for medical effectiveness research: an overview of
conceptual and methodological considerations. J Investig Med 43, 136-150
(1995).
67. Richardson, D., Tarnow-Mordi, W. O. & Lee, S. K. Risk adjustment for quality
improvement. Pediatrics 103, 255-265 (1999).
68. Copeland, G. P., Jones, D. & Walters, M. POSSUM: a scoring system for surgical
audit. Br J Surg 78, 355-360 (1991).
69. Rowan, K. M. et al. Intensive Care Society's APACHE II study in Britain and
Ireland--II: Outcome comparisons of intensive care units after adjustment for case
mix by the American APACHE II method. BMJ 307, 977-981 (1993).
70. Knaus, W. A., Zimmerman, J. E., Wagner, D. P., Draper, E. A. & Lawrence, D. E.
APACHE-acute physiology and chronic health evaluation: a physiologically based
classification system. Crit Care Med 9, 591-597 (1981).
71. Saklad, M. Grading of patients for surgical procedures. Anesthesiology 2, 281-284
(1941).
72. Dripps, R. D., Lamont, A. & Eckenhoff, J. E. The role of anesthesia in surgical
mortality. JAMA 178, 261-266 (1961).
73. American Society of Anesthesiologists. New classification of physical status.
Anesthesiology 24, 111 (1963).
74. American Society of Anesthesiologists. American Society of Anesthesiologists
Physical Status Classification. www.asahq.org/clinical/physicalstatus.htm
(accessed 30th November 2008).
75. Ramirez Guerrero, A. & Arizpe Bravo, D. [Surgical risk and complications after
major surgery in patients with cirrhosis]. Rev Invest Clin 42, 7-13 (1990).
76. Hennein, H. A., Mendeloff, E. N., Cilley, R. E., Bove, E. L. & Coran, A. G.
Predictors of postoperative outcome after general surgical procedures in patients
with congenital heart disease. J Pediatr Surg 29, 866-870 (1994).
77. Hall, J. C. & Hall, J. L. ASA status and age predict adverse events after abdominal
surgery. J Qual Clin Pract 16, 103-108 (1996).
78. Brothers, T. E., Elliott, B. M., Robison, J. G. & Rajagopalan, P. R. Stratification
of mortality risk for renal artery surgery. Am Surg 61, 45-51 (1995).
79. Meixensberger, J. et al. Factors influencing morbidity and mortality after cranial
meningioma surgery--a multivariate analysis. Acta Neurochir Suppl 65, 99-101
(1996).
182
80. Chijiiwa, K. et al. ASA physical status and age are not factors predicting
morbidity, mortality, and survival after pancreatoduodenectomy. Am Surg 62,
701-705 (1996).
81. Karl, R. C., Schreiber, R., Boulware, D., Baker, S. & Coppola, D. Factors
affecting morbidity, mortality, and survival in patients undergoing Ivor Lewis
esophagogastrectomy. Ann Surg 231, 635-643 (2000).
82. McCulloch, P., Ward, J. & Tekkis, P. P. Mortality and morbidity in gastro-
oesophageal cancer surgery: initial results of ASCOT multicentre prospective
cohort study. BMJ 327, 1192-1197 (2003).
83. Prause, G. et al. Comparison of two preoperative indices to predict perioperative
mortality in non-cardiac thoracic surgery. Eur J Cardiothorac Surg 11, 670-675
(1997).
84. Reid, B. C., Alberg, A. J., Klassen, A. C., Koch, W. M. & Samet, J. M. The
American Society of Anesthesiologists' class as a comorbidity index in a cohort of
head and neck cancer surgical patients. Head Neck 23, 985-994 (2001).
85. Michel, J. P., Klopfenstein, C., Hoffmeyer, P., Stern, R. & Grab, B. Hip fracture
surgery: is the pre-operative American Society of Anesthesiologists (ASA) score a
predictor of functional outcome? Aging Clin Exp Res 14, 389-394 (2002).
86. Houry, S., Amenabar, J., Rezvani, A. & Huguier, M. Should patients over 80
years old be operated on for colorectal or gastric cancer? Hepatogastroenterology
41, 521-525 (1994).
87. Pickering, S. A., Esberger, D. & Moran, C. G. The outcome following major
trauma in the elderly. Predictors of survival. Injury 30, 703-706 (1999).
88. Wolters, U., Wolf, T., Stutzer, H. & Schroder, T. ASA classification and
perioperative variables as predictors of postoperative outcome. Br J Anaesth 77,
217-222 (1996).
89. Sutton, R., Bann, S., Brooks, M. & Sarin, S. The Surgical Risk Scale as an
improved tool for risk-adjusted analysis in comparative surgical audit. Br J Surg
89, 763-768 (2002).
90. Brooks, M. J., Sutton, R. & Sarin, S. Comparison of Surgical Risk Score,
POSSUM and p-POSSUM in higher-risk surgical patients. Br J Surg 92, 1288-
1292 (2005).
91. Donati, A. et al. A new and feasible model for predicting operative risk. Br J
Anaesth 93, 393-399 (2004).
183
92. Shoemaker, W. C., Appel, P. L., Kram, H. B., Waxman, K. & Lee, T. S.
Prospective trial of supranormal values of survivors as therapeutic goals in high-
risk surgical patients. Chest 94, 1176-1186 (1988).
93. Boyd, O., Grounds, R. M. & Bennett, E. D. A randomized clinical trial of the
effect of deliberate perioperative increase of oxygen delivery on mortality in high-
risk surgical patients. JAMA 270, 2699-2707 (1993).
94. Wilson, J. et al. Reducing the risk of major elective surgery: randomised
controlled trial of preoperative optimisation of oxygen delivery. BMJ 318, 1099-
1103 (1999).
95. Charlson, M. E., Pompei, P., Ales, K. L. & MacKenzie, C. R. A new method of
classifying prognostic comorbidity in longitudinal studies: development and
validation. J Chronic Dis 40, 373-383 (1987).
96. Charlson, M., Szatrowski, T. P., Peterson, J. & Gold, J. Validation of a combined
comorbidity index. J Clin Epidemiol 47, 1245-1251 (1994).
97. Ouellette, J. R., Small, D. G. & Termuhlen, P. M. Evaluation of Charlson-Age
Comorbidity Index as predictor of morbidity and mortality in patients with
colorectal carcinoma. J Gastrointest Surg 8, 1061-1067 (2004).
98. Ghali, W. A., Hall, R. E., Rosen, A. K., Ash, A. S. & Moskowitz, M. A. Searching
for an improved clinical comorbidity index for use with ICD-9-CM administrative
data. J Clin Epidemiol 49, 273-278 (1996).
99. Alves, A. et al. The AFC score: validation of a 4-item predicting score of
postoperative mortality after colorectal resection for cancer or diverticulitis:
results of a prospective multicenter study in 1049 patients. Ann Surg 246, 91-96
(2007).
100. Froehner, M. et al. Comparison of the American Society of Anesthesiologists
Physical Status classification with the Charlson score as predictors of survival
after radical prostatectomy. Urology 62, 698-701 (2003).
101. Schroeder, R. A. et al. Predictive indices of morbidity and mortality after liver
resection. Ann Surg 243, 373-379 (2006).
102. Macario, A., Vitez, T. S., Dunn, B., McDonald, T. & Brown, B. Hospital costs
and severity of illness in three types of elective surgery. Anesthesiology 86, 92-
100 (1997).
103. Sagar, P. M., Hartley, M. N., MacFie, J., Taylor, B. A. & Copeland, G. P.
Comparison of individual surgeon's performance. Risk-adjusted analysis with
POSSUM scoring system. Dis Colon Rectum 39, 654-658 (1996).
184
104. Curran, J. E. & Grounds, R. M. Ward versus intensive care management of high-
risk surgical patients. Br J Surg 85, 956-961 (1998).
105. Whiteley, M. S., Prytherch, D. R., Higgins, B., Weaver, P. C. & Prout, W. G. An
evaluation of the POSSUM surgical scoring system. Br J Surg 83, 812-815
(1996).
106. Prytherch, D. R. et al. POSSUM and Portsmouth POSSUM for predicting
mortality. Physiological and Operative Severity Score for the enUmeration of
Mortality and morbidity. Br J Surg 85, 1217-1220 (1998).
107. Mohamed, K. et al. An assessment of the POSSUM system in orthopaedic
surgery. J Bone Joint Surg Br 84, 735-739 (2002).
108. Tekkis, P. P. et al. Development of a dedicated risk-adjustment scoring system for
colorectal surgery (colorectal POSSUM). Br J Surg 91, 1174-1182 (2004).
109. Tekkis, P. P. et al. Risk-adjusted prediction of operative mortality in
oesophagogastric surgery with O-POSSUM. Br J Surg 91, 288-295 (2004).
110. Mosquera, D., Chiang, N. & Gibberd, R. Evaluation of surgical performance using
V-POSSUM risk-adjusted mortality rates. ANZ J Surg 78, 535-539 (2008).
111. Khuri, S. F. et al. The National Veterans Administration Surgical Risk Study: risk
adjustment for the comparative assessment of the quality of surgical care. J Am
Coll Surg 180, 519-531 (1995).
112. Daley, J., Henderson, W. G. & Khuri, S. F. Risk-adjusted surgical outcomes. Annu
Rev Med 52, 275-287 (2001).
113. Daley, J. et al. Validating risk-adjusted surgical outcomes: site visit assessment of
process and structure. National VA Surgical Risk Study. J Am Coll Surg 185, 341-
351 (1997).
114. Fink, A. S. et al. The National Surgical Quality Improvement Program in non-
veterans administration hospitals: initial demonstration of feasibility. Ann Surg
236, 344-53; discussion 353-4 (2002).
115. Goldman, L. et al. Multifactorial index of cardiac risk in noncardiac surgical
procedures. N Engl J Med 297, 845-850 (1977).
116. Lundqvist, B. W. et al. Cardiac risk in abdominal aortic surgery. Acta Chir Scand
155, 321-328 (1989).
117. Prause, G. et al. Can ASA grade or Goldman's cardiac risk index predict peri-
operative mortality? A study of 16,227 patients. Anaesthesia 52, 203-206 (1997).
118. Cooperman, M., Pflug, B., Martin, E. W. J. & Evans, W. E. Cardiovascular risk
factors in patients with peripheral vascular disease. Surgery 84, 505-509 (1978).
185
119. Detsky, A. S., Abrams, H. B., Forbath, N., Scott, J. G. & Hilliard, J. R. Cardiac
assessment for patients undergoing noncardiac surgery. A multifactorial clinical
risk index. Arch Intern Med 146, 2131-2134 (1986).
120. Gilbert, K., Larocque, B. J. & Patrick, L. T. Prospective evaluation of cardiac risk
indices for patients undergoing noncardiac surgery. Ann Intern Med 133, 356-359
(2000).
121. Eagle, K. A. et al. Dipyridamole-thallium scanning in patients undergoing
vascular surgery. Optimizing preoperative evaluation of cardiac risk. JAMA 257,
2185-2189 (1987).
122. Eagle, K. A. et al. Guidelines for perioperative cardiovascular evaluation for
noncardiac surgery. Report of the American College of Cardiology/American
Heart Association Task Force on Practice Guidelines. Committee on Perioperative
Cardiovascular Evaluation for Noncardiac Surgery. Circulation 93, 1278-1317
(1996).
123. Eagle, K. A. et al. ACC/AHA Guideline Update for Perioperative Cardiovascular
Evaluation for Noncardiac Surgery--Executive Summary. A report of the
American College of Cardiology/American Heart Association Task Force on
Practice Guidelines (Committee to Update the 1996 Guidelines on Perioperative
Cardiovascular Evaluation for Noncardiac Surgery). Anesth Analg 94, 1052-1064
(2002).
124. Lee, T. H. et al. Derivation and prospective validation of a simple index for
prediction of cardiac risk of major noncardiac surgery. Circulation 100, 1043-
1049 (1999).
125. Boersma, E. et al. Perioperative cardiovascular mortality in noncardiac surgery:
validation of the Lee cardiac risk index. Am J Med 118, 1134-1141 (2005).
126. Neary, W. D., Prytherch, D., Foy, C., Heather, B. P. & Earnshaw, J. J.
Comparison of different methods of risk stratification in urgent and emergency
surgery. Br J Surg 94, 1300-1305 (2007).
127. Lopez Aguila, S. C., Diosdado Iraola Ferrer, M., Alvarez Li, F. C., Davila Cabo
de Villa, E. & Alvarez Barzaga, M. C. [Mortality risk factors in critical surgical
patients]. Rev Esp Anestesiol Reanim 47, 281-286 (2000).
128. Goffi, L. et al. Preoperative APACHE II and ASA scores in patients having major
general surgical operations: prognostic value and potential clinical applications.
Eur J Surg 165, 730-735 (1999).
186
129. Prytherch, D. R. et al. Towards a national clinical minimum data set for general
surgery. Br J Surg 90, 1300-1305 (2003).
130. Burgos, E. et al. Predictive value of six risk scores for outcome after surgical
repair of hip fracture in elderly patients. Acta Anaesthesiol Scand 52, 125-131
(2008).
131. Pliskin, J. S. et al. Coronary artery bypass graft surgery: clinical decision making
and cost-effectiveness analysis. Med Decis Making 1, 10-28 (1981).
132. La Puma, J. & Lawlor, E. F. Quality-adjusted life-years. Ethical implications for
physicians and policymakers. JAMA 263, 2917-2921 (1990).
133. Paffenbarger, R. S. J., Hyde, R. T., Wing, A. L. & Hsieh, C. C. Physical activity,
all-cause mortality, and longevity of college alumni. N Engl J Med 314, 605-613
(1986).
134. Hakim, A. A. et al. Effects of walking on mortality among nonsmoking retired
men. N Engl J Med 338, 94-99 (1998).
135. Myers, J. et al. Exercise capacity and mortality among men referred for exercise
testing. N Engl J Med 346, 793-801 (2002).
136. Hu, F. B. et al. Adiposity as compared with physical activity in predicting
mortality among women. N Engl J Med 351, 2694-2703 (2004).
137. Vaillant, G. E. Natural history of male psychologic health: effects of mental health
on physical health. N Engl J Med 301, 1249-1254 (1979).
138. Passarino, G. et al. A cluster analysis to define human aging phenotypes.
Biogerontology 8, 283-290 (2007).
139. Szekely, A. et al. Anxiety predicts mortality and morbidity after coronary artery
and valve surgery--a 4-year follow-up study. Psychosom Med 69, 625-631 (2007).
140. Christakis, N. A. & Allison, P. D. Mortality after the hospitalization of a spouse. N
Engl J Med 354, 719-730 (2006).
141. Moller, J. T. et al. Long-term postoperative cognitive dysfunction in the elderly
ISPOCD1 study. ISPOCD investigators. International Study of Post-Operative
Cognitive Dysfunction. Lancet 351, 857-861 (1998).
142. Newman, M. F. et al. Longitudinal assessment of neurocognitive function after
coronary-artery bypass surgery. N Engl J Med 344, 395-402 (2001).
143. Ireson, C. I., Ford, M. A., Hower, J. M. & Schwartz, R. W. Outcome report cards:
a necessity in the health care market. Arch Surg 137, 46-51 (2002).
187
144. Polonen, P., Ruokonen, E., Hippelainen, M., Poyhonen, M. & Takala, J. A
prospective, randomized study of goal-oriented hemodynamic therapy in cardiac
surgical patients. Anesth Analg 90, 1052-1059 (2000).
145. Lepor, H., Kimball, A. W. & Walsh, P. C. Cause-specific actuarial survival
analysis: a useful method for reporting survival data in men with clinically
localized carcinoma of the prostate. J Urol 141, 82-84 (1989).
146. Ho, V., Heslin, M. J., Yun, H. & Howard, L. Trends in hospital and surgeon
volume and operative mortality for cancer surgery. Ann Surg Oncol 13, 851-858
(2006).
147. Dimick, J. B., Wainess, R. M., Upchurch, G. R. J., Iannettoni, M. D. & Orringer,
M. B. National trends in outcomes for esophageal resection. Ann Thorac Surg 79,
212-6; discussion 217-8 (2005).
148. Englert, J., Davis, K. M. & Koch, K. E. Using clinical practice analysis to improve
care. Jt Comm J Qual Improv 27, 291-301 (2001).
149. Wright, J. G. Outcomes research: what to measure. World J Surg 23, 1224-1226
(1999).
150. Ellis, H., Calne, R. & Watson, C. General Surgery (lecture notes) (Wiley-
Blackwell, Oxford, 2006).
151. Russell, R. G. C., Williams, N. S. & Bulstrode, C. J. K. Bailey and Love's Short
Practice of Surgery (Hodder and Arnold, London, 2004).
152. Ethgen, O., Bruyere, O., Richy, F., Dardennes, C. & Reginster, J. Y. Health-
related quality of life in total hip and total knee arthroplasty. A qualitative and
systematic review of the literature. J Bone Joint Surg Am 86-A, 963-974 (2004).
153. Soderman, P., Malchau, H. & Herberts, P. Outcome after total hip arthroplasty:
Part I. General health evaluation in relation to definition of failure in the Swedish
National Total Hip Arthoplasty register. Acta Orthop Scand 71, 354-359 (2000).
154. Jablonski, S. Syndrome--a changing concept. Bull Med Libr Assoc 80, 323-327
(1992).
155. Marshall, J. C. et al. Multiple organ dysfunction score: a reliable descriptor of a
complex clinical outcome. Crit Care Med 23, 1638-1652 (1995).
156. Journal Citation Report 2004, ISI Web of Knowledge. http://admin-
apps.isiknowledge.com/JCR/JCR?RQ=LIST_SUMMARY_JOURNAL. (accessed
1st November 2008).
188
157. Pittet, D. et al. Systemic inflammatory response syndrome, sepsis, severe sepsis
and septic shock: incidence, morbidities and outcomes in surgical ICU patients.
Intensive Care Med 21, 302-309 (1995).
158. Nathens, A. B. & Marshall, J. C. Sepsis, SIRS, and MODS: what's in a name?
World J Surg 20, 386-391 (1996).
159. Bone, R. C. Toward a theory regarding the pathogenesis of the systemic
inflammatory response syndrome: what we do and do not know about cytokine
regulation. Crit Care Med 24, 163-172 (1996).
160. Talmor, M., Hydo, L. & Barie, P. S. Relationship of systemic inflammatory
response syndrome to organ dysfunction, length of stay, and mortality in critical
surgical illness: effect of intensive care unit resuscitation. Arch Surg 134, 81-87
(1999).
161. Rangel-Frausto, M. S. et al. The natural history of the systemic inflammatory
response syndrome (SIRS). A prospective study. JAMA 273, 117-123 (1995).
162. Jamieson, N. B. et al. Systemic inflammatory response predicts outcome in
patients undergoing resection for ductal adenocarcinoma head of pancreas. Br J
Cancer 92, 21-23 (2005).
163. Hall, G. M., Peerbhoy, D., Shenkin, A., Parker, C. J. & Salmon, P. Relationship of
the functional recovery after hip arthroplasty to the neuroendocrine and
inflammatory responses. Br J Anaesth 87, 537-542 (2001).
164. Noblett, S. E., Snowden, C. P., Shenton, B. K. & Horgan, A. F. Randomized
clinical trial assessing the effect of Doppler-optimized fluid management on
outcome after elective colorectal resection. Br J Surg 93, 1069-1076 (2006).
165. Buunen, M. et al. Stress response to laparoscopic surgery: a review. Surg Endosc
18, 1022-1028 (2004).
166. Reza, M. M., Blasco, J. A., Andradas, E., Cantero, R. & Mayol, J. Systematic
review of laparoscopic versus open surgery for colorectal cancer. Br J Surg 93,
921-928 (2006).
167. Kuhry, E., Schwenk, W., Gaupset, R., Romild, U. & Bonjer, J. Long-term
outcome of laparoscopic surgery for colorectal cancer: a cochrane systematic
review of randomised controlled trials. Cancer Treat Rev 34, 498-504 (2008).
168. Bruce, J., Russell, E. M., Mollison, J. & Krukowski, Z. H. The measurement and
monitoring of surgical adverse events. Health Technol Assess 5, 1-194 (2001).
169. Veen, E. J., Steenbruggen, J. & Roukema, J. A. Classifying surgical
complications: a critical appraisal. Arch Surg 140, 1078-1083 (2005).
189
170. Dindo, D., Demartines, N. & Clavien, P. A. Classification of surgical
complications: a new proposal with evaluation in a cohort of 6336 patients and
results of a survey. Ann Surg 240, 205-213 (2004).
171. Myles, P. S. et al. Development and psychometric testing of a quality of recovery
score after general anesthesia and surgery in adults. Anesth Analg 88, 83-90
(1999).
172. Bennett-Guerrero, E. et al. The use of a postoperative morbidity survey to evaluate
patients with prolonged hospitalization after routine, moderate-risk, elective
surgery. Anesth Analg 89, 514-519 (1999).
173. Bennett-Guerrero, E. et al. Preoperative and intraoperative predictors of
postoperative morbidity, poor graft function, and early rejection in 190 patients
undergoing liver transplantation. Arch Surg 136, 1177-1183 (2001).
174. Wakeling, H. G. et al. Intraoperative oesophageal Doppler guided fluid
management shortens postoperative hospital stay after major bowel surgery. Br J
Anaesth 95, 634-642 (2005).
175. Vincent, J. L. Issues in contemporary fluid management. Crit Care 4 Suppl 2, S1-
2 (2000).
176. Fiddian-Green, R. G. Splanchnic ischaemia and multiple organ failure in the
critically ill. Ann R Coll Surg Engl 70, 128-134 (1988).
177. Stevens, S. S. On the Theory of Scales of Measurement. Science 103, 677-680
(1946).
178. Reybrouck, T., Amery, A., Billiet, L., Fagard, R. & Stijns, H. Comparison of
cardiac output determined by a carbon dioxide-rebreathing and direct Fick method
at rest and during exercise. Clin Sci Mol Med 55, 445-452 (1978).
179. Bland, J. M. & Altman, D. G. Statistical methods for assessing agreement between
two methods of clinical measurement. Lancet 1, 307-310 (1986).
180. Kaplan, R. M., Bush, J. W. & Berry, C. C. Health status: types of validity and the
index of well-being. Health Serv Res 11, 478-507 (1976).
181. Tugwell, P., Judd, M. G., Fries, J. F., Singh, G. & Wells, G. A. Powering our way
to the elusive side effect: a composite outcome 'basket' of predefined designated
endpoints in each organ system should be included in all controlled trials. J Clin
Epidemiol 58, 785-790 (2005).
182. Streiner, D. L. & Norman, G. R. Health Measurement Scales (Oxford University
Press, Oxford, 2003).
190
183. Fava, G. A. & Belaise, C. A discussion on the role of clinimetrics and the
misleading effects of psychometric theory. J Clin Epidemiol 58, 753-756 (2005).
184. Feinstein, A. R. T. Duckett Jones Memorial Lecture. The Jones criteria and the
challenges of clinimetrics. Circulation 66, 1-5 (1982).
185. Feinstein, A. R. Clinimetrics. (Yale University Press, New Haven, CT, 1987).
186. Nierenberg, A. A. & Sonino, N. From clinical observations to clinimetrics: a
tribute to Alvan R. Feinstein, MD. Psychother Psychosom 73, 131-133 (2004).
187. Feinstein, A. R. Multi-item "instruments" vs Virginia Apgar's
principles of clinimetrics. Arch Intern Med 159, 125-128 (1999).
188. A proposal for a new method of evaluation of the newborn infant. Curr Res
Anesth Analg 32, 260-267 (1953).
189. Bennett, J. A., Riegel, B., Bittner, V. & Nichols, J. Validity and reliability of the
NYHA classes for measuring research outcomes in patients with cardiac disease.
Heart Lung 31, 262-270 (2002).
190. Jennett, B. & Teasdale, G. Aspects of coma after severe head injury. Lancet 1,
878-881 (1977).
191. Fayers, P. M., Hand, D. J., Bjordal, K. & Groenvold, M. Causal indicators in
quality of life research. Qual Life Res 6, 393-406 (1997).
192. Streiner, D. L. Clinimetrics vs. psychometrics: an unnecessary distinction. J Clin
Epidemiol 56, 1142-5; discussion 1146-9 (2003).
193. de Vet, H. C., Terwee, C. B. & Bouter, L. M. Current challenges in clinimetrics. J
Clin Epidemiol 56, 1137-1141 (2003).
194. Emmelkamp, P. M. The additional value of clinimetrics needs to be established
rather than assumed. Psychother Psychosom 73, 142-144 (2004).
195. Marx, R. G., Bombardier, C., Hogg-Johnson, S. & Wright, J. G. Clinimetric and
psychometric strategies for development of a health measurement scale. J Clin
Epidemiol 52, 105-111 (1999).
196. Upton, G. & Cook, I. Oxford dictionary of statistics (Oxford University Press,
Oxford, 2002).
197. de Vet, H. C., Terwee, C. B., Knol, D. L. & Bouter, L. M. When to use agreement
versus reliability measures. J Clin Epidemiol 59, 1033-1039 (2006).
198. Rousson, V., Gasser, T. & Seifert, B. Assessing intrarater, interrater and test-retest
reliability of continuous measurements. Stat Med 21, 3431-3446 (2002).
199. Cohen, J. A coefficient of agreement for nominal scales. Educational and
Psychological Measurement 20, 37-46 (1960).
191
200. Fleiss, J. L. Measuring nominal scale agreement among many raters.
Psychological Bulletin 76, 378-382 (1971).
201. Cronbach, L. J. Coefficient alpha and the internal structure of tests. Psychometrika
16, 297-334 (1951).
202. Kuder, G. F. & Richarson, M. W. The theory of the estimation of test reliability.
Psychometrika 2, 151-160 (1937).
203. Fujii, K. et al. Clinical evaluation of lymph node metastasis in gastric cancer
defined by the fifth edition of the TNM classification in comparison with the
Japanese system. Br J Surg 86, 685-689 (1999).
204. Boyd, A. D., Tremblay, R. E., Spencer, F. C. & Bahnson, H. T. Estimation of
cardiac output soon after intracardiac surgery with cardiopulmonary bypass. Ann
Surg 150, 613-626 (1959).
205. Clowes, G. H. J. & Del Guercio, L. R. Circulatory response to trauma of surgical
operations. Metabolism 9, 67-81 (1960).
206. Shoemaker, W. C. Cardiorespiratory patterns of surviving and nonsurviving
postoperative patients. Surg Gynecol Obstet 134, 810-814 (1972).
207. Shoemaker, W. C., Montgomery, E. S., Kaplan, E. & Elwyn, D. H. Physiologic
patterns in surviving and nonsurviving shock patients. Use of sequential
cardiorespiratory variables in defining criteria for therapeutic goals and early
warning of death. Arch Surg 106, 630-636 (1973).
208. Shoemaker, W. C. & Czer, L. S. Evaluation of the biologic importance of various
hemodynamic and oxygen transport variables: which variables should be
monitored in postoperative shock? Crit Care Med 7, 424-431 (1979).
209. Shoemaker, W. C., Appel, P. L. & Kram, H. B. Hemodynamic and oxygen
transport responses in survivors and nonsurvivors of high-risk surgery. Crit Care
Med 21, 977-990 (1993).
210. Kusano, C. et al. Oxygen delivery as a factor in the development of fatal
postoperative complications after oesophagectomy. Br J Surg 84, 252-257 (1997).
211. Peerless, J. R., Alexander, J. J., Pinchak, A. C., Piotrowski, J. J. & Malangoni, M.
A. Oxygen delivery is an important predictor of outcome in patients with ruptured
abdominal aortic aneurysms. Ann Surg 227, 726-32; discussion 732-4 (1998).
212. Polonen, P., Hippelainen, M., Takala, R., Ruokonen, E. & Takala, J. Relationship
between intra- and postoperative oxygen transport and prolonged intensive care
after cardiac surgery: a prospective study. Acta Anaesthesiol Scand 41, 810-817
(1997).
192
213. Swan, H. J. et al. Catheterization of the heart in man with use of a flow-directed
balloon-tipped catheter. N Engl J Med 283, 447-451 (1970).
214. Ganz, W., Donoso, R., Marcus, H. S., Forrester, J. S. & Swan, H. J. A new
technique for measurement of cardiac output by thermodilution in man. Am J
Cardiol 27, 392-396 (1971).
215. Bland, R., Shoemaker, W. C. & Shabot, M. M. Physiologic monitoring goals for
the critically ill patient. Surg Gynecol Obstet 147, 833-841 (1978).
216. Boyd, O. & Bennett, E. D. Enhancement of perioperative tissue perfusion as a
therapeutic strategy for major surgery. New Horiz 4, 453-465 (1996).
217. Boyd, O. & Hayes, M. The oxygen trail: the goal. Br Med Bull 55, 125-139
(1999).
218. Forst, H. [Maximizing O2-transport in critical illness. A rational therapeutic
concept?]. Anaesthesist 46, 46-52 (1997).
219. Ivanov, R. I., Allen, J., Sandham, J. D. & Calvin, J. E. Pulmonary artery
catheterization: a narrative and systematic critique of randomized controlled trials
and recommendations for the future. New Horiz 5, 268-276 (1997).
220. Leibowitz, A. B. & Beilin, Y. Pulmonary artery catheters and outcome in the
perioperative period. New Horiz 5, 214-221 (1997).
221. Heyland, D. K., Cook, D. J., King, D., Kernerman, P. & Brun-Buisson, C.
Maximizing oxygen delivery in critically ill patients: a methodologic appraisal of
the evidence. Crit Care Med 24, 517-524 (1996).
222. Kern, J. W. & Shoemaker, W. C. Meta-analysis of hemodynamic optimization in
high-risk patients. Crit Care Med 30, 1686-1692 (2002).
223. Poeze, M., Greve, J. W. & Ramsay, G. Meta-analysis of hemodynamic
optimization: relationship to methodological quality. Crit Care 9, R771-9 (2005).
224. Medical Research Council (UK). A framework for development and evaluation of
RCTs for complex interventions to improve health. (2000).
http://www.mrc.ac.uk/Utilities/Documentrecord/index.htm?d=MRC003372
(accessed 30th November 2008).
225. Louis, T. A. Assessing, accommodating, and interpreting the influences of
heterogeneity. Environ Health Perspect 90, 215-222 (1991).
226. Grocott, M. P. W., Hamilton, M. A., Bennett, E. D., Harrison, D. & Rowan, K.
Perioperative increase in global blood flow to explicit defined goals and outcome
following surgery (protocol).
193
http://www.mrw.interscience.wiley.com/cochrane/clsysrev/articles/CD004082/fra
me.html (accessed 30th November 2008).
227. Gardner, M. J., Altman, D. G., Bryant, T. M., & Machin, D. Checklist for quality
of clinical trials. In: Statistics with Confidence (BMJ Books, London, 2000).
228. Alia, I. et al. A randomized and controlled trial of the effect of treatment aimed at
maximizing oxygen delivery in patients with severe sepsis or septic shock. Chest
115, 453-461 (1999).
229. Balogh, Z. et al. Supranormal trauma resuscitation causes more cases of
abdominal compartment syndrome. Arch Surg 138, 637-42; discussion 642-3
(2003).
230. Bishop, M. H. et al. Prospective, randomized trial of survivor values of cardiac
index, oxygen delivery, and oxygen consumption as resuscitation endpoints in
severe trauma. J Trauma 38, 780-787 (1995).
231. Blow, O., Magliore, L., Claridge, J. A., Butler, K. & Young, J. S. The golden hour
and the silver day: detection and correction of occult hypoperfusion within 24
hours improves outcome from major trauma. J Trauma 47, 964-969 (1999).
232. Chang, M. C., Meredith, J. W., Kincaid, E. H. & Miller, P. R. Maintaining
survivors' values of left ventricular power output during shock resuscitation: a
prospective pilot study. J Trauma 49, 26-33; discussion 34-7 (2000).
233. Durham, R. M., Neunaber, K., Mazuski, J. E., Shapiro, M. J. & Baue, A. E. The
use of oxygen consumption and delivery as endpoints for resuscitation in critically
ill patients. J Trauma 41, 32-9; discussion 39-40 (1996).
234. Flancbaum, L., Ziegler, D. W. & Choban, P. S. Preoperative intensive care unit
admission and hemodynamic monitoring in patients scheduled for major elective
noncardiac surgery: a retrospective review of 95 patients. J Cardiothorac Vasc
Anesth 12, 3-9 (1998).
235. Fleming, A. et al. Prospective trial of supranormal values as goals of resuscitation
in severe trauma. Arch Surg 127, 1175-9; discussion 1179-81 (1992).
236. Gattinoni, L. et al. A trial of goal-oriented hemodynamic therapy in critically ill
patients. SvO2 Collaborative Group. N Engl J Med 333, 1025-1032 (1995).
237. Gutierrez, G. et al. Gastric intramucosal pH as a therapeutic index of tissue
oxygenation in critically ill patients. Lancet 339, 195-199 (1992).
238. Hayes, M. A. et al. Elevation of systemic oxygen delivery in the treatment of
critically ill patients. N Engl J Med 330, 1717-1722 (1994).
194
239. Ivatury, R. R. et al. A prospective randomized study of end points of resuscitation
after major trauma: global oxygen transport indices versus organ-specific gastric
mucosal pH. J Am Coll Surg 183, 145-154 (1996).
240. Lobo, S. M. et al. Prospective, randomized trial comparing fluids and dobutamine
optimization of oxygen delivery in high-risk surgical patients
[ISRCTN42445141]. Crit Care 10, R72 (2006).
241. Miller, P. R., Meredith, J. W. & Chang, M. C. Randomized, prospective
comparison of increased preload versus inotropes in the resuscitation of trauma
patients: effects on cardiopulmonary function and visceral perfusion. J Trauma
44, 107-113 (1998).
242. Muller, M. et al. Effects of low-dose dopexamine on splanchnic oxygenation
during major abdominal surgery. Crit Care Med 27, 2389-2393 (1999).
243. Pargger, H., Hampl, K. F., Christen, P., Staender, S. & Scheidegger, D. Gastric
intramucosal pH-guided therapy in patients after elective repair of infrarenal
abdominal aneurysms: is it beneficial? Intensive Care Med 24, 769-776 (1998).
244. Rivers, E. et al. Early goal-directed therapy in the treatment of severe sepsis and
septic shock. N Engl J Med 345, 1368-1377 (2001).
245. Scalea, T. M. et al. Geriatric blunt multiple trauma: improved survival with early
invasive monitoring. J Trauma 30, 129-34; discussion 134-6 (1990).
246. Schilling, T. et al. Effects of dopexamine, dobutamine or dopamine on prolactin
and thyreotropin serum concentrations in high-risk surgical patients. Intensive
Care Med 30, 1127-1133 (2004).
247. Schultz, R. J., Whitfield, G. F., LaMura, J. J., Raciti, A. & Krishnamurthy, S. The
role of physiologic monitoring in patients with fractures of the hip. J Trauma 25,
309-316 (1985).
248. Stone, M. D., Wilson, R. J., Cross, J. & Williams, B. T. Effect of adding
dopexamine to intraoperative volume expansion in patients undergoing major
elective abdominal surgery. Br J Anaesth 91, 619-624 (2003).
249. Szakmany, T. et al. Effects of volumetric vs. pressure-guided fluid therapy on
postoperative inflammatory response: a prospective, randomized clinical trial.
Intensive Care Med 31, 656-663 (2005).
250. Takala, J., Meier-Hellmann, A., Eddleston, J., Hulstaert, P. & Sramek, V. Effect
of dopexamine on outcome after major abdominal surgery: a prospective,
randomized, controlled multicenter study. European Multicenter Study Group on
Dopexamine in Major Abdominal Surgery. Crit Care Med 28, 3417-3423 (2000).
195
251. Tuchschmidt, J., Fried, J., Astiz, M. & Rackow, E. Elevation of cardiac output and
oxygen delivery improves outcome in septic shock. Chest 102, 216-220 (1992).
252. Velmahos, G. C. et al. Endpoints of resuscitation of critically injured patients:
normal or supranormal? A prospective randomized trial. Ann Surg 232, 409-418
(2000).
253. Yu, M. et al. Effect of maximizing oxygen delivery on morbidity and mortality
rates in critically ill patients: a prospective, randomized, controlled study. Crit
Care Med 21, 830-838 (1993).
254. Yu, M. et al. Frequency of mortality and myocardial infarction during maximizing
oxygen delivery: a prospective, randomized trial. Crit Care Med 23, 1025-1032
(1995).
255. Yu, M. et al. Relationship of mortality to increasing oxygen delivery in patients
> or = 50 years of age: a prospective, randomized trial. Crit Care Med 26,
1011-1019 (1998).
256. Bender, J. S., Smith-Meek, M. A. & Jones, C. E. Routine pulmonary artery
catheterization does not reduce morbidity and mortality of elective vascular
surgery: results of a prospective, randomized trial. Ann Surg 226, 229-36;
discussion 236-7 (1997).
257. Berlauk, J. F. et al. Preoperative optimization of cardiovascular hemodynamics
improves outcome in peripheral vascular surgery. A prospective, randomized
clinical trial. Ann Surg 214, 289-97; discussion 298-9 (1991).
258. Bonazzi, M. et al. Impact of perioperative haemodynamic monitoring on cardiac
morbidity after major vascular surgery in low risk patients. A randomised pilot
trial. Eur J Vasc Endovasc Surg 23, 445-451 (2002).
259. Conway, D. H., Mayall, R., Abdul-Latif, M. S., Gilligan, S. & Tackaberry, C.
Randomised controlled trial investigating the influence of intravenous fluid
titration using oesophageal Doppler monitoring during bowel surgery. Anaesthesia
57, 845-849 (2002).
260. Gan, T. J. et al. Goal-directed intraoperative fluid administration reduces length of
hospital stay after major surgery. Anesthesiology 97, 820-826 (2002).
261. Jerez Gomez Coronado, V. et al. Haemodynamic optimization and morbimortality
after heart surgery. Medicina Intensiva 25, 297-302 (2001).
262. Lobo, S. M. et al. Effects of maximizing oxygen delivery on morbidity and
mortality in high-risk surgical patients. Crit Care Med 28, 3396-3404 (2000).
196
263. McKendry, M. et al. Randomised controlled trial assessing the impact of a nurse
delivered, flow monitored protocol for optimisation of circulatory status after
cardiac surgery. BMJ 329, 258 (2004).
264. Mythen, M. G. & Webb, A. R. Perioperative plasma volume expansion reduces
the incidence of gut mucosal hypoperfusion during cardiac surgery. Arch Surg
130, 423-429 (1995).
265. Pearse, R. et al. Early goal-directed therapy after major surgery reduces
complications and duration of hospital stay. A randomised, controlled trial
[ISRCTN38797445]. Crit Care 9, R687-93 (2005).
266. Sandham, J. D. et al. A randomized, controlled trial of the use of pulmonary-artery
catheters in high-risk surgical patients. N Engl J Med 348, 5-14 (2003).
267. Sinclair, S., James, S. & Singer, M. Intraoperative intravascular volume
optimisation and length of hospital stay after repair of proximal femoral fracture:
randomised controlled trial. BMJ 315, 909-912 (1997).
268. Ueno, S. et al. Response of patients with cirrhosis who have undergone partial
hepatectomy to treatment aimed at achieving supranormal oxygen delivery and
consumption. Surgery 123, 278-286 (1998).
269. Valentine, R. J. et al. Effectiveness of pulmonary artery catheters in aortic
surgery: a randomized trial. J Vasc Surg 27, 203-11; discussion 211-2 (1998).
270. Venn, R. et al. Randomized controlled trial to investigate influence of the fluid
challenge on duration of hospital stay and perioperative morbidity in patients with
hip fractures. Br J Anaesth 88, 65-71 (2002).
271. Ziegler, D. W., Wright, J. G., Choban, P. S. & Flancbaum, L. A prospective
randomized trial of preoperative "optimization" of cardiac function in patients
undergoing elective peripheral vascular surgery. Surgery 122, 584-592 (1997).
272. Vincent, J. L. et al. The SOFA (Sepsis-related Organ Failure Assessment) score to
describe organ dysfunction/failure. On behalf of the Working Group on Sepsis-
Related Problems of the European Society of Intensive Care Medicine. Intensive
Care Med 22, 707-710 (1996).
273. Knaus, W. A., Draper, E. A., Wagner, D. P. & Zimmerman, J. E. Prognosis in
acute organ-system failure. Ann Surg 202, 685-693 (1985).
274. Aaronson, N. K. et al. The European Organization for Research and Treatment of
Cancer QLQ-C30: a quality-of-life instrument for use in international clinical
trials in oncology. J Natl Cancer Inst 85, 365-376 (1993).
197
275. Groenvold, M., Klee, M. C., Sprangers, M. A. & Aaronson, N. K. Validation of
the EORTC QLQ-C30 quality of life questionnaire through combined qualitative
and quantitative assessment of patient-observer agreement. J Clin Epidemiol 50,
441-450 (1997).
276. Sprangers, M. A., te Velde, A. & Aaronson, N. K. The construction and testing of
the EORTC colorectal cancer-specific quality of life questionnaire module (QLQ-
CR38). European Organization for Research and Treatment of Cancer Study
Group on Quality of Life. Eur J Cancer 35, 238-247 (1999).
277. Pildal, J. et al. Impact of allocation concealment on conclusions drawn from meta-
analyses of randomized trials. Int J Epidemiol 36, 847-857 (2007).
278. Kjaergard, L. L., Villumsen, J. & Gluud, C. Reported methodologic quality and
discrepancies between large and small randomized trials in meta-analyses. Ann
Intern Med 135, 982-989 (2001).
279. Moher, D. et al. Does quality of reports of randomised trials affect estimates of
intervention efficacy reported in meta-analyses? Lancet 352, 609-613 (1998).
280. Langhan, J., Thompson, E. & Rowan, K. Randomised controlled trials from the
critical care literature: identification and assessment of quality. Clinical Intensive
Care 13, 73-83 (2002).
281. Begg, C. et al. Improving the quality of reporting of randomized controlled trials.
The CONSORT statement. JAMA 276, 637-639 (1996).
282. Moher, D., Schulz, K. F., Altman, D. G. & CONSORT. The CONSORT
statement: revised recommendations for improving the quality of reports of
parallel group randomized trials. BMC medical research methodology 1, 2 (2001).
283. CONSORT Endorsers: Journals. http://www.consort-
statement.org/index.aspx?o=1096 (accessed 30th November 2008).
284. Balasubramanian, S. P. et al. Standards of reporting of randomized controlled
trials in general surgery: can we do better? Ann Surg 244, 663-667 (2006).
285. Ioannidis, J. P. et al. Better reporting of harms in randomized trials: an extension
of the CONSORT statement. Ann Intern Med 141, 781-788 (2004).
286. Tiruvoipati, R., Balasubramanian, S. P., Atturu, G., Peek, G. J. & Elbourne, D.
Improving the quality of reporting randomized controlled trials in cardiothoracic
surgery: the way forward. J Thorac Cardiovasc Surg 132, 233-240 (2006).
287. Jadad, A. R. et al. Assessing the quality of reports of randomized clinical trials: is
blinding necessary? Control Clin Trials 17, 1-12 (1996).
198
288. Nagurney, J. T. et al. The accuracy and completeness of data collected by
prospective and retrospective methods. Acad Emerg Med 12, 884-895 (2005).
289. Agha, R., Cooper, D. & Muir, G. The reporting quality of randomised controlled
trials in surgery: a systematic review. Int J Surg 5, 413-422 (2007).
290. Mills, E. J., Wu, P., Gagnier, J. & Devereaux, P. J. The quality of randomized trial
reporting in leading medical journals since the revised CONSORT statement.
Contemp Clin Trials 26, 480-487 (2005).
291. Moher, D., Schulz, K. F. & Altman, D. G. The CONSORT statement: revised
recommendations for improving the quality of reports of parallel-group
randomized trials. Ann Intern Med 134, 657-662 (2001).
292. Altman, D. G. et al. The revised CONSORT statement for reporting randomized
trials: explanation and elaboration. Ann Intern Med 134, 663-694 (2001).
293. Hollis, S. & Campbell, F. What is meant by intention to treat analysis? Survey of
published randomised controlled trials. BMJ 319, 670-674 (1999).
294. Mills, E., Wu, P., Gagnier, J., Heels-Ansdell, D. & Montori, V. M. An analysis of
general medical and specialist journals that endorse CONSORT found that
reporting was not enforced consistently. J Clin Epidemiol 58, 662-667 (2005).
295. Vogt, A., Stieger, D. S., Theurillat, C. & Curatolo, M. Single-injection thoracic
paravertebral block for postoperative pain treatment after thoracoscopic surgery.
Br J Anaesth 95, 816-821 (2005).
296. de Beer Jde, V. et al. Efficacy and safety of controlled-release oxycodone and
standard therapies for postoperative pain after knee or hip replacement. Can J
Surg 48, 277-283 (2005).
297. Kizilkaya, M., Yildirim, O. S., Ezirmik, N., Kursad, H. & Karsan, O.
Comparisons of analgesic effects of different doses of morphine and morphine
plus methylprednisolone after knee surgery. Eur J Anaesthesiol 22, 603-608
(2005).
298. McMahon, A. J. et al. Laparoscopic and minilaparotomy cholecystectomy: a
randomized trial comparing postoperative pain and pulmonary function. Surgery
115, 533-539 (1994).
299. Motamed, C., Bouaziz, H., Franco, D. & Benhamou, D. Analgesic effect of low-
dose intrathecal morphine and bupivacaine in laparoscopic cholecystectomy.
Anaesthesia 55, 118-124 (2000).
300. Chung, F. & Mezei, G. Factors contributing to a prolonged stay after ambulatory
surgery. Anesth Analg 89, 1352-1359 (1999).
199
301. Mythen, M. G. & Webb, A. R. Intra-operative gut mucosal hypoperfusion is
associated with increased post-operative complications and cost. Intensive Care
Med 20, 99-104 (1994).
302. Lang, M., Niskanen, M., Miettinen, P., Alhava, E. & Takala, J. Outcome and
resource utilization in gastroenterological surgery. Br J Surg 88, 1006-1014
(2001).
303. Collins, T. C., Daley, J., Henderson, W. H. & Khuri, S. F. Risk factors for
prolonged length of stay after major elective surgery. Ann Surg 230, 251-259
(1999).
304. Mythen, M. G. Postoperative gastrointestinal tract dysfunction. Anesth Analg 100,
196-204 (2005).
305. Coello, R. et al. Adverse impact of surgical site infections in English hospitals. J
Hosp Infect 60, 93-103 (2005).
306. Askarian, M. & Gooran, N. R. National nosocomial infection surveillance system-
based study in Iran: additional hospital stay attributable to nosocomial infections.
Am J Infect Control 31, 465-468 (2003).
307. Merle, V. et al. Assessment of prolonged hospital stay attributable to surgical site
infections using appropriateness evaluation protocol. Am J Infect Control 28, 109-
115 (2000).
308. Kirkland, K. B., Briggs, J. P., Trivette, S. L., Wilkinson, W. E. & Sexton, D. J.
The impact of surgical-site infections in the 1990s: attributable mortality, excess
length of hospitalization, and extra costs. Infect Control Hosp Epidemiol 20, 725-
730 (1999).
309. Smith, R. L. et al. Wound infection after elective colorectal resection. Ann Surg
239, 599-605; discussion 605-7 (2004).
310. Zeldin, R. A. Assessing cardiac risk in patients who undergo noncardiac surgical
procedures. Can J Surg 27, 402-404 (1984).
311. Larsen, S. F. et al. Prediction of cardiac risk in non-cardiac surgery. Eur Heart J 8,
179-185 (1987).
312. Ashton, C. M. et al. The incidence of perioperative myocardial infarction in men
undergoing noncardiac surgery. Ann Intern Med 118, 504-510 (1993).
313. Higham, H., Sear, J. W., Neill, F., Sear, Y. M. & Foex, P. Peri-operative silent
myocardial ischaemia and long-term adverse outcomes in non-cardiac surgical
patients. Anaesthesia 56, 630-637 (2001).
200
314. Oscarsson, A. et al. Troponin T-values provide long-term prognosis in elderly
patients undergoing non-cardiac surgery. Acta Anaesthesiol Scand 48, 1071-1079
(2004).
315. Angelillo, I. F. et al. Appropriateness of hospital utilisation in Italy. Public Health
114, 9-14 (2000).
316. Bare, M. L., Prat, A., Lledo, L., Asenjo, M. A. & Salleras, L. Appropriateness of
admissions and hospitalization days in an acute-care teaching hospital. Rev
Epidemiol Sante Publique 43, 328-336 (1995).
317. Fellin, G. et al. Appropriateness of hospital use: an overview of Italian studies. Int
J Qual Health Care 7, 219-225 (1995).
318. Santos-Eggimann, B., Paccaud, F. & Blanc, T. Medical appropriateness of
hospital utilization: an overview of the Swiss experience. Int J Qual Health Care
7, 227-232 (1995).
319. Gertman, P. M. & Restuccia, J. D. The appropriateness evaluation protocol: a
technique for assessing unnecessary days of hospital care. Med Care 19, 855-871
(1981).
320. Harvey, I., Jenkins, R. & Llewellyn, L. Enhancing appropriateness of acute bed
use: role of the patient hotel. J Epidemiol Community Health 47, 368-372 (1993).
321. Restuccia, J. D. & Gertman, P. A comparative analysis of appropriateness of
hospital use. Health Aff (Millwood) 3, 130-138 (1984).
322. Restuccia, J. D. et al. Factors affecting appropriateness of hospital use in
Massachusetts. Health Care Financ Rev 8, 47-54 (1986).
323. Alijani, A. et al. Instrument for objective assessment of appropriateness of
surgical bed occupancy: validation study. BMJ 326, 1243-1244 (2003).
324. Dawwas, M. F., Gimson, A. E., Lewsey, J. D., Copley, L. P. & van der Meulen, J.
H. Survival after liver transplantation in the United Kingdom and Ireland
compared with the United States. Gut 56, 1606-1613 (2007).
325. Cohen, J. A coefficient of agreement for nominal scales. Psychol Meas 20, 37-46
(1960).
326. Landis, J. R. & Koch, G. G. The measurement of observer agreement for
categorical data. Biometrics 33, 159-174 (1977).
327. Streiner, D. L. & Norman, G. R. in Health Measurement Scales: a practical guide
to their development and use. 61-79 (Oxford University Press, Oxford, 2003).
328. Haynes, S. R. & Lawler, P. G. An assessment of the consistency of ASA physical
status classification allocation. Anaesthesia 50, 195-199 (1995).

201
329. Grocott, M. P., Levett, D. Z., Matejowsky, C., Emberton, M. & Mythen, M. G.
ASA scores in the preoperative patient: feedback to clinicians can improve data
quality. J Eval Clin Pract 13(2), 318-319 (2007).
330. Kehlet, H. Fast-track colorectal surgery. Lancet 371, 791-793 (2008).
331. Wright, J. G. & Feinstein, A. R. A comparative contrast of clinimetric and
psychometric methods for constructing indexes and rating scales. J Clin Epidemiol
45, 1201-1218 (1992).
202
Appendix 1: Published manuscripts arising from
this MD thesis
1. Grocott MP, Browne JP, Van der Meulen J et al. The Postoperative Morbidity
Survey was validated and used to describe morbidity after major surgery. Journal
of Clinical Epidemiology. 2007;60:919-928.
2. Sinha S, Sinha S, Ashby E, Jayaram R, Grocott MP. Quality of reporting in
randomized trials published in high-quality surgical journals. Journal of the
American College of Surgeons. 2009;209:565-571.


![[Free Scores.com] Arban Jean Baptiste Carnevale Venezia Trascrzione Concerto Per Pianoforte Organo Tromba 19679](https://img.pdfslide.us/doc/110x75/55721325497959fc0b91b312/free-scorescom-arban-jean-baptiste-carnevale-venezia-trascrzione-concerto.jpg)